Mathematical tables in Ptolemy s Almagestindividual.utoronto.ca/acephalous/Sidoli_2014b.pdf ·...
25
Author's personal copy Available online at www.sciencedirect.com ScienceDirect Historia Mathematica 41 (2014) 13–37 www.elsevier.com/locate/yhmat Mathematical tables in Ptolemy’s Almagest Nathan Sidoli Waseda University, School for International Liberal Studies, 1-6-1 Nishi-Waseda, Shinjuku, Tokyo, Japan Available online 28 January 2014 Abstract This paper is a discussion of Ptolemy’s use of mathematical tables in the Almagest. By focusing on Ptolemy’s mathematical practice and terminology, I argue that Ptolemy used tables as part of an organized group of units of text, which I call the table nexus. In the context of this deductive structure, tables function in the Almagest in much the same way as theorems in a canonical work, such as the Elements, both as means of presenting acquired knowledge and as tools for producing further knowledge. © 2013 Published by Elsevier Inc. MSC: 01A20 Keywords: Ptolemy; Mathematical tables; Almagest; Greek mathematics; Greek astronomy; Mathematical functions 1. Introduction By the time Claudius Ptolemy (early to mid-2nd CE) composed his works, the production and use of tables was an accepted part of Greek mathematical practice. Although Ptolemy makes certain programmatic statements about how he thinks tables ought to be presented and used, it is difficult to know if his articulation of best practices with regard to tabular methods was original or had its origin in the work of his predecessors, such as Hipparchus (ca. mid-2nd BCE) or Menelaus (ca. turn of 2nd CE). It does, however, seem clear that tabular methods entered Greek mathematical practice from Babylonian sources, particularly Babylonian mathematical astronomy, sometime during the mid to late Hellenistic period. When we look at just those sorts of works from the early Hellenistic period where we might expect to find tables — such as the proto-trigonometric, astronomical Sizes and Distances of the Sun and Moon or Sand Calculator by Aristarchus (ca. early-3rd BCE) and Archimedes (280s–212), respectively — we find no evidence for tabular mathematics (Berggren and Sidoli, 2007; Van Brummelen, 2009, 20–32). Although there is some evidence for tabular displays and formats being used in harmonics and Pythagorean number theory — as found in the work of Nicomachus and Theon of Smyrna (both ca. early-2nd CE) — these traditions do not seem to have involved the use of tabular elements to encode mathematical relationships. Again, there was a long tradition of monumental tables, such as parapegmata and other inscriptions, which E-mail address: [email protected]. 0315-0860/$ – see front matter © 2013 Published by Elsevier Inc. http://dx.doi.org/10.1016/j.hm.2013.10.004
Transcript of Mathematical tables in Ptolemy s Almagestindividual.utoronto.ca/acephalous/Sidoli_2014b.pdf ·...

Author's personal copy
Available online at www.sciencedirect.com
ScienceDirect
Historia Mathematica 41 (2014) 13–37www.elsevier.com/locate/yhmat
Mathematical tables in Ptolemy’s Almagest
Nathan Sidoli
Waseda University, School for International Liberal Studies, 1-6-1 Nishi-Waseda, Shinjuku, Tokyo, Japan
Available online 28 January 2014
Abstract
This paper is a discussion of Ptolemy’s use of mathematical tables in the Almagest. By focusing on Ptolemy’s mathematicalpractice and terminology, I argue that Ptolemy used tables as part of an organized group of units of text, which I call the tablenexus. In the context of this deductive structure, tables function in the Almagest in much the same way as theorems in a canonicalwork, such as the Elements, both as means of presenting acquired knowledge and as tools for producing further knowledge.© 2013 Published by Elsevier Inc.
MSC: 01A20
Keywords: Ptolemy; Mathematical tables; Almagest; Greek mathematics; Greek astronomy; Mathematical functions
1. Introduction
By the time Claudius Ptolemy (early to mid-2nd CE) composed his works, the production and use oftables was an accepted part of Greek mathematical practice. Although Ptolemy makes certain programmaticstatements about how he thinks tables ought to be presented and used, it is difficult to know if his articulationof best practices with regard to tabular methods was original or had its origin in the work of his predecessors,such as Hipparchus (ca. mid-2nd BCE) or Menelaus (ca. turn of 2nd CE). It does, however, seem clear thattabular methods entered Greek mathematical practice from Babylonian sources, particularly Babylonianmathematical astronomy, sometime during the mid to late Hellenistic period.
When we look at just those sorts of works from the early Hellenistic period where we might expect tofind tables — such as the proto-trigonometric, astronomical Sizes and Distances of the Sun and Moon orSand Calculator by Aristarchus (ca. early-3rd BCE) and Archimedes (280s–212), respectively — we findno evidence for tabular mathematics (Berggren and Sidoli, 2007; Van Brummelen, 2009, 20–32). Althoughthere is some evidence for tabular displays and formats being used in harmonics and Pythagorean numbertheory — as found in the work of Nicomachus and Theon of Smyrna (both ca. early-2nd CE) — thesetraditions do not seem to have involved the use of tabular elements to encode mathematical relationships.Again, there was a long tradition of monumental tables, such as parapegmata and other inscriptions, which
E-mail address: [email protected].
0315-0860/$ – see front matter © 2013 Published by Elsevier Inc.http://dx.doi.org/10.1016/j.hm.2013.10.004

Author's personal copy
14 N. Sidoli / Historia Mathematica 41 (2014) 13–37
may have contributed to Greek interest in Babylonian astronomical tables, but these were either publicresources or votive inscriptions and were not meant to be used in mathematical practice (Jones, 2006;Lehoux, 2007). By the Roman Imperial period, however, there was a wealth of numerical tables for astro-nomical and astrological purposes in circulation in Greco-Roman Egypt, including direct translations ofsubstantial parts of Babylonian mathematical astronomy (Jones, 1999a, 1999b).
This is the context in which Ptolemy produced his amalgam of the deductive approach of classicalgeometry and the algorithmic procedures of tabular astronomy. The extent to which Ptolemy was originalin this is uncertain, but it is clear is that his particular articulation of this strategy had a lasting effect onmathematical practice. This paper is an investigation of Ptolemy’s approach to tables as a part of Greekmathematical practice.
1.1. Tables in Ptolemy’s works
The presence of tables is a characteristic feature of nearly the entire Ptolemaic corpus. Some works, suchas the Geography and the Handy Tables, consist largely of tables. In others, such as the Harmonics or theOptics, tables are less frequent, but still play an important role in the development and presentation of thethought.
Ptolemy’s treatises have two basic types of tables. The first is a tabular presentation of non-mathematicalinformation. Examples of this type are the tables in the Geography or the star catalog in the Almagest.These are presented in a tabular format in our sources, and the tabulation associates numbers with items ina set, such as stars or geographical features. The tables, however, do not represent mathematical relationsand the method of associating the numbers with the items is, at least in principle, empirical. These sorts oftables will not be discussed in this paper.
The second type of table conveys mathematical information, and this mathematical relationship is thecore idea that is presented in a tabular format. Indeed, although it would be cumbersome, this kind ofmathematical table could simply be stated as a well-ordered list. For example, the first time Ptolemy givesthe rising times for 10◦ arcs of the ecliptic for the terrestrial latitude of the equator, Almagest I.16, he givesa well-ordered list in normal prose (Heiberg, 1898–1903, I, 85).1 The second time he presents this sameinformation, however, it is found as part of the first column in the table of rising times, Almagest II.8. ForPtolemy, the visual arrangement is not essential to presenting this mathematical relationship on its own,but later becomes important for comparing this relationship to other, geometrically related relationships.Ptolemy’s mathematical tables are, in principle, determined by mathematical criteria, and the arrangementof the elements in a tabular layout is meant to convey specific mathematical information, which must beunderstood in context. We can call these mathematical tables. The subject matter of this paper is Ptolemy’spractice with regard to the mathematical tables in the Almagest.
1.2. Tables and functions
As O. Pedersen (1974, 32–33) first pointed out, although Ptolemy claims, at the beginning of Book III,that he has presented all of the mathematical prerequisites for reading the Almagest, his ideas about tablesand their role as mathematical tools is never explicitly discussed, but must be drawn from an investigationof his practices. Indeed, as Pedersen went on to show, Ptolemy used tables in systematic ways that canbe related to various aspects of the modern idea of a function. In this section, I expand on Pedersen’sdiscussion, introducing my own terminology and attempting to distinguish between concept and practice(Pedersen 1974, 2010, 78–91).
1 In his translation, Toomer (1984, 74) presents this list in a quasi-tabular format, which is not found in the manuscripts.

Author's personal copy
N. Sidoli / Historia Mathematica 41 (2014) 13–37 15
Although it is important to note that Ptolemy never explicitly introduces the ideas presented in thissection, I will argue that his methodology in laying out and using tables, as well as his naming conventions,indicates that he had operational concepts similar to those I will discuss here. Hence, although this sectionintroduces a number of modern categories that do not always correspond directly to Ptolemy’s categories,these should be understood as abbreviations for a collection of consistently applied practices. At any rate,the terminology introduced here will help us discuss the various ways in which Ptolemy used tables.
One of our fundamental ideas about functions is that they serve to associate, or map, the members ofone set of numbers individually with the members of another set of numbers.2 Functions in this sense areclearly present in Ptolemy’s works. Indeed, the most basic type of functional relationship that Ptolemy’smathematical tables convey is that of a correspondence of the members of one set of numbers to membersof another. Many of Ptolemy’s mathematical tables have the basic form
a1 b1a2 b2a3 b3. . . . . .
an bn
in which a set of numbers {a1, a2, a3, . . . , an} is mapped, individually, to another set of numbers{b1, b2, b3, . . . , bn}. I will call this aspect of Ptolemy’s use of tables a relational function.
In a number of key cases, this mapping is a one-to-one correspondence, such that the table represents apair of inverse functions, and one can enter into either column to determine a value from the other column.In such cases, both the computational use and labeling of the table shows us that the table is understood asa pair of inverse functions. For example, the chord table, Almagest I.11, which has the basic structure ofthe table above but in which the two columns are labeled “arcs” and “lines,”3 is used as follows:
α1 Crd(α1)
. . . . . .αn Crd(αn)
Ang(x1) x1. . . . . .
Ang(xn) xn
In other words, one can enter into either column as argument, resulting in a value in the other column,understood as dependent on the value of the argument.
Another core idea involved in functions is that each member of the domain is associated with a singlemember of the codomain, where the inverse is not necessarily the case. In some fields, this is developed withthe idea of a simple graph, in which ordinates drawn to the x-axis pass through the graph only once, whereasordinates drawn to the y-axis are not so constrained. Graphs of this kind, of course, are not necessarily pairsof inverse functions and we must have some convention to distinguish between the argument of the functionand its result. For simple graphs, the conventions regarding the x- and y-axes serve this purpose. Ptolemy’snaming practices indicate that he clearly understood the difference between these two types of relationalfunctions. In those tables that produce inverse functions, the two columns are explicitly labeled, and onecan enter the table in either column. In tables that represent a simple graph such as Almagest III.6, however,the domain is labeled “numbers” or “common numbers,” meaning something like argument, and indicating
2 Pedersen (1974, 36) called this conception of a function “a general relation associating the elements of one set of numbers . . .
with the elements of another set.”3 There is also a column for interpolation labeled “sixtieths,” but that is irrelevant to my point here.

Author's personal copy
16 N. Sidoli / Historia Mathematica 41 (2014) 13–37
Figure 1. Graphical representation of the table of solar anomaly, Almagest III.6. In the table, only one set of absolute values isgiven, 0–180 and 360–180, which must be understood as either additive or subtractive corrections.
that one only enters the table through this column.4 The “numbers” are always set down in the leftmostcolumn and serve to relate the irregular changes of the tabulated functions to the regular progression of the360◦ of a circle. That is, the “numbers” act as a conventional, and regular, domain against which we canclearly see how the tabulated function changes. In this sense, as I will argue at length below, Ptolemy’stable play a similar role as a modern graph.
If we compare Figure 1 with Table 1, we can see how the table of solar anomaly, Almagest III.6, acts asa kind of graph. Because the function is symmetrical about 180◦ for positive and negative values, Ptolemyonly tabulates half of the graph and points out, in the algorithm that follows the table, that the correc-tions are subtractive when the argument is between 0◦ and 180◦, and additive when it is between 180◦ and360◦. Nevertheless, by looking at the tabulated values in the two columns, we can discern the fundamentalcharacteristics of the function: it is perfectly symmetrical around 180◦, it has a maximum near 93◦ aroundwhich it is nearly symmetrical, and its rate of change must be slightly faster towards the perigee, 180◦,than the apogee, 0◦ or 360◦.5 Although we might prefer to convey this kind of quantitative informationwith a graph, Ptolemy’s procedure was to design his tables so as to reveal such aspects of the mathemat-ical functions with which he worked. I will call this aspect of Ptolemy’s practice with regard to tables arepresentational function.
Finally, one of the most straightforward ways in which we use the term function is to describe someexplicit set of rules that takes as input some numerical value, and, for each input, unambiguously outputsanother numerical value. For example, on a computer, we can simply define a set of rules for associatingan input value with an output value. It is clear that the algorithms that Ptolemy gives for working with histables are functions in this sense.6 Following each table he gives some clearly stated rule that allows us toconvert a given number into another unique number. Although Ptolemy never proves that his tables functionin this way, they are designed and labeled such that the argument column never contains more than a singleoccurrence of each member of the domain. Hence, if we bear in mind that the following symbols representan explicit algorithm, or program, Ptolemy works with functions of the following forms:
f (x), f (x, y), f (x, y, z).
4 The fact that the tables of mean motion, Almagest III.2, IV.4, IX.4, do not have this labeling, even though they can onlybe entered through the time column, indicates that Ptolemy thought of these tables as mathematically different from tables thatrepresent changing functions. Indeed, the tables of mean motion do not tabulate a mathematically interesting function, but simplyallow us to find mean motions through a simpler series of arithmetical operations than is possible from the mean motion stated asa rate.5 Ptolemy himself points out that he will include more entries in the table around perigee than around apogee because of this
slight difference in the rate of change (see note 22, below).6 As Pedersen (1974, 35) says, Ptolemy’s algorithms “may be called ‘programmes,’ similar in many respects to the programmes
fed into a modern computer.”

Author's personal copy
N. Sidoli / Historia Mathematica 41 (2014) 13–37 17
Although most of the functions in Ptolemy’s works are functions of one variable, he also works withfunctions of two and three variables. I will call this aspect of Ptolemy’s use of tables a computationalfunction.
Although some readers may still be unconvinced that such modern concepts can be fruitfully appliedto Ptolemy’s writings, the bulk of this paper will be devoted to showing that Ptolemy worked with tablessystematically so as to produce a type of tacit mathematical knowledge of such functional relations. Indiscussing the details of Ptolemy’s tabular practices, below, I hope to show that although Ptolemy doesnot discuss these ideas explicitly, he understood the nature of mathematical tables in ways that can belegitimately summarized with such terminology.
The usual interpretation of Ptolemy’s mathematical tables is that they are simply computational tools andare not integral to the presentation of the theory. Under this view, the Handy Tables have been construedas a later development in Ptolemy’s thinking about tabular methods and all the changes he introduced havebeen understood as improvements. It is also possible, however, that Ptolemy thought of the two works asdeveloping tabular methods towards different ends: the Almagest towards the articulation of a completetheory, and the Handy Tables towards supplying the needs of practical computation. This paper will arguethat Ptolemy designed the mathematical tables in the Almagest so as to play a number of roles, of whichcomputation was just one.
2. Tables in the Almagest
The Almagest is a systematic, theoretical treatise. It is a mathematical exposition of an ideal mathematicalsubject, the motion of the heavenly bodies, which Ptolemy viewed as both rational and containing to a fairextent the “harmonic faculty” (ἡ ἁρμονικὴ δύναμις).7 The presentation is essentially a single argument,in which earlier sections provide necessary tools for the sections that follow. The goal of the Almagest isto construct moving, geometric models that are used to describe the apparent phenomena of the celestialbodies as reducible to motions that are both circular and have a regular angular velocity about some point.In Almagest III.1, Ptolemy tells us that the goal of the mathematician,8 which is to show how the apparentmotions of the celestial bodies are made up of regular circular motions, is best accomplished by the types oftables he will use, which separate mean motions from corrections; that is, the regular from the anomalous(Heiberg, 1898–1903, I, 202).9 Then, before he sets out the solar model, which is the first that describes ananomalous motion, he states his general assumption that the celestial bodies move in their proper motionswith regular angular velocities.10
As is suggested in the Almagest, and made obvious in his Planetary Hypotheses, these models are meantto be a reflection of the physical reality of the heavens, even if they function very differently from the objects
7 As he states in Harmonics III.3, Ptolemy regarded astronomy and harmonics as the highest branches of mathematics, for whichgeometry and arithmetic acted as “indisputable instruments” (Düring, 1930, 91–94). In III.4, he goes on to state that the harmonicfaculty is found in all things that are self-moving but especially in things that have a more rational nature, such as human souls andheavenly bodies.8 Ptolemy’s categories of “mathematics” and “mathematician” were much broader than ours. Most importantly, he regarded
mathematics as the study of rational objects, in which the harmonic faculty is revealed, such as celestial bodies and human souls,which are apprehended through the rational senses of sight and hearing. See Feke and Jones (2010), Bernard (2010, 502–512), andLehoux (2012, 195–198).9 This text is translated on page 20, below.
10 Ptolemy is very careful in his expression of this, see Almagest III.3 (Heiberg, 1898–1903, I, 216). It should be pointed outthat Ptolemy expresses this as a principle that has to do with the mathematical properties of circular motion, and there is nothingincompatible between regular angular velocity and the irregular motions of the spheres in which the celestial bodies are carried, asin the case of the lunar or planetary models.
Author's personal copy
18 N. Sidoli / Historia Mathematica 41 (2014) 13–37
we experience on the earth.11 As is clear in a number of passages, the tables in the Almagest are meant toexhibit this regularity by showing, numerically, how increasingly irregular motions can be composed ofsimpler, regular motions.
In the Almagest, the tables are meant to serve a double function: they both allow computation and theyreveal the underlying mathematical pattern, usually by relating a set of numbers with changing differencesto a set of numbers composed of regular differences of degrees of a circle, which acts as a sort of standardfor regularity. The point of these tables is not to track the apparent motions of the celestial bodies, as wasdone in other tables then in circulation in Greco-Roman Egypt (Jones, 1997a, 1997b, 1999b), but rather toshow that any apparently irregular motion is actually based on the periodic motion of the circle; that is, toreveal the underlying mathematical principle of regular circular motion.
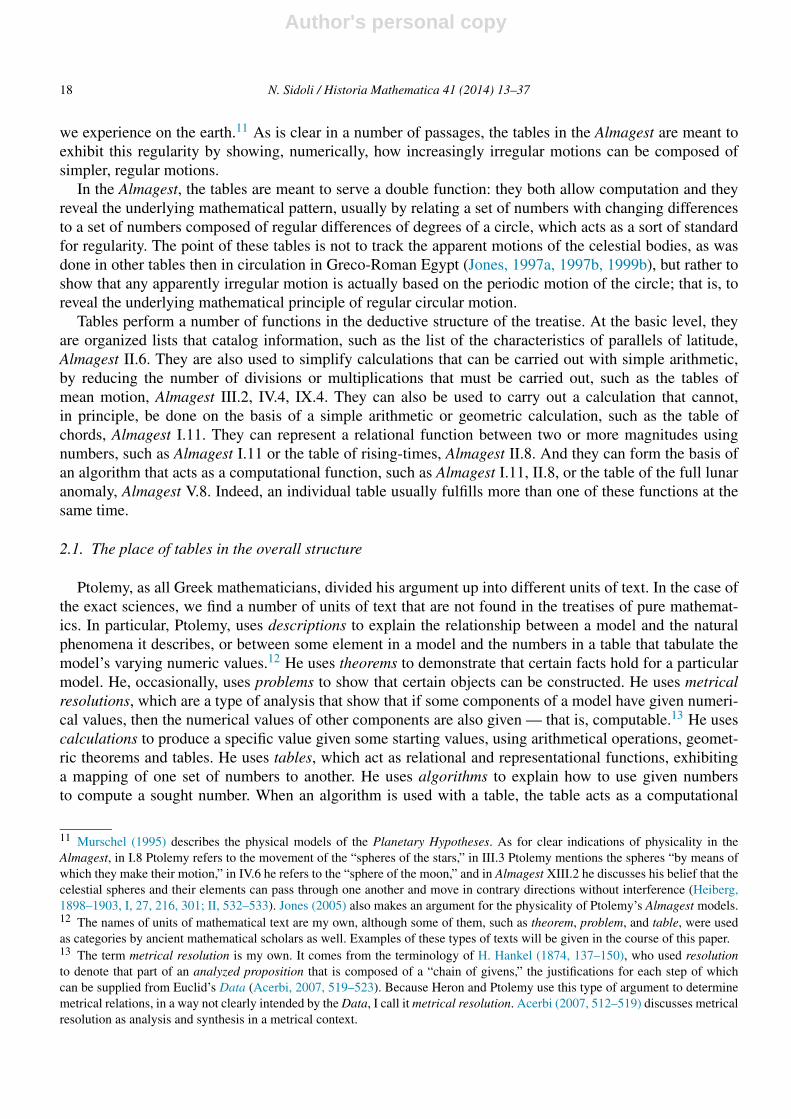
Tables perform a number of functions in the deductive structure of the treatise. At the basic level, theyare organized lists that catalog information, such as the list of the characteristics of parallels of latitude,Almagest II.6. They are also used to simplify calculations that can be carried out with simple arithmetic,by reducing the number of divisions or multiplications that must be carried out, such as the tables ofmean motion, Almagest III.2, IV.4, IX.4. They can also be used to carry out a calculation that cannot,in principle, be done on the basis of a simple arithmetic or geometric calculation, such as the table ofchords, Almagest I.11. They can represent a relational function between two or more magnitudes usingnumbers, such as Almagest I.11 or the table of rising-times, Almagest II.8. And they can form the basis ofan algorithm that acts as a computational function, such as Almagest I.11, II.8, or the table of the full lunaranomaly, Almagest V.8. Indeed, an individual table usually fulfills more than one of these functions at thesame time.
2.1. The place of tables in the overall structure
Ptolemy, as all Greek mathematicians, divided his argument up into different units of text. In the case ofthe exact sciences, we find a number of units of text that are not found in the treatises of pure mathemat-ics. In particular, Ptolemy, uses descriptions to explain the relationship between a model and the naturalphenomena it describes, or between some element in a model and the numbers in a table that tabulate themodel’s varying numeric values.12 He uses theorems to demonstrate that certain facts hold for a particularmodel. He, occasionally, uses problems to show that certain objects can be constructed. He uses metricalresolutions, which are a type of analysis that show that if some components of a model have given numeri-cal values, then the numerical values of other components are also given — that is, computable.13 He usescalculations to produce a specific value given some starting values, using arithmetical operations, geomet-ric theorems and tables. He uses tables, which act as relational and representational functions, exhibitinga mapping of one set of numbers to another. He uses algorithms to explain how to use given numbersto compute a sought number. When an algorithm is used with a table, the table acts as a computational
11 Murschel (1995) describes the physical models of the Planetary Hypotheses. As for clear indications of physicality in theAlmagest, in I.8 Ptolemy refers to the movement of the “spheres of the stars,” in III.3 Ptolemy mentions the spheres “by means ofwhich they make their motion,” in IV.6 he refers to the “sphere of the moon,” and in Almagest XIII.2 he discusses his belief that thecelestial spheres and their elements can pass through one another and move in contrary directions without interference (Heiberg,1898–1903, I, 27, 216, 301; II, 532–533). Jones (2005) also makes an argument for the physicality of Ptolemy’s Almagest models.12 The names of units of mathematical text are my own, although some of them, such as theorem, problem, and table, were usedas categories by ancient mathematical scholars as well. Examples of these types of texts will be given in the course of this paper.13 The term metrical resolution is my own. It comes from the terminology of H. Hankel (1874, 137–150), who used resolutionto denote that part of an analyzed proposition that is composed of a “chain of givens,” the justifications for each step of whichcan be supplied from Euclid’s Data (Acerbi, 2007, 519–523). Because Heron and Ptolemy use this type of argument to determinemetrical relations, in a way not clearly intended by the Data, I call it metrical resolution. Acerbi (2007, 512–519) discusses metricalresolution as analysis and synthesis in a metrical context.

Author's personal copy
N. Sidoli / Historia Mathematica 41 (2014) 13–37 19
function, since, entering with a certain number of the domain, the algorithm for operating with the tableunambiguously produces a single number of the codomain. Very nearly every passage of Ptolemy’s textthat is a part of the mathematical argument can be assigned to one of these types.
In the Almagest, a table never appears on its own. It appears as part of an extended mathematical argu-ment that relates it to the geometric model, shows how the entries of the table are related to one another,describes how the table is laid out, and provides algorithms for its use. I call this overall mathematicalargument a table nexus. The table nexus is made up of three nodes: derivation, representation, and evalu-ation. This grouping of text and table is called a nexus because it almost always involves the use of othertables besides that in the representation node of the nexus. For example, the calculation of a table generallyinvolves the use of the chord table, Almagest I.11, and the algorithm following a table often involves theuse of two or more tables in conjunction, such as the combination of tables of mean motion and correction.
The derivation node of a single table nexus provides the mathematical relationship between the numbersin the table and the objects in the model. In particular, the derivation uses calculation or analysis to showhow a given model and its parameters determine the numbers that are found in the table. This does notnecessarily mean that the numbers in the table were actually computed by the methods provided in thederivation, and in a number of cases it has been shown that they were not (Newton, 1985; Van Brummelen,1993, 1994). Rather, the derivation argues, more generally, that given a certain model, some parameters,and an input value, the corresponding value in the table is also fixed.
The tables themselves can be taken as a quantitative representation of the geometric model. The rep-resentation node consists of a description of how the table is laid out, followed by the table itself. Thedescription gives an account of various graphical and mathematical features of the layout, such as the num-ber of lines per page, the layout of the columns, and the relationship between components of the model andthe entries in the table. The table itself can be understood as a sort of representational function, in whichthe members of one set of numbers are associated with the members of another set.
The tables are then used in various ways to carry out computations. The evaluation node consists ofalgorithms and calculations that refer to the tables. The algorithm describes how to perform calculations onthe various entries in the tables in order to produce a definite result. The algorithm is not always exactlyprecise, so that there is sometimes ambiguity about how an interpolation should be carried out.14 Neverthe-less, the algorithm gives a method for producing a numerical value and points out how the table can be usedto produce numerical values for the model. The combination of the algorithm and table can be understoodas a computational function, which allows us to enter in with a given number of the domain and produce asingle number of the codomain.
Ptolemy gives no general argument that his tabular methods are valid or effective. Presumably he thoughtthat such an argument would be apparent from the mathematical structure of the table nexus. Indeed, thevarious components of the table nexus help us understand the relationship between the model and the table,upon which we must base our understanding of the tables. An appreciation of what each of the componentsof the table means, is based on having followed the derivation. In this way, we see that the table mustnumerically express a relational function between two, or more, components of the model. In the simplertable nexuses, the individual columns represent individual geometric objects, such as angles or lengths. Anyclaim that an algorithm actually produces the apparent motions that we are interested in, and properly relatesthese to the more regular motions of the model, will be based on an assessment of the relationship betweenthe various components of the table nexus. Finally, an intuitive understanding of how the components ofthe model move is derived from studying the numbers in the tables, and the tables are designed in such away as to try to make the nature of these movements as clear as possible.
14 For example, when we write a simple computer program to carry out one of Ptolemy’s algorithms, we often find ourselves in aposition of having to make choices about how interpolation should be carried out, since this is usually not explicitly specified byPtolemy.
Author's personal copy
20 N. Sidoli / Historia Mathematica 41 (2014) 13–37
2.2. A model table nexus: Almagest III.5, III.6 and III.8
In order to illustrate how the table nexus functions with an example, I take the table of anomaly for thesolar model. This is not the first table nexus in the text, nor the most interesting, but since the solar modelis the first that treats an irregular apparent motion and acts in many ways as a model for the more involvedtheories, it serves as a paradigmatic case. Moreover, it is in reference to this table nexus that Ptolemy makestwo of his most programmatic statements about how he works with tables. It is here that he tells us, for thefirst time, that a primary goal of the Almagest tables is to model the motion of the heavenly bodies in sucha way as to show that any apparent irregularities in their motion is actually composed of regular motions inthe model. In Almagest III.1, Ptolemy puts this, somewhat obliquely, as follows:15
As for the evaluation of the paths of the sun and the others, according to the occurrences of each of them,which the arrangement of the table framework, part by part, (ἡ σύνταξις τῆς κατὰ μέρος κανονοποιίας)is disposed to supply as handy, or rather explicit, we hold [1] that it must be set out as a purpose and an aimof the mathematician to show the accomplishment (ἀποτελούμενα) of all phenomena of the heavens bymeans of regular and circular motions, and [2a] that the table framework (κανονοποιίαν) most appropriateand suited to this purpose is the separation of the regular motion, part by part, from the apparent irregularity,following from the circular models, and then [2b] the exhibition of their apparent paths is from the mixingand combination of both of these.
[Heiberg, 1898–1903, I, 208]
In other words, the goal of the mathematician16 is to show that all the heavenly phenomena are broughtabout by regular, circular motions, and that the table framework17 that best does this is one in which themean motions, as functions of time, and anomalies, as functions of mean motion, are tabulated indepen-dently. In this way, the components of the tables will exhibit the numerical relationship that the variousparts of the model have to the regular motion of a circle.
The table nexus of the solar anomaly fits into the overall development of the solar theory and it willbe useful to sketch this development. The theory begins, in Almagest III.1, with a long argument that thelength of the tropical solar year is constant, including a discussion of how it is measured, reports of ancientobservations and the conclusion that Hipparchus was right about its value. The mean motion of the sunis then set out in a table, III.2, so that it can readily be used in the arguments that follow.18 The solarmean motion table sets out the pattern of all the mean motion tables in the treatise. It tabulates 45 rowsof eighteen-year periods, eighteen rows of one-year periods, twelve rows of 30-month periods, 30 rows ofone-day periods, and 24 rows of one-hour periods — each in integer degrees with six sexagesimal-fractionalplaces, in subcolumns.19 Almagest III.3 sets out the simple epicycle and the eccentric models and provestheir equivalence for the simple, solar model.20 Hipparchus’ solar eccentric model is then set out in III.4,
15 In order to pay close attention to Ptolemy’s terminology with respect to tables, I have provided my own translations.16 See note 8, above.17 The term κανονοποιία, which I translate with “table framework,” is used seven times in the Almagest (Heiberg, 1898–1903, I,208, 240, 251; II, 218, 427). This word, which literally means something like “table construction,” refers to the mathematical, ortechnical, design of the table.18 Ptolemy makes this point about why the table of mean motion is set out at the end of Almagest III.1, just after the quote abovein which he introduces the structure of the table and explains why his table framework is split into a mean motion table and a tableof anomaly (Heiberg, 1898–1903, I, 208).19 There is no mathematical difficulty involved in finding any of these values, because Ptolemy uses the Egyptian year, whichalways has 365 days, composed of twelve 30-day months, followed by five epagomenal days. Each day, in turn, contains 24equinoctial hours.20 The argument for equivalence is given in a series of general arguments that Ptolemy notes will be backed up by numericalcomputation later on (Heiberg, 1898–1903, 222–229). Bowen (2012, 46, n. 28), apparently misreading a note by Toomer (1984,

Author's personal copy
N. Sidoli / Historia Mathematica 41 (2014) 13–37 21
Figure 2. Almagest III.5.
and Ptolemy determines its parameters using “observations” that he claims to have made, but which areall off by about a day and agree with Hipparchus’ erroneous year length. Using calculations and metricalresolutions, it is then shown, in III.5, that given the parameters of the model and one of either the meanmotion from apogee, κ , the apparent motion from apogee, κ , or the equation of anomaly, q , the other twocan also be determined. Almagest III.6 is the table of anomaly, structured such that we can enter with themean motion and produce the equation of anomaly, q(κ). Almagest III.7 determines the mean position ofthe sun in the epoch of Nabonassar, Thoth 1 in the Egyptian calendar (−746, Feb 26), so that we can statethe mean position relative to the model, κ , as a mean position of longitude relative to the zodiac, λ. Finally,in III.8, Ptolemy gives an algorithm that shows how to use the two tables, III.2 and III.6, along with theastronomical parameters of the model to state the apparent position of the sun, λ�, for any time sinceepoch.
The theory combines more mathematical sections, which set out the general principles of the modelsand the tables, with more observational sections, which establish the spacial and temporal parameters ofthe models. The table nexus of the table of solar anomaly, III.5, III.6 and III.8, fits into a broader context oftable nexuses that includes the chord table, I.11, and the table of solar mean motion, III.2. The architectureis designed to be modular so that the table nexus of the table of anomaly is necessarily embedded in thisoverall theory.
The derivation of the table of solar mean motion is given in Almagest III.5, followed by a discussion ofthe table framework that Ptolemy prefers. He begins with a general claim that one of the three principalarcs of the model is sufficient to determine the other two, stating,
In order to make it possible to determine the motion of the anomaly, part by part, again for each of themodels, we show how, with one of the stated arcs (κ , κ , and q) being a given, we get the others.
[Heiberg, 1898–1903, I, 240]
He proceeds to show, in Figure 2, that if we assume the eccenter model, such that � ECZ = κ = 30◦,then we can complete right triangle ZKD and use the geometry of the figure, along with the chord table,I.11, and the parameters of the model from III.4, namely DC = 2;30p where ZC = 60p, to show that� DZK = q = 1;9◦ and � ADB = κ = 28;51◦. He then uses metrical resolution to show that, in general,if � EDZ = κ is given, then both � CZD = q and � ECZ = κ will be given, and that if � CZD = q isgiven, then both � EDZ = κ and � ECZ = κ will be given. This is followed by a repetition of these three
144, n. 32), claims that the equivalence of the eccentric and epicycle models is only “suggested” in Almagest III.3, but is not“discussed” until XII.1. Toomer’s note, however — which uses the words “hinting” and “discuss” — refers to the fact that Ptolemyis making an obscure reference to a more elaborate type of eccentric model, which is equivalent to a different type of epicyclemodel, both of which are treated in XII.1. What makes the later model different, as Toomer notes, is that the two motions of theepicycle model are in the same direction.

Author's personal copy
22 N. Sidoli / Historia Mathematica 41 (2014) 13–37
arguments, a calculation and two metrical resolutions, now for the epicyclic model. Ptolemy then givesall six arguments, three for the eccentric and three for the epicyclic model, for the case where the meanmotion, κ , is 30◦ from the perigee, G. Since the geometry of the figure is somewhat different when Z is inthe lower half of the solar orbit, he must have regarded this as a separate case. All of this serves to showthat the geometry of the model is such that the various components are determinate.
The introduction to the table itself, III.5 contains a description of the table, as well as a programmaticdescription of the table framework. Ptolemy says,
While, from these theorems, many possible table frameworks (κανονοποιίας) — with sections comprisingthe determination, from the irregularity, of the apparent paths — can be constructed, in order to immediatelyget the quantity of the corrections, part by part, that [table] having the regular arcs (κ) laid out besides theequation of anomaly (q) pleases us best, both by its accordance in itself with the model and because it issimple and apt for the calculation of each.
[Heiberg, 1898–1903, I, 251]
In other words, Ptolemy choses a table with the mean motion laid out next to the corresponding anomalyboth to exhibit the functional relationship between them, and to be suitable for calculation.
Ptolemy then tells us that he calculated the table using chord-table trigonometry (διὰ τῶν γραμμῶν,literally “by means of lines”),21 using the eccentric model. He states that, in general, the tables will have3◦ intervals in the semicircle around the perigee and 6◦ intervals in that around the apogee, because thesuccessive differences of the anomaly are greater around the perigee than the apogee.22 This is followed bya description of the graphical layout of the table: it will have 45 rows and three columns, with the first twocolumns containing the mean motion from 0◦ to 360◦ and the third column containing the correction to beadded or subtracted.
This detailed description is followed by the table itself; see Table 1. The table, as a whole, is labeled“the table of the sun’s anomaly,” and the two columns are individually labeled as “common numbers” and“add-subtractions” (meaning additive or subtractive corrections). In fact, the third column contains twosubcolumns with a ruled line separating them, the first containing degrees and the second containing min-utes. The two subcolumns are clearly marked in all the manuscripts, however, they have a single headingand are referred to in the text together as the “third column.” The column heading “common numbers”reveals the symmetry of the function through the fact that the whole function is described with only 180◦.Moreover, the minimum and maximum can be read directly off the table to be 93◦ and 267◦, and thisdisplacement of the maximum and minimum values of the anomaly from quadrature helps us form a quan-titative understanding of Ptolemy’s proof, in Almagest III.4, that the position of the extreme values of theanomaly are symmetrically placed between apogee and perigee, but displaced from quadrature. This helpsus understand what Ptolemy means by saying that the table both corresponds to the model and is useful forcalculation. The table was meant to serve much the same role as a graph: it reveals the changing numericalrelationship that exists between � ECZ = κ and � CZD = q . By studying its numbers we can develop a
21 Διὰ τῶν γραμμῶν is a technical expression in Ptolemy’s writings, which means through the chord-table methods of trigonom-etry (Heiberg, 1898–1903, I, 32, 42, 251, 335, 349, 380, 383, 416, 449; II, 193, 198, 201, 210, 321, 426, 427, 429; Heiberg, 1907,202, 203). It can either designate an actual calculation, or a metrical resolution, where the later is understood as showing that theformer is, in principle, possible.22 This is due to the fact that the sun appears to move somewhat more rapidly from mean speed to greatest speed than from meanspeed to least speed, as was demonstrated in III.4 and will be exhibited in III.6.
This slight difference in the apparent speed, however, seems hardly sufficient to justify tabulating the table at different intervalsin the two semicircles. Probably, Ptolemy wanted tables of 45 rows to agree with his other tables, and devised this sectioning asa convenient way of obtaining them. In some of the later tables, such as Almagest V.8, discussed below, the difference in speed ismore apparent. Hence, this division into intervals of 3◦ and 6◦ may have been decided for them.

Author's personal copy
N. Sidoli / Historia Mathematica 41 (2014) 13–37 23
Table 1The table of solar equation, Almagest III.6. Formatting based on Paris BnF gr. 2889.
Table of the sun’s anomaly1st 2nd 3rdCommon Add-numbers subtractions6 354 0 1412 348 0 2818 342 0 4224 336 0 5630 330 1 936 324 1 2142 318 1 3248 312 1 4354 306 1 5360 300 2 166 294 2 872 288 2 1478 282 2 1884 276 2 2190 270 2 2393 267 2 2396 264 2 2399 261 2 22102 258 2 21105 255 2 20108 252 2 18111 249 2 16114 246 2 13117 243 2 10120 240 2 6123 237 2 2126 234 1 58129 231 1 54132 228 1 49135 225 1 44138 222 1 39141 219 1 33144 216 1 27147 213 1 21150 210 1 14153 207 1 7156 204 1 0159 201 0 53162 198 0 46165 195 0 39168 192 0 32171 189 0 24174 186 0 16177 183 0 8180 180 0 0
more intuitive understanding of the way the speed of the sun appears to change throughout its orbit than wecan discern in the geometrical diagram alone.
In Almagest III.8, Ptolemy provides the algorithm for using III.6 and III.2 to compute the apparentposition of the sun at some given time, t . We begin by taking the time elapsed since epoch, �t , and enterwith this into the tables of mean motion, in divisions suitable to the table — eighteen year periods, years,months and so on — to find the change in mean longitude �λ. We then add this to 256;15◦ — which wasthe mean position of the sun from its apogee at epoch, κepoch, determined in III.7 — and take this summodulo 360 to find the mean position from apogee for the time in question, κt . We count this off in theorder of the signs from Gem 5;30◦ (65;30◦), the zodiacal position of the sun’s apogee, λA, determined inIII.4, to find the mean position of the sun at our given time, λt . We then enter with κt into the table of the
Author's personal copy
24 N. Sidoli / Historia Mathematica 41 (2014) 13–37
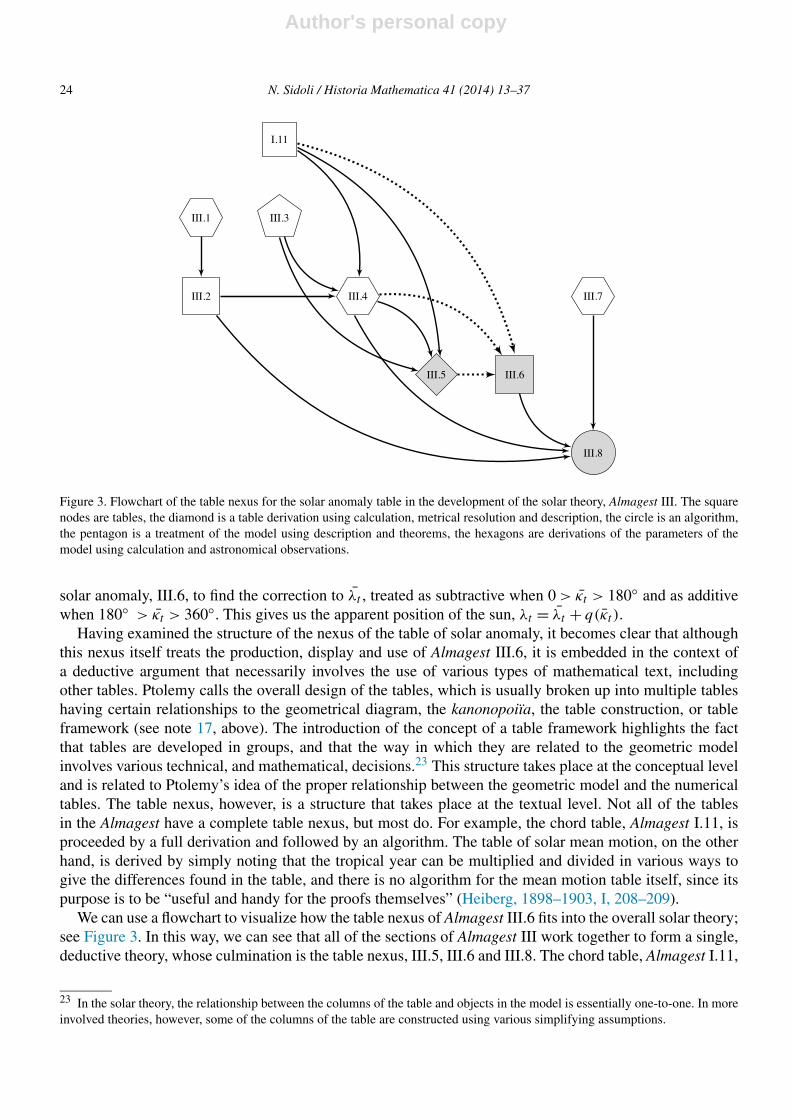
Figure 3. Flowchart of the table nexus for the solar anomaly table in the development of the solar theory, Almagest III. The squarenodes are tables, the diamond is a table derivation using calculation, metrical resolution and description, the circle is an algorithm,the pentagon is a treatment of the model using description and theorems, the hexagons are derivations of the parameters of themodel using calculation and astronomical observations.
solar anomaly, III.6, to find the correction to λt , treated as subtractive when 0 > κt > 180◦ and as additivewhen 180◦ > κt > 360◦. This gives us the apparent position of the sun, λt = λt + q(κt ).
Having examined the structure of the nexus of the table of solar anomaly, it becomes clear that althoughthis nexus itself treats the production, display and use of Almagest III.6, it is embedded in the context ofa deductive argument that necessarily involves the use of various types of mathematical text, includingother tables. Ptolemy calls the overall design of the tables, which is usually broken up into multiple tableshaving certain relationships to the geometrical diagram, the kanonopoiïa, the table construction, or tableframework (see note 17, above). The introduction of the concept of a table framework highlights the factthat tables are developed in groups, and that the way in which they are related to the geometric modelinvolves various technical, and mathematical, decisions.23 This structure takes place at the conceptual leveland is related to Ptolemy’s idea of the proper relationship between the geometric model and the numericaltables. The table nexus, however, is a structure that takes place at the textual level. Not all of the tablesin the Almagest have a complete table nexus, but most do. For example, the chord table, Almagest I.11, isproceeded by a full derivation and followed by an algorithm. The table of solar mean motion, on the otherhand, is derived by simply noting that the tropical year can be multiplied and divided in various ways togive the differences found in the table, and there is no algorithm for the mean motion table itself, since itspurpose is to be “useful and handy for the proofs themselves” (Heiberg, 1898–1903, I, 208–209).
We can use a flowchart to visualize how the table nexus of Almagest III.6 fits into the overall solar theory;see Figure 3. In this way, we can see that all of the sections of Almagest III work together to form a single,deductive theory, whose culmination is the table nexus, III.5, III.6 and III.8. The chord table, Almagest I.11,
23 In the solar theory, the relationship between the columns of the table and objects in the model is essentially one-to-one. In moreinvolved theories, however, some of the columns of the table are constructed using various simplifying assumptions.
Author's personal copy
N. Sidoli / Historia Mathematica 41 (2014) 13–37 25
has also been included in the diagram to remind us that the solar theory is not developed independently ofthe rest of the treatise.
2.3. Details of the table nexus
Now that we have seen the overall scope of the table nexus, we can focus on some of the particularfeatures of the three nodes. Although Almagest III provides a convenient model of the table nexus, a numberof the special features of the three nodes are better exemplified by more involved tables. Most of theexamples that follow are drawn from the table nexuses of the complete lunar and planetary models.
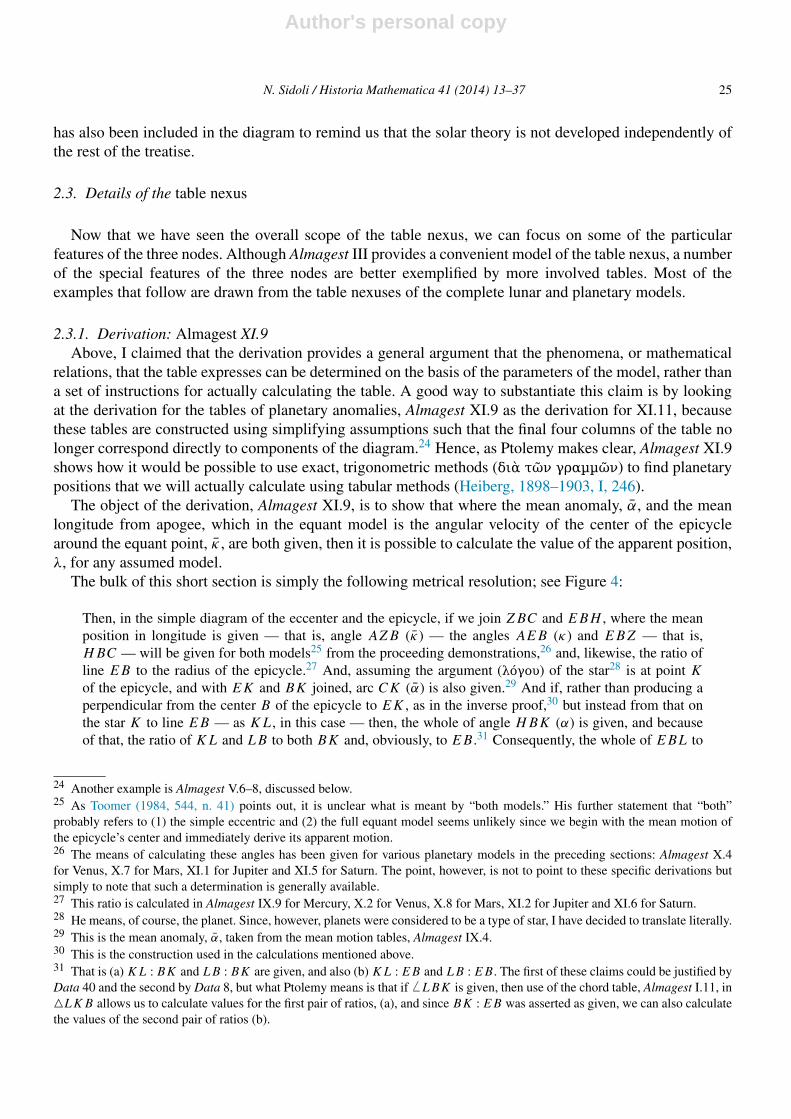
2.3.1. Derivation: Almagest XI.9Above, I claimed that the derivation provides a general argument that the phenomena, or mathematical
relations, that the table expresses can be determined on the basis of the parameters of the model, rather thana set of instructions for actually calculating the table. A good way to substantiate this claim is by lookingat the derivation for the tables of planetary anomalies, Almagest XI.9 as the derivation for XI.11, becausethese tables are constructed using simplifying assumptions such that the final four columns of the table nolonger correspond directly to components of the diagram.24 Hence, as Ptolemy makes clear, Almagest XI.9shows how it would be possible to use exact, trigonometric methods (διὰ τῶν γραμμῶν) to find planetarypositions that we will actually calculate using tabular methods (Heiberg, 1898–1903, I, 246).
The object of the derivation, Almagest XI.9, is to show that where the mean anomaly, α, and the meanlongitude from apogee, which in the equant model is the angular velocity of the center of the epicyclearound the equant point, κ , are both given, then it is possible to calculate the value of the apparent position,λ, for any assumed model.
The bulk of this short section is simply the following metrical resolution; see Figure 4:
Then, in the simple diagram of the eccenter and the epicycle, if we join ZBC and EBH , where the meanposition in longitude is given — that is, angle AZB (κ) — the angles AEB (κ) and EBZ — that is,HBC — will be given for both models25 from the proceeding demonstrations,26 and, likewise, the ratio ofline EB to the radius of the epicycle.27 And, assuming the argument (λόγου) of the star28 is at point K
of the epicycle, and with EK and BK joined, arc CK (α) is also given.29 And if, rather than producing aperpendicular from the center B of the epicycle to EK , as in the inverse proof,30 but instead from that onthe star K to line EB — as KL, in this case — then, the whole of angle HBK (α) is given, and becauseof that, the ratio of KL and LB to both BK and, obviously, to EB .31 Consequently, the whole of EBL to
24 Another example is Almagest V.6–8, discussed below.25 As Toomer (1984, 544, n. 41) points out, it is unclear what is meant by “both models.” His further statement that “both”probably refers to (1) the simple eccentric and (2) the full equant model seems unlikely since we begin with the mean motion ofthe epicycle’s center and immediately derive its apparent motion.26 The means of calculating these angles has been given for various planetary models in the preceding sections: Almagest X.4for Venus, X.7 for Mars, XI.1 for Jupiter and XI.5 for Saturn. The point, however, is not to point to these specific derivations butsimply to note that such a determination is generally available.27 This ratio is calculated in Almagest IX.9 for Mercury, X.2 for Venus, X.8 for Mars, XI.2 for Jupiter and XI.6 for Saturn.28 He means, of course, the planet. Since, however, planets were considered to be a type of star, I have decided to translate literally.29 This is the mean anomaly, α, taken from the mean motion tables, Almagest IX.4.30 This is the construction used in the calculations mentioned above.31 That is (a) KL : BK and LB : BK are given, and also (b) KL : EB and LB : EB . The first of these claims could be justified byData 40 and the second by Data 8, but what Ptolemy means is that if � LBK is given, then use of the chord table, Almagest I.11, in�LKB allows us to calculate values for the first pair of ratios, (a), and since BK : EB was asserted as given, we can also calculatethe values of the second pair of ratios (b).

Author's personal copy
26 N. Sidoli / Historia Mathematica 41 (2014) 13–37
Figure 4. Almagest XI.9.
LK will be given.32 That is, angle LEK (q) will be given,33 and the whole arc AEK (κ + q), which is theapparent distance of the star from the apogee, is calculated (συνῆχθαι) by us.
[Heiberg, 1898–1903, II, 426–427]
What this metrical resolution shows is simply that, given the parameters of the model and the meanmotions in longitude and anomaly, the apparent position will be mathematically determined. In the next sec-tion, Almagest XI.10, Ptolemy will go on to show how the table is actually constructed. This construction,in fact, does not follow the foregoing procedure. Hence, the determination serves as a sort of justificationthat the values calculated by means of the table are determinate, even though the computational methodthat employs the table will be approximate. The determination may be composed of metrical resolution, asa general argument that the value is determinate, or calculation, serving as an example showing how valuecan be determined. Ptolemy appears to use these interchangeably, and it is not clear that he regards one asmore general than the other.
Although this section gives a mathematical argument that the values calculated in the table are deter-minate, it does not provide a full derivation of the actual columns of the table. For the table of planetaryanomaly, just as the table of full lunar anomaly, the derivation is carried out in two steps: first a general ar-gument that the model is determinate, and then a more detailed derivation, mixed in with the representation,which shows how the columns of the table can, in principle, be calculated. This more detailed derivationwill be considered below.
2.3.2. Representation: Almagest II.7–8, XI.10–11 and V.7–8The representation node is made up of both a description of how the table is constructed and a presenta-
tion of the table itself. Often the description is fairly simple, and may take up only the final few sentences ofthe proceeding section, but sometimes the description is involved and may have its own section containinginternal derivations for certain columns. The goal of the representation is to exhibit the table such that it isboth useful for calculation and also reveals the nature of the objects, or motions, in question.
Almagest II.7–8 As a first example of the various functions of the representation node, I will use thetable of rising-times of arcs of the ecliptic, Almagest II.7–8. The description is a simple statement of thedimensions and contents of the table. The table itself — one of the more impressive in the whole of theAlmagest — tabulates the time-degees that arcs of the ecliptic take to rise over the horizon as a function oftwo variables, geographic latitude, ϕ, and ecliptic longitude, λ, from Ari 0◦ — that is, ρ(ϕ,λ).
32 This could be justified by an application of Data 6 and 8, but what Ptolemy means is that a value for EL : LK can be calculated.33 This could be justified by Data 43, but Ptolemy means that we can apply the chord table in �LEK and calculate � LEK .

Author's personal copy
N. Sidoli / Historia Mathematica 41 (2014) 13–37 27
Table 2Almagest II.8. The column of differences for the terrestrial equator.
9;109;159;259;409;58
10;1610;3410;4710;5510;5510;4710;3410;169;589;409;259;159;109;109;159;259;409;58
10;1610;3410;4710;5510;5510;4710;3410;169;589;409;259;159;10
The table is arranged in eleven columns for terrestrial latitudes with two subcolumns for accumulatedtime-degrees, and time-degrees for 10◦ intervals of the ecliptic. A third column acts as a list of headersfor the thirty six rows, which tabulate entries at 10◦ intervals of longitude measured along the ecliptic.For the purposes of solving problems of spherical astronomy, one uses the column of accumulated time-degrees, with linear interpolation for individual degrees. To aid in this interpolation, the differences betweensuccessive entries are tabulated as well — that is, the time-degrees for each 10◦ interval. There is also math-ematical evidence that Ptolemy used linear interpolation on his table of right ascension, Almagest II.8 col1,to calculate his table for the equation of time in the Handy Tables (van Dalen, 1994, 129–131); however,this can hardly have been his sole reason for choosing this format for the Almagest table. As well as beinguseful for calculation, this column of differences serves as a representational function by displaying thechanging behavior of the rising-times. By looking at the numbers in these columns, and comparing thesecolumns with one another, we can see how the rising-times of arcs of the ecliptic change as one movesaway from the equator.
For example, the column of differences for the terrestrial equator is given in Table 2. An inspection ofthis sequence of numbers shows that there are two pairwise equal minima and maxima, that the change issymmetric about these extrema, and that the rate of change is least in the vicinity of the extrema. Moreover,by comparing the column for the equator with the columns for the other terrestrial latitudes (Toomer, 1984,100–103), we can see how this function changes as we move north — the absolute minimums at 0◦ becomeprogressively lesser, the local minimums at 180◦ become greater, while the maximums become greater andmove away from 90◦ and 270◦ towards 180◦, but still are symmetrically situated about 180◦. That is, nearly
Author's personal copy
28 N. Sidoli / Historia Mathematica 41 (2014) 13–37
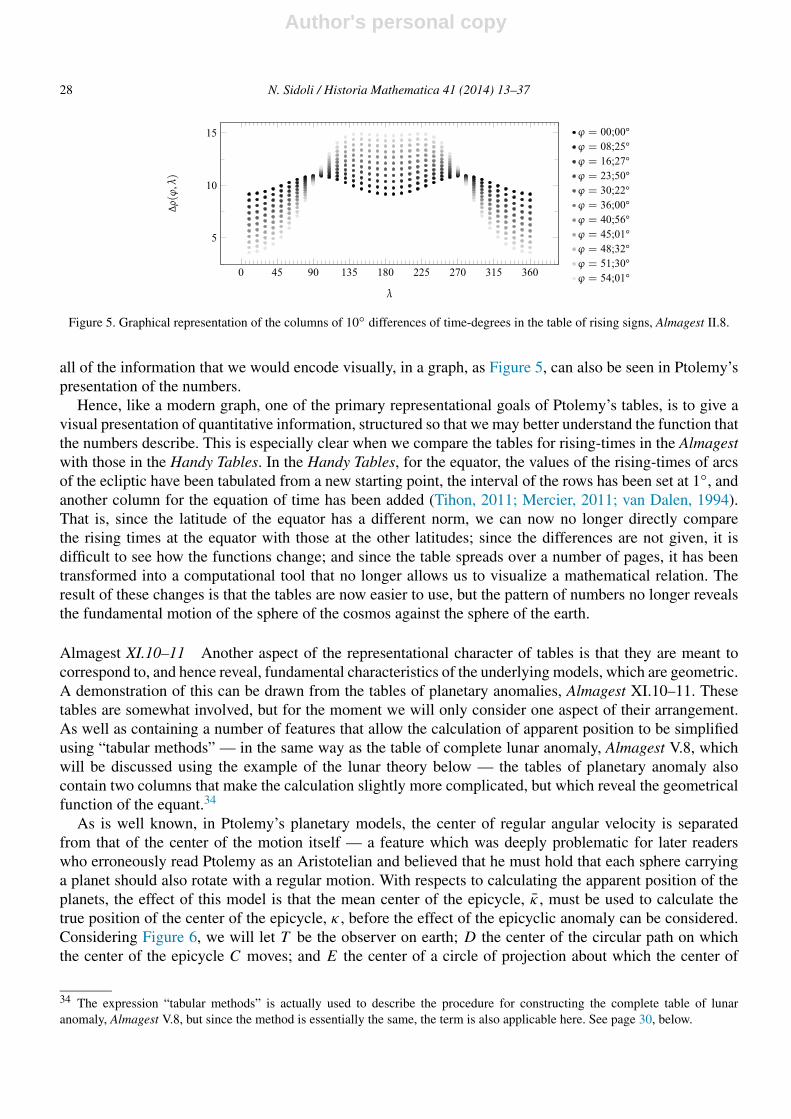
Figure 5. Graphical representation of the columns of 10◦ differences of time-degrees in the table of rising signs, Almagest II.8.
all of the information that we would encode visually, in a graph, as Figure 5, can also be seen in Ptolemy’spresentation of the numbers.
Hence, like a modern graph, one of the primary representational goals of Ptolemy’s tables, is to give avisual presentation of quantitative information, structured so that we may better understand the function thatthe numbers describe. This is especially clear when we compare the tables for rising-times in the Almagestwith those in the Handy Tables. In the Handy Tables, for the equator, the values of the rising-times of arcsof the ecliptic have been tabulated from a new starting point, the interval of the rows has been set at 1◦, andanother column for the equation of time has been added (Tihon, 2011; Mercier, 2011; van Dalen, 1994).That is, since the latitude of the equator has a different norm, we can now no longer directly comparethe rising times at the equator with those at the other latitudes; since the differences are not given, it isdifficult to see how the functions change; and since the table spreads over a number of pages, it has beentransformed into a computational tool that no longer allows us to visualize a mathematical relation. Theresult of these changes is that the tables are now easier to use, but the pattern of numbers no longer revealsthe fundamental motion of the sphere of the cosmos against the sphere of the earth.
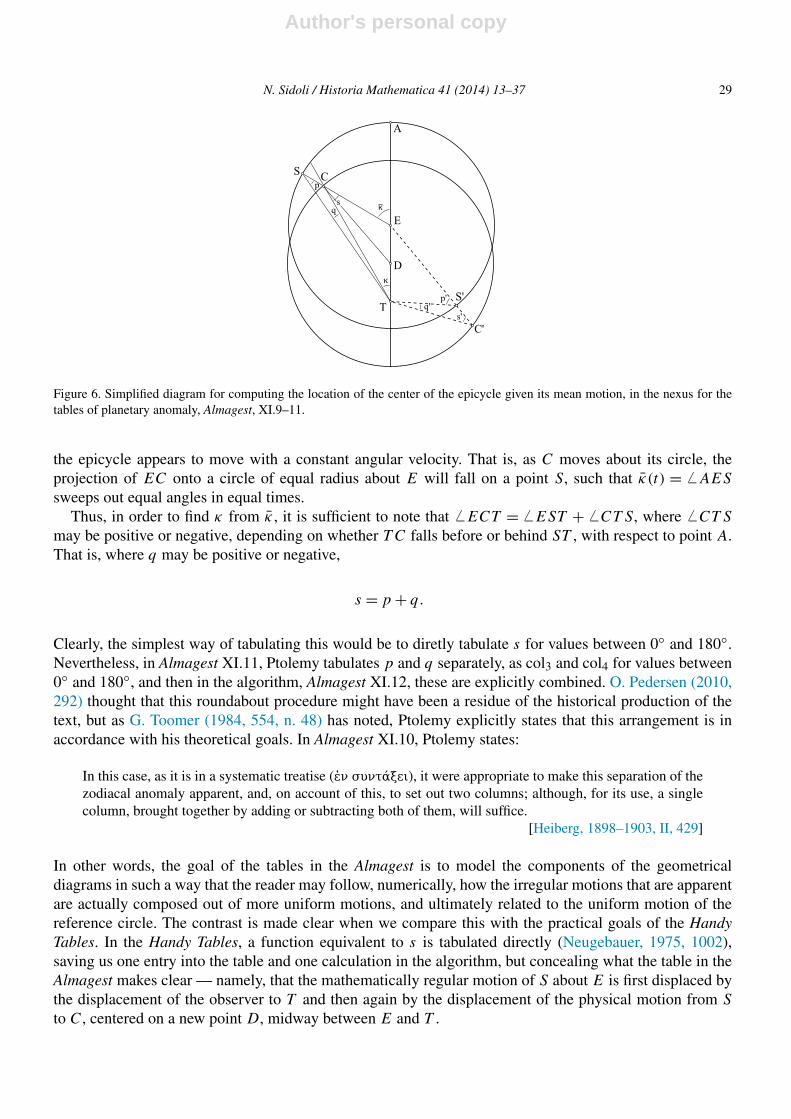
Almagest XI.10–11 Another aspect of the representational character of tables is that they are meant tocorrespond to, and hence reveal, fundamental characteristics of the underlying models, which are geometric.A demonstration of this can be drawn from the tables of planetary anomalies, Almagest XI.10–11. Thesetables are somewhat involved, but for the moment we will only consider one aspect of their arrangement.As well as containing a number of features that allow the calculation of apparent position to be simplifiedusing “tabular methods” — in the same way as the table of complete lunar anomaly, Almagest V.8, whichwill be discussed using the example of the lunar theory below — the tables of planetary anomaly alsocontain two columns that make the calculation slightly more complicated, but which reveal the geometricalfunction of the equant.34
As is well known, in Ptolemy’s planetary models, the center of regular angular velocity is separatedfrom that of the center of the motion itself — a feature which was deeply problematic for later readerswho erroneously read Ptolemy as an Aristotelian and believed that he must hold that each sphere carryinga planet should also rotate with a regular motion. With respects to calculating the apparent position of theplanets, the effect of this model is that the mean center of the epicycle, κ , must be used to calculate thetrue position of the center of the epicycle, κ , before the effect of the epicyclic anomaly can be considered.Considering Figure 6, we will let T be the observer on earth; D the center of the circular path on whichthe center of the epicycle C moves; and E the center of a circle of projection about which the center of
34 The expression “tabular methods” is actually used to describe the procedure for constructing the complete table of lunaranomaly, Almagest V.8, but since the method is essentially the same, the term is also applicable here. See page 30, below.
Author's personal copy
N. Sidoli / Historia Mathematica 41 (2014) 13–37 29
Figure 6. Simplified diagram for computing the location of the center of the epicycle given its mean motion, in the nexus for thetables of planetary anomaly, Almagest, XI.9–11.
the epicycle appears to move with a constant angular velocity. That is, as C moves about its circle, theprojection of EC onto a circle of equal radius about E will fall on a point S, such that κ(t) = � AES
sweeps out equal angles in equal times.Thus, in order to find κ from κ , it is sufficient to note that � ECT = � EST + � CT S, where � CT S
may be positive or negative, depending on whether T C falls before or behind ST , with respect to point A.That is, where q may be positive or negative,
s = p + q.
Clearly, the simplest way of tabulating this would be to diretly tabulate s for values between 0◦ and 180◦.Nevertheless, in Almagest XI.11, Ptolemy tabulates p and q separately, as col3 and col4 for values between0◦ and 180◦, and then in the algorithm, Almagest XI.12, these are explicitly combined. O. Pedersen (2010,292) thought that this roundabout procedure might have been a residue of the historical production of thetext, but as G. Toomer (1984, 554, n. 48) has noted, Ptolemy explicitly states that this arrangement is inaccordance with his theoretical goals. In Almagest XI.10, Ptolemy states:
In this case, as it is in a systematic treatise (ἐν συντάξει), it were appropriate to make this separation of thezodiacal anomaly apparent, and, on account of this, to set out two columns; although, for its use, a singlecolumn, brought together by adding or subtracting both of them, will suffice.
[Heiberg, 1898–1903, II, 429]
In other words, the goal of the tables in the Almagest is to model the components of the geometricaldiagrams in such a way that the reader may follow, numerically, how the irregular motions that are apparentare actually composed out of more uniform motions, and ultimately related to the uniform motion of thereference circle. The contrast is made clear when we compare this with the practical goals of the HandyTables. In the Handy Tables, a function equivalent to s is tabulated directly (Neugebauer, 1975, 1002),saving us one entry into the table and one calculation in the algorithm, but concealing what the table in theAlmagest makes clear — namely, that the mathematically regular motion of S about E is first displaced bythe displacement of the observer to T and then again by the displacement of the physical motion from S
to C, centered on a new point D, midway between E and T .

Author's personal copy
30 N. Sidoli / Historia Mathematica 41 (2014) 13–37
Almagest V.7–8 With respect to mathematical methods, one of the most impressive tables in the Almagestis that for the complete lunar anomaly, Almagest V.8. In this table, Ptolemy elegantly arranges the correc-tions for both of the lunar anomalies in a single table so that the “common numbers” can represent eitherdouble the mean elongation, later known as the centrum, c = 2η = 2( ¯λ� − ¯λ�), or the true anomaly, α,and all of the irregular motions of the model are displayed in one glance against the mathematically reg-ular motion of the circle. This is the first table that incorporates a special method that Ptolemy used fortabulating a function of two variables in a single-entry table, called Ptolemaic interpolation by O. Pedersen(2010, 84–89). This table is also a good example of the claim I made above that the justification for thevalidity of the tabular methods must be based on a full assessment of the table nexus. In this section, I willpresent the description and layout of the table along with some discussion of the motivation, but in readingthe Almagest the motivation for the different components of the table does not become fully apparent untilwe also take into consideration the algorithm in the following section.
The derivation node for the lunar theory, Almagest V.6, is simply a computation that shows that giventhe centrum and mean anomaly, c and α, the equation of anomaly, q , can be computed through chord-tabletrigonometry (διὰ τῶν γραμμῶν) (Heiberg, 1898–1903, I, 380). The description component of the repre-sentation node, however, is fairly involved and makes it clear that the entries in the table will not alwayscorrespond directly to geometric objects in the model. Indeed, one of the columns, V.8 col6, will tabulatea fraction to be multiplied by col5 as a function of c and its motivation is not provided by the generalderivation. Ptolemy introduces the description, all of Almagest V.7, by noting that the corrections to themean motions can also be computed “through tabular methods” (διὰ τῆς κανονικῆς, literally by means oftabular things) (Heiberg, 1898–1903, I, 383), then in the course of this description, he provides a derivationof col6. Hence, in this case, the description of the overall table contains an internal derivation of a singlecolumn. As we will see, the “tabular methods” that Ptolemy discusses here are not simply a straightforwardmeans of computing values for the geometrical objects in the model, but are motivated by a number ofsupplementary considerations.
At issue is the fact that the lunar model has compound anomalies, because (1a) the epicycle of the moonrotates around a deferent (1b) the center of which itself rotates around the observer on earth, while (2) themoon’s motion on the epicycle is complicated by the fact that the mean apogee of the epicycle pointstowards a point which is not the center of either the ecliptic or the deferent.35 From the perspective oftrying to calculate the position of the moon on its epicycle, this means (1) that the apparent position ofthe moon on its epicycle is effected both by its angular location on the epicycle — its anomaly — and thedistance of the center of the epicycle from the earth, and (2) that the mean anomaly, reckoned from themean apogee of the epicycle, must be corrected to the true anomaly, as seen from the earth. The second ofthese issues is solved fairly simply by computing the correction to the mean anomaly as a function of thecentrum, which is tabulated in the 3rd column of Almagest V.8, col3(c).
For the first, consider Figure 7(a), in which we let D be the center of the deferent on which the epicycleof the moon is carried, T the observer on earth, N a point on DT extended such that DT = T N , C thecenter of the epicycle seen from the earth under angle c, Am the mean epicyclic apogee of the moon as seenfrom N , Av the true epicyclic apogee of the moon as seen from the earth, α the mean anomaly of the moonas measured from Am, α the true anomaly of the moon as measured from Av , and L the moon. Then theapparent position of the moon, which we seek, is given by correcting the mean longitude, λ, by c which is,in turn, corrected by q .
35 Ptolemy calls the orientation of the epicycle’s apogee, its πρόσνευσις, which means “an inclination, or verging, towards.”Whether or not this is a technical term of Ptolemy’s lunar theory, it is almost certainly adapted from the standard mathematicalνεῦσις, which is a line drawn under certain conditions such that when produced, it will go through a given point (Mugler, 1958,296). Tommer (1984, 43, n. 38) gives a discussion of Ptolemy’s various uses of prosneusis.

Author's personal copy
N. Sidoli / Historia Mathematica 41 (2014) 13–37 31
Figure 7. Simplified diagrams of Almagest V.6–8 for computing the apparent position of the moon as a function of two variables,angular distance from true apogee, α, and position of the center of the epicycle, c. (a) Three locations of the moon with a givenanomaly α when the epicycle is at apogee, perigee and some place in between. (b) Three locations of the moon such that theequation of anomaly, qm, is maximized — that is, T L is tangent to the epicycle — when the epicycle is at apogee, perigee andsome place in between.
As the diagram makes clear, the magnitude of q is primarily determined by the true anomaly, α, butalso somewhat determined by the location of the epicycle on its orbit, c. For example, in Figure 7(a), ifwe consider the situation where the moon is at the same location on its epicycle in a number of differentpositions of c, say at L and also at apogee and perigee, La and Lp , then it is clear that the primary variableis α, but that for a given α, there is a minor correction that varies from being least at apogee to being greatestat perigee, qa < q < pp . That is, the equation of anomaly is a function of two variables, q(c,α), where α
is strong and c is weak. Although modern scholars have characterized the difference between Ptolemy’sstrong and weak variables analytically and graphically (Pedersen, 2010, 85–86; Van Brummelen, 1994,299–301), it is likely Ptolemy’s concept of this distinction was based on a mathematical investigation ofthe geometrical characteristics of the model.
In order to fully tabulate such a function as a double-entry table of two variables, using the same levelof precision as found in the other tables, we would require a double-entry table of at least 45 rows and 45columns, or 2025 entries, which would be cumbersome to compute and tedious to use. In order to get aroundthis problem, Ptolemy has a way of exploiting the fact that c is a weak variable to produce a single-entrytable for q(c,α). He uses three columns, Almagest V.8 col4, col5, and col6, where the argument for col4 andcol5 is the true anomaly, α, and that for col6 is the centrum, c, but all are arranged in the same table, witharguments given as “common numbers.” In this way, col4 tabulates the value of the correction at the apogee,qa , for 45 values of α between 6◦ and 180◦, col4(a) = q(0◦, α); col5 tabulates the value of the differencebetween correction at the perigee and the correction at apogee, qp − qa , for 45 values of α between 6◦ and180◦, col5(a) = q(180◦, α) − q(0◦, α). Hence, col5 tabulates the greatest possible correction to q for eachvalue α, which only applies in the case where the epicycle is a perigee. In all other cases, the correctionwill be some fraction of this.
In order to tabulate this fraction, Ptolemy simply assumes that the corrections will vary from qa , throughq to qp in the same way for every value of α as it does for those values of α that maximize q — that is,when T L is tangent to the epicycle; see Figure 7(b). Ptolemy then gives a derivation of this fraction, by

Author's personal copy
32 N. Sidoli / Historia Mathematica 41 (2014) 13–37
showing how it can be calculated for a single example. Using c = 120◦ as an example, in Almagest V.7,Ptolemy calculates the excess of the maximum value of the equation of anomaly, qm, at c = 120◦ over itsmaximum value at apogee, qmp , as a fraction of its maximum value at perigee over its maximum at apogee,qma , which he expresses in sixtieths. He states that this value will be put in col6 corresponding to c = 120◦(Heiberg, 1898–1903, I, 385–388). He then says,
In a similar way (ὡσαύτως),36 the calculations of the remaining sections, the fraction (μέρη) of the differ-ence of the two anomalies, in turn, obtained in the same way — we placed them, as sixtieths of each of thestated differences, besides the appropriate “numbers” . . .
[Heiberg, 1898–1903, I, 388]
Hence, col6 tabulates the fraction by which each of the values in col5, the differences, must be multipliedfor each value of c, in minutes and seconds. In general,
col6(c) = qm(c) − qm(0◦)qm(180◦) − qm(0◦)
· 60, or, in the case of the moon,
= qm(c) − 5;12;39
· 60.
As G. Van Brummelen (1994, 297–305) has shown, however, Ptolemy almost certainly did not calculatethe 45 entries in V.8 col6 from scratch each time using chord-table trigonometry. Instead, since the trigono-metric calculation depends critically on a value for qm, he appears to have first calculated a table of qm(c)
at intervals of 12◦ and then used linear interpolation to calculate the intermediate values of qm. Indeed,since the way in which the apparent size of the epicycle changes as the epicycle is carried on the deferent isa crucial characteristic of an epicycle model, it is not unlikely that Ptolemy was in the habit of constructingsuch tables to help himself understand how this variable changes under various assumptions for the param-eters of the model. In this way, we see that tables played a key role not only in Ptolemy’s presentation ofhis findings, but also in his research methods.
The final column, Almagest V.8 col7, tabulates the correction to the mean latitude, calculated from thenorthernmost point of the moon’s orbit. There is no need, at this juncture, to discuss it further.
The structure of the table of the compete lunar anomaly not only allows us to calculate a function of twovariables with a single-entry table, it also allows us to see the irregular motions of the moon tabulated nextto one another as a function of the mathematically regular motion of the circle. By studying the numbersin the table, we can see how the various functions are related to one another — where their extrema lie,and the relative rates of change. For example, we can clearly see that the correction to the mean anomalyhas its maximum around 114◦, its minimum around 246◦, disappears at both apogee and perigee, and thatthe rate of change is greater around the perigee than around the apogee, which explains why the table has6◦ intervals at the apogee and 3◦ intervals at the perigee.37 Once again, an important goal of the table is apresentation of quantitative information such that we may apprehend the actual regularities underlying theapparently irregular motions of the moon.
From the perspective of quantitative information, a modern reader would probably prefer to see thenumerical information found in the table of complete lunar anomaly presented in a graph, as Figure 8. It
36 Toomer (1984, 237) translated this with “in exactly the same way,” which is possible but not necessary. Since, as is discussedbelow, Ptolemy did not, in fact, calculate all of the values in this table in exactly the same way as his example, it seems more fittingto translate with the looser reading.37 Ptolemy explicitly states that the table of solar anomaly is so constructed for the same reason (Heiberg, 1898–1903, I, 251–252).See page 22, above.

Author's personal copy
N. Sidoli / Historia Mathematica 41 (2014) 13–37 33
Figure 8. Graphical representation of Almagest V.8. In the table, only one set of absolute values is given, 0–180 and 360–180,which must be understood as either additive or subtractive corrections. The values in col6 have been modified so that they nowrepresent tenths. The values in col7 are understood as either displacements to the north or to the south, with the limits noted at thetop and bottom of the table.
should be pointed out, however, that a table format is better at presenting some information than a graph. Forexample, simply by looking at Figure 8 one might well think that the maximum of the epicyclic equationis at 90◦, whereas it is clear in the table that it occurs at 96◦. In the table, it is clear that the maximumof the increment occurs yet later, at 102◦, although in the graph this maximum is difficult to see. Also, inorder to graph the fractions that are multiplied by the increment, called “sixtieths” in the table, we need tomultiply through by some factor. If we left them at their absolute value, they would simply appear in thegraph as a straight line around 0, whereas if we graphed the sixtieths as integers, the y-axis of the graphwould be so tall that the other curves would hardly be visible. In Figure 8, I have avoided these issues byrepresenting these fractions as values between 0 and 10, so that we must now read the y-axis of the graphhas representing both units and tenths.
As these examples make clear, the representation node of the table nexus simultaneously plays twoessential roles. It both represents our developed knowledge of the mathematical objects, and it provides uswith a computational tool for producing new knowledge about these objects.
2.3.3. Evaluation: Almagest V.9In order to understand how the table represents the motions in the model, we must consider the diagram
and the table together, mediated by a reading of the algorithm. The algorithm, as a general set of instructionsfor using the table, shows us how the individual columns of the table are computed with given values toproduce sought values. We can write this out as a set of instructions, following Ptolemy’s practice, or anequation, following modern practice. It does not seem to me to make much conceptual difference which weuse, as long as we interpret the equation as a computational rule. As an example, I will use the algorithm forproducing the apparent longitude of the moon, λ�, from the table of complete lunar anomaly, Almagest V.8.
In Almagest V.9, Ptolemy describes how to use Almagest V.8 along with values for change in meanlongitude, �λ, mean elongation, η = λ� − λ�, mean anomaly, α, and mean argument of latitude, ω′, tocalculate the apparent position of the moon, L(λ,β). For the purposes of this example, we will neglectthe computation of β , which is simple. The procedure for longitude is as follows (Heiberg, 1898–1903, I,392–393):38
1. For the time in question, use the table of mean motions, Almagest IX.4, to calculate the change in meanlatitude since epoch, �λ, and the mean anomaly, and elongation, reckoned from epoch, α and η, all asfunctions of time elapsed since epoch, �t .
38 Examples of how to use the table to compute actual positions have been given by Neugebauer (1975, 96) and Toomer (1984,682).

Author's personal copy
34 N. Sidoli / Historia Mathematica 41 (2014) 13–37
2. Double the mean elongation to determine the argument for col3 and col6, c = 2η mod 360.3. Determine the true anomaly as the argument for col4 and col5 from the mean anomaly and col3, as39
α = α + col3(c) mod 360.
4. Determine the approximate equation of anomaly as a function of both anomaly and twice the meanelongation, as
qtable = col4(α) + col(α)5 col6(c).
5. Find the apparent longitude as reckoned from the mean longitude at epoch, λepoch = Tau11;22◦(41;22◦),40 by adding to it the change in mean longitude and the approximate equation of anomaly,
λ = 41;22◦ + �λ + qtable mod 360.
Without much change in meaning, we may also express this procedure as a single equation,
λ = 41;22◦ + λ + (col4
(col3(α)
) + col5(col3(α)
)col6(c)
)mod 360
which is the tabular means of representing the following equation:
λ = 41;22◦ + λ +(q(0◦, α(α)
) + (q(180◦, α(α)
) − q(0◦, α(α)
))qm(c)5;1
2;3960
)mod 360.
By following through the algorithm and thinking about its implications — or by looking at the equa-tion — we can get a better sense for Ptolemy’s motivation in arranging Almagest V.8. Although I sketchedsome of the motivation in my discussion of the representation node of the table of compete lunar anomaly,above, Ptolemy himself makes relatively few remarks about why he proceeds as he does. Nevertheless,when we consider how the algorithm specifies the use of the individual columns, we see that, in Figure 7,the mean longitude is corrected first by the value of q when the epicycle is at its apogee, qa , which is in turncorrected by the total difference of q at perigee and apogee, pp −qa , multiplied by a fraction that representsthe effect of c on the value of q , namely (qm − qma )/(qmp − qma). Hence, it is clear that a full understand-ing of the table has to be composed from a synthesis of all the parts of its nexus: its derivation from thegeometrical model, which is represented in certain columns, and the recombination of these columns in aset of rules that clarifies how the columns are related to the model.
3. Conclusion
With these discussions, it has become clear that tables were a crucial feature of Ptolemy’s account of thecelestial motions. Tables, in conjunction with the other parts of the table nexus, allow us to visualize theinner, and fundamental, regularity, of what are only apparently irregular motions. Indeed, in the Almagesttables — such as V.8 or XI.11 — all of the various anomalies are relational functions of the uniformprogression of the circle. These tables allow us to grasp, in a single visual presentation,41 how increasingly
39 Here and below Ptolemy does not explicitly state that this is taken mod 360, but at this point it goes without saying.40 This was determined in Almagest IV.4.41 For Ptolemy’s views of the importance of sight in apprehending rational objects, see Harmonics III.3 (Düring, 1930, 91–94).

Author's personal copy
N. Sidoli / Historia Mathematica 41 (2014) 13–37 35
anomalistic motions can be demonstrated to be in accordance with the principle of regular circular motion,which is the most basic, rational principle in operation.42
This is most clearly revealed when we contrast the tables in the Almagest with those in the Handy Ta-bles.43 The Handy Tables, were meant to codify the theoretical advances Ptolemy had made in mathematicalastronomy in a format optimized for the tabular methods employed by individuals who were interested incalculating the positions of the celestial bodies but were largely uninterested in the underlying theory, suchas professional astrologers.44 They were also meant to show that purely tabular astronomy could be broughtinto conformity with what Ptolemy regarded as good astronomical practice. That is, they were meant to becontrasted with various other traditions of tables in Greco-Roman Egypt that were not based on regularcircular motion — such as Greek translations of Babylonian mathematical astronomy or tables of solar orlunar motion that directly tabulated apparent anomalistic motion from epochs that were themselves calcu-lated with a separate table (Jones, 1997a, 1997b, 1999b). The Handy Tables made it easier to calculate therising and culminating signs and the positions of the celestial bodies, using computational and graphicalmethods, but they did this at the expense of spreading tables out over many pages to eliminate interpola-tion and combining different effects into a single column to eliminate excess calculation. Using the HandyTables, it is no longer possible to perceive in one view how all of the compound motions are the result ofregular circular motions.
In the Almagest, tables are one type of unit of mathematical text, which are used with other units, in-cluding other tables, as part of the overall deductive architecture of the treatise (see Section 2.2, especiallyFigure 3). Within this structure, tables function in a similar way as theorems in more canonical texts, suchas the Elements. Some tables, such as the tables of mean motions, Almagest III.2, IV.4, IX.4, act more likelemmas — they are useful for further work, but are not intrinsically interesting. Other tables, such as thetable of zenith distances and ecliptic angles, Almagest II.13, act analogously to certain culminating theo-rems in a theory — they set out a representational function as a goal of the investigation, although theymay not be much used for further work. The most significant tables, however, such as the tables of solaranomaly, Almagest III.6, or the tables of rising times, II.8, are like an important theorem — they are bothpresentations of acquired mathematical knowledge and tools for producing new mathematical results.
It is clear that Ptolemy’s articulation of tabular methods had a lasting effect on the Greek mathematicalsciences. Although purely tabular methods, which appear to have been more popular and were more ef-fective in astrology,45 continued to be used, it was Ptolemy’s Almagest and Handy Tables that received themost serious attention from expert scholars (Jones, 1999c, 160–168), and which were translated into Arabicand Latin. Since the Almagest became canonical in the curriculums of mathematics adopted by mathemat-ical scholars like Pappus and Theon of Alexandria, and made explicit by the Arabic collection known asthe Middle Books, Ptolemy’s table nexus and tabular ways of working with functions formed a core part
42 Ptolemy’s claim that regular circular motion — understood now in a mathematical, as opposed to physical or theologicalsense — is the most basic principle is not fully developed until Almagest IX.2 (Heiberg, 1898–1903, II, 208–213).43 A technical overview of the Handy Tables has been given by Neugebauer (1975, 969–1028). There is still no complete criticaledition of the Handy Tables. The first edition of the tables was made by N.B. Halma (1822, 1823–1825), on the basis of a latemanuscript. A study, and translation, of the tables in Vatican gr. 1291 was made by Stahlman (1960) in his Ph.D. dissertation. Tihon(2011) and Mercier (2011) have completed the first part of a critical edition, starting with the tables of rising times, which Ptolemytells us were the first tables in his work. Ptolemy’s introduction to the Handy Tables, which was often transmitted independently,has been edited by Heiberg (1907, 159–185).44 The claim by Bernard (2010) that professional astrologers made up the main readership of the Almagest should be treated withskepticism. There is almost nothing of use for astrologers in this text and it is rather heavy going for anyone who is not interested inmathematical demonstrations of the underlying theory. It seems, rather, that Ptolemy composed his Mathematical Treatise in FourBooks and his Handy Tables to be of more interest to astrologers.45 The popularity of purely tabular methods can be drawn from a consideration of the astronomical papyri, especially those fromOxyrhynchus (Jones, 1999a, 1999c).

Author's personal copy
36 N. Sidoli / Historia Mathematica 41 (2014) 13–37
of the mathematical education of countless scholars from the late ancient to the early modern periods. Inorder to understand how these mathematicians thought about the relationship between geometric objects,or motions, and the relational functions made up of sets of numbers that represented these, we can do wellto start with a reading of Ptolemy’s use of tables in the Almagest.
Acknowledgments
The research for this paper was undertaken as part of a larger project called “Histoire des tables numériques,”2009–2013, funded by the French National Research Agency. I would like to thank various colleagues in this projectwho helped me formulate my ideas over the course of a number of presentations and discussions — particularly,Karine Chemla, Matthieu Husson, Clemency Montelle, Micah Ross, and Glen Van Brummelen. I would also like tothank this journal’s two anonymous referees for various suggestions for improving the paper.
References
Ancient mathematical works referenced by title
Almagest, Ptolemy: Heiberg (1898–1903), Toomer (1984).Data, Euclid. Menge (1896), Taisbak (2003).
Medieval manuscripts
Paris BnF gr. 2889: Parisinus graecus 2389. Bibliothèque nationale de France (BnF), mostly uncial, 9th century.Vatican gr. 1291: Vaticanus graecus 1291, uncial, late-8th–9th century, with a few later additions.
Modern scholarship
Acerbi, F., 2007. Euclide, Tutte le opere. Bompiani, Milano.Berggren, J.L., Sidoli, N., 2007. Aristarchus’s On the Sizes and Distances of the Sun and the Moon: Greek and Arabic
texts. Arch. Hist. Exact Sci. 61, 213–254.Bernard, A., 2010. The significance of Ptolemy’s Almagest for its early readers. Rev. Synth. 131, 495–521.Bowen, A., 2012. Simplicius on the Planets and Their Motions. Brill, Leiden.van Dalen, B., 1994. On Ptolemy’s table for the equation of time. Centaurus 37, 97–153.Düring, I., 1930. Die Harmonielehre des Klaudios Ptolemaios. Elanders, Götenborg.Feke, J., Jones, A., 2010. Ptolemy. In: Gerson, L.P. (Ed.), The Cambridge History of Philosophy in Late Antiquity,
vol. 1. Cambridge University Press, Cambridge, pp. 197–209.Halma, N.B., 1822. Commentaire de Théon d’Alexandrie, sur les tables manuelles astronomiques de Ptolemée. Mer-
lin, Paris.Halma, N.B., 1823–1825. Tables manuelles astronomiques de Ptolemée et de Théon, 2 vols. Bobee et Eberhart, Paris.Hankel, H., 1874. Zur Geschichte der Mathematik in Altertum und Mittelalter. Teubner, Leipzig. Reprinted: Olms,
Hildesheim, 1965.Heiberg, J.L., 1898–1903. Claudii Ptolemaei Syntaxis mathematica. Teubner, Leipzig.Heiberg, J.L., 1907. Claudii Ptolemaei Opera astronomica minora. Teubner, Leipzig.Jones, A., 1997a. Studies in the astronomy of the Roman period: I. The standard Lunar scheme. Centaurus 39, 1–36.Jones, A., 1997b. Studies in the astronomy of the Roman period: II. Tables for Solar longitude. Centaurus 39, 211–229.Jones, A., 1999a. Astronomical Papyri from Oxyrhynchus. American Philosophical Society, Philadelphia.Jones, A., 1999b. A classification of astronomical tables on papyrus. In: Swerdlow, N.M. (Ed.), Ancient Astronomy
and Celestial Divination. MIT Press, Cambridge, MA, pp. 299–340.Jones, A., 1999c. Uses and users of astronomical commentaries in antiquity. In: Most, G.W. (Ed.), Commentaries –
Kommentare. Vandenhoeck & Ruprecht, Göttingen, pp. 163–172.
Author's personal copy
N. Sidoli / Historia Mathematica 41 (2014) 13–37 37
Jones, A., 2005. Ptolemy’s mathematical models and their meaning. In: Kinyon, M., Van Brummelen, G. (Eds.),Mathematics and the Historian’s Craft. Springer, New York, pp. 23–42.
Jones, A., 2006. The Keskintos astronomical inscription: Text and interpretations. SCIAMVS 7, 3–41.Lehoux, D., 2007. Astronomy, Weather, and Calendars. Cambridge University Press, Cambridge.Lehoux, D., 2012. What Did the Romans Know? Chicago University Press, Chicago.Menge, H., 1896. Euclidis Data cum commentario Marini et scholiis antiquis. Teubner, Leipzig.Mercier, R., 2011. Ptolemy’s Handy Tables, Volume 1b, Tables A1–A2. Institute Orientaliste, Lourvain.Mugler, C., 1958. Dictionnaire historique de la terminologie géométrique des grecs. C. Klinckseick, Paris.Murschel, A., 1995. The structure and function of Ptolemy’s physical hypotheses of planetary motion. J. Hist. As-
tron. 24, 33–61.Neugebauer, O., 1975. A History of Ancient Mathematical Astronomy. Springer, New York.Newton, R.R., 1985. The Origins of Ptolemy’s Astronomical Tables. Johns Hopkins University, Baltimore.Pedersen, O., 1974. Logistics and the theory of functions: An essay in the history of Greek mathematics. Arch. Int.
Hist. Sci. 24, 29–50.Pedersen, O., 2010. A Survey of the Almagest, with Annotation and a New Commentary. Edited by A. Jones. Springer,
New York. Reprint with additions of the 1975 edition.Stahlman, W.D., 1960. The Astronomical Tables of Codex Vaticanus graecus 1291. Ph.D. Thesis. Brown University.Taisbak, C.M., 2003. Euclid’s Data, Or the Importance of Being Given. Museum Tusculanum Press, Copenhagen.Tihon, A., 2011. Les Tables Faciles de Ptolémée, Volume 1a, Tables A1–A2. Institute Orientaliste, Lourvain.Toomer, G.J., 1984. Ptolemy’s Almagest. Duckworth, London. Reprinted: Princeton University Press, Princeton,
1998.Van Brummelen, G., 1993. Mathematical Tables in Ptolemy’s Almagest. Ph.D. Thesis. Simon Fraser University, De-
partment of Mathematics and Statistics.Van Brummelen, G., 1994. Lunar and planetary interpolation tables in Ptolemy’s Almagest. J. Hist. Astron. 25,
297–311.Van Brummelen, G., 2009. The Mathematics of the Heavens and the Earth. Princeton University Press, Princeton.