Mathematical Processess - Sample Adjusted Lessons -...
25
Transcript of Mathematical Processess - Sample Adjusted Lessons -...
Mathematical Process Grade 9 Applied TIPS4RM Lesson
Reasoning and Proving Unit 4 Day 1
Reflecting Unit 1 Day 3
Selecting Tools and Computational Strategies Unit 2 Day 1
Connecting Unit 8 Day 8
Representing Unit 7 Day 4
TIPS4RM: Grade 9 Applied – Proportional Reasoning: Ratio, Rate, and Proportion 07/06/2007 1
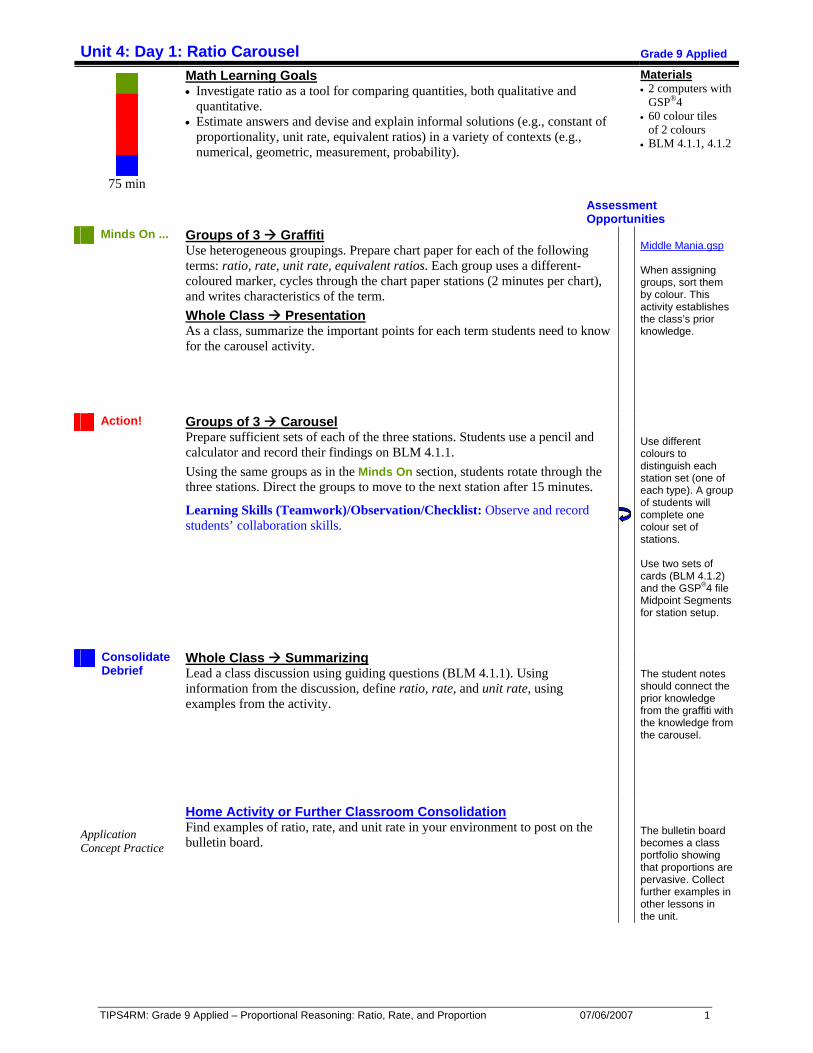
Unit 4: Day 1: Ratio Carousel Grade 9 Applied
75 min
Math Learning Goals • Investigate ratio as a tool for comparing quantities, both qualitative and
quantitative. • Estimate answers and devise and explain informal solutions (e.g., constant of
proportionality, unit rate, equivalent ratios) in a variety of contexts (e.g., numerical, geometric, measurement, probability).
Materials • 2 computers with
GSP®4 • 60 colour tiles
of 2 colours • BLM 4.1.1, 4.1.2
Assessment Opportunities
Minds On ... Groups of 3 Graffiti Use heterogeneous groupings. Prepare chart paper for each of the following terms: ratio, rate, unit rate, equivalent ratios. Each group uses a different-coloured marker, cycles through the chart paper stations (2 minutes per chart), and writes characteristics of the term. Whole Class Presentation As a class, summarize the important points for each term students need to know for the carousel activity.
Action! Groups of 3 Carousel Prepare sufficient sets of each of the three stations. Students use a pencil and calculator and record their findings on BLM 4.1.1. Using the same groups as in the Minds On section, students rotate through the three stations. Direct the groups to move to the next station after 15 minutes.
Learning Skills (Teamwork)/Observation/Checklist: Observe and record students’ collaboration skills.
Consolidate Debrief
Whole Class Summarizing Lead a class discussion using guiding questions (BLM 4.1.1). Using information from the discussion, define ratio, rate, and unit rate, using examples from the activity.
Middle Mania.gsp When assigning groups, sort them by colour. This activity establishes the class’s prior knowledge. Use different colours to distinguish each station set (one of each type). A group of students will complete one colour set of stations. Use two sets of cards (BLM 4.1.2) and the GSP®4 file Midpoint Segments for station setup. The student notes should connect the prior knowledge from the graffiti with the knowledge from the carousel.
Application Concept Practice
Home Activity or Further Classroom Consolidation Find examples of ratio, rate, and unit rate in your environment to post on the bulletin board.
The bulletin board becomes a class portfolio showing that proportions are pervasive. Collect further examples in other lessons in the unit.
Grade 9 Applied Unit 4 Adjusted Lesson: Mathematical Processes – Reasoning and Proving 07/06/2007 2
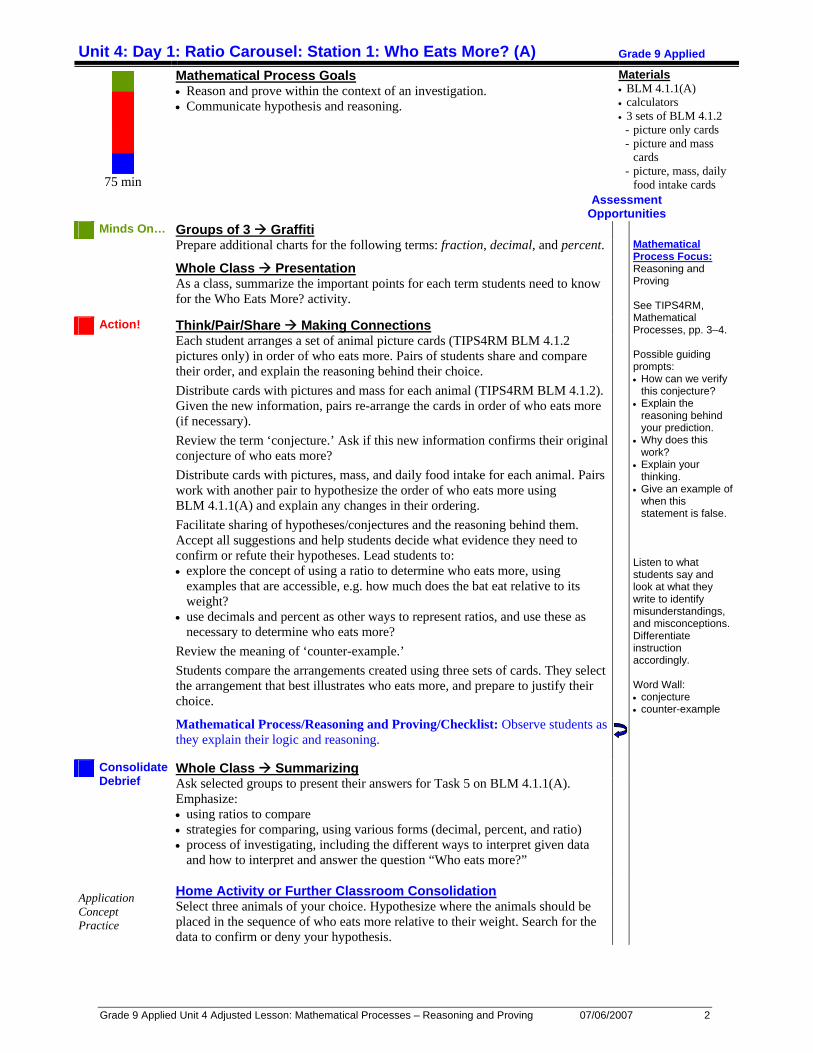
Unit 4: Day 1: Ratio Carousel: Station 1: Who Eats More? (A) Grade 9 Applied
75 min
Mathematical Process Goals • Reason and prove within the context of an investigation. • Communicate hypothesis and reasoning.
Materials • BLM 4.1.1(A) • calculators • 3 sets of BLM 4.1.2
- picture only cards - picture and mass
cards - picture, mass, daily
food intake cards Assessment Opportunities
Minds On… Groups of 3 Graffiti Prepare additional charts for the following terms: fraction, decimal, and percent.
Whole Class Presentation As a class, summarize the important points for each term students need to know for the Who Eats More? activity.
Action! Think/Pair/Share Making Connections Each student arranges a set of animal picture cards (TIPS4RM BLM 4.1.2 pictures only) in order of who eats more. Pairs of students share and compare their order, and explain the reasoning behind their choice. Distribute cards with pictures and mass for each animal (TIPS4RM BLM 4.1.2). Given the new information, pairs re-arrange the cards in order of who eats more (if necessary). Review the term ‘conjecture.’ Ask if this new information confirms their original conjecture of who eats more? Distribute cards with pictures, mass, and daily food intake for each animal. Pairs work with another pair to hypothesize the order of who eats more using BLM 4.1.1(A) and explain any changes in their ordering. Facilitate sharing of hypotheses/conjectures and the reasoning behind them. Accept all suggestions and help students decide what evidence they need to confirm or refute their hypotheses. Lead students to: • explore the concept of using a ratio to determine who eats more, using
examples that are accessible, e.g. how much does the bat eat relative to its weight?
• use decimals and percent as other ways to represent ratios, and use these as necessary to determine who eats more?
Review the meaning of ‘counter-example.’ Students compare the arrangements created using three sets of cards. They select the arrangement that best illustrates who eats more, and prepare to justify their choice.
Mathematical Process/Reasoning and Proving/Checklist: Observe students as they explain their logic and reasoning.
Consolidate Debrief
Whole Class Summarizing Ask selected groups to present their answers for Task 5 on BLM 4.1.1(A). Emphasize: • using ratios to compare • strategies for comparing, using various forms (decimal, percent, and ratio) • process of investigating, including the different ways to interpret given data
and how to interpret and answer the question “Who eats more?”
Mathematical Process Focus: Reasoning and Proving See TIPS4RM, Mathematical Processes, pp. 3–4. Possible guiding prompts: • How can we verify
this conjecture? • Explain the
reasoning behind your prediction.
• Why does this work?
• Explain your thinking.
• Give an example of when this statement is false.
Listen to what students say and look at what they write to identify misunderstandings, and misconceptions. Differentiate instruction accordingly. Word Wall: • conjecture • counter-example
Application Concept Practice
Home Activity or Further Classroom Consolidation Select three animals of your choice. Hypothesize where the animals should be placed in the sequence of who eats more relative to their weight. Search for the data to confirm or deny your hypothesis.
Grade 9 Applied Unit 4 Adjusted Lesson: Mathematical Processes – Reasoning and Proving 07/06/2007 3
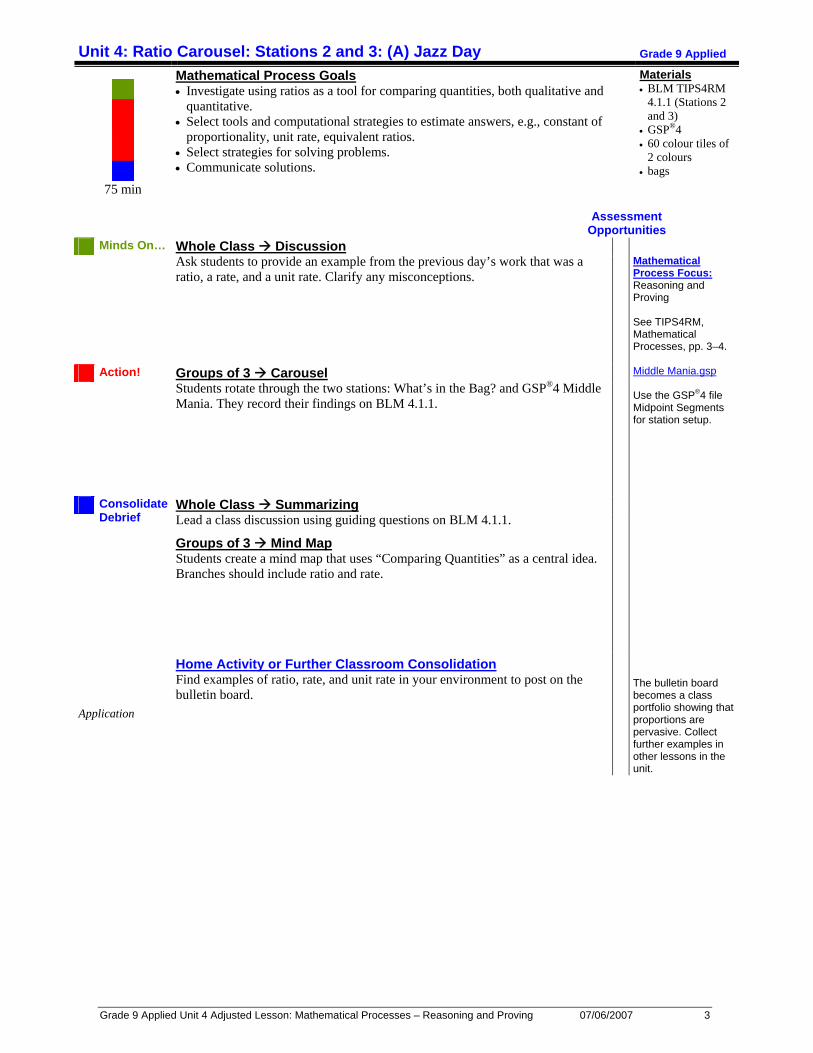
Unit 4: Ratio Carousel: Stations 2 and 3: (A) Jazz Day Grade 9 Applied
75 min
Mathematical Process Goals • Investigate using ratios as a tool for comparing quantities, both qualitative and
quantitative. • Select tools and computational strategies to estimate answers, e.g., constant of
proportionality, unit rate, equivalent ratios. • Select strategies for solving problems. • Communicate solutions.
Materials • BLM TIPS4RM
4.1.1 (Stations 2 and 3)
• GSP®4 • 60 colour tiles of
2 colours • bags
Assessment Opportunities
Minds On… Whole Class Discussion Ask students to provide an example from the previous day’s work that was a ratio, a rate, and a unit rate. Clarify any misconceptions.
Action! Groups of 3 Carousel Students rotate through the two stations: What’s in the Bag? and GSP®4 Middle Mania. They record their findings on BLM 4.1.1.
Consolidate Debrief
Whole Class Summarizing Lead a class discussion using guiding questions on BLM 4.1.1.
Groups of 3 Mind Map Students create a mind map that uses “Comparing Quantities” as a central idea. Branches should include ratio and rate.
Mathematical Process Focus: Reasoning and Proving See TIPS4RM, Mathematical Processes, pp. 3–4. Middle Mania.gsp Use the GSP®4 file Midpoint Segments for station setup.
Application
Home Activity or Further Classroom Consolidation Find examples of ratio, rate, and unit rate in your environment to post on the bulletin board.
The bulletin board becomes a class portfolio showing that proportions are pervasive. Collect further examples in other lessons in the unit.
Grade 9 Applied Unit 4 Adjusted Lesson: Mathematical Processes – Reasoning and Proving 07/06/2007 4
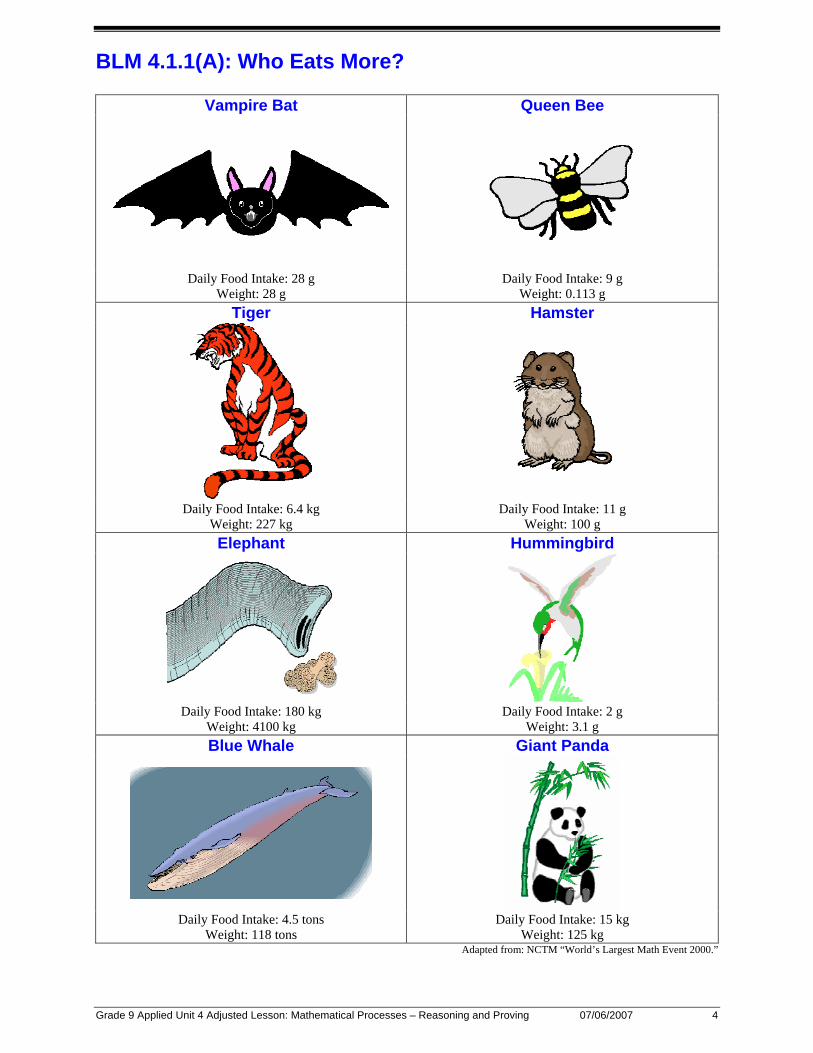
BLM 4.1.1(A): Who Eats More?
Vampire Bat Queen Bee
Daily Food Intake: 28 g Weight: 28 g
Daily Food Intake: 9 g Weight: 0.113 g
Tiger Hamster
Daily Food Intake: 6.4 kg Weight: 227 kg
Daily Food Intake: 11 g Weight: 100 g
Elephant Hummingbird
Daily Food Intake: 180 kg
Weight: 4100 kg Daily Food Intake: 2 g
Weight: 3.1 g Blue Whale Giant Panda
Daily Food Intake: 4.5 tons Weight: 118 tons
Daily Food Intake: 15 kg Weight: 125 kg
Adapted from: NCTM “World’s Largest Math Event 2000.”
Grade 9 Applied Unit 4 Adjusted Lesson: Mathematical Processes – Reasoning and Proving 07/06/2007 5
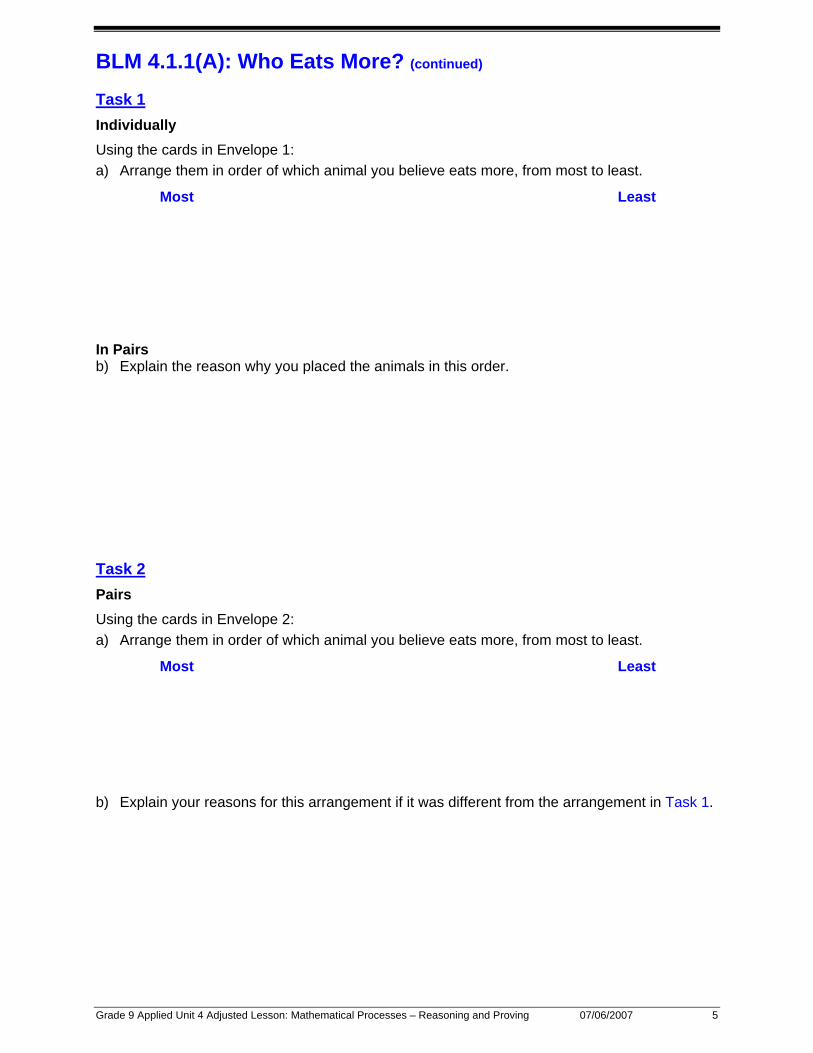
BLM 4.1.1(A): Who Eats More? (continued) Task 1 Individually Using the cards in Envelope 1: a) Arrange them in order of which animal you believe eats more, from most to least.
Most Least In Pairs b) Explain the reason why you placed the animals in this order. Task 2 Pairs Using the cards in Envelope 2: a) Arrange them in order of which animal you believe eats more, from most to least.
Most Least b) Explain your reasons for this arrangement if it was different from the arrangement in Task 1.
Grade 9 Applied Unit 4 Adjusted Lesson: Mathematical Processes – Reasoning and Proving 07/06/2007 6
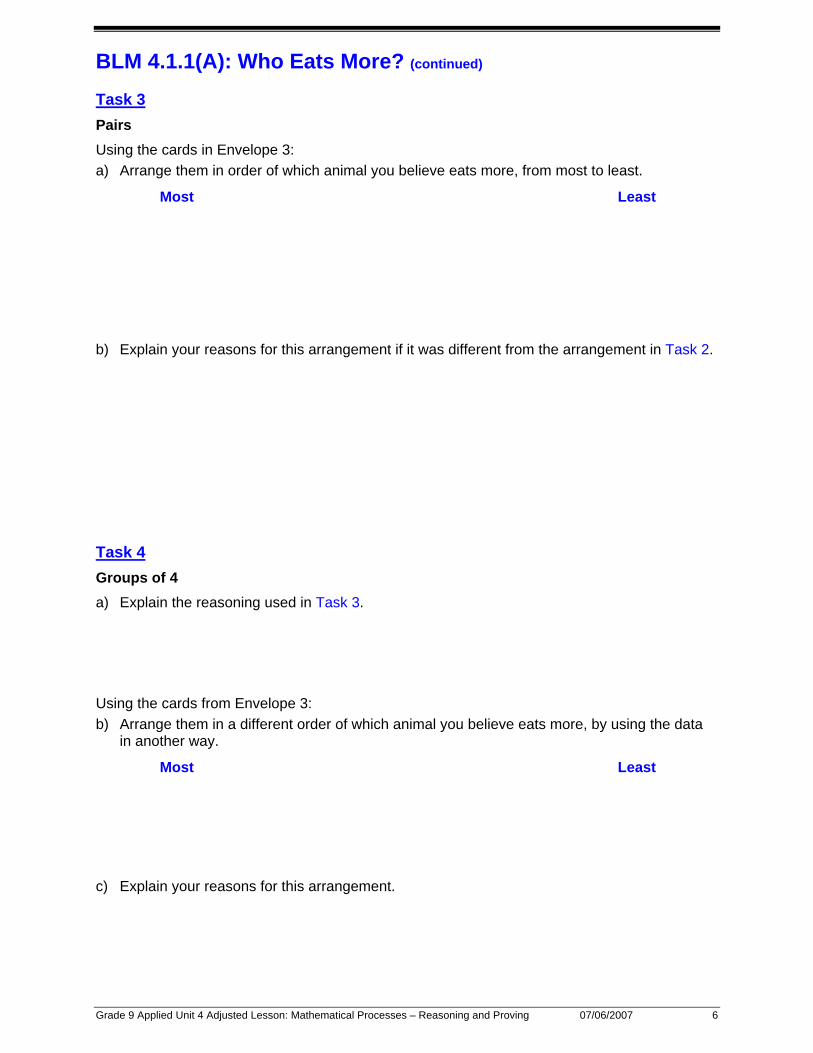
BLM 4.1.1(A): Who Eats More? (continued) Task 3 Pairs Using the cards in Envelope 3: a) Arrange them in order of which animal you believe eats more, from most to least.
Most Least b) Explain your reasons for this arrangement if it was different from the arrangement in Task 2. Task 4 Groups of 4 a) Explain the reasoning used in Task 3. Using the cards from Envelope 3: b) Arrange them in a different order of which animal you believe eats more, by using the data
in another way.
Most Least c) Explain your reasons for this arrangement.
Grade 9 Applied Unit 4 Adjusted Lesson: Mathematical Processes – Reasoning and Proving 07/06/2007 7
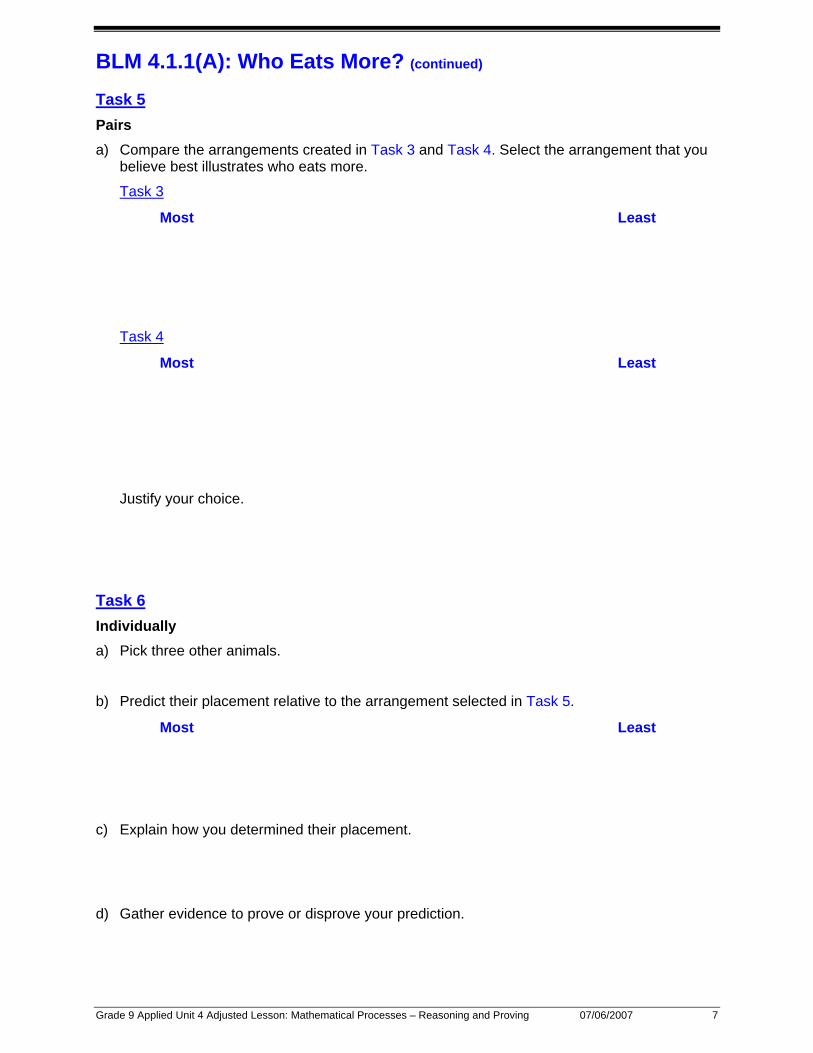
BLM 4.1.1(A): Who Eats More? (continued) Task 5 Pairs a) Compare the arrangements created in Task 3 and Task 4. Select the arrangement that you
believe best illustrates who eats more.
Task 3
Most Least
Task 4
Most Least
Justify your choice. Task 6 Individually a) Pick three other animals. b) Predict their placement relative to the arrangement selected in Task 5.
Most Least c) Explain how you determined their placement. d) Gather evidence to prove or disprove your prediction.
TIPS4RM: Grade 9 Applied – Measurement: 2-D and 3-D 07/06/2007 8
Unit 1: Day 3: Diagnostic to Activate Prior Knowledge on Composite Figures Grade 9 Applied
75 min
Math Learning Goals • Activate students’ prior knowledge of terminology related to identifying
geometry shapes. • Determine students’ readiness to identify geometric figures in composition, and
use appropriate calculations for perimeter and area.
Materials • BLM 1.3.1,
1.3.2, 1.3.3 • placemat • overhead
projector
Assessment Opportunities Minds On ...
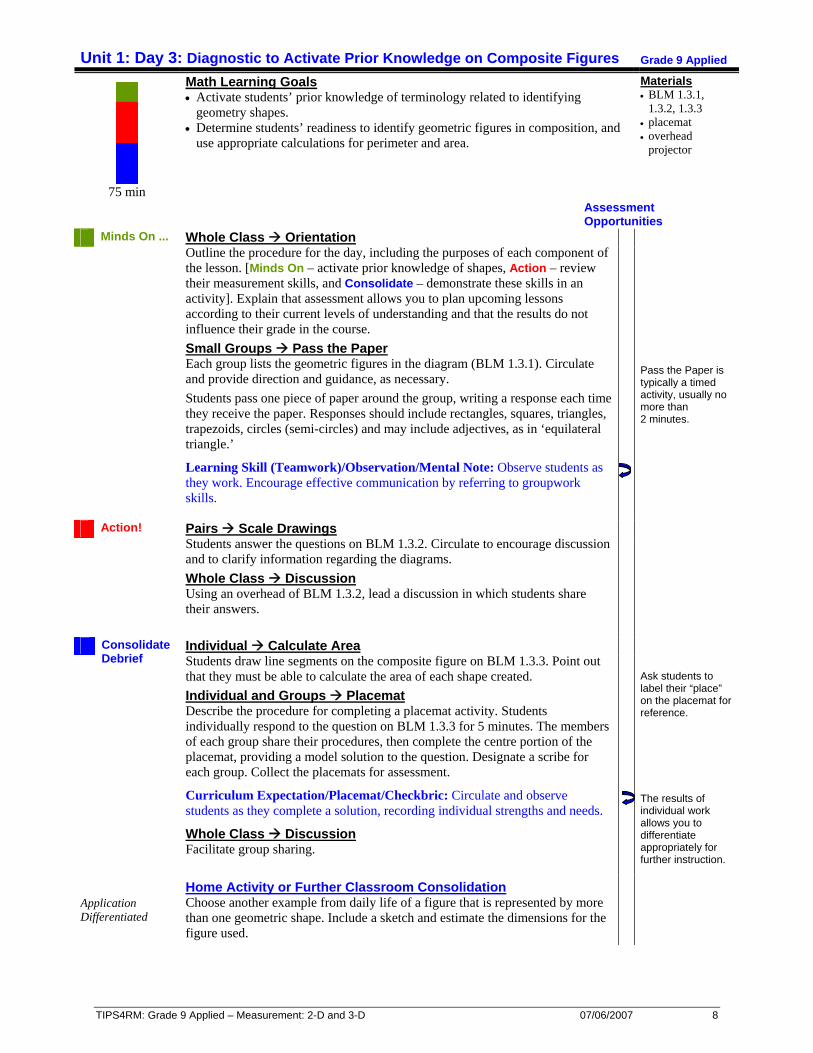
Whole Class Orientation Outline the procedure for the day, including the purposes of each component of the lesson. [Minds On – activate prior knowledge of shapes, Action – review their measurement skills, and Consolidate – demonstrate these skills in an activity]. Explain that assessment allows you to plan upcoming lessons according to their current levels of understanding and that the results do not influence their grade in the course. Small Groups Pass the Paper Each group lists the geometric figures in the diagram (BLM 1.3.1). Circulate and provide direction and guidance, as necessary. Students pass one piece of paper around the group, writing a response each time they receive the paper. Responses should include rectangles, squares, triangles, trapezoids, circles (semi-circles) and may include adjectives, as in ‘equilateral triangle.’
Learning Skill (Teamwork)/Observation/Mental Note: Observe students as they work. Encourage effective communication by referring to groupwork skills.
Action! Pairs Scale Drawings Students answer the questions on BLM 1.3.2. Circulate to encourage discussion and to clarify information regarding the diagrams. Whole Class Discussion Using an overhead of BLM 1.3.2, lead a discussion in which students share their answers.
Consolidate Debrief
Individual Calculate Area Students draw line segments on the composite figure on BLM 1.3.3. Point out that they must be able to calculate the area of each shape created. Individual and Groups Placemat Describe the procedure for completing a placemat activity. Students individually respond to the question on BLM 1.3.3 for 5 minutes. The members of each group share their procedures, then complete the centre portion of the placemat, providing a model solution to the question. Designate a scribe for each group. Collect the placemats for assessment.
Curriculum Expectation/Placemat/Checkbric: Circulate and observe students as they complete a solution, recording individual strengths and needs.
Whole Class Discussion Facilitate group sharing.
Pass the Paper is typically a timed activity, usually no more than 2 minutes. Ask students to label their “place” on the placemat for reference. The results of individual work allows you to differentiate appropriately for further instruction.
Application Differentiated
Home Activity or Further Classroom Consolidation Choose another example from daily life of a figure that is represented by more than one geometric shape. Include a sketch and estimate the dimensions for the figure used.
Grade 9 Applied Unit 1 Adjusted Lesson: Mathematical Processes – Reflecting 07/06/2007 9
Unit 1: Day 3: Diagnostic to Activate Prior Knowledge on Composite Figures (A) Grade 9 Applied
75 min
Mathematical Process Goals • Reflect and monitor thought processes used to solve a problem.
Materials • placemat • overhead
projector • chart paper
Assessment Opportunities
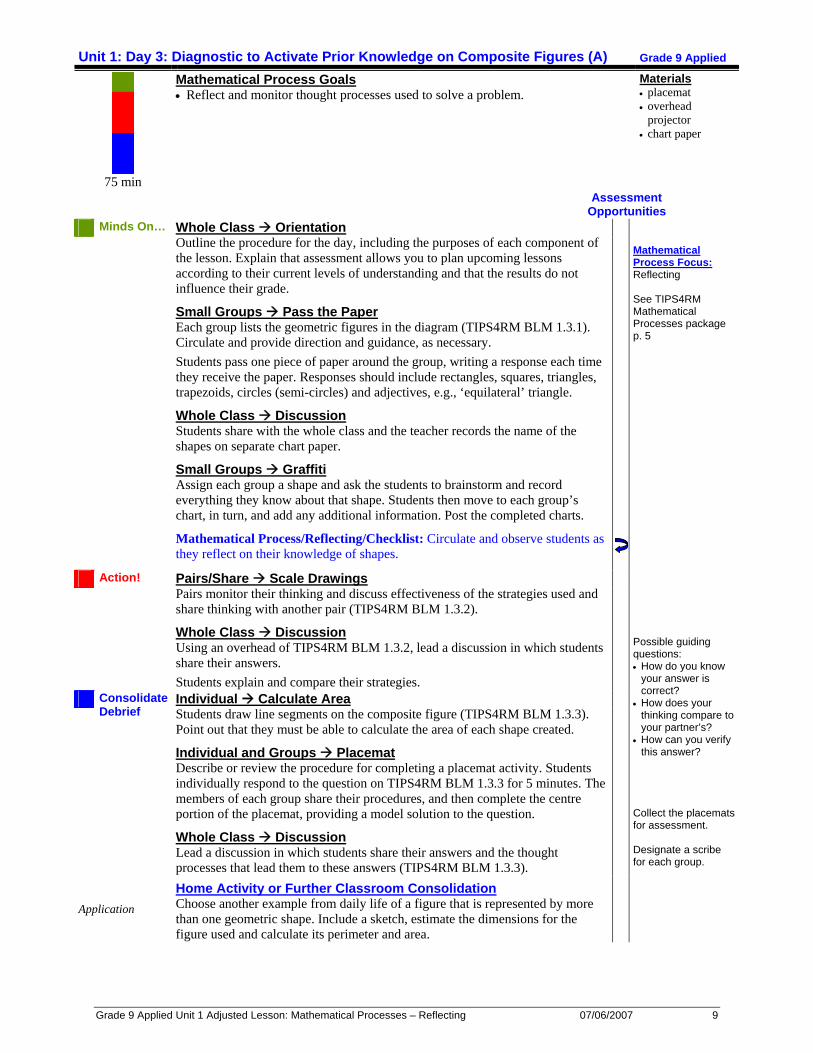
Minds On… Whole Class Orientation Outline the procedure for the day, including the purposes of each component of the lesson. Explain that assessment allows you to plan upcoming lessons according to their current levels of understanding and that the results do not influence their grade.
Small Groups Pass the Paper Each group lists the geometric figures in the diagram (TIPS4RM BLM 1.3.1). Circulate and provide direction and guidance, as necessary. Students pass one piece of paper around the group, writing a response each time they receive the paper. Responses should include rectangles, squares, triangles, trapezoids, circles (semi-circles) and adjectives, e.g., ‘equilateral’ triangle.
Whole Class Discussion Students share with the whole class and the teacher records the name of the shapes on separate chart paper.
Small Groups Graffiti Assign each group a shape and ask the students to brainstorm and record everything they know about that shape. Students then move to each group’s chart, in turn, and add any additional information. Post the completed charts.
Mathematical Process/Reflecting/Checklist: Circulate and observe students as they reflect on their knowledge of shapes.
Action! Pairs/Share Scale Drawings Pairs monitor their thinking and discuss effectiveness of the strategies used and share thinking with another pair (TIPS4RM BLM 1.3.2).
Whole Class Discussion Using an overhead of TIPS4RM BLM 1.3.2, lead a discussion in which students share their answers. Students explain and compare their strategies.
Consolidate Debrief
Individual Calculate Area Students draw line segments on the composite figure (TIPS4RM BLM 1.3.3). Point out that they must be able to calculate the area of each shape created.
Individual and Groups Placemat Describe or review the procedure for completing a placemat activity. Students individually respond to the question on TIPS4RM BLM 1.3.3 for 5 minutes. The members of each group share their procedures, and then complete the centre portion of the placemat, providing a model solution to the question.
Whole Class Discussion Lead a discussion in which students share their answers and the thought processes that lead them to these answers (TIPS4RM BLM 1.3.3).
Mathematical Process Focus: Reflecting See TIPS4RM Mathematical Processes package p. 5 Possible guiding questions: • How do you know
your answer is correct?
• How does your thinking compare to your partner’s?
• How can you verify this answer?
Collect the placemats for assessment. Designate a scribe for each group.
Application
Home Activity or Further Classroom Consolidation Choose another example from daily life of a figure that is represented by more than one geometric shape. Include a sketch, estimate the dimensions for the figure used and calculate its perimeter and area.
TIPS4RM: Grade 9 Applied: Measurement: Optimization 07/06/2007 10
Unit 2: Day 1: What Is the Largest Rectangle? Grade 9 Applied
75 min
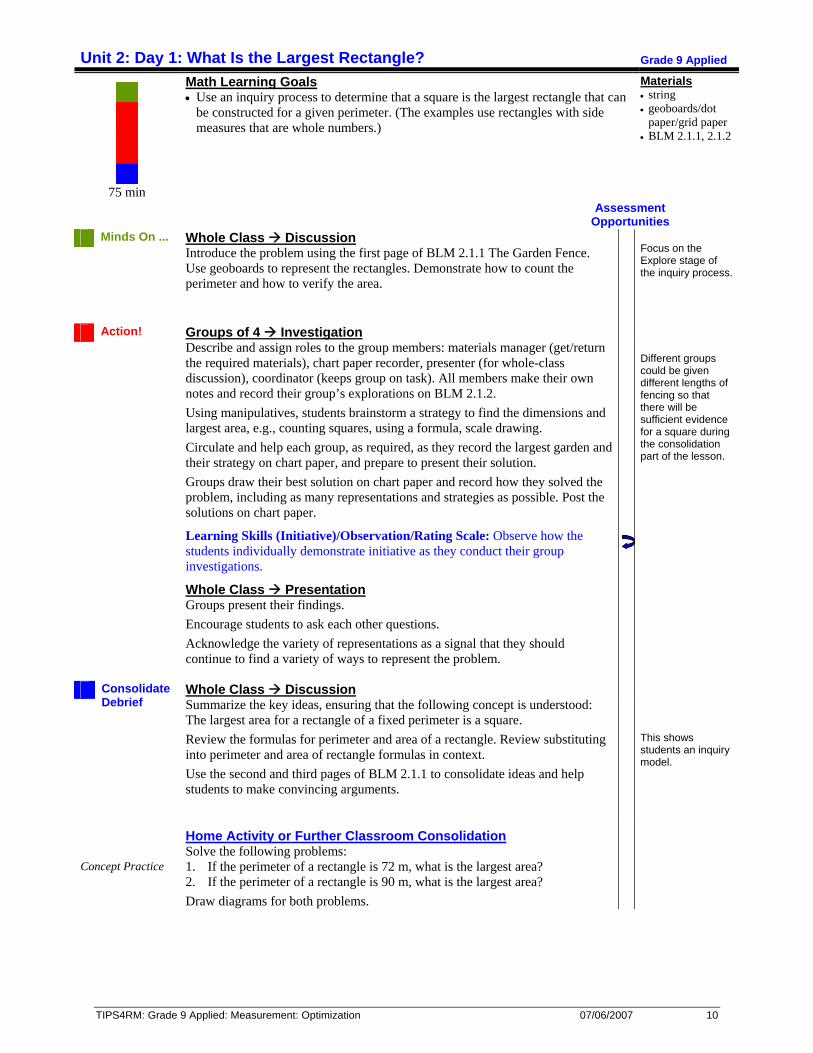
Math Learning Goals • Use an inquiry process to determine that a square is the largest rectangle that can
be constructed for a given perimeter. (The examples use rectangles with side measures that are whole numbers.)
Materials • string • geoboards/dot
paper/grid paper • BLM 2.1.1, 2.1.2
Assessment Opportunities
Minds On ... Whole Class Discussion Introduce the problem using the first page of BLM 2.1.1 The Garden Fence. Use geoboards to represent the rectangles. Demonstrate how to count the perimeter and how to verify the area.
Action! Groups of 4 Investigation Describe and assign roles to the group members: materials manager (get/return the required materials), chart paper recorder, presenter (for whole-class discussion), coordinator (keeps group on task). All members make their own notes and record their group’s explorations on BLM 2.1.2. Using manipulatives, students brainstorm a strategy to find the dimensions and largest area, e.g., counting squares, using a formula, scale drawing. Circulate and help each group, as required, as they record the largest garden and their strategy on chart paper, and prepare to present their solution. Groups draw their best solution on chart paper and record how they solved the problem, including as many representations and strategies as possible. Post the solutions on chart paper.
Learning Skills (Initiative)/Observation/Rating Scale: Observe how the students individually demonstrate initiative as they conduct their group investigations.
Whole Class Presentation Groups present their findings. Encourage students to ask each other questions. Acknowledge the variety of representations as a signal that they should continue to find a variety of ways to represent the problem.
Consolidate Debrief
Whole Class Discussion Summarize the key ideas, ensuring that the following concept is understood: The largest area for a rectangle of a fixed perimeter is a square. Review the formulas for perimeter and area of a rectangle. Review substituting into perimeter and area of rectangle formulas in context. Use the second and third pages of BLM 2.1.1 to consolidate ideas and help students to make convincing arguments.
Focus on the Explore stage of the inquiry process. Different groups could be given different lengths of fencing so that there will be sufficient evidence for a square during the consolidation part of the lesson. This shows students an inquiry model.
Concept Practice
Home Activity or Further Classroom Consolidation Solve the following problems: 1. If the perimeter of a rectangle is 72 m, what is the largest area? 2. If the perimeter of a rectangle is 90 m, what is the largest area? Draw diagrams for both problems.
Grade 9 Applied Unit 2 Adjusted Lesson: Mathematical Processes – Selecting Tools and Computational Strategies 07/06/2007 11
Unit 2: Day 1: What is the Largest Rectangle? (A) Grade 9 Applied
75 min
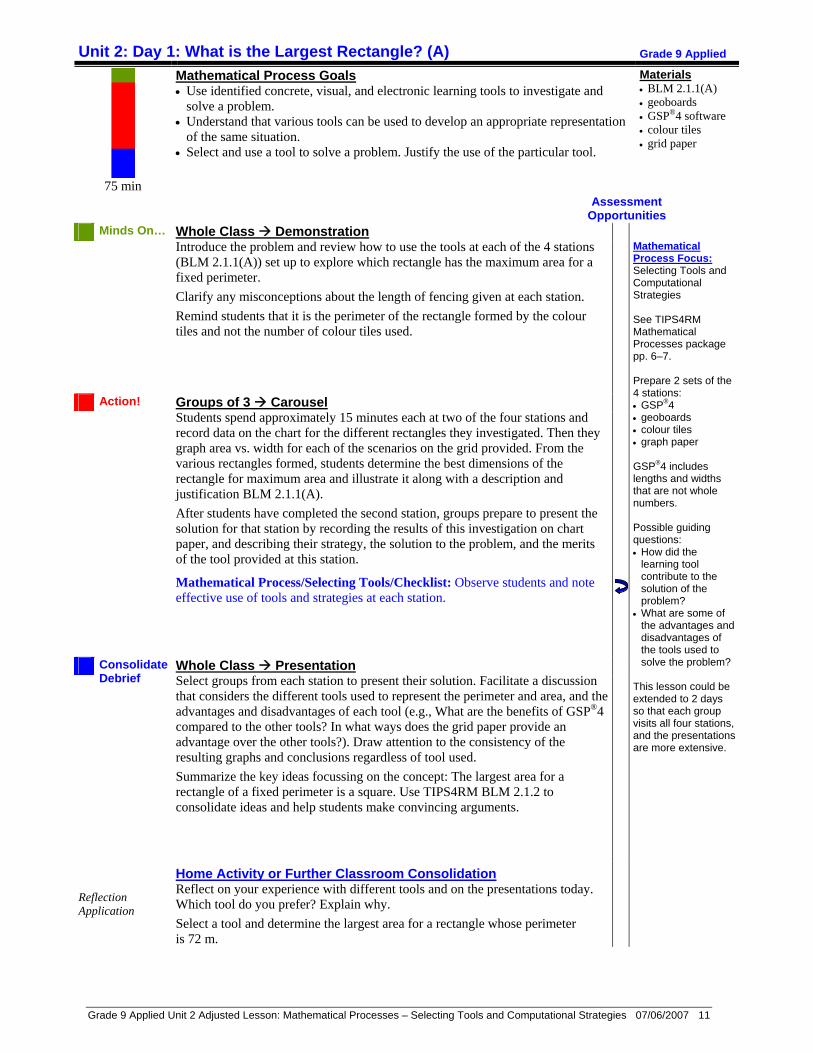
Mathematical Process Goals • Use identified concrete, visual, and electronic learning tools to investigate and
solve a problem. • Understand that various tools can be used to develop an appropriate representation
of the same situation. • Select and use a tool to solve a problem. Justify the use of the particular tool.
Materials • BLM 2.1.1(A) • geoboards • GSP®4 software • colour tiles • grid paper
Assessment Opportunities
Minds On… Whole Class Demonstration Introduce the problem and review how to use the tools at each of the 4 stations (BLM 2.1.1(A)) set up to explore which rectangle has the maximum area for a fixed perimeter. Clarify any misconceptions about the length of fencing given at each station. Remind students that it is the perimeter of the rectangle formed by the colour tiles and not the number of colour tiles used.
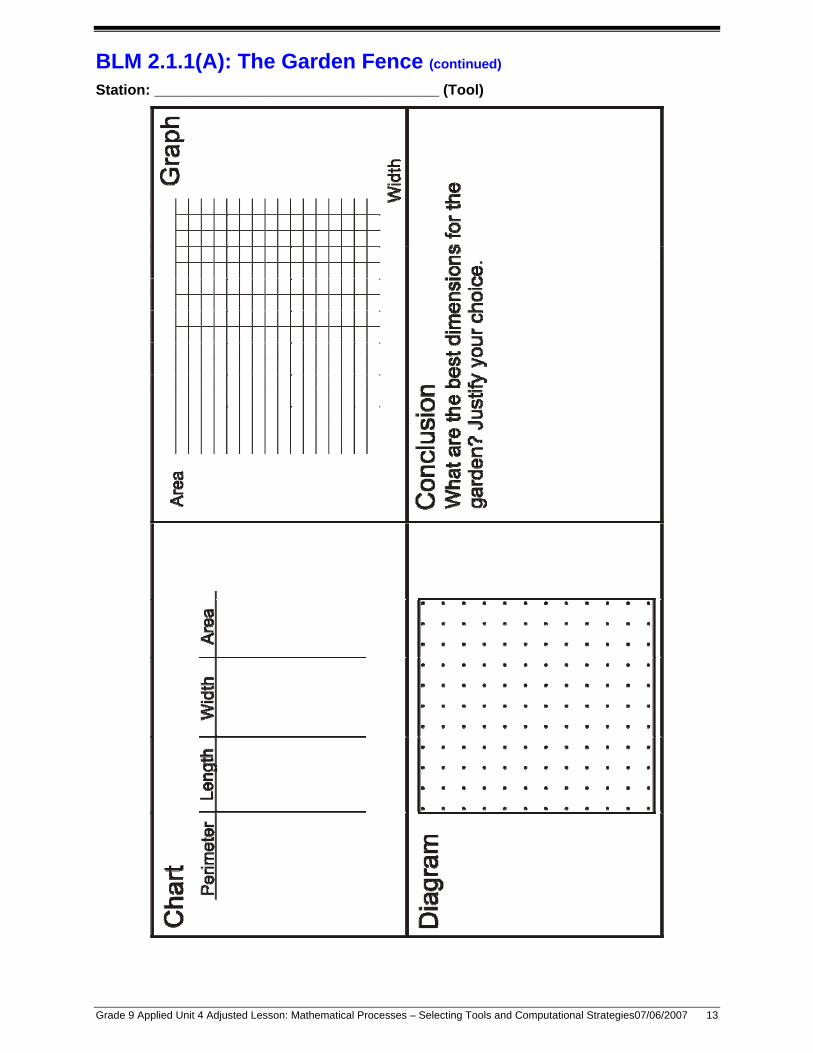
Action! Groups of 3 Carousel Students spend approximately 15 minutes each at two of the four stations and record data on the chart for the different rectangles they investigated. Then they graph area vs. width for each of the scenarios on the grid provided. From the various rectangles formed, students determine the best dimensions of the rectangle for maximum area and illustrate it along with a description and justification BLM 2.1.1(A). After students have completed the second station, groups prepare to present the solution for that station by recording the results of this investigation on chart paper, and describing their strategy, the solution to the problem, and the merits of the tool provided at this station.
Mathematical Process/Selecting Tools/Checklist: Observe students and note effective use of tools and strategies at each station.
Consolidate Debrief
Whole Class Presentation Select groups from each station to present their solution. Facilitate a discussion that considers the different tools used to represent the perimeter and area, and the advantages and disadvantages of each tool (e.g., What are the benefits of GSP®4 compared to the other tools? In what ways does the grid paper provide an advantage over the other tools?). Draw attention to the consistency of the resulting graphs and conclusions regardless of tool used. Summarize the key ideas focussing on the concept: The largest area for a rectangle of a fixed perimeter is a square. Use TIPS4RM BLM 2.1.2 to consolidate ideas and help students make convincing arguments.
Mathematical Process Focus: Selecting Tools and Computational Strategies See TIPS4RM Mathematical Processes package pp. 6–7. Prepare 2 sets of the 4 stations: • GSP®4 • geoboards • colour tiles • graph paper GSP®4 includes lengths and widths that are not whole numbers. Possible guiding questions: • How did the
learning tool contribute to the solution of the problem?
• What are some of the advantages and disadvantages of the tools used to solve the problem?
This lesson could be extended to 2 days so that each group visits all four stations, and the presentations are more extensive.
Reflection Application
Home Activity or Further Classroom Consolidation Reflect on your experience with different tools and on the presentations today. Which tool do you prefer? Explain why. Select a tool and determine the largest area for a rectangle whose perimeter is 72 m.
Grade 9 Applied Unit 4 Adjusted Lesson: Mathematical Processes – Selecting Tools and Computational Strategies07/06/2007 12
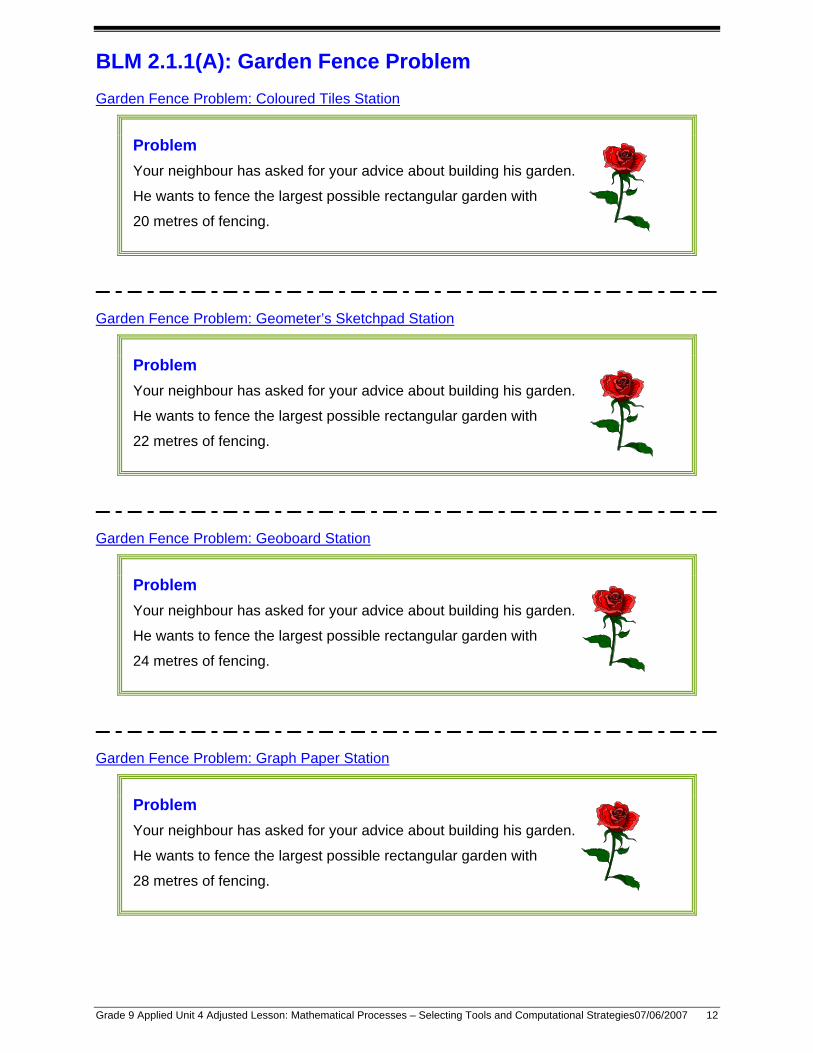
BLM 2.1.1(A): Garden Fence Problem Garden Fence Problem: Coloured Tiles Station
Problem Your neighbour has asked for your advice about building his garden.
He wants to fence the largest possible rectangular garden with
20 metres of fencing.
Garden Fence Problem: Geometer’s Sketchpad Station
Problem Your neighbour has asked for your advice about building his garden.
He wants to fence the largest possible rectangular garden with
22 metres of fencing.
Garden Fence Problem: Geoboard Station
Problem Your neighbour has asked for your advice about building his garden.
He wants to fence the largest possible rectangular garden with
24 metres of fencing.
Garden Fence Problem: Graph Paper Station
Problem Your neighbour has asked for your advice about building his garden.
He wants to fence the largest possible rectangular garden with
28 metres of fencing.
Grade 9 Applied Unit 4 Adjusted Lesson: Mathematical Processes – Selecting Tools and Computational Strategies07/06/2007 13
BLM 2.1.1(A): The Garden Fence (continued) Station: ___________________________________ (Tool)
TIPS4RM: Grade 9 Applied – Plane Geometry 07/06/2007 14
Unit 8: Day 8: Freaky Folds Grade 9 Applied
75 min
Math Learning Goals • Use paper folding to illustrate geometric properties.
Materials • origami paper • scissors • BLM 8.8.1
(Teacher)
Assessment Opportunities
Minds On ...
Whole Class Demonstration Introduce origami to the class as the art of paper folding. Give each student an origami or square piece of paper. Demonstrate how to fold the paper to form a paper drinking cup (use an overhead of BLM 8.8.1). Students perform the same folds. Students then unfold their paper cup. Discuss the kinds of geometry they see in the folds. For example: • triangle EFB, triangle BFG, triangle DHI, triangle DIJ are congruent and
isosceles • triangle HCG and triangle JAE are right isosceles triangles • EF is parallel to IH • JI is parallel to FG • JE || DB || GH
Action! Pairs Investigation Students make two of the same item – leave one folded and the second one unfolded. They tape their unfolded one onto another piece of paper and label all the geometry in preparation for their presentation. Ask students to make measurements to provide evidence that they have correctly identified the geometry.
Consolidate Debrief
Pairs Presentation Students present to the class their origami figure and explain the geometry they found in the unfolded shape.
Communicating/Presentation/Rubric: Assess students on their use of appropriate terminology and the clarity of their justifications as they make their presentations.
Visit: www.tammyyee.com/origami.html. This website is designed for young children but provides a good selection of appropriate origami patterns. For example: • fish • iris (a bit tricky) • cat (easy!) • dragon fortune
teller
Differentiated Reflection Reasoning and Proving
Home Activity or Further Classroom Consolidation Look in newspapers, magazines, or on the Internet for a logo that has some geometric properties. Paste a picture of your logo on a piece of paper and identify and describe the geometry in the logo. Submit your work for assessment.
Grade 9 Applied Unit 8 Adjusted Lesson: Mathematical Processes – Connecting 07/06/2007 15
Unit 8: Day 8: Freaky Folds (A) Grade 9 Applied
75 min
Mathematical Process Goals • Make connections between origami paper folding and geometric properties. • Apply mathematics to contexts outside of mathematics. • Communicate connections to different audiences.
Materials • origami paper • origami templates • scissors • BLM 8.8.2(A)
Assessment Opportunities
Minds On… Whole Class Introducing Origami What is Origami? Read short excerpt of the History of Origami, http://library.thinkquest.org/5402/history.html
Pairs Reading Different Text Forms One student reads the instructions to his/her partner. The second student asks questions for clarification. (BLM 8.8.2 (A))* Students unfold their paper cup, and discuss the kinds of geometry they see in the folds. *A Geometer’s Sketchpad presentation can be used as a visual to enable students to make connections between the terminology used in the instructions and the geometry found in the origami drinking cup.
Action! Pairs Investigation To enable all students to make connections between the folds made and the resulting geometric properties, provide each student with one of the following origami templates, based on level of difficulty: • Easy: bunny, cat • Moderate: dragon, fortune teller, mouse, dolphin, butterfly • Difficult: iris
See showcase at: http://www.langorigami.com/art/artmain/artmain.php4 Pairs prepare their presentation to showcase for the class.
Consolidate Debrief
Pairs Presentation Students present origami figure and explain the geometry they found in the unfolded shape.
Whole Class Reflection Use probing questions to help students make connections and consolidate their understanding of geometric properties.
Mathematical Process/Connecting/Checklist: Observe how the students communicate their understanding of how the concepts are connected.
Possible guiding prompts: • Describe the connections you see between the paper cup and your origami
design. • How is this thinking connected to the thinking that you engaged in when you
created your origami design? • Where else are geometric properties be used in daily life?
Mathematical Process Focus: Connecting See TIPS4RM Mathematical Processes package p. 8 Sadako and the Thousand Cranes (Eleanor Coer) can also be used to introduce origami. ISBN #0-3999-20520-9 Word Wall: • diagonal • vertex • right triangle • hypotenuse • parallel lines • congruent
triangles • isosceles triangle • trapezoid • rectangle • square • kite
Application Differentiated Reflection
Home Activity or Further Classroom Consolidation 1. a) Create a square from a piece of paper without using a ruler. Examine the
geometry in your folds. Explain how you made the square and why you know for certain that it is a square.
b) How is this thinking connected to the thinking that you engaged in when you created your origami design?
2. What type of profession(s) require(s) knowledge of geometric properties?
Grade 9 Applied Unit 8 Adjusted Lesson: Mathematical Processes – Connecting 07/06/2007 16
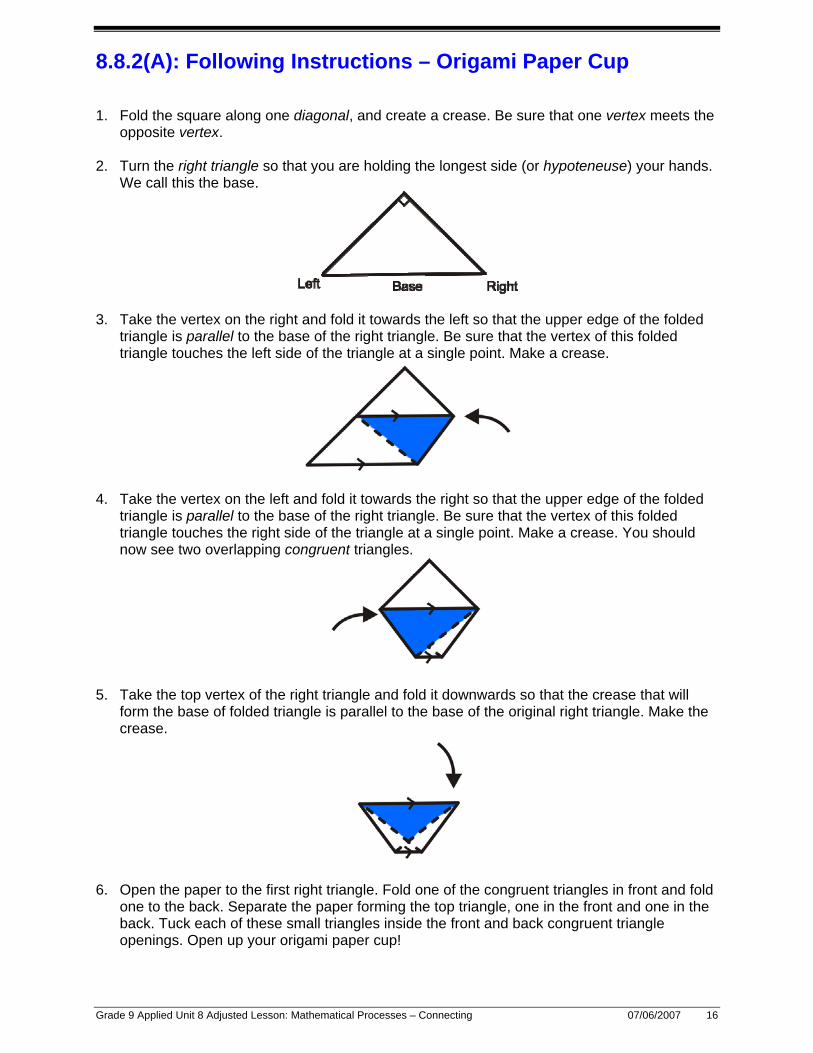
8.8.2(A): Following Instructions – Origami Paper Cup 1. Fold the square along one diagonal, and create a crease. Be sure that one vertex meets the
opposite vertex. 2. Turn the right triangle so that you are holding the longest side (or hypoteneuse) your hands.
We call this the base.
3. Take the vertex on the right and fold it towards the left so that the upper edge of the folded
triangle is parallel to the base of the right triangle. Be sure that the vertex of this folded triangle touches the left side of the triangle at a single point. Make a crease.
4. Take the vertex on the left and fold it towards the right so that the upper edge of the folded
triangle is parallel to the base of the right triangle. Be sure that the vertex of this folded triangle touches the right side of the triangle at a single point. Make a crease. You should now see two overlapping congruent triangles.
5. Take the top vertex of the right triangle and fold it downwards so that the crease that will
form the base of folded triangle is parallel to the base of the original right triangle. Make the crease.
6. Open the paper to the first right triangle. Fold one of the congruent triangles in front and fold
one to the back. Separate the paper forming the top triangle, one in the front and one in the back. Tuck each of these small triangles inside the front and back congruent triangle openings. Open up your origami paper cup!
TIPS4RM: Grade 9 Applied – Algebraic Models: Making Connections 07/06/2007 17
Unit 7: Day 4: Simplifying Algebraic Models Grade 9 Applied
75 min
Math Learning Goals • Use multiple representations (physical, numerical, algebraic). • Simplify algebraic expressions.
Materials • overhead
projector • algebra tiles • computer/data
projector • BLM 7.4.1, 7.4.3
(Teacher) • BLM 7.4.2, 7.4.4
Assessment Opportunities
Minds On ...
Small Groups Practice Students found a relationship between the term number and the expression for the term (Day 3). Provide each group with a set of answer cards. Hold up a cue card with an expression and students match it with one of their set. Students explain their choices. Clear up any misunderstandings. Whole Class Practice Do several examples like the following: • What is an algebraic expression for “3 more than double a number”?
(Answer: 3 + 2x) • Use algebra tiles to create a model for the expression.
(Answer: Use the overhead to show 2 x-tiles and 3 one-tiles.)
Action! Whole Class Presentation Use electronic presentations Collecting Terms Using Algebra Tiles, and Expanding and Simplifying Algebraic Expressions. Pairs Practice Students complete BLM 7.4.2.
Learning Skill (Work Habits)/Observation/Rating Scale: Observe and record how students work to complete the assignment.
Consolidate Debrief
Whole Class Connecting Use Debrief Notes to consolidate learning and make connections between numerical, algebraic, and graphical models (BLM 7.4.3).
Collecting Terms.ppt
Algebraic Equations.ppt The activity Cue Cards is designed to give students practice in creating algebraic expressions from words. Set a date with students for a proficiency test on simplifying algebraic expressions.
Application
Home Activity or Further Classroom Consolidation Complete worksheet 7.4.4 We’re All Correct! How can you determine if two expressions are equivalent? Students may need additional practice questions.
Grade 9 Applied Unit 7 Adjusted Lesson: Mathematical Processes – Representing 07/06/2007 18
Unit 7: Day 4: Simplifying Algebraic Models (A) Grade 9 Applied
75 min
Mathematical Process Goals • Identify multiple representations for an expression (relationship in words, algebraic
expression, table of values, graph).
Materials • overhead
projector • algebra tiles • computer/data
projector • BLM 7.4.1(A)
Assessment Opportunities
Minds On… Whole Class Practice Provide each student with one cue card (BLM 7.4.1(A)). Students circulate to find the three other students who share equivalent representations. Ask: How do you know your representations are equivalent?
Mathematical Process/Representing/Checklist: Observe and record how students work together to compare representations and complete the assignment.
Small Groups Practice Do several examples like the following: • What is an algebraic expression for “3 more than double a number”?
(Answer: 3 + 2x) • Use algebra tiles to create a model for the expression.
(Answer: Show 2 x-tiles and 3 one-tiles.)
Action! Whole Class Presentation Use electronic presentations Collecting Terms Using Algebra Tiles, and Expanding and Simplifying Algebraic Expressions.
Pairs Practice Students complete TIPS4RM BLM 7.4.2.
Consolidate Debrief
Whole Class Connecting Consolidate learning and make connections between numerical, algebraic, and graphical models using TIPS4RM BLM 7.4.3.
Mathematical Process Focus: Representing See TIPS4RM Mathematical Processes package p. 9. There are four representations: relationship in words, equation, table of values, graph (BLM 7.4.1(A)).
Application Home Activity or Further Classroom Consolidation Complete TIPS4RM worksheet 7.4.4: We’re All Correct! How can you determine if two expressions are equivalent?
Students may need additional practice questions.
Grade 9 Applied Unit 7 Adjusted Lesson: Mathematical Processes – Representing 07/06/2007 19
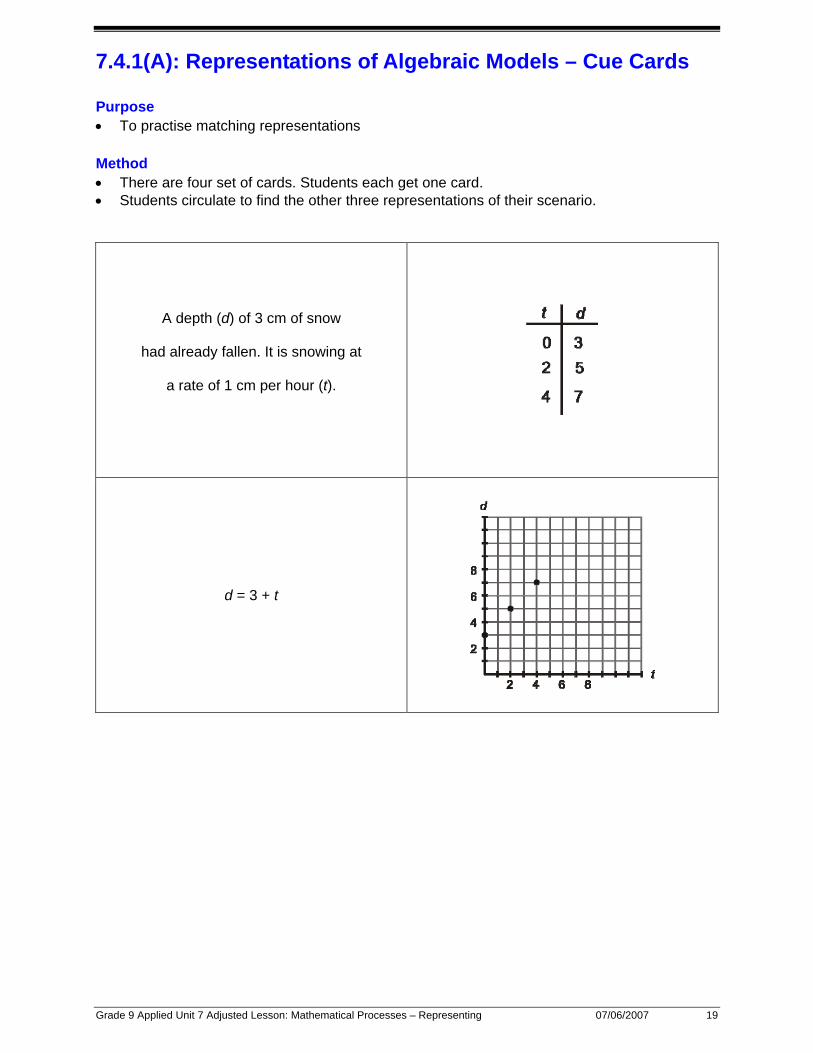
7.4.1(A): Representations of Algebraic Models – Cue Cards Purpose • To practise matching representations Method • There are four set of cards. Students each get one card. • Students circulate to find the other three representations of their scenario.
A depth (d) of 3 cm of snow
had already fallen. It is snowing at
a rate of 1 cm per hour (t).
d = 3 + t
Grade 9 Applied Unit 7 Adjusted Lesson: Mathematical Processes – Representing 07/06/2007 20
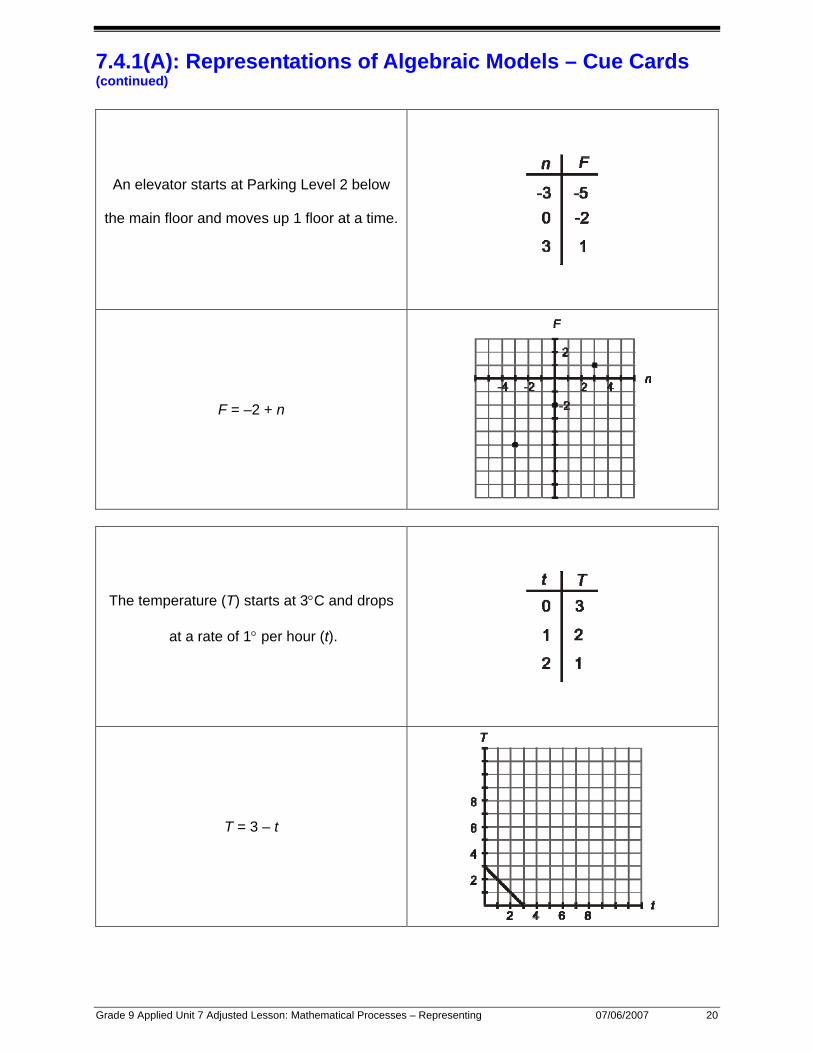
7.4.1(A): Representations of Algebraic Models – Cue Cards (continued)
An elevator starts at Parking Level 2 below
the main floor and moves up 1 floor at a time.
F = –2 + n
The temperature (T) starts at 3°C and drops
at a rate of 1° per hour (t).
T = 3 – t
Grade 9 Applied Unit 7 Adjusted Lesson: Mathematical Processes – Representing 07/06/2007 21
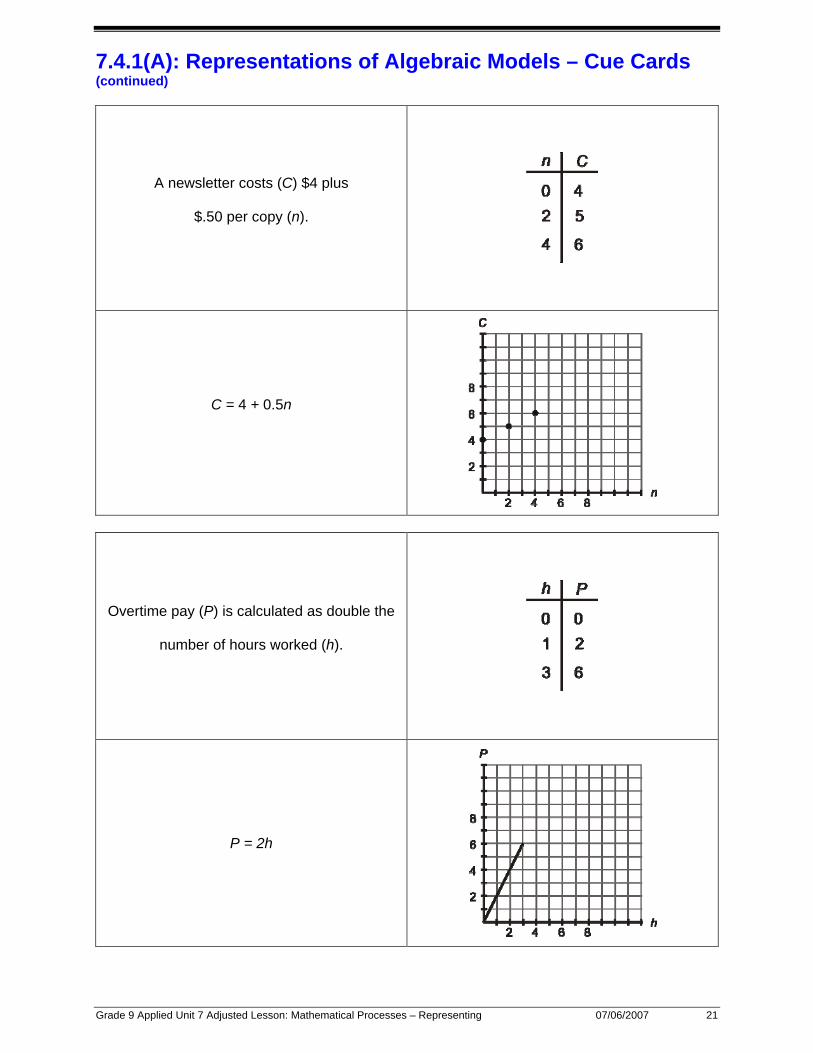
7.4.1(A): Representations of Algebraic Models – Cue Cards (continued)
A newsletter costs (C) $4 plus
$.50 per copy (n).
C = 4 + 0.5n
Overtime pay (P) is calculated as double the
number of hours worked (h).
P = 2h
Grade 9 Applied Unit 7 Adjusted Lesson: Mathematical Processes – Representing 07/06/2007 22
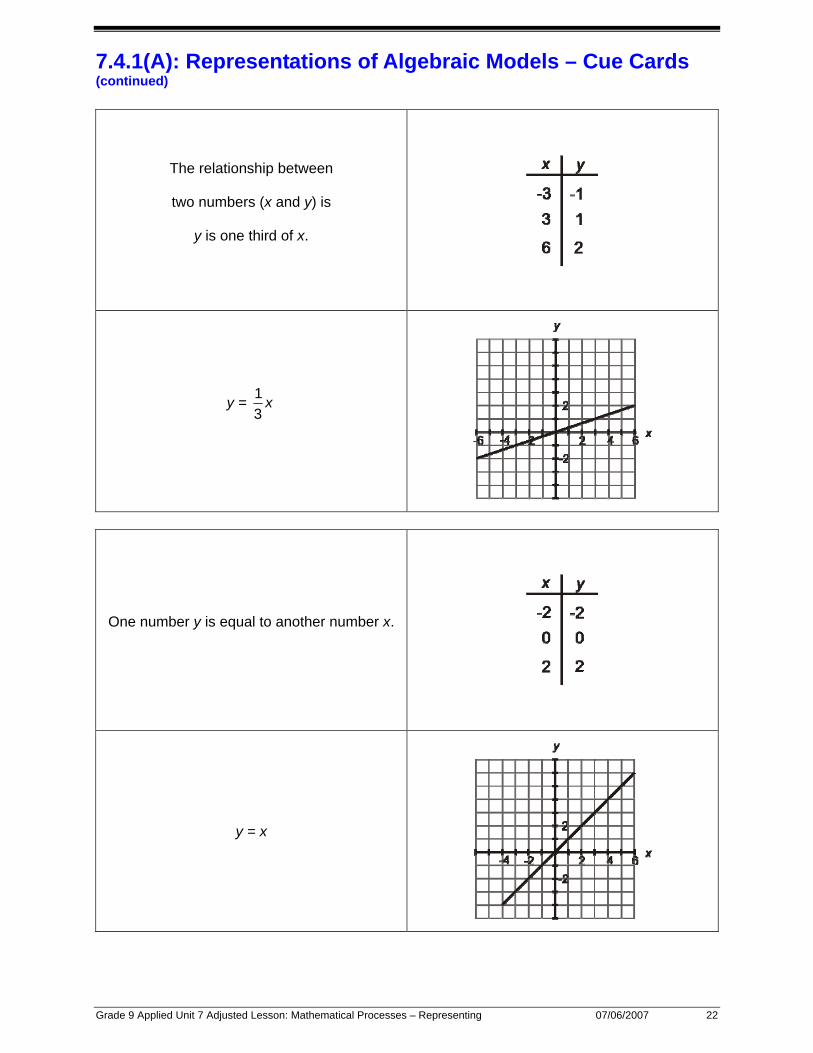
7.4.1(A): Representations of Algebraic Models – Cue Cards (continued)
The relationship between
two numbers (x and y) is
y is one third of x.
y = 13
x
One number y is equal to another number x.
y = x
Grade 9 Applied Unit 7 Adjusted Lesson: Mathematical Processes – Representing 07/06/2007 23
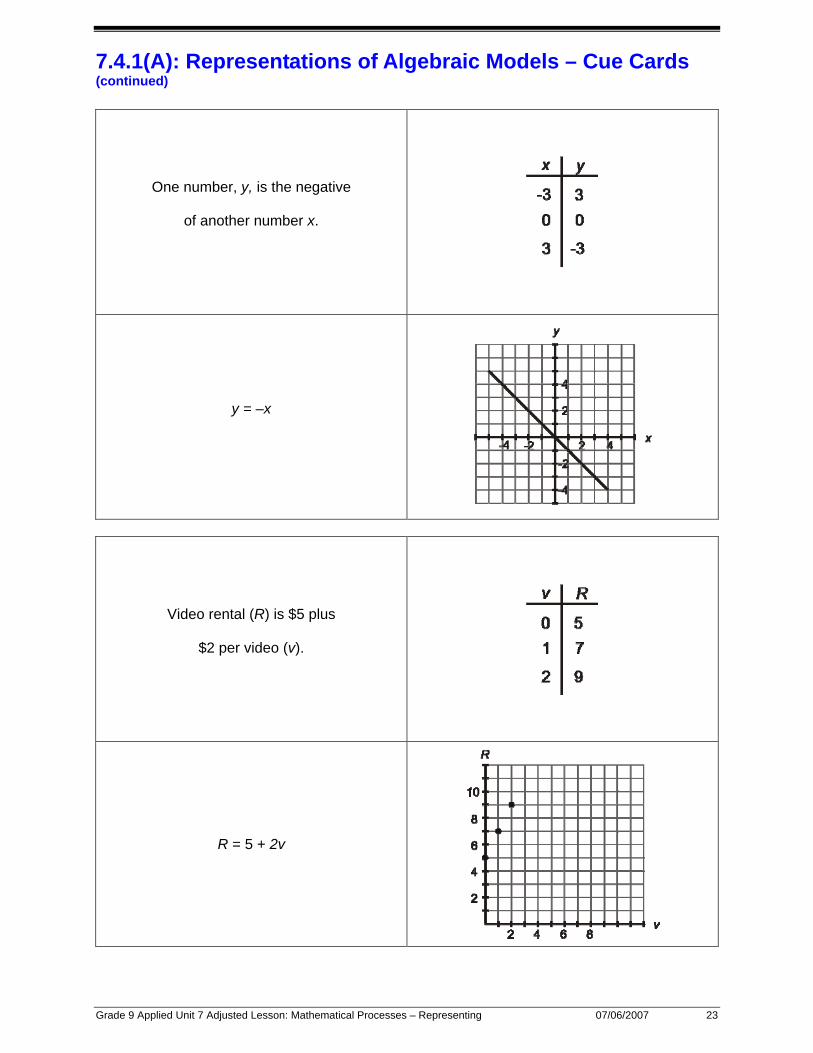
7.4.1(A): Representations of Algebraic Models – Cue Cards (continued)
One number, y, is the negative
of another number x.
y = –x
Video rental (R) is $5 plus
$2 per video (v).
R = 5 + 2v