Mathematical Practices Make sense of problems and...
21
Draft 1 Algebra 3 Unit 4: Applications of Trigonometry Pacing: 6 weeks A/B Block Schedule Mathematical Practices Mathematical Practices #1 and #3 describe a classroom environment that encourages thinking mathematically and are critical for quality teaching and learning. Practices in bold are to be emphasized in the unit. 1. Make sense of problems and persevere in solving them. 2. Reason abstractly and quantitatively. 3. Construct viable arguments and critique the reasoning of others. 4. Model with mathematics. 5. Use appropriate tools strategically. 6. Attend to precision. 7. Look for and make use of structure. 8. Look for and express regularity in repeated reasoning. Standards Overview Define trigonometric ratios and solve problems involving right triangles. (+)Apply trigonometry to general triangles using laws of sines and cosines. (+) indicates additional mathematics that students should learn in order to take advanced courses such as calculus, advanced statistics, or discrete mathematics Use trigonometry to solve triangles. Review solving right triangles using trig ratios. Use the Laws of Sines and Cosines, to solve non- right triangles. Use trigonometry to find the area of triangles for which a height is not given.
Transcript of Mathematical Practices Make sense of problems and...

Draft 1
Algebra 3 Unit 4: Applications of Trigonometry
Pacing: 6 weeks A/B Block Schedule
Mathematical Practices
Mathematical Practices #1 and #3 describe a classroom environment that encourages thinking mathematically and are critical for quality teaching and learning. Practices in bold are to be emphasized in the unit. 1. Make sense of problems and persevere in solving them. 2. Reason abstractly and quantitatively. 3. Construct viable arguments and critique the reasoning of others. 4. Model with mathematics. 5. Use appropriate tools strategically. 6. Attend to precision. 7. Look for and make use of structure. 8. Look for and express regularity in repeated reasoning.
Standards Overview
Define trigonometric ratios and solve problems involving right triangles. (+)Apply trigonometry to general triangles using laws of sines and cosines.
(+) indicates additional mathematics that students should learn in order to take advanced courses such as calculus, advanced statistics, or discrete mathematics Use trigonometry to solve triangles. Review solving right triangles using trig ratios. Use the Laws of Sines and Cosines, to solve non-right triangles. Use trigonometry to find the area of triangles for which a height is not given.

Draft 1
Algebra 3 Unit 4: Applications of Trigonometry
Priority and Supporting CCSS Explanations and Examples*
CC.9-12.G.SRT.8 Use trigonometric ratios and the Pythagorean
Theorem to solve right triangles in applied problems.*
To use the Pythagorean Theorem and its Converse
To use sine, cosine, and tangent ratios to determine side lengths in right
triangles
To use inverse functions to determine angle measures in right triangles
To use angles of elevation and depression to solve problems
To find the area of a triangle using trigonometry
To find the area of any triangle (formula derived using law of sines)
CC.9-12.G.SRT.9 (+) Derive the formula A = 1/2absin(C) for the
area of a triangle by drawing an auxiliary line from a vertex
perpendicular to the opposite side.
CC.9-12.G.SRT.11 (+) Understand and apply the Law of Sines
and the Law of Cosines to find unknown measurements in right
and non-right triangles.
To use the Law of Sines and Law of Cosines in finding the measures of sides
and angles of a triangle
Draft 1
Algebra 3 Unit 4: Applications of Trigonometry
Concepts What Students Need to Know
Skills What Students Need To Be Able To Do
Bloom’s Taxonomy Levels
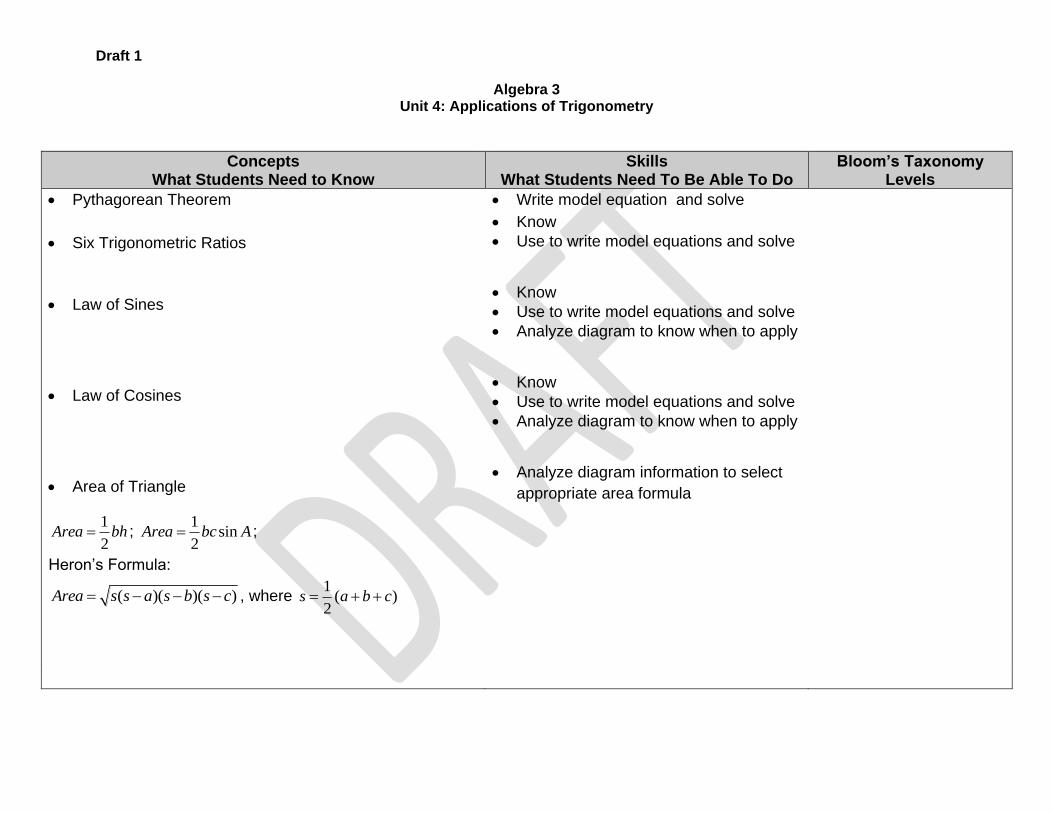
Pythagorean Theorem
Six Trigonometric Ratios
Law of Sines
Law of Cosines
Area of Triangle
1
2Area bh ;
1sin
2Area bc A ;
Heron’s Formula:
( )( )( )Area s s a s b s c , where 1
( )2
s a b c
Write model equation and solve
Know
Use to write model equations and solve
Know
Use to write model equations and solve
Analyze diagram to know when to apply
Know
Use to write model equations and solve
Analyze diagram to know when to apply
Analyze diagram information to select
appropriate area formula
Draft 1
Algebra 3 Unit 4: Applications of Trigonometry
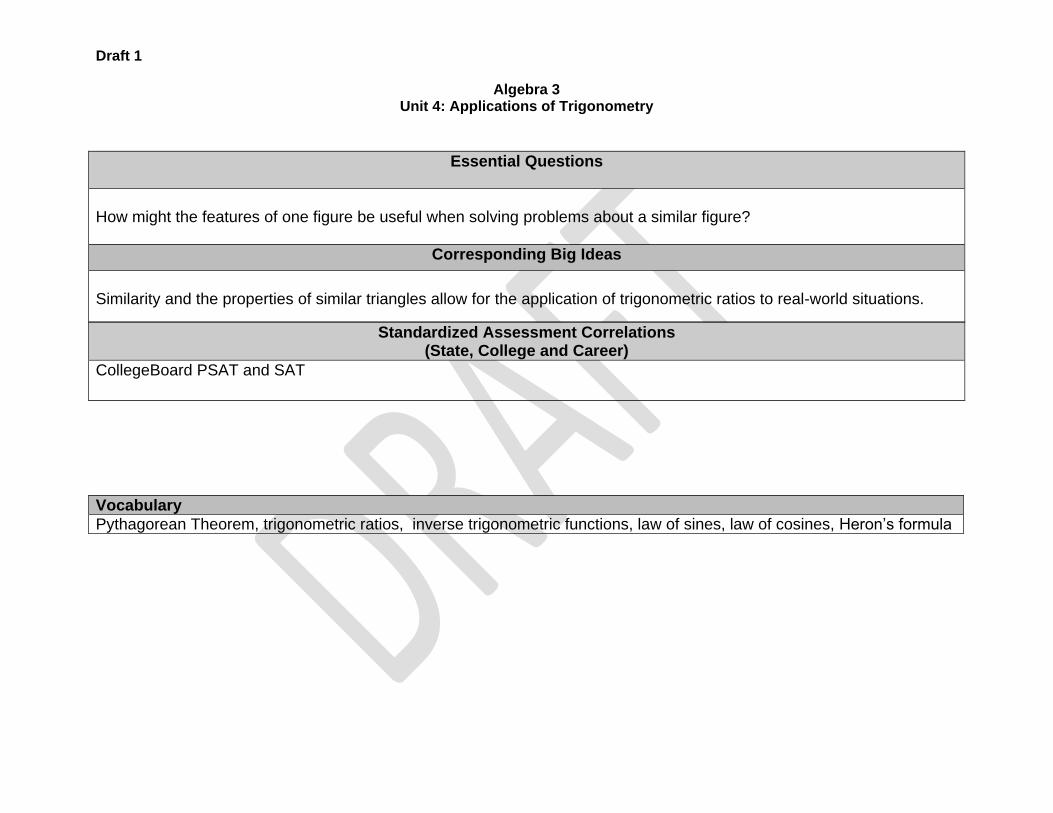
Essential Questions
How might the features of one figure be useful when solving problems about a similar figure?
Corresponding Big Ideas
Similarity and the properties of similar triangles allow for the application of trigonometric ratios to real-world situations.
Standardized Assessment Correlations (State, College and Career)
CollegeBoard PSAT and SAT
Vocabulary
Pythagorean Theorem, trigonometric ratios, inverse trigonometric functions, law of sines, law of cosines, Heron’s formula

Draft 1
Algebra 3 Unit 4: Applications of Trigonometry
Unit Assessments The items developed for this section can be used during the course of instruction when deemed appropriate by the teacher.
Section Quizzes, End-of-Unit Test
Learning Activities
Topic Source(s) CCSS
Review six trigonometric functions (Sine, cosine, tangent, cosecant, secant, cotangent)
Review solving right triangles using Pythagorean Thm and trig ratios (applications)
Law of Sines
Law of Cosines
Area of Triangles (include Heron’s Formula)
Algebra 2 text: Section 14.3 Section 14.4 Section 14.5 Section 14.4
G-SRT6, G-SRT7 and G-SRT8
G-SRT4 and G-SRT8
G-SRT10, G-SRT11
G-SRT9

Draft 1
Algebra 3 Unit 4: Applications of Trigonometry
Application
A A f A famous golfer tees off on a long, straight 455 yard par 4 and slices his drive 13° to the right of the line from tee to the hole. If the drive went 283 yards,
how many yards will the golfer's second shot have to be to reach the hole?
A plane is located at C on the diagram. There are two towers located at A and B. The distance between the towers is 1,600 feet, and the angles of elevation
are given.
a. Find BC, the distance from Tower 2 to the plane, to the nearest foot. b. Find CD, the height of the plane from the ground, to the nearest foot.
A
DTower 1 Tower 2
C
20 33o oB
1600 ftdrawing not to scale

Draft 1
Algebra 3 Unit 4: Applications of Trigonometry
A farmer is estimating the surface area of his barn to find how much paint he needs to buy. One part of the barn is triangular as shown.
a. The darkened sides in the figure are the edges of the roof. This trim will be painted white. Find the length of each of these two sides of the triangle. b. The triangular surface will be painted red. Find the area of the triangle.
30° 30°
22 m
Draft 1
Algebra 3 Unit 5: Statistics
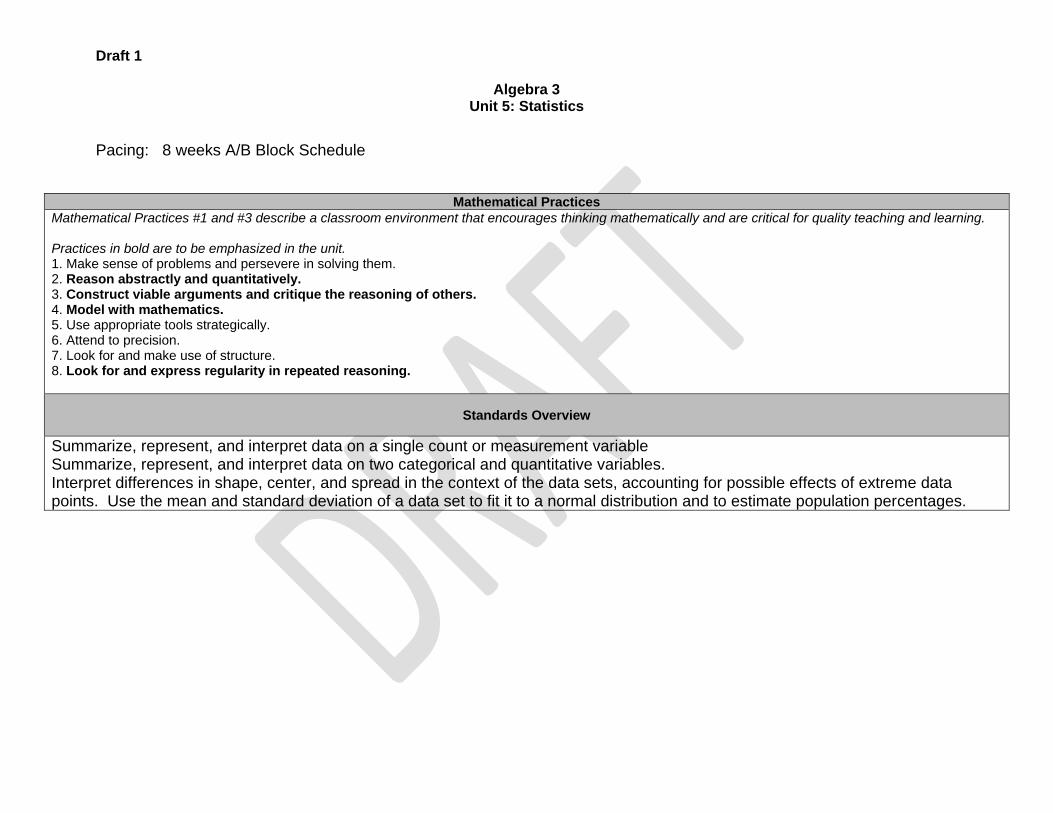
Pacing: 8 weeks A/B Block Schedule
Mathematical Practices
Mathematical Practices #1 and #3 describe a classroom environment that encourages thinking mathematically and are critical for quality teaching and learning. Practices in bold are to be emphasized in the unit. 1. Make sense of problems and persevere in solving them. 2. Reason abstractly and quantitatively. 3. Construct viable arguments and critique the reasoning of others. 4. Model with mathematics. 5. Use appropriate tools strategically. 6. Attend to precision. 7. Look for and make use of structure. 8. Look for and express regularity in repeated reasoning.
Standards Overview
Summarize, represent, and interpret data on a single count or measurement variable Summarize, represent, and interpret data on two categorical and quantitative variables. Interpret differences in shape, center, and spread in the context of the data sets, accounting for possible effects of extreme data points. Use the mean and standard deviation of a data set to fit it to a normal distribution and to estimate population percentages.
Draft 1
Algebra 3 Unit 5: Statistics
Priority and Supporting CCSS Explanations and Examples*
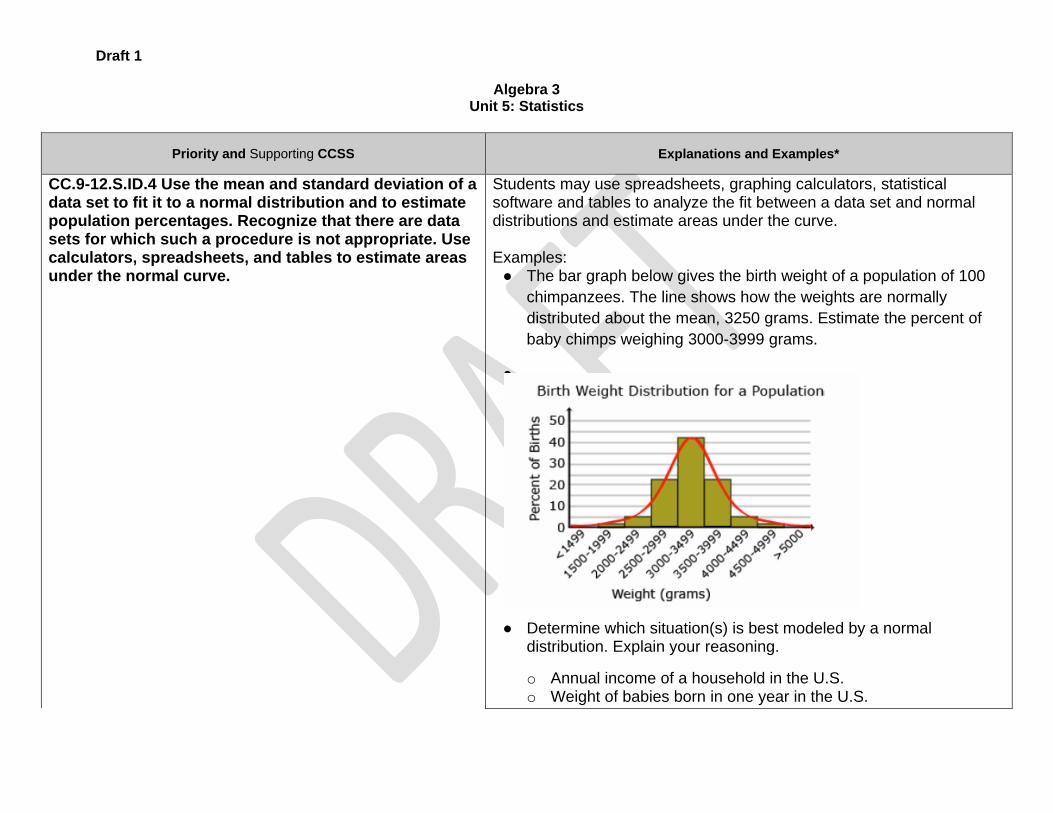
CC.9-12.S.ID.4 Use the mean and standard deviation of a data set to fit it to a normal distribution and to estimate population percentages. Recognize that there are data sets for which such a procedure is not appropriate. Use calculators, spreadsheets, and tables to estimate areas under the normal curve.
Students may use spreadsheets, graphing calculators, statistical software and tables to analyze the fit between a data set and normal distributions and estimate areas under the curve. Examples:
● The bar graph below gives the birth weight of a population of 100
chimpanzees. The line shows how the weights are normally
distributed about the mean, 3250 grams. Estimate the percent of
baby chimps weighing 3000-3999 grams.
●
● Determine which situation(s) is best modeled by a normal distribution. Explain your reasoning.
o Annual income of a household in the U.S. o Weight of babies born in one year in the U.S.

Draft 1
Algebra 3 Unit 5: Statistics
Priority and Supporting CCSS Explanations and Examples*
CC.9-12.S.IC.1 Understand statistics as a process for making inferences about population parameters based on a random sample from that population.
CC.9-12.S.IC.2 Decide if a specified model is consistent with
results from a given data-generating process, e.g., using
simulation. For example, a model says a spinning coin falls
heads up with probability 0.5. Would a result of 5 tails in a
row cause you to question the model?
Possible data-generating processes include (but are not limited to): flipping coins, spinning spinners, rolling a number cube, and simulations using the random number generators. Students may use graphing calculators, spreadsheet programs, or applets to conduct simulations and quickly perform large numbers of trials. The law of large numbers states that as the sample size increases, the experimental probability will approach the theoretical probability. Comparison of data from repetitions of the same experiment is part of the model building verification process. Example:
● Have multiple groups flip coins. One group flips a coin 5 times, one
group flips a coin 20 times, and one group flips a coin 100 times.
Which group’s results will most likely approach the theoretical
probability?
CC.9-12.S.IC.6 Evaluate reports based on data. Explanations can include but are not limited to sample size, biased survey sample, interval scale, unlabeled scale, uneven scale, and outliers that distort the line-of-best-fit. In a pictogram the symbol scale used can also be a source of distortion. As a strategy, collect reports published in the media and ask students to
Draft 1
Algebra 3 Unit 5: Statistics
Priority and Supporting CCSS Explanations and Examples*
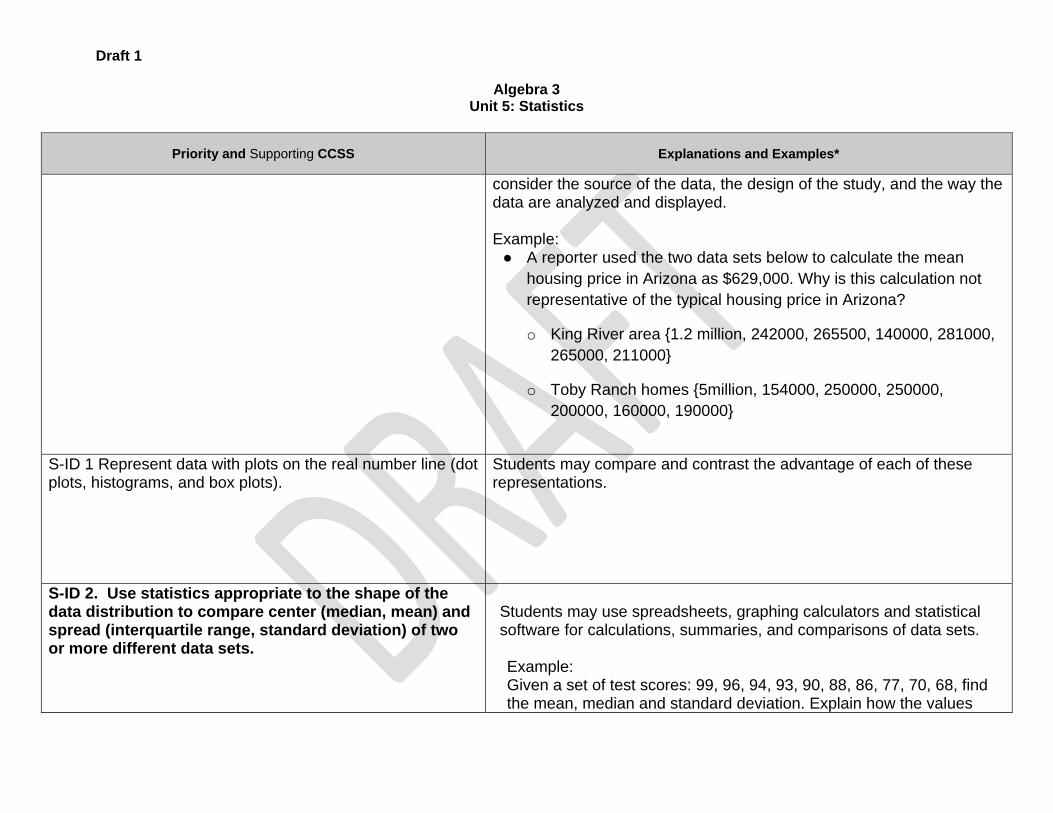
consider the source of the data, the design of the study, and the way the data are analyzed and displayed. Example:
● A reporter used the two data sets below to calculate the mean
housing price in Arizona as $629,000. Why is this calculation not
representative of the typical housing price in Arizona?
o King River area {1.2 million, 242000, 265500, 140000, 281000,
265000, 211000}
o Toby Ranch homes {5million, 154000, 250000, 250000,
200000, 160000, 190000}
S-ID 1 Represent data with plots on the real number line (dot plots, histograms, and box plots).
Students may compare and contrast the advantage of each of these representations.
S-ID 2. Use statistics appropriate to the shape of the data distribution to compare center (median, mean) and spread (interquartile range, standard deviation) of two or more different data sets.
Students may use spreadsheets, graphing calculators and statistical software for calculations, summaries, and comparisons of data sets. Example: Given a set of test scores: 99, 96, 94, 93, 90, 88, 86, 77, 70, 68, find the mean, median and standard deviation. Explain how the values

Draft 1
Algebra 3 Unit 5: Statistics
Priority and Supporting CCSS Explanations and Examples*
vary about the mean and median. What information does this give the teacher?
S-ID 3. Interpret differences in shape, center, and spread in the context of the data sets, accounting for possible effects of extreme data points (outliers).
Example: After the 2009-2010 NBA season LeBron James switched teams from the Cleveland Cavaliers to the Miami Heat, and he remained the top scorer (in points per game) in his first year in Miami. Compare team statistics for Cleveland (2009-2010) and Miami (2010-2011) for all players who averaged at least 10 minutes per game. Using the 1.5 X IQR rule, determine for which team and year James’s performance may be considered an outlier.
S-ID5. Summarize categorical data for two categories in two-way frequency tables. Interpret relative frequencies in the context of the data(including joint, marginal, and conditional relative frequencies). Recognize possible associations and trends in the data.

Draft 1
Algebra 3 Unit 5: Statistics
Concepts What Students Need to Know
Skills What Students Need To Be Able To Do
Bloom’s Taxonomy Levels
Data (Who, What, When, Where, Why)
Measures of central tendency (mean, median, mode)
Measures of spread (range, interquartile range, standard deviation)
Outlier
Histogram
Box plot
Correlation
Normal Distribution
Population percentages
Appropriate use of normal approx
Calculators, spreadsheets, tables
Area under normal curve
Inference
Population parameters
Sample survey data
Population mean / proportion
Identify
Interpret
Classify (Categorical, Quantitative)
Calculate (mean, median, mode, interquartile range)
Use (statistics to infer)
Use (technology to find standard deviation)
Interpret (correlation)
Identify (outliers)
Fit (normal distribution)
Estimate (population percentages)
Recognize (inappropriate usage)
Use (technology)
Estimate (area under normal)
Make (inferences based on data)
● Use (data to make inference)
● Estimate (population parameters)
1 2 1
1
3
3
2 4
3
3
4
3
3
4
4
4

Draft 1
Algebra 3 Unit 5: Statistics
Essential Questions
How can the properties of data be communicated to showcase its important features?
Corresponding Big Ideas
Statisticians summarize, represent and interpret categorical and quantitative data in different ways since one method can reveal or create a different impression than another.
Standardized Assessment Correlations (State, College and Career)
Collegeboard PSAT and SAT
Vocabulary
Population, sample, variable, quantitative variable, categorical variable, relative frequency, contingency table, marginal distribution, conditional distribution, histogram, symmetrical data, skewed data, outlier value, mean, median, interquartile range, standard deviation, Normal model, z-score
Draft 1
Algebra 3 Unit 5: Statistics
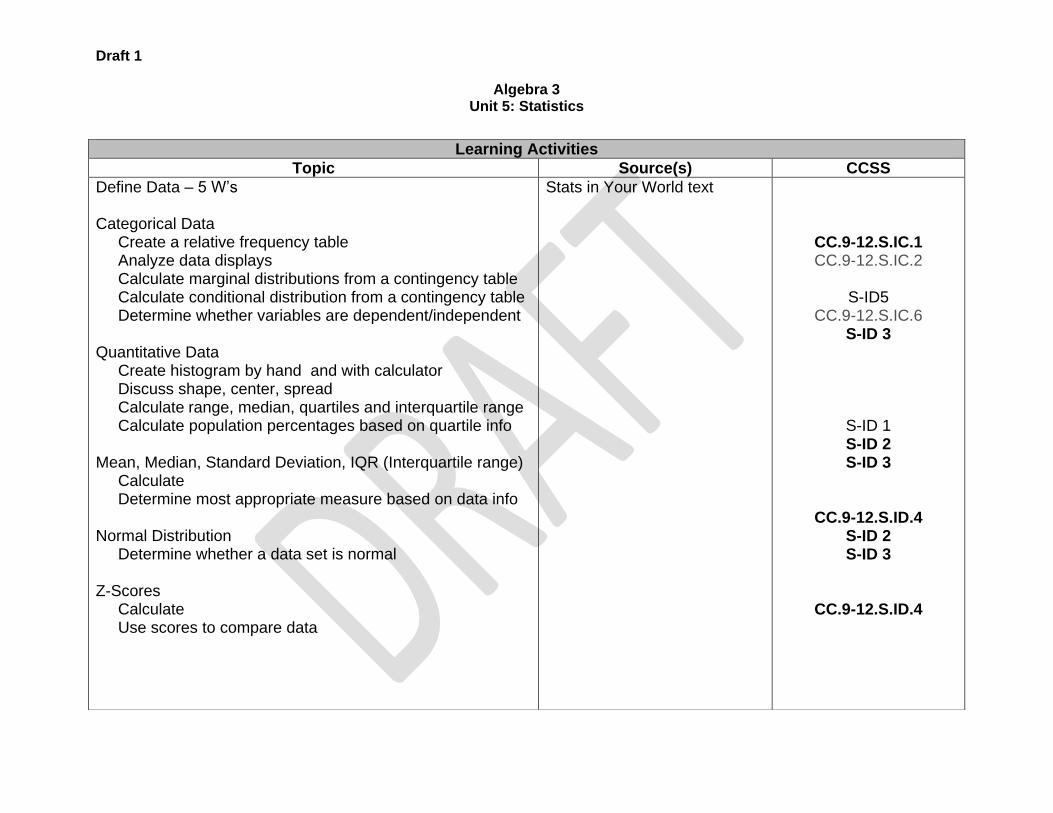
Learning Activities
Topic Source(s) CCSS
Define Data – 5 W’s Categorical Data Create a relative frequency table Analyze data displays Calculate marginal distributions from a contingency table Calculate conditional distribution from a contingency table Determine whether variables are dependent/independent Quantitative Data Create histogram by hand and with calculator Discuss shape, center, spread Calculate range, median, quartiles and interquartile range Calculate population percentages based on quartile info Mean, Median, Standard Deviation, IQR (Interquartile range) Calculate Determine most appropriate measure based on data info Normal Distribution Determine whether a data set is normal Z-Scores Calculate Use scores to compare data
Stats in Your World text
CC.9-12.S.IC.1 CC.9-12.S.IC.2
S-ID5
CC.9-12.S.IC.6 S-ID 3
S-ID 1 S-ID 2 S-ID 3
CC.9-12.S.ID.4 S-ID 2 S-ID 3
CC.9-12.S.ID.4

Draft 1
Algebra 3 Unit 5: Statistics
Unit Assessments The items developed for this section can be used during the course of instruction when deemed appropriate by the teacher.
Section Quizzes, End-of-Unit Test
Application
The Pew Research Center for the People and the Press (http://people-press.org) has asked a representative sample of U.S. adults about global
warming, repeating the question over time. In January, 2007 the responses reflected an increased belief that global warming is real and due to
human activity. Below is a display of the percentages of respondents choosing each of the major alternatives offered, list two errors in the
display.
Normal Model 68-95-99.7 model Sketch with deviations identified Calculate percentages of a population Calculate z-scores for a given population percentage

Draft 1
Algebra 3 Unit 5: Statistics
A town’s January high temperatures average 36oF with a standard deviation of 8
o, while in July the mean high temperature is 75
oF and the
standard deviation is 10o. In which month is it more unusual to have a day with a high temperature of 55
o? Show work and explain your answer.
Companies who design furniture for elementary school classrooms produce a variety of sizes for kids of different ages. Suppose the heights of
kindergarten children can be described by a Normal model with a mean of 39.2 inches and a standard deviation of 1.9 inches.
a. Calculate the z-score for a child’s height of 42 inches.
b. Calculate the z-score for a child’s height of 35 inches.
c. Use your calculator to determine the percent of children whose heights fall 35 and 42 inches. Write down the calculator “operation” as
your work.
d. What percent of kindergarten children should the company expect to be less than 35 inches tall? Again use your calculator and write
down the “operation” as your work.
e. Use your calculator and find the z-score for the lowest 20% of the children’s heights. Find the height that corresponds to this z-score,
then sketch and shade in the normal curve showing this 20%. Clearly label your graph.
f. Use your calculator and find the z-score for the highest 4% of the children’s heights. Find the height that corresponds to this z-score,
then sketch and shade in the normal curve showing this 4%. Clearly label your graph.

Draft 1
Algebra 3 Unit 6: Probability and Counting
Pacing: 3 weeks A/B Block Schedule
Mathematical Practices
Mathematical Practices #1 and #3 describe a classroom environment that encourages thinking mathematically and are critical for quality teaching and learning. Practices in bold are to be emphasized in the unit. 1. Make sense of problems and persevere in solving them. 2. Reason abstractly and quantitatively. 3. Construct viable arguments and critique the reasoning of others. 4. Model with mathematics. 5. Use appropriate tools strategically. 6. Attend to precision. 7. Look for and make use of structure. 8. Look for and express regularity in repeated reasoning.
Standards Overview
Use permutations and combinations to compute probabilities of compound events.

Draft 1
Algebra 3 Unit 6: Probability and Counting
Priority and Supporting CCSS Explanations and Examples*
CC.9-12.S-CP.9 (+) Use permutations and combinations to compute probabilities of compound events and solve problems
!
( )!n r
nP
n r
!
( )! !n r
nC
n r r
CC.9-12.MD.1 (+) Define a random variable for a quantity of interest by assigning a numerical value to each event in a sample space
Concepts What Students Need to Know
Skills What Students Need To Be Able To Do
Bloom’s Taxonomy Levels
Sample Space
Probability
Counting principle
Permutation
Combination
Create
Calculate
Understand
Identify
Calculate
Identify
Calculate

Draft 1
Algebra 3 Unit 6: Probability and Counting
Essential Questions
In what ways does one event impact the probability of another event occurring? How is probability used to make informed decisions about uncertain events?
Corresponding Big Ideas
Probability provides a process to determine the likelihood of events and determine whether the occurrence of one evnt makes some other result more or less likely. The rules of probability can lead to more valid and reliable predictions about the likelihood of an event occurring.
Standardized Assessment Correlations (State, College and Career)
CollegeBoard PSAT and SAT
Vocabulary
Probability, random selection, sample space, outcome, factorial (!), counting principle, permutation, combination,

Draft 1
Algebra 3 Unit 6: Probability and Counting
Unit Assessments The items developed for this section can be used during the course of instruction when deemed appropriate by the teacher.
Section quizzes, End-of-Unit Test
Learning Activities
Topic Source(s) CCSS
Create sample space
Calculate probability
Determine whether written scenario represents a permutation or combination
Select the appropriate formula to accurately calculate the count of a permutation and/or combination
Stats in Your World Chapter 13 p. 284
CC9-12.CP.9