Mathematical modeling in the high school classroom
91
Louisiana State University LSU Digital Commons LSU Master's eses Graduate School 2012 Mathematical modeling in the high school classroom Selena Oswalt Louisiana State University and Agricultural and Mechanical College, [email protected] Follow this and additional works at: hps://digitalcommons.lsu.edu/gradschool_theses Part of the Physical Sciences and Mathematics Commons is esis is brought to you for free and open access by the Graduate School at LSU Digital Commons. It has been accepted for inclusion in LSU Master's eses by an authorized graduate school editor of LSU Digital Commons. For more information, please contact [email protected]. Recommended Citation Oswalt, Selena, "Mathematical modeling in the high school classroom" (2012). LSU Master's eses. 3306. hps://digitalcommons.lsu.edu/gradschool_theses/3306
Transcript of Mathematical modeling in the high school classroom

Louisiana State UniversityLSU Digital Commons
LSU Master's Theses Graduate School
2012
Mathematical modeling in the high schoolclassroomSelena OswaltLouisiana State University and Agricultural and Mechanical College, [email protected]
Follow this and additional works at: https://digitalcommons.lsu.edu/gradschool_theses
Part of the Physical Sciences and Mathematics Commons
This Thesis is brought to you for free and open access by the Graduate School at LSU Digital Commons. It has been accepted for inclusion in LSUMaster's Theses by an authorized graduate school editor of LSU Digital Commons. For more information, please contact [email protected].
Recommended CitationOswalt, Selena, "Mathematical modeling in the high school classroom" (2012). LSU Master's Theses. 3306.https://digitalcommons.lsu.edu/gradschool_theses/3306

MATHEMATICAL MODELING IN THE HIGH SCHOOL CLASSROOM
A Thesis
Submitted to the Graduate Faculty of the
Louisiana State University and
Agricultural and Mechanical College
in partial fulfillment of the
requirements for the degree of
Master of Natural Sciences
in
The Interdepartmental Program in Natural Sciences
by
Selena Oswalt
B.S., Mississippi State University, 1996
August 2012

ii
TABLE OF CONTENTS
ABSTRACT.................................................................................................................... iv
CHAPTER 1: INTRODUCTION..................................................................................... 1
CHAPTER 2: LITERATURE REVIEW ........................................................................... 8 2.1 Importance of mathematical modeling ...................................................................... 8 2.1.1 What is mathematical modeling? ............................................................... 8 2.1.2 Why use mathematical modeling? ........................................................... 10 2.2 Role of the teacher ............................................................................................... 13
2.2.1 Are teachers currently using mathematical modeling? ............................ 13 2.2.2 What skills do teachers need in order to use mathematical modeling? .... 15 2.2.3 What will effective professional development on mathematical modeling
entail? ...................................................................................................... 18 CHAPTER 3: GETTING STARTED ............................................................................ 21 3.1 Start small. ........................................................................................................... 23 3.2 Find problems that are interesting, fun, relatable, or realistic. ............................... 25 3.3 Allow time for students to evaluate other students’ responses. ............................ 26 3.4 Have students interpret a problem verbally, numerically, graphically, and algebraically. ........................................................................................................ 34 3.5 Give students more guidance at the beginning. Then, decrease the amount of guidance offered as they become more proficient. ............................................... 36 3.6 Test student understanding with a task that assesses the same concepts but does not look exactly the same. ........................................................................... 38 3.7 Incorporate technology. ........................................................................................ 42
CHAPTER 4: SAMPLE MODELING TASKS ............................................................... 45 4.1 Finding volume....................................................................................................... 46 4.1.1 The disappearing snowman ...................................................................... 47 4.1.2 Volume of General Sherman .................................................................... 51 4.2 Exponential and linear growth ................................................................................ 54 4.2.1 Population of Livingston Parish ................................................................ 55 4.2.2 Cell phone saturation ................................................................................ 58 4.2.3 Life expectancy in the U.S. ...................................................................... 60 4.3 Optimization ........................................................................................................... 61 4.3.1 Creating the optimum enclosure ............................................................... 61 CHAPTER 5: CONCLUDING THOUGHTS .................................................................. 65
REFERENCES ............................................................................................................ 67

iii
APPENDIX A: LIST OF COMMON CORE STATE STANDARDS FOR
MATHEMATICAL PRACTICE AND MODELING STANDARDS ................................... 70
APPENDIX B: ADDITIONAL MODELING TASKS ...................................................... 81
VITA............................................................................................................................. 86

iv
ABSTRACT
Mathematical modeling is the procedure whereby students apply mathematical
concepts learned in class to new and unfamiliar situations. A modeling task is a
mathematically-rich problem that engages students in mathematical thinking, drawing
upon their previously learned knowledge and supporting their understanding of the
mathematical concepts currently being covered. Modeling requires students to assign
meaning to the mathematical concepts and to extend the concepts beyond rote
learning. In order for students to be successful in a classroom that is centered around
the idea of mathematical modeling, the students must be taught how to collaborate with
other students, persevere through challenging problems, and become aware of their
own thinking.
In this thesis, I focus on a professional development workshop designed to train
high school teachers on how to successfully use mathematical modeling in their
classroom by providing them with guidelines on how to use modeling tasks effectively,
sample tasks that can be used, and instruction on how to develop modeling tasks for
their classroom. The goal is to affect change in the daily routines of high school
mathematics classrooms by providing teachers with compelling reasons why changes
are necessary, steps on how to make the necessary changes, and good examples of
problems to be used in class.

1
CHAPTER 1: INTRODUCTION
The new Common Core State Standards in Mathematics (CCSSM) will begin to
be implemented in the upcoming school year (2012-2013). New assessments will be
put in place, and beginning from third grade, students will be assessed every 9 weeks
with a computer-based national test. The tests will be piloted in the next two school
years and fully implemented in the 2014-2015 school year. States have divided
between two consortiums who are designing the assessments, Smarter Balanced
Assessment and Partnership for Assessment of Readiness for College and Careers
(PARCC). Louisiana is part of the PARCC consortium. According to PARCC, the high
school assessments will include “innovative constructed response, extended
performance tasks, and selected response items.” In other words, the assessments will
have a component consisting of more traditional multiple-choice items that test students’
procedural skills and content knowledge but will also have a component consisting of
open-ended tasks in which students must demonstrate an ability to apply content
knowledge.
The CCSSM call for a greater emphasis on mathematical modeling. Students
will be assessed on their ability to solve a variety of open-ended problem types. Of the
six high school standards of mathematical content, modeling is the single most
important because mathematical modeling requires students to use both the content
standards and Standards for Mathematical Practice (SMP) to solve new and unfamiliar
problems. Modeling standards appear in each of the other five high school standards of
mathematical content and is one of the eight SMP. (For a complete list of the
Standards for Mathematical Practice and the modeling standards, see Appendix A.)

2
The increased rigor of the new standards and the development of new curriculum
materials that are tied to the standards represent a major challenge for teachers. In
January 2012, the Center on Education Policy reported the results of a survey of 33
states who are adopting the CCSS. As shown in Figure 1, 29 of the 33 states reported
that the CCSSM are more rigorous than the previous state standards, and 30 of the 33
states reported that the implementation of the CCSSM will require new or substantially
revised curriculum materials.
Figure 1
The increased rigor is just one challenge that teachers face. The new CCSSM
also require that students retain a secured set of mathematical knowledge from the
previous year(s) and that they will demonstrate sound mathematical practices as stated
in the SMP. The SMP outline ways in which students should be able to reason

3
mathematically and demonstrate both a procedural and conceptual understanding of
mathematics.
Each state must decide how to prepare both teachers and students for these
changes. As shown in Figure 2, all 33 of the states surveyed by the Center on
Education Policy reported that they are conducting statewide professional development
and designing professional development materials to help teachers master the
standards.
Figure 2
The transitional curriculum will be implemented in the 2012 – 2013 school year,
and the new curriculum and assessments will be put in place in the 2014 – 2015 school
year. It appears Louisiana is already behind schedule. According to results of a survey
conducted by the Southeast Regional Educational Laboratory, a branch of the Institute
of Education Sciences, six southeastern states, Georgia, Alabama, Florida, Mississippi,
and North and South Carolina, dedicated the 2011-12 school year to educator training.
All six states reported that state education agency staff conducted teacher training
through a variety of approaches. Teachers were or will be trained through online

4
sessions and webinars and face-to-face training. State agency training staffs also used
a train-the-trainer approach by training district teams who in turn trained school staff.
Student learning of mathematics largely depends on the mathematical tasks
designed and implemented by the teacher. The term “mathematical tasks” is a broad
term that can be used to describe almost any problem or exercise. The Mathematics
Assessment Program (MAP), which is a collaborative effort between University of
California, Berkley and the Shell Center at the University of Nottingham, has been
designing lessons and tasks that align with the CCSSM. MAP divides tasks into three
categories. Novice tasks are short, procedural problems that focus on specific content
or skills and require only a low level of the SMP. Apprentice tasks are more substantial
problems and require a greater use of the SMP. Expert tasks are less structured
problems that require content knowledge, problem-solving skills, and a full range of the
SMP.
The National Council of Teachers of Mathematics (NCTM) uses adjectives such
as “mathematically-rich, engaging, and worthwhile” to describe what it considers to be
good examples of mathematical tasks. While these terms are subjective, a good
modeling task should build on students’ previous knowledge, have more than one
solution strategy or be capable of being represented in multiple ways, generate
interesting questions beyond the questions posed, and encourage decision-making and
discussion. (Breen, 2010) In this thesis, tasks will refer to problems in which students
must engage in mathematical thinking and demonstrate sound mathematical practices
in conjunction with applying mathematical concepts in order to find a solution.

5
The quality of instruction depends on the quality and cognitive level of the tasks
chosen by the teacher. Most teachers base their instruction on how they were taught
and have little or no experience in mathematical modeling. Teachers need to be trained
on how to select and design tasks that are open-ended, encourage deep mathematical
connections, help students to secure mathematical knowledge and develop
mathematical practices, and lend themselves to cooperative work. (Ponte et al., 2009)
Teachers will also need to be trained on how to use these tasks effectively in the
classroom rather than following the traditional model of explaining the problems to the
students. (Breen, 2010) Professional development will be a vital component in
successfully implementing the new CCSSM and in changing the way that mathematics
is presented to the students.
When implementing changes in the classroom, teachers are much more likely to
use reform type pedagogy than reformed curriculum. (Silver, Mesa, Morris, Jon, &
Benken, 2009) The changes made in the classroom are generally made on the
“fringes” and do not change the level of student learning or address how to develop
students’ mathematical understanding. (Garet, Porter, Desimone, Birman, & Yoon,
2001) For the new curriculum to have an impact, teachers must receive training on how
to effectively implement open-ended tasks in the classroom. Modeling is an essential
part of the curriculum only if it provides an opportunity for students to develop a deeper
and stronger understanding of mathematics. (Zbiek & Conner, 2006)
Conventional wisdom among math teachers is that in-depth mathematical
modeling and problem solving should be reserved for the honors or advanced students.
The other students are taught a single skill, procedure, or manipulation followed by

6
practice with a variety of numbers. (Breen, 2010) According to Underwood Dudley
(2010) in his article “What is Mathematics For?,” teaching reasoning and problem
solving is the only purpose for teaching mathematics because very few students will
need the actual mathematical skills but all students will need the ability to think
mathematically. With the reform in education that will be fostered in with the new
CCSSM, all students will be expected to solve in-depth tasks. The eight SMP outlined
in the CCSSM make it clear that all students are expected to have both a procedural
and conceptual understanding of mathematics and be able to use reasoning and
problem solving skills in conjunction with the concepts learned in class to solve
challenging problems. These are the skills on which the students will be assessed
throughout the school year.
Advocates of the CCSS envision that the standards will guide teaching and
learning and elevate the quality of education. The real changes in how a classroom
should be run can be found in the SMP, which outline how students should learn
mathematics with meaning. In the race to develop new curriculum and align standards
with the previous grade-level expectations, the SMP will likely be ignored. (Hull, 2012)
Without quality professional development for teachers, there will be no change in daily
classroom procedures and the vision for the CCSS will be largely unsuccessful.
In this thesis, I focus on creating professional development to assist high school
teachers in implementing mathematical modeling in their classroom by providing them
with:
(1) Instruction and practice on mathematical modeling (2) Ready-to use classroom resources (3) An opportunity to examine and evaluate student responses

7
(4) Guidelines on appropriate use of technology (5) Assistance in developing mathematical modeling problems
Chapter 2 defines mathematical modeling, addresses the role of the teacher, and
describes the training that will be required in order for teachers to be able to effectively
use modeling. Chapter 3 outlines a set of steps for teachers to follow to get started
using modeling in the classroom. These steps are the ones that will be provided in a
binder during the professional development workshop. Chapter 4 provides a set of
more in-depth modeling tasks separated by content standards that will be used during
the workshop.

8
CHAPTER 2: LITERATURE REVIEW
2.1 Importance of mathematical modeling
2.1.1 What is mathematical modeling?
According to the CCSSM, mathematical modeling is the ability to apply concepts
learned in class to real world applications and to use the model to analyze a situation,
draw conclusions, and make predictions. It is more than simply presenting the students
with a word problem. It is a mathematical process that involves observing a situation,
conjecturing relationships, applying mathematical analyses, obtaining mathematical
results, and reinterpreting the model (Lingefjärd, 2006). As shown in Figure 3, it is an
iterative process that requires students to fine tune the model until a reasonable
prediction or result is obtained. The answer must be interpreted, and it may be
necessary to repeat the cycle before getting a valid solution. (Mooney & Swift, 1999)
The model activities should serve as an opportunity for students to develop and change
their understanding of mathematical concepts. The model should not be so narrow that
students already know all of the mathematics that will be needed to solve the problem.
(Zbiek & Conner, 2006)
Figure 3

9
In the CCSSM, Standard 4 of the SMP says that students should be able to
model with mathematics. The standard defines a proficient student as one who can
solve real world problems by applying mathematical concepts such as identifying
important quantities, making appropriate assumptions, and selecting a viable model for
finding a solution. The student should then be able to interpret the results within the
context of the problem and make revisions (if necessary) to the model before reaching a
final evaluation. All of the eight standards outlined in the SMP are addressed within the
context of a mathematical modeling problem. The other SMP call for students to:
Make sense of problems and persevere in solving them
Reason abstractly and quantitatively
Construct viable arguments and critique the reasoning of others
Use appropriate tools strategically
Attend to precision
Look for and make use of structure
Look for and express regularity in repeated reasoning
See Appendix A for a complete description of the 8 SMP. These standards describe a
classroom where students are actively engaged in challenging mathematical problems.
The SMP are not about skill-based content but are about establishing a classroom
setting where students are given opportunities to solve problems collaboratively and
discuss the solutions and prevailing mathematical ideas. (Hull, 2012)
The CCSSM standard on modeling calls for students to be able to create
mathematical and statistical models both with and without the use of technology by
following the basic cycle shown in Figure 4. Modeling appears in each of the other five
high school standards for mathematical content. Modeling standards are denoted by a
star symbol (★). See Appendix A for a complete list of the modeling standards.

10
Figure 4
It is not necessary for a modeling task to have a connection to the real world.
The primary purpose of a modeling task is to teach students reason, logic, and problem-
solving. (Dudley, 2010) A modeling task is any mathematically-rich problem that
engages students in mathematical thinking, drawing upon previously learned knowledge
and supporting their understanding of the mathematical concepts currently being
covered. Modeling tasks should challenge the students’ curiosity, encourage both
independent thinking and collaborative discussion, and provide significant mathematical
ideas and themes. The tasks should build on students’ previous knowledge and
encourage the formation of new ideas and concepts. (Breen, 2010)
2.1.2 Why use mathematical modeling?
Teachers often complain that students fail to retain mathematical knowledge and
are unable to apply a previously learned skill to a new type of problem. Students who
are taught solely from traditional, textbook problems fail to grasp the relevance of what
they are learning. Students form a perception of what a subject is about based on the
tasks they are assigned. This explains why most students view mathematics as a set of

11
rules or procedures on how to move symbols around. (Hiebert & et al., 1997) The
current method of instruction encourages students to compartmentalize concepts and
procedures and to approach mathematics as a series of topics to be memorized and
quickly forgotten. The CCSSM assume that students will have a set of secured
knowledge that is retained throughout their years in school. Using mathematical
procedures within the context of authentic activities allows students to view procedures
as tools rather than the end result of their knowledge making them more likely to be
able to adapt and use the procedures in other situations. (Boaler, 1998)
While a repetition of procedures until they become automatic does have value,
students should then be required to achieve a higher level of understanding of the
concepts. (Tall, 2008) The use of high quality tasks in the classroom can serve as the
bridge between process and concept. Mathematical modeling encourages a deeper
comprehension of mathematical ideas and trains students to reflect, interpret, and
formulate a plan when presented with a non-traditional problem. When used correctly,
mathematical modeling encourages students to stop viewing mathematics as
techniques and procedures and start viewing it as a tool to solve problems.
(Biembengut & Hein, 2010) W. Gary Martin, a professor of mathematics education at
Auburn University said, “We keep teaching that learning to carry out complicated
procedures is what math’s about. To me the real question is, can students do anything
with it?” (Cavanagh, 2009)
In their article “Beyond Motivation: Exploring Math Modeling as a Context for
Deepening Students’ Understandings of Curricular Mathematics,” Zbiek and Conner
(2006) say that modeling tasks lead students to a deeper conceptual understanding of

12
mathematical entities by requiring them to combine multiple mathematical objects,
properties, and parameters into a single mathematical entity and that modeling tasks
improve students’ procedural understanding by requiring them to select the appropriate
procedure and perform mathematical manipulations.
The National Council of Teachers of Mathematics (NCTM) has adopted a
philosophy akin to the CCSSM as seen in their “Focus in High School Mathematics:
Reasoning and Sense Making.” The NCTM guidelines state that students need to learn
to apply the math content and procedures learned in class to different situations. The
ability to apply knowledge is an essential skill in higher learning and in the workplace.
Further, the NCTM argues that focusing on reasoning rather than rote procedures will
not burden the teacher but instead will produce more engaged students. (Cavanagh,
2009) Teaching students to think mathematically is beneficial regardless of their future
occupation. The purpose of teaching mathematics is for students to develop reasoning
skills so that they are able to analyze and solve a problem. (Dudley, 2010)
Assessment drives what and how mathematics is taught. Up to now, teachers
have focused on teaching students content and expected students to develop
mathematical habits and thinking skills on their own. (Breen, 2010) This teaching style
only works for the top tier students who are interested in mathematics. The CCSSM
outline both content standards and mathematical practices, both of which will be
assessed on nine weeks tests. It will be necessary for teachers to incorporate
mathematical modeling problems that require students to use thinking and reasoning
skills along with content knowledge.

13
2.2 Role of the teacher
2.2.1 Are teachers currently using mathematical modeling?
Research has shown that teachers rarely present students with challenging
problems that require complex mathematical thinking. When teachers do use word
problems, they are usually brief and perfunctory with no thought for the authenticity of
the problem. Rarely is finding the solution to a complex task the central part of the
lesson. The research provided by Gainsburg (2008) in the article “Real World
Connections in Secondary Mathematics Teaching” pointed to the fact that teachers’
primary goal in using real-world examples is to impart mathematical content rather than
in teaching the students to choose an appropriate method and apply various concepts
to solve the problem. (Gainsburg, 2008) When teachers use word problems, they tend
to present a stereotypical solution to students, grouping problems according to the type
of solution required without considering alternative methods for solving. This
instructional technique focuses the instruction on a particular method or strategy rather
than on investigating a problem. (Leikin, 2003) Because teachers rely so heavily on
their own math experiences, which for the most part included little or no mathematical
modeling, many teachers will be uncomfortable with mathematical modeling problems
where there are multiple approaches for solving the problem and in some cases multiple
correct solutions.
There is a huge disparity between what teachers believe that they do in their
classroom and what they actually do. In the TIMSS video study, teachers throughout
the country, almost without exception, stated that they used the most current ideas

14
about teaching mathematics in their classroom, but when videoed it was found that they
all followed a formulaic method of instruction where they stated a mathematical concept
or rule without development of proof, showed students what to do, and then assigned
similar problems for practice. There were no instances in which teachers used proofs or
deductive reasoning. (Hiebert & Stigler, 2000) In an analysis of National Board
applications where teachers were asked to submit sample lessons that demonstrated a
deep level of mathematical understanding, most lessons required only low-level, rote
activities. The majority of the lessons focused on a single mathematical topic, and
fewer than half of the lessons asked students to provide any sort of explanation.
Teachers used a variety of pedagogical strategies, but few were used in a systematic
way that was designed to increase student engagement of understanding. (Silver, et
al., 2009) Again, these were samples that teachers chose to represent their best
teaching practices.
One reason that teachers do not use thought-provoking tasks is a fear of over-
challenging the students. Most teachers cited by Gainsburg (2008) held the belief that
students could not be presented with challenging problems because of their deficient
mathematical skills. Teachers failed to see how the problem itself could be a tool for
instruction. A second reason is the lack of resources. Most teachers reported that they
developed problems from their own head or past experiences and cited a lack of time
and resources as a factor in not using these types of problems more often. (Gainsburg,
2008)
Teachers are generally ill-prepared to implement the new curriculum and
teaching methods that will be required to align with the CCSSM because they learned to

15
teach by using a model that relies heavily on memorizing facts without developing
deeper understanding. (Garet, et al., 2001) Many teachers have relied on what Hung-
His Wu in the article “Phoenix Rising: Bringing the Common Core State Mathematics
Standards to Life” refers to as Textbook School Mathematics (TSM), which consists of a
“bag of tricks” where students are made to feel “that what is learned in one year can be
forgotten in the next.” TSM employs analogies and metaphors and half-explanations.
Mathematical modeling requires a shift in thinking where teachers use precise
mathematical language and provide correct, coherent, precise, and logical mathematical
explanations. (Wu, 2011)
This type of shift in thinking will require a more serious professional development
that addresses students’ mathematical thinking, appropriate use of technology, student-
teacher communication, and refined teaching practices. (Wu, 2011) These factors will
need to be addressed in professional development opportunities where teachers are
provided with ready-made resources, shown how to use modeling in the classroom
through sample tasks, and given an opportunity to develop their own mathematical
modeling tasks. The disconcerting truth is that through all the previous changes to
educational standards, expectations, and curriculum the daily classroom routines have
remained basically the same. (Hull, 2012)
2.2.2 What skills do teachers need in order to use mathematical modeling?
The main difficulty with implementing modeling in the curriculum is the lack of
experience of teachers both as students and during their teacher training. (Biembengut
& Hein, 2010) Many teachers are not comfortable with uncertainty in the classroom and

16
need practice on developing the skills needed to walk students through these tasks
without providing them with too much assistance. In some cases, teachers undermine
the complexity of a task by providing students with too much support and explanation
rather than requiring the students to develop mathematical thinking by providing their
own explanations. (Silver, et al., 2009) Within a classroom, teachers and students
establish a “didactical contract” where they negotiate the responsibilities of each and
establish who is responsible for producing new ideas and concepts. (Herbst, 2003) In
a traditional classroom, students learn that the teacher will provide them with the steps
for solving problems; so rather than trying to solve a problem themselves, they wait for
the teacher to provide the solution.
Students do not learn how to think mathematically by being told exactly what to
do or having a problem explained to them. Students should attempt a task before the
teacher intervenes or offers assistance. (Breen, 2010) In a classroom where
mathematical modeling is used, teachers will need to establish that students are
responsible for coming up with methods for solving the problems presented and that the
teacher will assist and facilitate but not provide answers.
Because of the different teaching techniques inherent in mathematical modeling
tasks, teachers will need training on how to conduct the class. Tasks that incorporate
high levels of thinking can be beneficial to students’ understanding if implemented
correctly but can actually limit students’ progress if done poorly. (Galbraith, Stillman, &
Brown, 2010) One aspect of teacher training should focus on the interactions that occur
between teacher and student and between students during the modeling process.
Teachers will need training on the technique of scaffolding, providing assistance that

17
enables the student to complete a task without reducing the complexity of the task.
(Henningsen & Stein, 1997) The types of classroom exchanges that occur during class
are a crucial part of helping students develop mathematical thinking through a level of
uncertainty that does not reach a point of complete frustration. (Zaslavsky, 2005)
Because it would be impossible to interact with every student individually and correct all
erroneous ideas developed, classroom discussions are a vital part of the mathematical
modeling process. During these discussions, the teacher needs to learn to be a
facilitator rather a lecturer. Class discussion should be a time for students to consider
the strengths and weaknesses of the ideas presented and to decide on the best or most
reasonable solution. (Inoue, 2011)
Another aspect of training will need to focus on allowing students an appropriate
amount of time to complete a task. Having too much or too little time is one of the
primary factors in reducing the effectiveness of a task. If students have too much time,
they lose focus on the main ideas or concepts behind the task. They may conduct
unsystematic explorations that are not useful to the task or become off task where they
are not doing any mathematics. This can also occur if students are allowed to struggle
without focus for too long. Too little time can shift students’ focus from the important
concepts to simply trying to get the correct answer. (Galbraith, et al., 2010)
Teachers will also need assistance in developing high quality tasks. Giving
students an inappropriate task, either too complex or too simple, that does not build on
their previous knowledge or that does not provide enough instruction is not effective in
increasing student understanding. The tasks should be problems that students are
interested in solving but that have the ultimate goal of increasing students’ mathematical

18
understanding. (Hiebert & et al., 1997) It is important that these tasks are at an
appropriate level for students so that they are challenged but able to solve them.
Criteria for a good model include that it is possible to identify mathematical questions,
has a solution process that is realistic for the students, has a method of checking the
validity of the solution, and provides a structured sequence of questions that do not
sacrifice the validity of the original problem. (Galbraith, et al., 2010)
Using mathematical modeling increases the difficulty of classroom management
for the teacher, and the teacher must decide what role he or she is to play in the
classroom. Modeling also increases the level of planning and raises the question of
how to assess the students’ work. Supplying teachers with well-constructed samples of
mathematical models, allowing them to experience several tasks as students, letting
them examine and critique both good and bad examples of student work, and giving
them an opportunity to work on creating their own samples of mathematical modeling
problems will be helpful in assisting teachers in making the transition in their classroom.
2.2.3 What will effective professional development on mathematical modeling entail?
According to results from a national sample of teachers conducted by Garet
(2001), the primary factor in the impact of professional development is time span and
contact hours. Ideally, the training will span over several days, and then teachers within
the same school or subject area will form learning communities where information,
ideas, and lessons are shared. (Garet, et al., 2001) Professional development that
occurs over several days gives teachers an opportunity to assimilate the new ideas and
makes it more likely that they will integrate the new practices into their classrooms.

19
(Penuel, Fishman, Yamaguchi, & Gallagher, 2007) The research indicates that short
workshops have little impact on teaching or on student learning especially if the
workshops are not content-specific. One study found that training that ranges from 30 –
100 hours shows positive effects on student learning while training that ranges from 5 –
14 hours has no impact. (Szatajn, Campbell, & Yoon, 2011)
Effective professional development should also be subject-specific rather than
focusing on general pedagogy, and teachers need to be actively engaged during the
training. Teachers are more likely to change their teaching practices from a
professional development if they have an opportunity to plan how the new ideas can be
used in their classroom. (Garet, et al., 2001) Research also indicates that the focus of
the training should be narrow and remain focused on one specific instructional practice.
Broadening the band of focus reduces the likelihood that the teacher will implement the
practice. (Desimone, Porter, Garet, Yoon, & Birman, 2002) There should be time
allotted for instructional planning and discussion among the teachers. (Penuel, et al.,
2007) Speaking from my professional experience, teachers immediately dismiss any
idea that they do not perceive to be directly relatable to their class. It will be very
important to make the teachers believe in the idea of mathematical modeling
The professional development should provide teachers with an opportunity to
learn challenging mathematics in the way that they are expected to teach. This is
accomplished by having the teachers complete challenging mathematical tasks during
the training. (Zaslavsky & Leikin, 2004) When teachers are active learners in the
professional development, the impact is much greater than when they are the passive
recipients of information. An opportunity to engage in high-order, conceptual activities

20
and to discuss them with colleagues helps to deepen teachers’ understanding of how
students think about and learn mathematics. (Desimone, et al., 2002) The leader of the
training needs to focus the discussion on underlying mathematical ideas that come from
varying methods of approaching a problem and the impact on instruction. (Elliott et al.,
2009)
Teachers also benefit from an opportunity to review student work in order to
better understand how to identify and address student problems as well as develop
lessons that are at an appropriate cognitive level. (Garet, et al., 2001) The analysis of
student thinking is a significant part of preparing teachers to confront a variety of
responses from students which is inherent in mathematical modeling problems.
(Prediger, 2010) Teachers need to be able to evaluate the plausibility of students’ ideas
quickly and be able to determine the reason behind a students’ error in thinking in order
to be able to manage mathematical modeling tasks. (Loewenberg Ball, Thames, &
Phelps, 2008)
Research indicates that when teachers receive focused, sustained, high-quality
professional development their teaching changes. The challenges that school districts
must overcome are a shortage of time and money. (Desimone, et al., 2002) In this
thesis, the focus is to create a professional development for high school teachers on
how to implement mathematical modeling effectively in their classrooms.

21
CHAPTER 3: GETTING STARTED
When first confronted with changes in educational policy, curriculum, and
standards, most teachers react with suspicion, defensiveness, and resistance. This is
understandable considering the number of times that policy has changed at the local,
state, and federal level during the course of most teachers’ careers. Additionally, it is
very difficult for teachers, particularly those who have taught for a significant number of
years, to change from established practices. If classroom instruction and expectations
are truly to be changed, teachers must be given compelling reasons on why they should
change. They need to believe that the benefits of changing outweigh the comfort and
convenience of using established curriculum and practices. Teachers will need to be
given guidelines that demonstrate both how to change and why change is beneficial.
These guidelines need to be non-threatening and feasible to implement immediately in
the classroom.
While working on creating tasks for the mathematical modeling workshop, I
asked various teachers at my school to pilot some of the problems in their classrooms.
An exchange with an Algebra I teacher provides a glimpse into how the mindset of
teachers will need to be adjusted as the new CCSSM are implemented. I gave her a
problem that discussed how the temperature in the troposphere decreases as altitude
increases (see Problem 3.1). Students were asked to write a linear equation and then
to complete several tasks using the information given in the problem. She asked me if
she should walk the students through the problem. When I said that students should
first complete the problem independently or in pairs, she said that the students would be
uncomfortable with the problem because they “have never seen a problem like this

22
before.” Another Algebra teacher approached and after looking at the problem said that
the students would not recognize the information given on the picture as ordered pairs
on a graph. I explained that the point was to teach them to apply the skills learned in
class to new and unfamiliar situations. When the Algebra I teacher gave me the student
work, she said that students questioned her about the word troposphere. She told them
to “ignore the words and just do the math.”
This chapter provides the seven guidelines that teachers will be given during the
workshop outlining how to begin using mathematical modeling in their classroom along
with sample tasks that can be used in any high school math course. The goal of the
workshop will be to realign some of the prevalent habits in mathematics education.
Teachers need to see that when using mathematical modeling the students should not
immediately know how to solve the problem. Both teachers and students will need to
get used to the slightly uncomfortable feeling of not knowing the exact path to take in
solving a task. This is part of the learning process and is much more valuable than
having students complete rote problems that focus on one particular skill. Students do
not need to have the one “correct” answer in order to learn from a task; both correct and
incorrect answers are valuable teaching tools. Students should be guided through tasks
but not given the direct route and should be expected to do more than repeatedly mimic
a procedure.
The following is the set of guidelines on getting started with mathematical
modeling in the classroom and a sample problem from the teacher binder that will be

23
used for the professional development along with the standards addressed by the
problem. (A complete list of the standards referenced for each problem can be found in
Appendix A.) The idea behind the guidelines is that modeling, like all of mathematics,
has a vertical structure. Students should start with a simple model and then progress to
the more complicated. Even a simple model should lead to more questions and be able
to be evolved into a more extensive task. Teachers will not only solve the problems
during the workshop but will also discuss and analyze solutions and discuss ways in
which the tasks could be extended.
3.1 Start small.
As previously stated mathematical modeling problems can vary from a basic
riddle to a more complex, open-ended word problem that does not have one definitive
solution. A modeling task could conceivably take weeks to solve. This idea will seem
overwhelming or unrealistic to many teachers, particularly those who are very
comfortable in their classroom routines.
In the professional development workshop, teachers will be provided with a set of
“small” modeling tasks that can be used as bell ringers, closers, or transitions between
activities. These problems are designed to be thought-provoking to the students and
require critical thinking as well as address one or more of the CCSSM on modeling and
the SMP. They are also designed to be a starting point for changing the types of
questions that teachers pose to students.
Problem 3.1 is a fairly basic linear equation problem. However, it requires
students to read through and interpret the information given rather than simply giving
the students two ordered pairs or the slope and an ordered pair. Students must

24
recognize that the rate at which the temperature decreases is the slope of the line and
that the graphic of the mountain is providing several points that lie on the line. As with
all of the “small” tasks, the problem is designed to be a short problem that could be
extended into a lengthy class discussion or more extensive task. During the workshop,
teachers will discuss additional questions that could be presented to the students and
brainstorm ways in which the problem could evolve into a more in-depth modeling task.
Problem 3.1: Temperature and Altitude
As altitude increases, the air temperature usually decreases. The rate at which the temperature drops is known as the lapse rate. On average, the lapse rate of the troposphere (the first layer of the Earth’s atmosphere) is 3.6 degrees Fahrenheit per 1,000 feet or 6.5 degrees Celsius per 1,000 meters. The picture below shows an example where the temperature at an altitude of 0 m is 30 0C. (a) Write an equation that models the temperature T (in degrees C) as a function of the altitude x (in meters) for the example shown in the picture. (b) Demonstrate that your equation is reasonable by using one of the data points provided on the picture. (c) Sketch the graph that reflects the relationship between x and T. Show a clearly defined scale on each axis and label the axes. (d) What is a reasonable domain for the function T(x)? Explain your reasoning. (e) What is the slope of the line? What is the meaning of the slope in terms of temperature and altitude? (f) What is the y-intercept of the line? What is the meaning of the y-intercept in terms of temperature and altitude?

25
Problem 3.1 continued
(g) This particular example was linear. How did you know from the information given that T(x) was a linear function? (h) Is it reasonable to assume that temperature always decreases at a linear rate as altitude increases? Explain. Standards addressed: A-CED-2 F-IF-4 F-IF-5 F-IF-7 F-BF-1 F-LE-2 F-LE-5 S-ID-7
3.2 Find problems that are interesting, fun, relatable, or realistic.
It should come as no surprise that many students find mathematics boring. The
most common question posed to any mathematics teacher is “When will I ever need to
use this?” We often fail as teachers to find problems in which students are interested or
to even take student interest into account when planning a lesson. Modeling problems
can be “real world” applications, but they do not necessarily have to be so. Problems
that spark students’ interest and curiosity will increase their attention and desire to
learn. These problems also begin to show students how a mathematician thinks. A
mathematician does not sit down to a worksheet of 20 problems; he or she studies a
problem in depth.
Most word problems used in class are contrived to provide practice on a single
procedural skill and are fairly silly when examined closely. The cartoon shown in figure
3 illustrates the point that many students would like to make and shows that students
miss the point of solving a math problem when presented with problems of this nature.
Using this type of problem is sometimes unavoidable; however, student interest should
be a consideration when constructing a lesson. Students should see a math problem as
a puzzle to be figured out.

26
Figure 3
Problem 3.2 is the original problem that Fibonacci posed which led him to the
famous Fibonacci sequence. This problem is one that the students find interesting,
especially as they realize the quickness with which the number of rabbits increases. It
also could lead to a variety of mathematical discussions as many students are very
uneducated about the idea of sequences. This would be an opportunity to show
students how to write a recursive formula and also how to use either a spreadsheet or
the graphing calculator to display a sequence. It is the type of problem that could be
done in 15 minutes or in several class periods depending on the course.
3.3 Allow time for students to evaluate other students’ responses. Teachers constantly feel the pressure of time constraints. Between the demands
of the curriculum and the end of course testing, the disruptions during a typical school
week, and other factors, it seems there is never enough time to cover the material that
is supposed to be covered in a particular course. In order to save time, teachers often
eliminate the types of modeling tasks that are being addressed here, citing that they
require too much class time.

27
Problem 3.2: Fibonacci’s Rabbits
Suppose a newly-born pair of rabbits, one male, one female, are put in a field. Rabbits are able to mate at the age of one month so that at the end of its second month a female can produce another pair of rabbits. Suppose that our rabbits never die and that the female always produces at least one new pair (one male, one female) every month from the second month on. What is the least number of pairs of rabbits in the field after: (a) one year? (b) two years? (c) ten years? (d) thirty years? (e) How long would it take for the rabbits to cover the earth? Standards addressed: F-BF-2
When modeling tasks are completed, it is even more unusual for a teacher to
take class time to discuss student responses. This is an imperative part of
implementing mathematical modeling in the classroom. Students should observe
alternate ways of approaching the problem and analyze a solution to identify its
strengths and weaknesses. Again, this practice teaches students to think like a
mathematician. Most students believe that there is only one way to solve a problem.
Allowing time to review student work exposes students to several ways of approaching
a problem and also allows for discussion of a variety of mathematical ideas.
Before reporting the results of a mathematical modeling task, the modeler is
supposed to interpret the solution, validate the results, and, if necessary, adjust the
model. Until students are accustomed to modeling problems, they will not take the time
to complete these steps independently. These steps will need to be completed as a

28
class so that students see the difference between a good answer and a bad answer and
the difference between a partial answer and a complete answer.
Particularly when a written explanation is required, students will provide terse
and incomplete answers unless taught otherwise. One way to do this is through the
discussion of student work. For example, question (g) from Problem 4.1 (see page 55)
asks students “Do you think the estimate from (f) is accurate? What factors or
assumptions may have affected the accuracy of the calculation?” Students need to be
given guidelines as to what constitutes an acceptable answer. One student responded,
“It probably is not accurate. There are many factors that we are not aware of.” When
presented to the class, students quickly pointed out that the student did not give any
examples of these “factors.” Another student’s response was “No because that is
assuming the sun stayed in the same place, the temperature never changed, and an
infinite amount of variables we cannot know.” The class recognized that this was a
better response because the student provided tangible assumptions made during the
problem. At this point, the class listed additional factors and assumptions that could
have affected the accuracy.
The discussion time can be formatted in a variety of ways and can be brief
interactions or more lengthy class discussions. Students can exchange ideas after a
bell ringer, during instruction, or as a closing activity. One technique is the think-pair-
share where students are first required to think about a problem for a prescribed amount
of time before pairing up to exchange ideas. There is then a class discussion of various
responses. Students should be expected to not only share solutions but also to share

29
their thought processes. Teachers will be guided through a think-pair-share activity
using Problem 3.3.
Student solutions should be evaluated by using a variety of questions such as:
(1) How was the work organized? (2) What did you like about the work? (3) What assumptions have been made? (4) What mistakes have been made? (5) What isn’t clear? (6) In what ways might the work be improved?
During the professional development, teachers will be shown sample student
work throughout the workshop and will be given an opportunity to participate in both
small group and class discussions analyzing the student work. The discussions will
serve two primary purposes: to model how discussions should be conducted in the
classroom and to give teachers an opportunity to assess good and bad student
responses.
Problem 3.4 is a sample task from the Mathematics Assessment Program
College and Career Readiness (MAP). At first glance, this appears to be a fairly straight
forward problem; however, the problem actually requires linear programming which
most high school students have not been exposed to. Additionally, the student is not
given any guidelines on how he or she should solve the problem, leaving it open to the
students’ interpretation. Too often we restrict students by giving them exact instructions
for how a problem should be solved rather than letting the student decide on a method.
Figures 4 – 7 shows sample student work provided by MAP which displays a variety of
techniques. The mistakes that were made in the various solutions are valuable
teaching tools and provide an opportunity to examine how students think about
mathematics. Teachers will be asked to analyze and discuss each student’s response

30
in small groups using the table given in Figure 8. A class discussion will then follow
regarding the strengths and weaknesses of the various approaches.
Problem 3.3: The Monty Hall Problem
The following problem has been much discussed and debated. It appeared in the Ask Marilyn column in Parade magazine, and her response sparked a heated debate. It was mentioned in the book The Curious Incident of the Dog in Nighttime by Mark Haddon and in the movie 21.
Suppose you are on a game show and you are given the choice of three doors. Behind one door is a car; behind the others, goats. The car and the goats were placed randomly behind the doors before the show. The rules of the game show are as follows: After you have chosen a door, the door remains closed for the time being. The game show host, Monty Hall, who knows what is behind the doors, now has to open one of the two remaining doors, and the door he opens must have a goat behind it. After Monty Hall opens a door with a goat, he will ask you to decide whether you want to stay with your first choice or to switch to the last remaining door. Is it to your advantage to change your choice?
Standards addressed: S-MD-5 S-MD-7
Problem 3.4: Boomerangs
Phil and Cath make and sell boomerangs for a school event. The money they raise will go to charity. They plan to sell them in two sizes: small and large. Phil will carve them from wood. The small boomerang takes 2 hours to carve and the large one takes 3 hours to carve. Phil has a total of 24 hours available for carving. Cath will decorate them. She only has time to decorate 10 boomerangs of either size. The small boomerang will make $8, and the large boomerang will make $10. How many of each type of boomerang should they make in order to make as much money as possible? How much money will they then make? Standards addressed: A-CED-2 A-CED-3 A-REI-11

31
Figure 4
Figure 5

32
Figure 6
Figure 7

33
Alex’s solution (1) How was the work organized? (2) What did you like about the work? (3) What assumptions have been made? (4) What mistakes have been made? (5) What isn’t clear? (6) In what ways might the work be improved?
Danny’s solution (1) How was the work organized? (2) What did you like about the work? (3) What assumptions have been made? (4) What mistakes have been made? (5) What isn’t clear? (6) In what ways might the work be improved?
Jeremiah’s solution (1) How was the work organized? (2) What did you like about the work? (3) What assumptions have been made? (4) What mistakes have been made? (5) What isn’t clear? (6) In what ways might the work be improved?
Tanya’s solution (1) How was the work organized? (2) What did you like about the work? (3) What assumptions have been made? (4) What mistakes have been made? (5) What isn’t clear? (6) In what ways might the work be improved?
Figure 8

34
3.4 Have students interpret a problem verbally, numerically, graphically, and algebraically. Interpreting a problem verbally, numerically, graphically, and algebraically is the
mantra of College Board’s Advanced Placement curriculum. The CCSS are designed
to articulate the knowledge and skills students need to be college and career ready; AP
courses and exams are designed to represent the level of a first-year college course.
The CCSS have the goal of preparing students to handle college level work, and AP
courses demonstrate students’ ability to handle rigorous, college-level courses. Some
of the mathematics standards are identified with a (+) symbol to denote that a link to a
more advanced mathematics courses such as AP Calculus or AP Statistics.
In the quest to have graduating seniors both college and career ready, it makes
sense to follow the guidelines set out by College Board by having students analyze a
problem using a variety of techniques and models. Again, this analysis teaches
students to think and reason mathematically by approaching a problem from several
directions and allows students to develop the ability to decide on the technique, or
techniques, would be most useful when presented with an unfamiliar problem.
Problem 3.5 asks students to take a concept learned in Chemistry and examine it
in a variety of ways. Students first apply Boyle’s Law numerically by completing the
table and then graphically by creating a scatterplot. Using the table, students are asked
to examine the problem algebraically by writing an equation and then using the equation
to interpolate a volume value for a given pressure. Finally, students are asked to use
what they have seen numerically, graphically, and algebraically to explain Boyle’s Law
verbally by answering a variety of questions about the law and its applications.

35
Problem 3.5: Boyle’s Law
Boyle’s Law states that the pressure exerted by a gas held at a constant temperature varies inversely with the volume of the gas. For example, if the pressure is halved, the volume is doubled, and if the pressure is doubled, the volume is halved. A certain gas occupies a volume of 1.56 L at a pressure of 1 atmosphere. Assume that the temperature is held constant. (a) Using Boyle’s Law, fill in the missing volumes in the table below.
Pressure (atmospheres)
Volume (L) P V
0.25
0.5
1 1.56
2
4
8
(b) Make a scatter plot of pressure versus volume. Then, draw a smooth curve through the points. (c) Complete the third column of the table above. (d) Write an equation that expresses the volume of this gas as a function of the pressure. (e) Use the equation to find the volume of the gas if the pressure is 5.2 atmospheres.

36
Problem 3.5 continued
(f) Is it possible for the pressure or volume to equal 0? Explain. (g) Complete each statement: As the pressure approaches infinity, the volume approaches ______. As the pressure approaches 0, the volume approaches ______. Boyle’s Law is taught in scuba diving certification classes. (h) Describe what happens to the pressure and volume of the air in a person’s lungs as he descends under water? (i) As a diver ascends, it is very dangerous for him to hold his breath. What happens to the pressure and volume of the air in a person’s lungs as he ascends? What could happen if he held his breath? Standards addressed: N-Q-1 A-SSE-1 A-CED-2 A-CED-4 F-IF-7 F-BF-1 F-IF-4
3.5 Give students more guidance at the beginning. Then, decrease the amount of guidance offered as they become more proficient. When presented with an unfamiliar problem, a student’s first instinct is to stop
working. Most students are loath to attempt a problem unless they know the exact
steps required to find a solution. Along these same lines, many students will not
attempt a problem unless they have seen one exactly like it. Every high school math
teacher has received the student response of IDK, meaning “I don’t know.” One of the
difficulties that teachers must resolve is getting students to the point where they are
willing to take some risks in the field of mathematics. In the SMP, Standard 1 states
that mathematically proficient students start by looking for entry points to finding a
solution.
Risk-taking becomes easier as students learn to think more mathematically
which is accomplished by practicing more mathematics. The steps to getting started

37
listed previously are designed to increase student interest, participation, and
understanding but also to increase student confidence. Being a mathematician requires
self-confidence which most students lack when it comes to the field of mathematics.
Simply turning students loose on a problem that is too difficult will only cause them
frustration and a lower level of confidence. Students should be guided through
problems initially and assisted in finding the entry points. Gradually, the student should
be expected to fill in more of the intermediate steps as they become more proficient
problem solvers.
Particularly when a written explanation or response is required, students will
need to be given more structure initially. Otherwise, teachers can expect one word
responses that do not fully address the question. Providing students with structured
guidelines and taking the time to analyze various student responses (as discussed in
3.3) will increase the quality of the students’ responses.
In Problem 3.6, students are guided through the process of finding the solution.
When this problem was presented in class without the guiding questions, most students
answered the question very quickly, saying that the racers tied because they both
averaged 70 mph. Very little mathematics was done because students felt sure that
they knew the answer; not much was accomplished from the problem. Dividing the
problem into smaller parts guided the students through the problem while still requiring
that they analyze the situation and apply the knowledge learned in class. After
completing the first problem, students realized that the answer to the Problem 3.7 was
probably not as obvious as it may appear upon first reading it. Applying what they had

38
learned from the first problem, students were able to successfully answer the second
problem without the assistance of guiding questions.
Problem 3.6: Motorcross
It is the annual cross motorcycle race across the desert, 70 miles out and 70 miles back. Arlo, on his new Harley, averages 80 mph going out but has clutch trouble and only averages 60 mph on the way back. Pete, on a Honda, averages 70 mph for the whole race. Who won the race? (a) How long did it take Pete to complete the race? (b) How long did it take Arlo to travel the first half of the race? (c) How long did it take Arlo to travel the second half of the race? (d) What was Arlo’s average speed for the entire race? (e) Who won the race? Standards addressed: N-Q-1 A-CED-1 A-CED-4
Problem 3.7: Gas Mileage
Lucy and Ethel were both bragging about the gas mileage of their respective hybrids, each bought at the end of March. Ethel told Lucy “In April, my car got 40 miles per gallon, and in May, it got 50 miles per gallon.” Lucy responded, “Well, I got 45 miles per gallon in April and 55 miles per gallon in May. It is clear that my car is getting better gas mileage than your car.” After a few minutes, Lucy’s husband Ricky comes in and says, “Lucy, you are wrong. Ethel’s car got the better gas mileage for the two month period.” Could Ricky be correct? If so, give an example. If not, explain why. Standards addressed: N-Q-1 A-CED-1 A-CED-4 3.6 Test student understanding with a task that assesses the same concepts but does not look exactly the same. The easiest way to hold students accountable for their work is to grade it.
However, as students are going through the learning process, they should not be
graded on the tasks completed in class. Their work should be assessed and discussed
by both the teacher and their peers, but the students should not be penalized for

39
incorrect work. As discussed previously, incorrect work or errant mathematical thinking
should be used as a teaching tool and a chance for both the student and the class as a
whole to analyze the flaw in the work.
In Problem 3.8, students are required to use their knowledge of sine waves to
model periodic data. Students completed this problem in class and were allowed to
collaborate in pairs when they needed assistance, asking me a question only as a last
resort. After completing the task, students were shown a variety of student responses,
and the class discussed which responses were correct and which responses where
either incorrect or lacked sufficient explanation. For example, part (b) of the problem
asked the students to “Estimate the vertical shift of the function.” Three student
responses were 60, 76, and 92. The class was asked which response was correct and
what the other two students may have been thinking when they wrote their answer.
During the discussion students had to apply their understanding of amplitude, vertical
shift, and the midline of a sine wave to determine the correct answer and to explain the
erroneous thinking. Part (j) asked students to provide a city that would have a larger or
smaller amplitude or vertical shift compared to Baton Rouge. One student wrote that
Miami would have a smaller amplitude because “it is hot year round.” Another student
wrote that Miami would have a smaller vertical shift because “the temperature more
likely stays around the same year-round without many drastic changes.” The class was
shown each response and asked to decide on the veracity of each answer. The
discussion of the various responses provided an opportunity for students to clarify their
understanding of the concepts learned during the unit and to correct some
misunderstandings.

40
For the purpose of assessment, after the learning process, students should be
presented with similar tasks as the ones seen in class but not identical. Student
understanding cannot be tested if students are simply regurgitating something that they
have previously seen. Instead, students should be expected to apply the concepts
learned in class and draw on previously learned skills to complete a new and somewhat
unfamiliar task. On the unit test, students were given problem 3.9 which tested the
same skills as problem 3.8 but in a different format.
Problem 3.8: High Temperature in Baton Rouge
The following table shows the average high temperature for Baton Rouge each month.
Month Temp. (0F) Month Temp. (0F)
January 1 60 July 7 91
February 2 64 August 8 92
March 3 71 September 9 88
April 4 78 October 10 80
May 5 85 November 11 71
June 6 90 December 12 63
Make a scatter plot of the month vs. the temperature using the graphing calculator Using the data and the scatter plot, answer the following. (a) What is the period of this function? (b) Estimate the vertical shift of the function. (c) What does the vertical shift represent in terms of the temperature in Baton Rouge? (d) Estimate the amplitude of the function. (e) What does the amplitude represent in terms of the temperature in Baton Rouge? (f) Estimate the phase shift needed in order to model the data using a sine wave. (g) Using the answers from above, write an equation for the data in the form y = asin(bx + c) + d. (h) Use the graphing calculator to find the equation that best fits the data. Round to three decimal places.

41
Problem 3.8 continued
(i) Compare the equation found with the calculator with the equation you found. Explain any discrepancies. (j) Think of a city whose graph would have each of the following when compared with Baton Rouge. Put a reason for each answer. (1) larger amplitude (2) larger vertical shift (3) smaller amplitude (4) smaller vertical shift Standards addressed: F-IF-4 F-IF-7 F-BF-1 F-TF-5 S-ID-6
Problem 3.9: Number of Daylight Hours
The graphs below show the number of daylight hours for Boston and Fairbanks as a function of the day of the year.

42
Problem 3.9 continued
(a) Estimate the vertical shift for the graph of the daylight hours in Boston. What is the significance of the vertical shift in terms of the daylight hours in Boston? (b) Estimate the amplitude for the graph of the daylight hours in Fairbanks. What is the significance of the amplitude in terms of the daylight hours in Fairbanks? (c) What is the difference in the vertical shift of the two graphs? (d) What is the difference in the amplitude of the two graphs? (e) Which value from (c) and (d) better illustrates how the number of daylight hours in the two cities differ? Explain. (f) Write an equation for the number of daylight hours in Boston as a function of the day. Standards addressed: F-IF-4 F-IF-7 F-BF-1 F-TF-5 S-ID-6
3.7 Incorporate technology.
In a true modeling problem, students must decide what resources are needed to
solve a task. This could mean that the teacher has a variety of supplies at students’
disposal or that students have access to the Internet to research and find information or
that students are able to use a graphing calculator, spreadsheet, or other mathematical
software to assist in finding the solution. Students should be given opportunities to see
the ways in which technology can enhance mathematics and how mathematicians,
engineers, economists, and scientists use more complicated modeling techniques for
solving problems.
In Problem 3.10, students will need to make some assumptions in order to find a
solution but will also need access to the Internet to find information on average heights
and how height and weight relate to the body mass index (BMI). Students can use the
Internet to find the average height for both a male and female and then to determine

43
what weight, at that height, constitutes “normal,” overweight, or obese. Using that
information, students can estimate the total number of extra pounds at the school.
In Problem 3.11, students can find the answer using a variety of methods, but
technology, either in the form of a graphing calculator or spreadsheet, greatly assists in
finding the answer. After setting up direct equations for both the increase in the
population and the decrease in the number of deer that can be fed, students can use
the graphing calculator to find the intersection point as shown in Figure 9. Another
method of solving the problem is by writing recursive formulas for each and then using a
spreadsheet, as shown in Figure10, or the sequence feature on the graphing calculator.
Figure 9 Figure 10
In Problem 3.12, students can find the answer easily without technology;
however, a simulation either with the graphing calculator or with a statistics software
program is an ideal tool for allowing students to test the answer by quickly compiling
many trials. The Probability Simulation on the TI graphing calculator allows students to
conduct the trial as shown in Figure 11. Class results can then be compiled and
compared.
Figure 11
year N(t) F(t)
18 1689.966 2200
19 1808.264 2100
20 1934.842 2000
21 2070.281 1900

44
Problem 3.10: Fermi Estimate
A Fermi estimate is a problem that requires a person to make clearly defined assumptions and use estimation to arrive at an answer that seems impossible to calculate. The problems are named after Enrico Fermi, an American physicist, for his renowned ability to make good approximate calculations with little or no data. Fermi was much more interested in the order of magnitude of the solution than he was in the actual value. For example, if a solution was on the magnitude of 1014, then 2 x 10¹⁴ and 5 x 10¹⁴ would be considered the same answer. All solutions should show clearly defined assumptions and the calculations required. Louisiana is classified as the 5th most obese state in the country. It has a combined obesity and overweight rate of 66.4 %. The World Health Organization classifies a person as overweight if his or her BMI is greater than or equal to 25 but less than 30 and a person as obese if his or her BMI is greater than or equal to 30. Assuming that this percentage is true at our school, how many extra pounds are being carried at our school? Standards addressed: N-Q-1 N-Q-2 N-Q-3 G-GMD-3 G-MG-2
Problem 3.11: Food Shortage
A certain island has a deer population that is growing at a rate of 7% per year. Unfortunately the amount of vegetation has been decreasing so that each year the island can feed 100 fewer deer. Currently, the deer population is 500, and the island’s vegetation can support 4000 deer. In how many years will the island have more deer than can be fed? Standards addressed: A-SSE-1 A-CED-2 A-REI-11 F-BF-1 F-BF-2 F-LE-2
Problem 3.12: Game of Chance
In a certain game, a fair die is rolled and the player receives 20 points if the die shows a 6. If the die does not show a 6, the player loses 3 points. If the die is rolled 100 times, what will be the expected total gain or loss in points for the player? Standards addressed: S-IC-2 S-CP-1 S-CP-2 S-MD-5

45
CHAPTER 4: SAMPLE MODELING TASKS
One of the challenges for teachers is gathering a sufficiently large collection of
good math problems. Developing high-quality mathematical modeling tasks is a difficult
endeavor, and one that is never finished. Once a task is created, it can always be
improved upon, broadened, or extended. One of the goals of the workshop will be to
provide teachers with a set of quality modeling tasks to begin their collection as well as
some resources for finding tasks. Some websites that provide sample tasks are as
follows:
(1) Mathematics Assessment Program College and Career Readiness ((MAP) http://map.mathshell.org/downloads/map_ccss_ccr_tasks.pdf http://map.mathshell.org/materials/tasks.php (2) Mathematical Assessment Resource Service (MARS) http://www.nottingham.ac.uk/~ttzedweb/MARS/tasks/ (3) National Council of Mathematics Teachers (NCTM)
http://www.nctm.org/rsmtasks/ After teachers have been given the set of guidelines to follow when using
mathematical modeling (Chapter 3), the teachers will be given a set of more in-depth
modeling tasks that build upon the ideas discussed in Chapter 3 and further
demonstrate how to develop and implement mathematical modeling in the classroom.
This chapter provides a set of sample modeling tasks, separated by content standards,
that will be used during the workshop. The idea is to demonstrate to teachers how to
use the tasks by having the teachers complete the tasks, discuss various responses
and student work, and create or extend tasks for use in their classroom. This chapter
includes tasks on finding volume, examining linear and exponential growth, and
optimization. Additional tasks can be found in Appendix B.

46
4.1 Finding volume
The CCSSM for Geometry calls for students to be able to use volume formulas
for cylinders, pyramids, cones, and spheres to solve problems and to use geometric
shapes, their measures, and their properties to describe objects. The CCSSM for
Number and Quantity calls for students to be able to use units as a way to understand
problems and to guide the solution as well as define appropriate quantities for the
purpose of descriptive modeling. (See Appendix A for a complete list of the standards
referenced.)
Combining the standards for Geometry and Number and Quantity, students
should be able to do more with volume formulas than simply calculate the volume of a
three-dimensional geometric figure. Students should be able to make estimates and
apply geometric formulas to figures that may not necessarily be exact in their
dimensions. Students should develop the sense that there is a limit to how precise
some measurements can be and that in many cases it is impossible to obtain an exact
measurement.
The problems presented were designed with several purposes in mind. One is
simply to give teachers sample modeling tasks that align with the modeling standards
and employ the SMP. Another purpose is to give teachers an idea of what a modeling
task entails and how a concept taught in class can be developed into a modeling task.
With that in mind, I provided several variations of the same idea to give teachers a
sense of how a modeling task can be expanded from a very basic task to a more
complex or extended class project as well as how it can be adjusted according to grade

47
and skill level of the students. A third purpose is to give teachers an opportunity to take
a modeling task and rewrite or edit the task to make it usable for their classroom.
4.1.1 The disappearing snowman
Problems 4.1 and 4.2 show two variations of The Disappearing Snowman task.
Problem 4.1 is an in-class problem where students must take measurements from a
scaled drawing, make some estimations and assumptions, and use the volume formula
for a sphere. The task also incorporates skills learned in middle school or Algebra I
such as percentage calculations; drawing on previously learned skills is an important
part of a good modeling task.
Problem 4.2 is a more extensive problem. A sample “homemade” snowman is
given with questions for students to answer, or a teacher could opt to develop the task
into an out-of-class project where students are required to build their own snowman,
take measurements, and perform calculations. The task also draws on concepts from
Algebra I such as linear rates of change.
During the workshop, teachers will be asked to alter the task into an out of class
project. Using these tasks in a professional development will give teachers an idea of
how a simple idea can evolve into a true modeling task that requires students to apply
skills learned in class to solve an open-ended problem. Allowing them time to extend
the task given will give teachers an idea of how to begin creating their own modeling
tasks from activities that they may already use in their curriculum.

48
Problem 4.1: The Disappearing Snowman
After the first big snow of winter, a group of children gathered to build a snowman. The snowman was composed of three spherical shaped snowballs. Upon completion, the children went home for lunch and returned to the snowman one hour later only to find that he was quickly melting under the warm sun. Figure A is a picture of the snowman just after being built, and Figure B is a picture of him one hour later. For each figure, the scale is 1 cm = 30 cm. (a) Estimate the volume (in cm3) of the snowman’s body just after he was built (Figure A). Show calculations that lead to your answer. (b) Estimate the volume (in cm3) of the snowman’s body after one hour has elapsed (Figure B). Show calculations that lead to your answer. (c) Using the volumes from (a) and (b), calculate the percent decrease of the volume after one hour. (d) Using the percent decrease from (c), complete the table below. (e) Using the volume from the table above, estimate the radius of each snowball after 5 hours. Show calculations that lead to your answers. (f) Assuming that the percent decrease of the volume remains constant, determine the approximate time required for the snowman to melt completely.
Figure A
t (hr) 0 1 2 3 4 5
V (cm3)
Figure B

49
Problem 4.1 continued
(g) Do you think the estimate from (f) is accurate? What factors or assumptions may have affected the accuracy of the calculation? Standards addressed: G-GMD-3 G-MG-1 N-Q-1 N-Q-2
Problem 4.2: The Disappearing Snowman
Why should we miss out on building a snowman just because we live in southern Louisiana. Below is my snowman, Patrick O’Frosty just after I made him and again after one hour.
Just after making the snowman, I measured the circumference of each sphere and found them to be 40.2 cm, 32.0 cm, and 16.7 cm. (a) Estimate the initial volume (in cm3) of the snowman. Round to the nearest whole number. (b) Compare the two pictures above. Using the initial radius of each sphere, estimate the radius of each sphere after one hour. Calculate the volume (in cm3) of the snowman after one hour. (c) Find the average rate of change of the volume during the first hour. The pictures below show the snowman after 2 hours and 3 hours, respectively.

50
Problem 4.2 continued
During the second hour, the snowman lost 450 cm3 of water. During the third hour, the snowman lost 340 cm3 of water. (d) Use these values to complete the table below.
t 0 1 2 3
V(t)
(e) Is the volume decreasing at a linear rate? Explain. (f) Find the average rate of change of the volume during the first three hours. (g) Using the table above, predict the volume of the snowman at the end of hour 4. Show work or provide an explanation supporting your prediction. After 5 hours and 10 minutes, Patrick was gone. The total amount of water lost was 1570 cm3. (h) Find the percent error of your calculated volume from (a) compared to the actual volume of 1570 cm3.
100%valueactual
valueltheoreticavalueactualerror
Standards addressed: G-GMD-3 G-MG-1 N-Q-1 N-Q-2

51
4.1.2 Volume of General Sherman
Problems 4.3 and 4.4 show two examples of tasks where students are asked to
estimate the volume of General Sherman, a giant sequoia tree located in California’s
Sequoia National Park, which is called “the largest living thing on earth.” Problem 4.3 is
for use in a Geometry class. Students are given the basic dimensions and
measurements that are available on General Sherman and are asked to use the
information to estimate the volume. Students must decide how to best use the
information, make appropriate estimations, and use the volume formula for a cylinder.
In the workshop, teachers will examine the task and decide whether or not
students would need more guiding questions in order to complete the task successfully.
The task could also lead to an extensive class discussion on how volumes of things
such as a tree trunk are found and how accurate the volume estimates actually are.
Like the Disappearing Snowman, this task could evolve into an in-class or out-of-class
project where students estimate the volume of a smaller object such as a broccoli stalk.
The task also serves to introduce Geometry students to the Calculus concept of
finding the volume of a three-dimensional solid that is not a known geometric shape.
Students begin to realize that volume calculations in the real world are seldom simple or
convenient. Problem 4.4 is a variation of the previous problem but is for use in a
Calculus class. Students create a scatterplot and use the graphing calculator to find a
curve to fit the data and then find the volume by using the Disk Method. When I used
this task in my Calculus class, students tried a variety of function types to fit the data,
and we compared the results as a class. The most accurate answer was produced

52
when the data was modeled to a degree 3 polynomial equation. Much to the students’
surprise, our answer was only off by approximately 1,667 ft3, a percent error of 3.2%.
Problem 4.3: Volume of General Sherman
General Sherman is a giant sequoia tree located in California’s Sequoia National Park. It is called the “largest living thing on earth.” General Sherman is not the tallest tree in the world or the thickest at the base. It received its title "biggest tree in the world" from its total trunk volume. (a) Using the dimensions provided by the national park, estimate the volume of the trunk of the tree (in cubic ft). Show calculations that lead to your answer.
Dimensions
Height above base 274.9 ft 83.8 m
Circumference at ground 102.6 ft 31.3 m
Maximum diameter at base 36.5 ft 11.1 m
Diameter 4.5 ft (1.4 m) above height point on ground 25.1 ft 7.7 m
Diameter 60 ft (18 m) above base 17.5 ft 5.3 m
Diameter 180 ft (55 m) above base 14.0 ft 4.3 m
Diameter of largest branch 6.8 ft 2.1 m
Height of first large branch above the base 130.0 ft 39.6 m
Average crown spread 106.5 ft 32.5 m
Estimated mass (wet) 2,105 short tons 1,910 t
Estimated bole mass 2,472,000 lb 1,121 t
(b) The actual volume of the trunk (as provided by the national park) is 52,500 cubic ft. Find the percent error of your calculation from (a). (c) What factors may have resulted in errors in your calculation from (a)? Standards addressed: G-GMD-3 G-MG-1 N-Q-1 N-Q-2

53
Problem 4.4: Volume of General Sherman
General Sherman is a giant sequoia tree located in California’s Sequoia National Park. It is called the “largest living thing on earth.” General Sherman is not the tallest tree in the world or the thickest at the base. It received its title "biggest tree in the world" from its total trunk volume.
Dimensions
Height above base 274.9 ft 83.8 m
Circumference at ground 102.6 ft 31.3 m
Maximum diameter at base 36.5 ft 11.1 m
Diameter 4.5 ft (1.4 m) above height point on ground 25.1 ft 7.7 m
Diameter 60 ft (18 m) above base 17.5 ft 5.3 m
Diameter 180 ft (55 m) above base 14.0 ft 4.3 m
Diameter of largest branch 6.8 ft 2.1 m
Height of first large branch above the base 130.0 ft 39.6 m
Average crown spread 106.5 ft 32.5 m
Estimated mass (wet) 2,105 short tons 1,910 t
Estimated bole mass 2,472,000 lb 1,121 t
(a) Using the information provided by the national park, create a table of the radius at each given height above the base. Create a scatterplot showing the radius of the tree as a function of the height above the base. Then, draw a smooth curve through the points.
height (ft)
radius (ft)

54
Problem 4.4 continued
(b) Using the regression feature of the graphing calculator, find an equation that fits the curve. (c) Set up an integral that represents the volume of the tree. (d) Use the integration feature of the graphing calculator to find the volume of the tree. (e) The actual volume of the trunk (as provided by the national park) is 52,500 cubic ft. Find the percent error of your calculation from (a). (f) What factors may have resulted in errors in your volume calculation? Standards addressed: G-GMD-3 G-MG-1 N-Q-1 N-Q-2
4.2 Exponential and linear growth
One section of the CCSSM on Functions deals with linear and exponential
models. The standards call for students to understand the difference between linear
and exponential rates of change and be able to distinguish between situations that can
be modeled by linear functions and those that can be modeled by exponential functions.
Students should be able to recognize linear and exponential behavior from a
description, a graph, or a table of values and be able to construct an equation for the
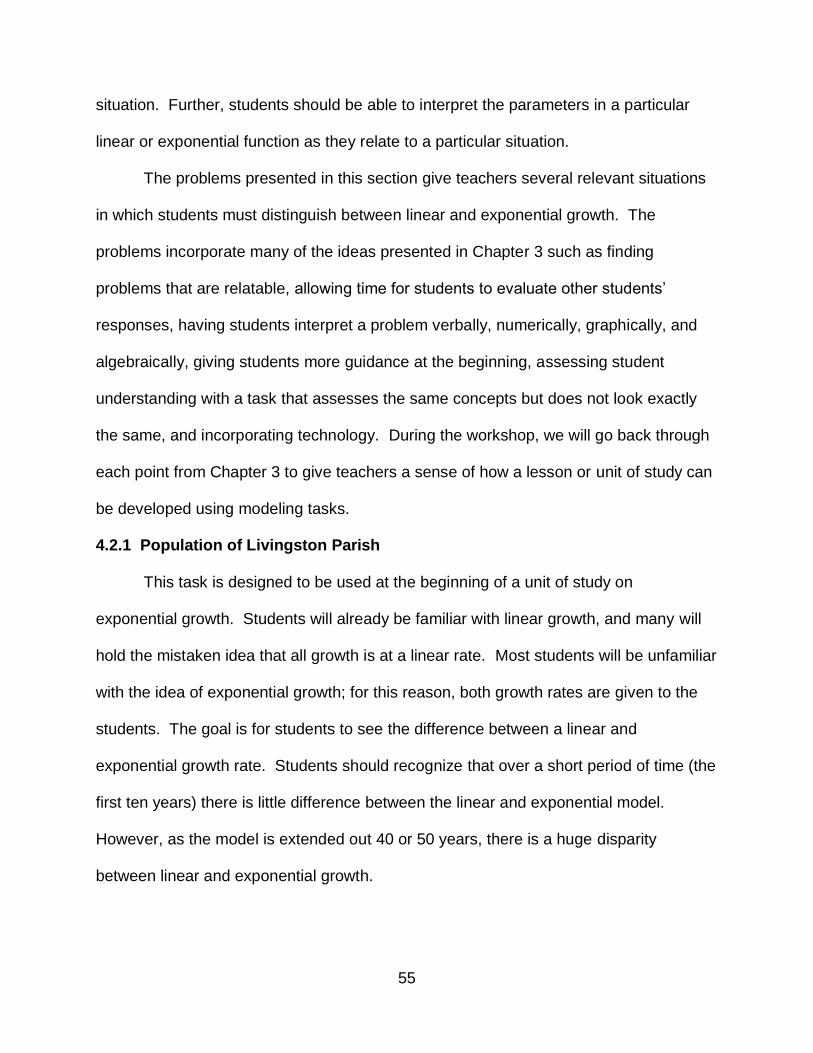
55
situation. Further, students should be able to interpret the parameters in a particular
linear or exponential function as they relate to a particular situation.
The problems presented in this section give teachers several relevant situations
in which students must distinguish between linear and exponential growth. The
problems incorporate many of the ideas presented in Chapter 3 such as finding
problems that are relatable, allowing time for students to evaluate other students’
responses, having students interpret a problem verbally, numerically, graphically, and
algebraically, giving students more guidance at the beginning, assessing student
understanding with a task that assesses the same concepts but does not look exactly
the same, and incorporating technology. During the workshop, we will go back through
each point from Chapter 3 to give teachers a sense of how a lesson or unit of study can
be developed using modeling tasks.
4.2.1 Population of Livingston Parish
This task is designed to be used at the beginning of a unit of study on
exponential growth. Students will already be familiar with linear growth, and many will
hold the mistaken idea that all growth is at a linear rate. Most students will be unfamiliar
with the idea of exponential growth; for this reason, both growth rates are given to the
students. The goal is for students to see the difference between a linear and
exponential growth rate. Students should recognize that over a short period of time (the
first ten years) there is little difference between the linear and exponential model.
However, as the model is extended out 40 or 50 years, there is a huge disparity
between linear and exponential growth.

56
When this task was completed in class, most students realized that when looking
at the first 10 years there was very little difference between the linear and exponential
models. They were surprised by the discrepancy between the two models when asked
to predict the 2010 population, which was 50 years past our “year 0.” They were also
surprised at how accurately the exponential model was able to predict the population 50
years later. During the class discussion, we talked about how large the error would be if
data that was growing exponentially was modeled with a linear function.
The final goal of the task is for students to understand and be able to explain the
parameters in an exponential function as they relate to the initial value and the growth
rate and to recognize how these parameters differ from the parameters of a linear
function. Students should already be familiar with the parameters of a linear function.
Part of the purpose of this task is for students to discover the meaning of the
parameters of an exponential function.
Problem 4.5: The Population of Livingston Parish
According to the Census Bureau, in 1960 the population of Livingston Parish was 26,974, and in 1970, the population was 36,511. If we assume an exponential rate of growth, the growth rate over the 10-year period is approximately 3.1 % per year. If we assume a linear rate of growth, the growth rate is 953.7 people per year. (a) Complete the given table using both the exponential and linear growth rates. Round to the one decimal place. (b) After completing the table, use the graphing calculator to create a scatterplot and find both linear and exponential equations to model the data. (Let 1960 be x = 0!) Exponential equation: Linear equation: (c) Examine the parameters (a and b) of each equation and explain how the parameters relate to this particular problem.

57
Problem 4.5 continued
Linear equation: Exponential equation: a – a - b - b - (d) Looking at the graph on the calculator, is one model significantly more accurate than the other? Explain. (e) Adjust the viewing window of the calculator to show through the year 2020. In your opinion, which model do you think will be more accurate over a long period of time: linear or exponential? Give a reason for your answer. (f) Using both the linear equation and the exponential equation, predict the population of Livingston Parish in the year 2010. Show work. (g) According to the Census Bureau, the population in 2010 was 128,026. Compare this to the answers found in part (f). Which model was more accurate? (h) Do you think the more accurate model could be used as an accurate predictor of future population? Explain.
(i) Think back to how the parameters a and b in the exponential equation y = xba related to this particular problem. (1) Write an exponential equation if the growth rate had been 5.1% instead of 3.1%. (2) Write an exponential equation if the initial population had been 40,000 instead of 26,974. Standards addressed: F-IF-4 F-IF-7 F-BF-1 F-LE-1 F-LE-2 F-LE-3 F-LE-4 S-ID-6 S-ID-7
Year Population
using
exponential
growth
Population
using linear
growth
1960 26,974 26,974
1961
1962
1963
1964
1965
1966
1967
1968
1969
1970

58
4.2.2 Cell phone saturation
This task is designed to be used during a unit of study on exponential growth. In
this task, students must determine from a table of values whether the data appears to
be linear or exponential. Students must explain the parameters of their equation within
the context of the problem. Then, students must confront the fact that the model, which
seems accurate initially, becomes significantly inaccurate by the year 2010. This leads
to the introduction of a new idea called the “S-curve.” Teachers can decide how in-
depth to delve into the idea of the S-curve. It is an excellent opportunity to discuss the
basic pattern of growth for a new technology where it increases exponentially before
reaching a saturation point and ultimately being replaced with a new technology.
Problem 4.6: Cell Phone Saturation
Cell phones have come a long way in a very short time period. The first hand-held mobile phone was made by a Motorola researcher named Dr. Martin Cooper in 1973. The phone weighed approximately 2.5 lbs and provided 30 minutes of talk time before requiring 10 hours to recharge. As you would expect, since that time the number of cell phones in the U.S. has increased very rapidly. While it took the telephone almost half a century to reach significant levels of usage, the cell phone only took a decade to be adopted. The table below shows the number of cell phone subscribers in the United States for select years. (Source: CTIA—The Wireless Association Web: www.ctia.org) (a) From examining the data in the table, does the rate of increase appear to be better approximated as linear or exponential? Explain. (b) Plot the data on the graphing calculator using 1985 as year 0. From examining the scatter plot, does it appear the data would be better modeled with a linear or exponential function? Explain.

59
Problem 4.6 continued
(c) Find the equation that best fits the data. For your equation, explain the meaning of the parameters a and b within the context of this problem. (d) According to the equation found in (c), approximately how many cell phone subscribers were there in the U.S. in 1990? (e) Is the answer from (d) a fairly accurate value based on the data? Explain. (f) According to the equation found in (c), approximately how many cell phone subscribers were there in the U.S. in 2010? (g) Could the equation found in (c) be used to predict the number of cell phone subscribers in the future? Explain. (h) New technologies tend to follow a pattern called an s-curve in which the numbers increase exponentially for a period of time before slowing as the market becomes saturated or a new technology emerges (as shown on the graph below). Does this graph seem to be a better fit for modeling the number of cell phone subscribers? Explain. (i) An s-shaped curve is modeled by a logistic function. Use the graphing calculatorto find the equation of the logistic function that fits the data. (j) According to the equation found in (i), approximately how many cell phone subscribers were there in the U.S. in 2010? (k) Could the equation found in (i) be used to predict the number of cell phone subscribers in the future? Explain. Standards addressed: F-IF-4 F-IF-7 F-BF-1 F-LE-1 F-LE-2 F-LE-3 F-LE-4 S-ID-6 S-ID-7
Year Number of cell phone subscribers in U.S. (in millions)
1985 0.34
1986 0.681
1987 1
1988 2
1989 3
1990 5
1991 7
1992 11
1993 16
1994 24
1995 33
1996 44
1997 55
1998 69
2004 180
2010 285

60
4.2.3 Life expectancy in the U.S.
This task is designed to be used at the end of a unit of study on exponential
growth. As stated in Chapter 3, students should not be graded on the correctness of
their tasks during the learning process. This task encompasses the skills that should
have been mastered during the unit of study and could be used as an assessment on a
test. Students are required to calculate both a linear and exponential growth rate, write
both a linear and an exponential equation, explain each parameter within the context of
the problem, and determine which model is more accurate, based on the given
information.
Problem 4.7: Life Expectancy in the United States
For a person born in the United States in 1930, the life expectancy was 59.7 years. In 2000, the life expectancy was 77.0. Source: National Center for Health Statistics Web: www.cdc.gov/nchs (a) Assume a linear rate of increase. Write a linear equation in the form y = ax + b that expresses the life expectancy of a person born in the United States as a function of the year of birth. Use 1930 as t = 0. (b) For the equation found in part (a), interpret the meanings of the parameters a and b in terms of this particular problem. (c) Assume an exponential rate of increase. Write an exponential equation in the form y = a bx that expresses the life expectancy of a person born in the United States as a function of the year of birth. Use 1930 as t = 0. (d) For the equation found in (c), interpret the meanings of the parameters a and b in terms of this particular problem. (e) For each equation, predict the life expectancy of a person born in 2010. Show the work that leads to your answer. (f) According to the data, in 2010 the life expectancy is 78.7. Which model was a more accurate predictor? Explain. (g) For each equation, predict the life expectancy of a person born in 2050. Show the work that leads to your answer.

61
Problem 4.7 continued
(h) Which model do you think yielded the more accurate prediction for the future life expectancy? Why? Standards addressed: F-IF-4 F-IF-7 F-BF-1 F-LE-1 F-LE-2 F-LE-3 F-LE-4 S-ID-6 S-ID-7
4.3 Optimization
The idea of finding the best possible value for a given situation is an important
concept and one with which students should be acquainted before reaching Calculus.
The CCSSM for Algebra calls for students to be able to create two variable equations to
represent relationships and choose and produce equivalent forms of an equation to find
properties such as finding zeros or maximum and minimum values of a quadratic. The
CCSSM for Functions calls for students to interpret key features of a function that
models the relationship between two quantities and relate the domain of the function to
the relationship that it describes.
The problems presented give teachers an idea of how the concept of
optimization can be introduced to students. Optimization then lends itself to a myriad of
modeling possibilities including geometry, physics, and economic applications.
4.3.1 Creating the optimum enclosure
Problems 4.8 and 4.9 show two variations on the idea of optimizing a rectangular
enclosure. Problem 4.8 was adapted from an Algebra II problem from the Springboard
workbook; however, it could be simplified to an Algebra I or Geometry task or expanded
to an Advanced Math task. It guides students through the various representations of
the data and shows that in some cases a numeric or graphical approach has
shortcomings making an algebraic approach necessary. It is designed to be an

62
introduction to the idea of the maximum or minimum value of a quadratic equation as
well as a reinforcement of the skill of solving a quadratic equation.
Problem 4.9 is designed for a Calculus class and shows that finding the solution
to a particular optimization problem should be the beginning of the solution, not the end.
Students quickly realize that the solution turns out to be a square. The next question
they usually ask is “Will the answer always be a square?” At this point, students should
be required to prove whether the solution being a square was a coincidence or a rule.
Problem 4.8: Creating the Optimum Enclosure
A company that specializes in building fenced enclosures has a client who purchased 100 ft of fencing to enclose the largest possible rectangular area. (a) If the width of the rectangle is 20 ft, what must be the length? Find the area of this rectangular enclosure. (b) Choose several values for the width of the rectangle with a perimeter of 100 ft. Determine the corresponding length and area of each rectangle. (minimum of 5) (c) Describe the relationship between the length and width of a rectangle with perimeter of 100 ft? (d) Based on your observations, predict if it is possible for a rectangle with a perimeter of 100 ft to have each area. Explain your reasoning. (1) 400 ft2 (2) 500 ft2 (3) 700 ft2
(e) What appears to be the maximum area that can be enclosed? (f) Write an equation expressing length (l) in terms of width (w). (g) Write an equation expressing the area of the rectangle (A) as a function of its width (w).
Width Length Area

63
Problem 4.8 continued
(h) Considering the restrictions on the width of the rectangle, what is a reasonable domain for the area function?
(i) Using the table from part (b), graph the width versus the area on the grid below.
(j) Use the graph to revise or confirm your predictions from part (d). If the rectangle is possible, state the dimensions (width and length). (1) 400 ft2
(2) 500 ft2
(3) 700 ft2
(k) From the graph, estimate the maximum area that can be enclosed with 100 ft of fencing. What are the dimensions of this rectangle? (l) You may not have been able to find the exact width of each rectangle from the graph. Now, use the equation from part (g) to algebraically determine the width of a rectangle for each area or to prove that the area is not possible. (1) 400 ft2 (2) 500 ft2 (3) 700 ft2
(m) Using the vertex formula, find the maximum area that can be enclosed algebraically. Standards addressed: A-SSE-3 A-CED-1 A-CED-2 A-CED-3 F-IF-4 F-IF-5 F-IF-7(a)
Problem 4.9: Creating the Optimum Enclosure
(a) A company that specializes in building fenced enclosures has a client who purchased 100 ft of fencing to enclose the largest possible rectangular area. What dimensions will maximize the area? (b) The same company is assisting a client who needs to enclose 6000 ft
2 within a
rectangular enclosure. What dimensions will minimize the amount of fencing required for the enclosure? Based on the results from the previous problems, it appears that the most efficient or optimum rectangle is a square. In both cases, a square enclosed the most area possible using the least perimeter. Is this a coincidence or a rule? Prove that for a rectangle of any perimeter (P) the dimensions that will maximize the area will always be a square.

64
Problem 4.9 continued
(c) Write the equation of the objective function. (d) Write the equation of the “constraint function.”. (e) Using the constraint function, write the objective function in terms of a single variable. Treat P as a constant. (f) Find the derivative. (g) Find the critical number. (h) Show that the critical number represents a relative maximum. (i) Show that the solution is a square. (j) Now, prove that for a rectangle of any area (A) that the dimensions that will minimize the perimeter will always be a square.

65
CHAPTER 5: CONCLUDING THOUGHTS
At the outset, I wanted to complete a thesis that would fulfill the goals of the
LaMSTI MNS program by using what I have learned throughout my courses of study to
contribute to my profession beyond simply my classroom. After hearing about the
pending CCSS during the first summer of the program, I relayed the information to the
administrators at my school only to discover that there was little to no planning going on
at the school or parish level on how to prepare teachers for implementation of the new
standards. It was the recognition of this need that led me to the idea for my thesis.
In narrowing down the focus of the professional development, I examined the
standards and was interested in the emphasis placed on mathematical modeling in both
the content standards and the standards for mathematical practice. Not only was
modeling one of the eight Standards for Mathematical Practice and one of the six
content standards, but it was also included in every content strand of the other five
standards. I did not feel completely confident that I understood mathematical modeling
or that I used it in my classroom and knew that this was an area in which many teachers
could use assistance. Even beyond preparing for the new standards, mathematical
modeling is a valuable tool in teaching students to think mathematically and to use
mathematical concepts for more than completing rote tasks.
The primary goal of the thesis was to develop tasks that align with the CCSSM
on modeling, incorporate the 8 SMP, and are immediately useful to teachers. The other
goal was to create a professional development opportunity that models how to use the
tasks effectively in the classroom, taking concepts or problems and developing
modeling tasks so that teachers feel prepared when the CCSSM are implemented. If

66
teachers leave the workshop feeling positive and confident about mathematical
modeling, then the likelihood that they use the tasks routinely increases greatly.
Through my time spent researching mathematical modeling and developing
tasks, I have learned a great deal about the ways in which mathematics is currently
being taught and the ways in which mathematical modeling benefits student learning. I
have spent time researching and reflecting on what our goals as mathematics teachers
are and what they should be. Our goal should be to produce students who are able to
think mathematically and use content knowledge to solve problems. The current
method of instruction is not accomplishing this goal.
I am convinced that if teachers implement mathematical modeling in their
classroom and design lessons that utilize both the content standards and the
mathematical practices then students will learn and retain much more knowledge and
become better problem solvers. I have already used much of what I have learned in my
classroom and will continue to work to increase both the quality and the quantity of the
tasks in my collection. I see the tasks I have developed as a beginning point rather than
the end because the tasks can always be refined, improved, or expanded.
I am scheduled to present my professional development to the high school
mathematics teachers in the parish in which I teach and anticipate having other
opportunities to present my work. I hope that I am able to provide teachers with tools
that will make them more effective educators and in that way to have a positive impact
on the mathematical instruction provided in my school, parish, and state.

67
REFERENCES Anderson, K., Harrison, T., & Lewis, K. (2012). Plans to adopt and implement Common
Core State Standards in the Southeast Region states. Issues & Answers, 136. Biembengut, M. S., & Hein, N. (2010). Mathematical Modeling: Implications for
Teaching. In R. Lesh, P. L. Galbraith, C. R. Haines & A. Hurford (Eds.), Modeling Students' Mathematical Modeling Competencies (pp. 481-490): Springer US.
Boaler, J. (1998). Open and Closed Mathematics: Student Experiences and
Understandings. Journal for Research in Mathematics Education, 29(1), 41-62. Breen, S. & O'Shea, A. (2010). Mathematical Thinking and Task Design. Irish
Mathematical Society Bulletin, 66(2010), 39 - 49. Cavanagh, S. (2009). New Tack on Math Promoted: Problem: Solving Is Focus of High
School Guide. Education Week, 29(6), 1,14-15. Common Core State Standards for Mathematics. Retrieved from:
http://www.corestandards.org. Desimone, L. M., Porter, A. C., Garet, M. S., Yoon, K. S., & Birman, B. F. (2002).
Effects of Professional Development on Teachers' Instruction: Results from a Three-Year Longitudinal Study. Educational Evaluation and Policy Analysis, 24(2), 81-112.
Dudley, U. (2010). What is Mathematics For? Notices of the AMS, 57(5), 608 - 613. Elliott, R., Kazemi, E., Lesseig, K., Mumme, J., Carroll, C., & Kelley-Petersen, M.
(2009). Conceptualizing the Work of Leading Mathematical Tasks in Professional Development. Journal of Teacher Education, 60(4), 364-379. doi: 10.1177/0022487109341150
Gainsburg, J. (2008). real-world connections secondary mathematics teaching. Journal
of Mathematics Teacher Education, 11(3), 199. Galbraith, P. L., Stillman, G., & Brown, J. (2010). Turning Ideas into Modeling Problems.
In R. Lesh, P. L. Galbraith, C. R. Haines & A. Hurford (Eds.), Modeling Students' Mathematical Modeling Competencies (pp. 133-144): Springer US.
Garet, M. S., Porter, A. C., Desimone, L., Birman, B. F., & Yoon, K. S. (2001). What
Makes Professional Development Effective? Results From a National Sample of Teachers. American Educational Research Journal, 38(4), 915-945. doi: 10.3102/00028312038004915

68
Henningsen, M., & Stein, M. K. (1997). Mathematical Tasks and Student Cognition: Classroom-Based Factors That Support and Inhibit High-Level Mathematical Thinking and Reasoning. Journal for Research in Mathematics Education, 28(5), 524-549.
Herbst, P. G. (2003). Using Novel Tasks in Teaching Mathematics: Three Tensions
Affecting the Work of the Teacher. American Educational Research Journal, 40(1), 197-238.
Hiebert, J., & et al. (1997). Making Sense: Teaching and Learning Mathematics with
Understanding: Heinemann, 361 Hanover Street, Portsmouth, NH 03801-3912. Hiebert, J., & Stigler, J. W. (2000). A Proposal for Improving Classroom Teaching:
Lessons from the TIMSS Video Study. The Elementary School Journal, 101(1), 3-20.
Hull, T. (2012). The Common Core Mathematics Standards: Transforming Practice
Through Team Leadership. USA: Library of Congress Cataloging-in-Publication Data.
Inoue, N. (2011). Zen and the art of <i>neriage</i>: Facilitating consensus
building in mathematics inquiry lessons through lesson study. Journal of Mathematics Teacher Education, 14(1), 5-23. doi: 10.1007/s10857-010-9150-z
Kober, N., Rentner, D., & Center on Education, P. (2012). Year Two of Implementing
the Common Core State Standards: States' Progress and Challenges. Center On Education Policy.
Leikin, R. (2003). Problem-Solving Preferences of Mathematics Teachers: Focusing on
Symmetry. Journal of Mathematics Teacher Education, 6(4), 297-329. doi: 10.1023/a:1026355525004
Lingefjärd, T. (2002). Mathematical Modeling for Preservice Teachers: A Problem from
Anesthesiology. International Journal of Computers for Mathematical Learning, 7(2), 117-143. doi: 10.1023/a:1021122431218
Lingefjärd, T. (2006). Faces of Mathematical Modeling, 38(2), 96-112. Loewenberg Ball, D., Thames, M. H., & Phelps, G. (2008). Content Knowledge for
Teaching. Journal of Teacher Education, 59(5), 389-407. doi: 10.1177/0022487108324554
Mathematics Assessment Project. Retrieved from:
http://map.mathshell.org/materials/tasks.php.

69
Mooney, D., & Swift, R. (1999). A Course in Mathematical Modeling: The Mathematical Association of America.
Penuel, W. R., Fishman, B. J., Yamaguchi, R., & Gallagher, L. P. (2007). What Makes
Professional Development Effective? Strategies That Foster Curriculum Implementation. American Educational Research Journal, 44(4), 921-958.
Ponte, J. P. d., Zaslavsky, O., Silver, E., Borba, M. d. C., Heuvel-Panhuizen, M. v. d.,
Gal, H., . . . Chapman, O. (2009). Tools and Settings Supporting Mathematics Teachers’ Learning in and from Practice. In R. Even & D. L. Ball (Eds.), The Professional Education and Development of Teachers of Mathematics (Vol. 11, pp. 185-209): Springer US.
Prediger, S. (2010). How to develop mathematics-for-teaching and for understanding:
the case of meanings of the equal sign. Journal of Mathematics Teacher Education, 13(1), 73-93. doi: 10.1007/s10857-009-9119-y
Silver, E. A., Mesa, V. M., Morris, K. A., Jon, R. S., & Benken, B. M. (2009). Teaching
Mathematics for Understanding: An Analysis of Lessons Submitted by Teachers Seeking NBPTS Certification. American Educational Research Journal, 46(2), 501-531.
Szatajn, P., Campbell, M. P., & Yoon, K. S. (2011). Conceptualizing professional
development in mathematics: elements of a model. PNA, 5(3), 83-92. Tall, D. (2008). The Transition to Formal Thinking in Mathematics. Mathematics
Education Research Journal, 20(2), 5-24. Wu, H. (2011). Phoenix Rising: Bringing the Common Core State Mathematics
Standards to Life. American Educator, 35(3), 3-13. Zaslavsky, O. (2005). Seizing the Opportunity to Create Uncertainty in Learning
Mathematics. Educational Studies in Mathematics, 60(3), 297-321. Zaslavsky, O., & Leikin, R. (2004). Professional Development of Mathematics Teacher
Educators: Growth Through Practice. Journal of Mathematics Teacher Education, 7(1), 5-32. doi: 10.1023/B:JMTE.0000009971.13834.e1
Zbiek, R. M., & Conner, A. (2006). Beyond Motivation: Exploring Mathematical Modeling
as a Context for Deepening Students' Understandings of Curricular Mathematics. Educational Studies in Mathematics, 63(1), 89-112.

70
APPENDIX A: LIST OF COMMON CORE STATE STANDARDS FOR MATHEMATICAL PRACTICE AND MODELING STANDARDS
1. Make sense of problems and persevere in solving them.
Mathematically proficient students start by explaining to themselves the meaning of a problem and looking for entry points to its solution. They analyze givens, constraints, relationships, and goals. They make conjectures about the form and meaning of the solution and plan a solution pathway rather than simply jumping into a solution attempt. They consider analogous problems, and try special cases and simpler forms of the original problem in order to gain insight into its solution. They monitor and evaluate their progress and change course if necessary. Older students might, depending on the context of the problem, transform algebraic expressions or change the viewing window on their graphing calculator to get the information they need. Mathematically proficient students can explain correspondences between equations, verbal descriptions, tables, and graphs or draw diagrams of important features and relationships, graph data, and search for regularity or trends. Younger students might rely on using concrete objects or pictures to help conceptualize and solve a problem. Mathematically proficient students check their answers to problems using a different method, and they continually ask themselves, “Does this make sense?” They can understand the approaches of others to solving complex problems and identify correspondences between different approaches. 2. Reason abstractly and quantitatively.
Mathematically proficient students make sense of the quantities and their relationships in problem situations. Students bring two complementary abilities to bear on problems involving quantitative relationships: the ability to decontextualize—to abstract a given situation and represent it symbolically and manipulate the representing symbols as if they have a life of their own, without necessarily attending to their referents—and the ability to contextualize, to pause as needed during the manipulation process in order to probe into the referents for the symbols involved. Quantitative reasoning entails habits of creating a coherent representation of the problem at hand; considering the units involved; attending to the meaning of quantities, not just how to compute them; and knowing and flexibly using different properties of operations and objects. 3. Construct viable arguments and critique the reasoning of others.
Mathematically proficient students understand and use stated assumptions, definitions, and previously established results in constructing arguments. They make conjectures and build a logical progression of statements to explore the truth of their conjectures. They are able to analyze situations by breaking them into cases, and can recognize and use counterexamples. They justify their conclusions, communicate them to others, and respond to the arguments of others. They reason inductively about data, making plausible arguments that take into account the context from which the data arose. Mathematically proficient students are also able to compare the effectiveness of two plausible arguments, distinguish correct logic or reasoning from that which is flawed, and—if there is a flaw in an argument—explain what it is. Elementary students can construct arguments using concrete referents such as objects, drawings, diagrams, and actions. Such arguments can make sense and be correct, even though they are not

71
generalized or made formal until later grades. Later, students learn to determine domains to which an argument applies. Students at all grades can listen or read the arguments of others, decide whether they make sense, and ask useful questions to clarify or improve the arguments. 4. Model with mathematics.
Mathematically proficient students can apply the mathematics they know to solve problems arising in everyday life, society, and the workplace. In early grades, this might be as simple as writing an addition equation to describe a situation. In middle grades, a student might apply proportional reasoning to plan a school event or analyze a problem in the community. By high school, a student might use geometry to solve a design problem or use a function to describe how one quantity of interest depends on another. Mathematically proficient students who can apply what they know are comfortable making assumptions and approximations to simplify a complicated situation, realizing that these may need revision later. They are able to identify important quantities in a practical situation and map their relationships using such tools as diagrams, two-way tables, graphs, flowcharts and formulas. They can analyze those relationships mathematically to draw conclusions. They routinely interpret their mathematical results in the context of the situation and reflect on whether the results make sense, possibly improving the model if it has not served its purpose. 5. Use appropriate tools strategically.
Mathematically proficient students consider the available tools when solving a mathematical problem. These tools might include pencil and paper, concrete models, a ruler, a protractor, a calculator, a spreadsheet, a computer algebra system, a statistical package, or dynamic geometry software. Proficient students are sufficiently familiar with tools appropriate for their grade or course to make sound decisions about when each of these tools might be helpful, recognizing both the insight to be gained and their limitations. For example, mathematically proficient high school students analyze graphs of functions and solutions generated using a graphing calculator. They detect possible errors by strategically using estimation and other mathematical knowledge. When making mathematical models, they know that technology can enable them to visualize the results of varying assumptions, explore consequences, and compare predictions with data. Mathematically proficient students at various grade levels are able to identify relevant external mathematical resources, such as digital content located on a website, and use them to pose or solve problems. They are able to use technological tools to explore and deepen their understanding of concepts. 6. Attend to precision.
Mathematically proficient students try to communicate precisely to others. They try to use clear definitions in discussion with others and in their own reasoning. They state the meaning of the symbols they choose, including using the equal sign consistently and appropriately. They are careful about specifying units of measure, and labeling axes to clarify the correspondence with quantities in a problem. They calculate accurately and efficiently, express numerical answers with a degree of precision appropriate for the

72
problem context. In the elementary grades, students give carefully formulated explanations to each other. By the time they reach high school they have learned to examine claims and make explicit use of definitions. 7. Look for and make use of structure.
Mathematically proficient students look closely to discern a pattern or structure. Young students, for example, might notice that three and seven more is the same amount as seven and three more, or they may sort a collection of shapes according to how many sides the shapes have. Later, students will see 7 × 8 equals the well remembered 7 × 5 + 7 × 3, in preparation for learning about the distributive property. In the expression x2 + 9x + 14, older students can see the 14 as 2 × 7 and the 9 as 2 + 7. They recognize the significance of an existing line in a geometric figure and can use the strategy of drawing an auxiliary line for solving problems. They also can step back for an overview and shift perspective. They can see complicated things, such as some algebraic expressions, as single objects or as being composed of several objects. For example, they can see 5 – 3(x – y)2 as 5 minus a positive number times a square and use that to realize that its value cannot be more than 5 for any real numbers x and y.
8. Look for and express regularity in repeated reasoning.
Mathematically proficient students notice if calculations are repeated, and look both for general methods and for shortcuts. Upper elementary students might notice when dividing 25 by 11 that they are repeating the same calculations over and over again, and conclude they have a repeating decimal. By paying attention to the calculation of slope as they repeatedly check whether points are on the line through (1, 2) with slope 3, middle school students might abstract the equation (y – 2)/(x – 1) = 3. Noticing the regularity in the way terms cancel when expanding (x – 1)(x + 1), (x – 1)(x2 + x + 1), and (x – 1)(x3 + x2 + x + 1) might lead them to the general formula for the sum of a geometric series. As they work to solve a problem, mathematically proficient students maintain oversight of the process, while attending to the details. They continually evaluate the reasonableness of their intermediate results.
Modeling Standards
Number and Quantity
Quantities★ N-Q
Reason quantitatively and use units to solve problems. 1. Use units as a way to understand problems and to guide the solution of multi-step problems; choose and interpret units consistently in formulas; choose and interpret the scale and the origin in graphs and data displays.
2. Define appropriate quantities for the purpose of descriptive modeling.
3. Choose a level of accuracy appropriate to limitations on measurement when reporting quantities.

73
Algebra Seeing Structure in Expressions A-SSE
Interpret the structure of expressions
1. Interpret expressions that represent a quantity in terms of its context. ★
(a) Interpret parts of an expression, such as terms, factors, and coefficients.
(b) Interpret complicated expressions by viewing one or more of their parts as a single entity. For example, interpret P(1+r)n as the product of P and a factor not depending on P.
Write expressions in equivalent forms to solve problems
3. Choose and produce an equivalent form of an expression to reveal and explain
properties of the quantity represented by the expression. ★
(a) Factor a quadratic expression to reveal the zeros of the function it defines.
(b) Complete the square in a quadratic expression to reveal the maximum or minimum value of the function it defines.
(c) Use the properties of exponents to transform expressions for exponential functions. For example the expression 1.15t can be rewritten as (1.151/12)12t ≈ 1.01212t to reveal the approximate equivalent monthly interest rate if the annual rate is 15%.
4. Derive the formula for the sum of a finite geometric series (when the common ratio is not 1), and use the formula to solve problems. For example, calculate mortgage
payments. ★
Creating Equations★ A-CED
Create equations that describe numbers or relationships
1. Create equations and inequalities in one variable and use them to solve problems. Include equations arising from linear and quadratic functions, and simple rational and exponential functions. 2. Create equations in two or more variables to represent relationships between quantities; graph equations on coordinate axes with labels and scales. 3. Represent constraints by equations or inequalities, and by systems of equations and/or inequalities, and interpret solutions as viable or non-viable options in a modeling context. For example, represent inequalities describing nutritional and cost constraints on combinations of different foods. 4. Rearrange formulas to highlight a quantity of interest, using the same reasoning as in solving equations. For example, rearrange Ohm’s law V = IR to highlight resistance R.

74
Reasoning with Equations and Inequalities A-REI Represent and solve equations and inequalities graphically 11. Explain why the x-coordinates of the points where the graphs of the equations y = f(x) and y = g(x) intersect are the solutions of the equation f(x) = g(x); find the solutions approximately, e.g., using technology to graph the functions, make tables of values, or find successive approximations. Include cases where f(x) and/or g(x) are linear,
polynomial, rational, absolute value, exponential, and logarithmic functions. ★
Functions Interpreting Functions F-IF
Interpret functions that arise in applications in terms of the context
4. For a function that models a relationship between two quantities, interpret key features of graphs and tables in terms of the quantities, and sketch graphs showing key features given a verbal description of the relationship. Key features include: intercepts; intervals where the function is increasing, decreasing, positive, or negative; relative
maximums and minimums; symmetries; end behavior; and periodicity. ★
5. Relate the domain of a function to its graph and, where applicable, to the quantitative relationship it describes. For example, if the function h(n) gives the number of person-hours it takes to assemble n engines in a factory, then the positive integers would be an
appropriate domain for the function. ★
6. Calculate and interpret the average rate of change of a function (presented symbolically or as a table) over a specified interval. Estimate the rate of change from a
graph. ★
Analyze functions using different representations
7. Graph functions expressed symbolically and show key features of the graph, by hand
in simple cases and using technology for more complicated cases. ★
a. Graph linear and quadratic functions and show intercepts, maxima, and minima.
b. Graph square root, cube root, and piecewise-defined functions, including step functions and absolute value functions.
c. Graph polynomial functions, identifying zeros when suitable factorizations are available, and showing end behavior.
d. (+) Graph rational functions, identifying zeros and asymptotes when suitable factorizations are available, and showing end behavior.
e. Graph exponential and logarithmic functions, showing intercepts and end behavior, and trigonometric functions, showing period, midline, and amplitude.

75
Building Functions F-BF
Build a function that models a relationship between two quantities
1. Write a function that describes a relationship between two quantities. ★
a. Determine an explicit expression, a recursive process, or steps for calculation from a context.
b. Combine standard function types using arithmetic operations. For example, build a function that models the temperature of a cooling body by adding a constant function to a decaying exponential, and relate these functions to the model.
c. (+) Compose functions. For example, if T(y) is the temperature in the atmosphere as a function of height, and h(t) is the height of a weather balloon as a function of time, then T(h(t)) is the temperature at the location of the weather balloon as a function of time.
2. Write arithmetic and geometric sequences both recursively and with an explicit
formula, use them to model situations, and translate between the two forms. ★
Linear, Quadratic, and Exponential Models★ F-LE
Construct and compare linear, quadratic, and exponential models and solve problems 1. Distinguish between situations that can be modeled with linear functions and with exponential functions.
a. Prove that linear functions grow by equal differences over equal intervals, and that exponential functions grow by equal factors over equal intervals.
b. Recognize situations in which one quantity changes at a constant rate per unit interval relative to another.
c. Recognize situations in which a quantity grows or decays by a constant percent rate per unit interval relative to another.
2. Construct linear and exponential functions, including arithmetic and geometric sequences, given a graph, a description of a relationship, or two input-output pairs (include reading these from a table). 3. Observe using graphs and tables that a quantity increasing exponentially eventually exceeds a quantity increasing linearly, quadratically, or (more generally) as a polynomial function.
4. For exponential models, express as a logarithm the solution to a bct = d where a, c, and d are numbers and the base b is 2, 10, or e; evaluate the logarithm using technology.
Interpret expressions for functions in terms of the situation they model
5. Interpret the parameters in a linear or exponential function in terms of a context.

76
Trigonometric Functions F-TF
Model periodic phenomena with trigonometric functions
5. Choose trigonometric functions to model periodic phenomena with specified
amplitude, frequency, and midline. ★
7. Use inverse functions to solve trigonometric equations that arise in modeling contexts; evaluate the solutions using technology, and interpret them in terms of the
context. ★
Geometry Similarity, Right Triangles, and Trigonometry G-SRT
Define trigonometric ratios and solve problems involving right triangles
8. Use trigonometric ratios and the Pythagorean Theorem to solve right triangles in
applied problems. ★
Expressing Geometric Properties with Equations G-GPE Use coordinates to prove simple geometric theorems algebraically 7. Use coordinates to compute perimeters of polygons and areas of triangles and
rectangles, e.g., using the distance formula. ★
Geometric Measurement and Dimension G-GMD Explain volume formulas and use them to solve problems
3.Use volume formulas for cylinders, pyramids, cones, and spheres to solve problems. ★
Modeling with Geometry G-MG
Apply geometric concepts in modeling situations
1. Use geometric shapes, their measures, and their properties to describe objects (e.g.,
modeling a tree trunk or a human torso as a cylinder). ★
2. Apply concepts of density based on area and volume in modeling situations (e.g.,
persons per square mile, BTUs per cubic foot). ★
3. Apply geometric methods to solve design problems (e.g., designing an object or structure to satisfy physical constraints or minimize cost; working with typographic grid
systems based on ratios). ★

77
Statistics and Probability★
Interpreting Categorical and Quantitative Data S-ID
Summarize, represent, and interpret data on a single count or measurement variable
1. Represent data with plots on the real number line (dot plots, histograms, and box plots). 2. Use statistics appropriate to the shape of the data distribution to compare center (median, mean) and spread (interquartile range, standard deviation) of two or more different data sets. 3. Interpret differences in shape, center, and spread in the context of the data sets, accounting for possible effects of extreme data points (outliers). 4. Use the mean and standard deviation of a data set to fit it to a normal distribution and to estimate population percentages. Recognize that there are data sets for which such a procedure is not appropriate. Use calculators, spreadsheets, and tables to estimate areas under the normal curve.
Summarize, represent, and interpret data on two categorical and quantitative variables
5. Summarize categorical data for two categories in two-way frequency tables. Interpret relative frequencies in the context of the data (including joint, marginal, and conditional relative frequencies). Recognize possible associations and trends in the data. 6. Represent data on two quantitative variables on a scatter plot, and describe how the variables are related.
a. Fit a function to the data; use functions fitted to data to solve problems in the context of the data. Use given functions or choose a function suggested by the context. Emphasize linear, quadratic, and exponential models.
b. Informally assess the fit of a function by plotting and analyzing residuals.
c. Fit a linear function for a scatter plot that suggests a linear association.
Interpret linear models 7. Interpret the slope (rate of change) and the intercept (constant term) of a linear model in the context of the data. 8. Compute (using technology) and interpret the correlation coefficient of a linear fit. 9. Distinguish between correlation and causation.

78
Making Inferences and Justifying Conclusions S-IC Understand and evaluate random processes underlying statistical experiments 1. Understand statistics as a process for making inferences to be made about population parameters based on a random sample from that population. 2. Decide if a specified model is consistent with results from a given data-generating process, e.g., using simulation. For example, a model says a spinning coin falls heads up with probability 0.5. Would a result of 5 tails in a row cause you to question the model? Make inferences and justify conclusions from sample surveys, experiments, and observational studies 3. Recognize the purposes of and differences among sample surveys, experiments, and observational studies; explain how randomization relates to each. 4. Use data from a sample survey to estimate a population mean or proportion; develop a margin of error through the use of simulation models for random sampling. 5. Use data from a randomized experiment to compare two treatments; use simulations to decide if differences between parameters are significant. 6. Evaluate reports based on data. Conditional Probability and the Rules of Probability S-CP Understand independence and conditional probability and use them to interpret
data 1. Describe events as subsets of a sample space (the set of outcomes) using characteristics (or categories) of the outcomes, or as unions, intersections, or complements of other events (“or,” “and,” “not”). 2. Understand that two events A and B are independent if the probability of A and B occurring together is the product of their probabilities, and use this characterization to determine if they are independent. 3. Understand the conditional probability of A given B as P(A and B)/P(B), and interpret independence of A and B as saying that the conditional probability of A given B is the same as the probability of A, and the conditional probability of B given A is the same as the probability of B. 4. Construct and interpret two-way frequency tables of data when two categories are associated with each object being classified. Use the two-way table as a sample space to decide if events are independent and to approximate conditional probabilities. For example, collect data from a random sample of students in your school on their favorite subject among math, science, and English. Estimate the probability that a randomly selected student from your school will favor science given that the student is in tenth grade. Do the same for other subjects and compare the results.

79
5. Recognize and explain the concepts of conditional probability and independence in everyday language and everyday situations. For example, compare the chance of having lung cancer if you are a smoker with the chance of being a smoker if you have lung cancer. Use the rules of probability to compute probabilities of compound events in a uniform probability model 6. Find the conditional probability of A given B as the fraction of B’s outcomes that also belong to A, and interpret the answer in terms of the model. 7. Apply the Addition Rule, P(A or B) = P(A) + P(B) – P(A and B), and interpret the answer in terms of the model. 8. (+) Apply the general Multiplication Rule in a uniform probability model, P(A and B) = P(A)P(B|A) = P(B)P(A|B), and interpret the answer in terms of the model. 9. (+) Use permutations and combinations to compute probabilities of compound events and solve problems. Using Probability to Make Decisions S-MD
Calculate expected values and use them to solve problems
(1) (+) Define a random variable for a quantity of interest by assigning a numerical value to each event in a sample space; graph the corresponding probability distribution using the same graphical displays as for data distributions. (2) (+) Calculate the expected value of a random variable; interpret it as the mean of the probability distribution. (3) (+) Develop a probability distribution for a random variable defined for a sample space in which theoretical probabilities can be calculated; find the expected value. For example, find the theoretical probability distribution for the number of correct answers obtained by guessing on all five questions of a multiple-choice test where each question has four choices, and find the expected grade under various grading schemes. (4) (+) Develop a probability distribution for a random variable defined for a sample space in which probabilities are assigned empirically; find the expected value. For example, find a current data distribution on the number of TV sets per household in the United States, and calculate the expected number of sets per household. How many TV sets would you expect to find in 100 randomly selected households?
Use probability to evaluate outcomes of decisions
5. (+) Weigh the possible outcomes of a decision by assigning probabilities to payoff values and finding expected values.
a. Find the expected payoff for a game of chance. For example, find the expected winnings from a state lottery ticket or a game at a fast-food restaurant.

80
b. Evaluate and compare strategies on the basis of expected values. For example, compare a high-deductible versus a low-deductible automobile insurance policy using various, but reasonable, chances of having a minor or a major accident.
6. (+) Use probabilities to make fair decisions (e.g., drawing by lots, using a random number generator). 7. (+) Analyze decisions and strategies using probability concepts (e.g., product testing, medical testing, pulling a hockey goalie at the end of a game).

81
APPENDIX B: ADDITIONAL MODELING TASKS Problem B.1: Perimeter of a Land Mass
Did you know that many mathematicians think that it is impossible to find the precise
length of a coastline. The classic example of this is the length of Great Britain’s
coastline (shown below) as discussed in a paper by Benoit Mandlebrot in 1967.
Unit = 200 km Unit = 100 km Unit = 50 km
(a) Estimate the length of the coastline using the 200 km unit.
(b) Estimate the length of the coastline using the 100 km unit.
(c) What do you expect the results to be if the length is measured using the 50 km unit?
Explain.
(d) If we continue to decrease the size of our unit of measurement, what do you expect
to happen to the values of the length of the coastline?
(e) Will we ever reach a point where we have found the exact length of the coastline?
Explain.
Standards addressed: N-Q-3 G-MG-1

82
Problem B.2: Medication in the Bloodstream Prozac is a medication commonly prescribed for depression. A typical dosage is 40 mg. Over the course of one day (24 hours) approximately 25% of the Prozac in the bloodstream is eliminated. (a) Complete the following table showing the amount, A in mg, in the bloodstream t days after a single dose is taken.
t (days) 0 1 2 3 4 5
A (mg) 40
(b) Make a scatterplot displaying the data in the table. (c) Does A represent an arithmetic sequence, a geometric sequence, or neither? Explain. (d) Write a direct formula for A in terms of the number of days elapsed, t. (e) Find the amount of medication that will be in the bloodstream after 20 days. (f) In how many days will the medication be completely eliminated (less than 0.01 mg)? Now consider a person who takes a dose of 40 mg of Prozac once per day. (g) Write a recursive formula for A. Use the graphing calculator or a spreadsheet to answer each of the following questions. (h) What will the amount of medicine in the bloodstream be after 5 days? (i) What will the amount of medication in the bloodstream be after MANY days? (j) If after 75 days a person stops taking the medication, how many days will be required for the medication to be eliminated from the bloodstream (less than 0.01 mg)? Standards addressed: A-SSE-1 A-CED-2 F-IF-7 F-BF-1
F-BF-2 F-LE-4 S-ID-6

83
Problem B.3: Federal Taxes and Piecewise Functions
The federal tax rate schedule for a single person is 2011 is shown below.
(a) Calculate the amount of tax owed for a person who made $25,500.
(b) Calculate the amount of tax owed for a person who made $25,550.
(c) In the column titled “The tax is:”, where do the values that are added to each percentage originate?
(d) Write a piecewise function for the tax schedule.
On this same page, the IRS issues the following warning
Instead of using the tax rate schedules, tax payers are instructed to use a set of tax tables. A sample tax table is shown below. The first column is the amount of tax owed if filing single.

84
(e) According to the table, how much does a single person owe if he or she makes $25,500 to $25,550?
(f) How does this value compare to the values calculated above using the tax schedule?
(g) Where did the IRS obtain the values for the tables?
(h) Why are tax payers instructed to use the tables instead of the tax schedule?
Standards addressed: A-CED-2 A-CED-3 F-IF-5 F-BF-1

85
Problem B.4: Projectile Motion
A projectile is an object that has been either dropped or thrown upward or downward such that its only acceleration is the acceleration due to gravity. If the height is measured in meters and the time is measured in seconds, the height of the projectile at any time t can be found by using the equation h(t) = -4.9t2 + v0t + h0 where vo represents the initial velocity of the projectile and ho represents the initial height of the projectile. Suppose a golf ball has been thrown upward from the top of a cliff that is 19.6 m above the ground with an initial velocity of 14.7 m/s. (a) Write an equation that represent the height of the golf ball (in m) as a function of time (in s). (b) How many seconds did it take for the ball to hit the ground? (c) At what time was the ball at its maximum height? (d) What was the maximum height of the ball? (e) What is the domain of h(t)? (f) Sketch a graph of h(t). (g) On the graph of h(t),draw a line whose slope represents the average velocity of the ball from t = 0 to t = 2. (h) Find the average velocity of the ball from t = 0 to t = 2. Standards addressed: A-SSE-1 A-SSE-3 A-CED-2 A-CED-3 F-IF-4 F-IF-5 F-IF-6 F-IF-7

86
VITA
Selena Roberson Oswalt was born in Gulfport, Mississippi. She received a
Bachelor’s of Science in Chemical Engineering in 1996 from Mississippi State University
and began teaching high school in 1997. While teaching, she obtained her teaching
certification through the alternate certification program at Louisiana State University. In
2009, she received her National Board Certification and started the Masters of Natural
Sciences program in the summer of 2010.