
Mathematical modeling and optimization of semi ...
12
Mathematical modeling and optimization of semi-regenerative catalytic reforming of naphtha Emilia Ivanchina 1 , Ekaterina Chernyakova 1,* , Inna Pchelintseva 2 , and Dmitry Poluboyartsev 3 1 Division for Chemical Engineering, National Research Tomsk Polytechnic University, 30, Lenin Avenue, 634050 Tomsk, Russia 2 Well Testing Center “GasInformPlast”, 8, Razvitiya Avenue, 634055 Tomsk, Russia 3 Joint Stock Company “Tomsk Oil and Gas Research and Design Institute”, 72, Mira Avenue, 634027 Tomsk, Russia Received: 15 April 2021 / Accepted: 20 July 2021 Abstract. Catalytic naphtha reforming is extensively applied in petroleum refineries and petrochemical indus- tries to convert low-octane naphtha into high-octane gasoline. Besides, this process is an important source of hydrogen and aromatics obtained as side products. The bifunctional Pt-catalysts for reforming are deactivated by coke formation during an industrial operation. This results to a reduction in the yield and octane number. In this paper modeling and optimization of a semi-regenerative catalytic reforming of naphtha is carried out considering catalyst deactivation and a complex multicomponent composition of a hydrocarbon mixture. The mathematical model of semi-regenerative catalytic reforming considering coke formation process was proposed. The operating parameters (yield, octane number, activity) for different catalysts were predicted and optimized. It was found that a decrease in the pressure range from 1.5 to 1.2 MPa at the temperature 478–481 °C and feedstock space velocity equal to 1.4–1 h induces an increase in the yield for 1–2 wt.% due to an increase in the aromatization reactions rate and a decrease in the hydrocracking reactions rate depending on the feedstock composition and catalyst type. It is shown that the decrease in pressure is limited by the requirements for the catalyst stability due to the increase in the coke formation rate. The criterion of optimality is the yield, expressed in octanes per tons. 1 Introduction Catalytic reforming of naphtha is one of the most signifi- cant petrochemical processes in the world based on obtain- ing a high-octane component for motor fuel. Hydrogen is obtained as a valuable side product that is demanded in most refineries for hydrogen-consuming processes such as hydrotreating, hydrocracking, etc. Besides, the produced reformate contains aromatics namely Benzene, Toluene, Xylene (BTX) that are very valuable and important petro- chemical material [1–4]. There are several types of reactions, which occur during catalytic reforming process. They include the reactions of dehydrogenation, isomerization, cyclization, aromatization, hydrocracking, hydrogenolysis, and coke formation. Some of these reactions increase octane number (isomerization, cyclization, aromatization), while the others can cause cat- alyst deactivation process (coke formation). The catalytic reforming reactions take place in the reactors on the layer of a catalyst consisting of Al 2 O 3 support of c-modification and metals (Pt, Re, Ir, Ge, Sn, Cd) and additionally promoted by chlorine. Generally, the industrial reforming process is carried out in three or four adiabatically operated reactors at temperatures from 470 to 510 °C and total pres- sures between 5 and 20 atm. A preliminary hydrodesulfur- ized naphtha cut is used as feedstock. There are three main groups of catalyst regeneration procedures according to which industrial naphtha reform- ing units are classified into Semi-Regenerative catalytic Reformers (SRR), Continuous catalyst Regeneration Reformers (CCR) and cyclic catalytic reformers. SRR is the most commonly used scheme – about 60% of the total capacity. In this unit, the research octane number can be achieved in the range of 85–100. This process is character- ized by its continuous operation over a long period; the shutdown of SRR unit occurs once each 6–24 months due to the decreased catalyst activity. Catalytic naphtha reforming has already been vastly improved by many researchers who investigated different aspects of this industrial process, namely development of more effective catalysts, design of an efficient reactor config- uration and a mode of operation or the appropriate kinetic and deactivation models [5–11]. Still, in spite of a plethora of existing papers, there is a need for more research in * Corresponding author: [email protected] This is an Open Access article distributed under the terms of the Creative Commons Attribution License (https://creativecommons.org/licenses/by/4.0), which permits unrestricted use, distribution, and reproduction in any medium, provided the original work is properly cited. Oil & Gas Science and Technology – Rev. IFP Energies nouvelles 76, 64 (2021) Available online at: Ó E. Ivanchina et al., published by IFP Energies nouvelles, 2021 ogst.ifpenergiesnouvelles.fr https://doi.org/10.2516/ogst/2021041 REGULAR ARTICLE
Transcript of Mathematical modeling and optimization of semi ...

Mathematical modeling and optimization of semi-regenerativecatalytic reforming of naphthaEmilia Ivanchina1, Ekaterina Chernyakova1,* , Inna Pchelintseva2 , and Dmitry Poluboyartsev3
1Division for Chemical Engineering, National Research Tomsk Polytechnic University, 30, Lenin Avenue, 634050 Tomsk, Russia2Well Testing Center “GasInformPlast”, 8, Razvitiya Avenue, 634055 Tomsk, Russia3 Joint Stock Company “Tomsk Oil and Gas Research and Design Institute”, 72, Mira Avenue, 634027 Tomsk, Russia
Received: 15 April 2021 / Accepted: 20 July 2021
Abstract. Catalytic naphtha reforming is extensively applied in petroleum refineries and petrochemical indus-tries to convert low-octane naphtha into high-octane gasoline. Besides, this process is an important source ofhydrogen and aromatics obtained as side products. The bifunctional Pt-catalysts for reforming are deactivatedby coke formation during an industrial operation. This results to a reduction in the yield and octane number. Inthis paper modeling and optimization of a semi-regenerative catalytic reforming of naphtha is carried outconsidering catalyst deactivation and a complex multicomponent composition of a hydrocarbon mixture.The mathematical model of semi-regenerative catalytic reforming considering coke formation process wasproposed. The operating parameters (yield, octane number, activity) for different catalysts were predictedand optimized. It was found that a decrease in the pressure range from 1.5 to 1.2 MPa at the temperature478–481 �C and feedstock space velocity equal to 1.4–1 h induces an increase in the yield for 1–2 wt.% dueto an increase in the aromatization reactions rate and a decrease in the hydrocracking reactions rate dependingon the feedstock composition and catalyst type. It is shown that the decrease in pressure is limited by therequirements for the catalyst stability due to the increase in the coke formation rate. The criterion of optimalityis the yield, expressed in octanes per tons.
1 Introduction
Catalytic reforming of naphtha is one of the most signifi-cant petrochemical processes in the world based on obtain-ing a high-octane component for motor fuel. Hydrogen isobtained as a valuable side product that is demanded inmost refineries for hydrogen-consuming processes such ashydrotreating, hydrocracking, etc. Besides, the producedreformate contains aromatics namely Benzene, Toluene,Xylene (BTX) that are very valuable and important petro-chemical material [1–4].
There are several types of reactions, which occur duringcatalytic reforming process. They include the reactions ofdehydrogenation, isomerization, cyclization, aromatization,hydrocracking, hydrogenolysis, and coke formation. Someof these reactions increase octane number (isomerization,cyclization, aromatization), while the others can cause cat-alyst deactivation process (coke formation). The catalyticreforming reactions take place in the reactors on the layerof a catalyst consisting of Al2O3 support of c-modificationand metals (Pt, Re, Ir, Ge, Sn, Cd) and additionally
promoted by chlorine. Generally, the industrial reformingprocess is carried out in three or four adiabatically operatedreactors at temperatures from 470 to 510 �C and total pres-sures between 5 and 20 atm. A preliminary hydrodesulfur-ized naphtha cut is used as feedstock.
There are three main groups of catalyst regenerationprocedures according to which industrial naphtha reform-ing units are classified into Semi-Regenerative catalyticReformers (SRR), Continuous catalyst RegenerationReformers (CCR) and cyclic catalytic reformers. SRR isthe most commonly used scheme – about 60% of the totalcapacity. In this unit, the research octane number can beachieved in the range of 85–100. This process is character-ized by its continuous operation over a long period; theshutdown of SRR unit occurs once each 6–24 months dueto the decreased catalyst activity.
Catalytic naphtha reforming has already been vastlyimproved by many researchers who investigated differentaspects of this industrial process, namely development ofmore effective catalysts, design of an efficient reactor config-uration and a mode of operation or the appropriate kineticand deactivation models [5–11]. Still, in spite of a plethoraof existing papers, there is a need for more research in* Corresponding author: [email protected]
This is an Open Access article distributed under the terms of the Creative Commons Attribution License (https://creativecommons.org/licenses/by/4.0),which permits unrestricted use, distribution, and reproduction in any medium, provided the original work is properly cited.
Oil & Gas Science and Technology – Rev. IFP Energies nouvelles 76, 64 (2021) Available online at:�E. Ivanchina et al., published by IFP Energies nouvelles, 2021 ogst.ifpenergiesnouvelles.fr
https://doi.org/10.2516/ogst/2021041
REGULAR ARTICLEREGULAR ARTICLE

revealing and elucidating kinetic and deactivation mecha-nisms as well as suggesting more efficient reactor setupsand modes of operation.
Methods of catalytic reforming process research aredivided into instrumental and kinetic. The first group ofmethods includes the study of physico-chemical catalystcharacteristics, namely composition, structure and texture(porosity, specific surface, etc.). The second group explainsa formalized mechanism of process reactions on the catalystsurface and allows obtaining the initial data for optimalmanagement by determining the kinetic parameters of thereactions. There is one more method for study of complexhydrocarbon processes and it is successfully applied forcatalytic naphtha reforming – mathematical modeling. Amathematical model of a process is based on its kineticmodel and process parameters.
All reforming catalysts undergo deactivation process. Alot of scientific works are devoted to study this process[12, 13]. For heterogeneous catalysts of reforming, isomeriza-tion and dehydrogenation processes, deactivation is theresult of deposition of coxogenic compounds on their surface.In these processes, deactivation is accompanied by self-regeneration of coke under the influence of the componentsof the mixture (hydrogen, water, etc.). The level of station-ary (optimal) activity is established when the rates of deac-tivation and self-regeneration are equal to each other [14].
Our previous studies of catalyst deactivation weredevoted to its reversible type. By maintaining the equilib-rium reaction of coke formation and hydrogenation ofthe intermediate products of compaction, the level of opti-mal activity of a catalyst is achieved, at which its self-regeneration occurs [8]. The operation under the conditionsof the equal rates of coke formation and hydrogenationreactions, which are controlled by temperature under indus-trial conditions, consumption of feedstock and recyclehydrogen-containing gas, can significantly extend theinter-regeneration period of the reforming catalysts [15].Based on the thermodynamic equilibrium conditions ofthe oxidation reaction of the coke compounds formed onthe surface of platinum-containing dehydrogenation cata-lysts, the optimal modes of water supply to an industrialreactor were determined, which ensured an increase in thecatalyst service life by 20% [16].
To develop this direction, the studies in the narrowpressure range (12–14 atm) should be considered. The maintask in this case is the theoretical justification for the exis-tence of the optimal conditions for the catalyst and thedevelopment of the recommendations for maintaining opti-mal pressure with the feedstock composition change in agiven interval and technological conditions.
Modeling of catalytic naphtha reforming process is avery complex task because of a number of the features suchas catalyst bimetallic nature, feedstock composition com-plexity, a large number of reactions with different ratesand deactivation processes occurring during the catalystoperation. Therefore, a model should consider both the cat-alyst bimetallic nature and the complexity of the feedstockcomposition as in a real technological process [17–19].
The main task for mathematical modeling of the chem-ical processes is a sequential definition of thermodynamic
and kinetic parameters of chemical transformations (chem-ical phenomena), the parameters of transport phenomena(physical phenomena), and the laws of their interaction.For this purpose, the experimental research data are used.The results of the process analysis and the study of its com-ponents make it possible to construct a mathematical modelas an algebraic or differential system of equations. Themodel study is aimed at studying its properties, while com-putational methods are used. The obtained model proper-ties should be further interpreted as the study object,which in this case is a chemical reactor.
2 Materials and methods
The methods of mathematical modeling have been inten-sively developed since the beginning of the 1960s [12–27].The main idea of these methods is to study object propertieswith a mathematical model. A model and an object of inves-tigation have different physical nature but the same proper-ties. The mathematical model of a technological process isdesigned by a system of algebraic or differential system ofequations adequately describing properties of an object.
Catalytic reforming of naphtha is a quite difficult tech-nological process to study and to model because of:
� Complexity of naphtha and reformate hydrocarboncompositions containing more than 300 components.
� Many simultaneous reactions and differences in rates.� Bifunctional mechanism of catalysts.� Catalyst deactivation processes (poisoning, aging, ero-sion, breakage, coke deposition), contributing to adecrease in the catalyst activity and selectivity.
Construction of the mathematical model of catalyticnaphtha reforming is based on the analysis of the processreactions mechanism. Each component of the hydrocarbonmixture of naphtha undergoes the reactions of dehydro-genation, isomerization, dehydrocyclization, hydrocracking,hydrogenolisis and hydrodealkilation. It would be too com-plicated to consider all the components and reactions in akinetic model. Thus, all components of the mixture wereclassified in the homological groups called pseudo compo-nents and the formalized mechanism of the reactions wascreated taking into account the components reactivity(Fig. 1).
It is shown in Figure 1, that mechanism of coke can berepresented as a scheme of reactions: hydrocarbons ?resins ? asphaltenes ? coke, where resins and asphaltenesare Unsaturated Immediate Compacting Products (UICP)[28].
For the mathematical description of the hydrodynamicand heat model of catalytic reforming reactor, someassumptions are made:
� The formalized mechanism of hydrocarbons transfor-mation (Fig. 1).
� The plug flow reactor model.� The adiabatic operation.
E. Ivanchina et al.: Oil & Gas Science and Technology – Rev. IFP Energies nouvelles 76, 64 (2021)2

The rate law for the elementary steps is proportional tothe concentration of the reacting substances in degreesshowing a number of the interacting particles:
rj ¼ kj � Ci; ð1Þwhere rj is a reaction rate; kj is a rate constant; Ci is aninitial component’s concentration.
A kinetic model of catalytic reforming process can bewritten as an equation for the reactions of hydrogenolysisof naphthenes and hydrocracking of paraffins:
dCi xð Þdt
¼Xnj¼1
kj xð Þ � Ci xð Þ � CH2 ; ð2Þ
where j = 1, . . . , n is a number of chemical reaction; Ci(x)and kj(x) are respectively distributions of hydrocarbonsconcentration and rate constants on a number of carbonatoms in a molecule x; t is a space time, h.
According to Figure 1, the kinetic model of the catalyticreforming process is designed with the system of equations:
r1 ¼ k1�CAr�CH2
r2 ¼ k2�C6
r3 ¼ k3�CN6 �CH2
r4 ¼ k4�Ciso�P
r5 ¼ k5�CG�CH2
r6 ¼ k6�Cn�P�CH2
r7 ¼ k7�CN5 �CH2
r8 ¼ k8�Cn�P
r9 ¼ k9�CN5
r10 ¼ k10�CN6
r11 ¼ k11�Cn�P ð3Þr12 ¼ k12�Ciso�P
r13 ¼ k13�CN6 �CH2
r14 ¼ k14�Cn�P
r15 ¼ k15�CN5 �CH2
r16 ¼ k16�Ciso�P
r17 ¼ k17�CUICP
r18 ¼ k18�CN5
r19 ¼ k19�CUICP
r20 ¼ k20�CAr
r22 ¼ k22�CAr0 :
The equation of heat balance can be written as:
GdTdV
¼ 1q � Cmix
p
Xmj¼1
Qj ; ð4Þ
Qj ¼ �Hj � kj xð Þ � Cj xð Þ; ð5Þ
where V is a catalyst volume in the reactors, m3; q is adensity, mol/m3; Cmix
p is a heat capacity of mixture,kJ/mol K; Qj is an amount of heat in a jth chemical reac-tion; DH is a jth reaction heat, kJ/mol:
Q1 ¼ �H1Px
k2 � CN6 � k1 � CAr � CH2½ �Q2 ¼ �H2
Px
k4 � C iso�P � k3 � CN6 � CH2½ �Q3 ¼ ��H3
Pxk5 � C iso�P � CH2
Q4 ¼ ��H4Pxk6 � Cn�P � CH2
Q5 ¼ �H5Px
k11 � Cn�P � k12 � C iso�P½ �Q6 ¼ �H6
Px
k8 � Cn�P � k7 � CN5 � CH2½ �Q7 ¼ �H7
Px
k10 � CN6 � k9 � CN5½ �Q8 ¼ �H8
Px
k16 � C iso�P � k15 � CN5 � CH2½ �Q9 ¼ �H9
Px
k14 � Cn�P � k13 � CN6 � CH2½ �Q10 ¼ �H10
Px
k18 � CN5 � k17 � CUICP½ �Q11 ¼ �H11
Px
k10 � CAr � k19 � CUICP½ �Q12 ¼ ��H12
Pxk21 � CUICP
Q13 ¼ ��H13Pxk22 � CAr:
ð6Þ
Thus, the mathematical model of semi-regenerative cat-alytic reforming of naphtha is presented by a system ofequations of material and heat balances:
Gc@Ci
@ZþGc
@Ci
@V¼
Xmj¼1
aj � rj
Gc@T@V
þGc@T@Z
¼ 1q � Cmix
p
Xmj¼1
aj � rj � RTP
� ���Hj
8>>>><>>>>:
:
ð7Þ
Fig. 1. Formalized reaction scheme of naphtha reforming: n-P,iso-P – normal and iso-alkanes; N-5, N-6 – cyclopentanes andcyclohexanes; Ar – aromatic hydrocarbons; UICP – UnsaturatedImmediate Compacting Products; G – gas.
E. Ivanchina et al.: Oil & Gas Science and Technology – Rev. IFP Energies nouvelles 76, 64 (2021) 3

The boundary conditions are:
z ¼ 0; Ci ¼ Ci0; T ¼ T en;
V ¼ 0; T ¼ T en; Ci ¼ Ci0:ð8Þ
Gc is a feedstock flow rate, m3/h; Ci is a concentration of ithcomponent, mol/m3; Z is a volume of feedstock processedfrom the moment when the fresh catalyst (new catalyst,no regenerations were done) was loaded, m3; V is a catalystvolume in the reactors, m3; aj is a catalyst’s activity; rj is areaction’s rate, mol/m3 h; i is a component number in amixture; j is a reaction number due to the accepted formal-ized scheme; T is a temperature, R; q is a density, mol/m3;Cmix
p is a heat capacity of the mixture, kJ/mol K; kj is thejth reaction constant, L/mol h; DH is a jth reaction heat,kJ/mol; R is the gas constant, 8314 MPa L/mol K; P is apressure, MPa:
Z ¼ G � t; ð9Þwhere Z is a volume of feedstock processed from themoment when the fresh catalyst (new catalyst, no regen-erations were done) was loaded, m3; G is a feedstock flowrate, m3/h; t is a space time, h,
GdCAr
dV¼ r2 þ r19 � r1 � r20 � r22
GdCN6
dV¼ r1 þ r4 þ r9 þ r14 � r2 � r3 � r10 � r13
GdC iso�P
dV¼ r3 þ r11 þ r15 � r5 � r12 � r4
GdCAr
0
dV¼ r22 þ r2 � r1 þ r19 � r20
GdCn�P
dV¼ r11 þ r7 þ r13 � r6 � r8 � r12 � r16
GdCN5
dV¼ r10 � r9 þ r8 � r7 þ r17 � r18 þ r16 � r15
GdCUICP
dV¼ r19 � r20 þ r18 � r17 � r21
GdC coke
dV¼ r21 þ r19 � r20 þ r18 � r17
GdCG
dV¼ r5 þ r6 þ r3 � r4 þ r7 � r8 þ r15 � r16 þ r13 � r14:
ð10ÞThe computer program based on this mathematical modelwas developed. The model enables to consider physicaland chemical laws of hydrocarbons conversion on the cata-lyst surface and changes in the composition of the feedstock.With this model, such parameters as the current and opti-mal activities are calculated. The current activity is deter-mined by the current modes of the operation:
acur ¼ W 0 �Wk 1� að Þ; ð11Þwhere aj – a relative activity of a catalyst in each reaction(7); W0 – a chemical reaction rate, mol/sm³ s, with andwithout a catalyst; a – a part of the volume occupied bythe catalyst and inaccessible for the reacting mixture [7].
The optimal activity (aopt) is defined by the optimalprocess operation which corresponds to the desired rateratio of the target and adverse reactions, and also savethe equilibrium of formation and hydrogenation of the cokestructures, which is described by the process parametersnamely temperature, pressure, feedstock composition. Theoptimal activity provides maximum process selectivity.
As a common indicator of the catalyst potential, a spe-cial criterion of effectiveness was proposed. This criterioncorresponds to the deviation of the current activity fromthe optimal one [17–19]:
� ¼Pni¼1
aicur � ai
opt
h i
�max; ð12Þ
where D – a criterion of effectiveness; aicur – a current activ-
ity; aiopt – an optimal activity; Dmax –maximum deviation of
the current activity from the optimal one.With this characteristic of the catalyst potential, it is
possible to determine the degree of effectiveness, the cata-lyst is used on a reforming unit. This criterion also determi-nes the coke formation dynamics and selectivity withdifferent types of the catalyst activity and the deviationbetween them corresponds to this criterion. All these calcu-lations were made with the mathematical model to increasethe yield and decrease the coke formation dynamics duringthe catalyst life operation, that leads to process optimiza-tion and its profitability improving.
3 Results and discussion
Polymetallic catalysts with high stability and selectivityplay the key role in catalytic reforming of naphtha andimprovement of its characteristics is a vital issue for theprocess optimization. In this paper a comparison of twodifferent Pt-Re catalysts was done with the help of themathematical model. The catalysts were loaded on thesame catalytic reforming unit. The specifications of the reac-tors, operating conditions, feedstock, product and catalystproperties are presented in Tables 1–3.
The experimental data including the chromatographicanalyzes results of feedstock and product compositions,the technological modes of the production unit operationwere obtained from two different industrial SSR reformingunits of the Russian refinery and were used as the initialdata.
3.1 Verification of the mathematical model
To verify the model developed, a comparison between exper-imental and calculated results have been made for each SRRunit. Specifications of technological operation, naphthafeed, product and catalysts are provided in Tables 1–3.Experimental data are obtained from oil-refining plants, cal-culated results are performed with the mathematical modelusing.
Comparing the values presented in Tables 4 and 5, wecan see, that data calculated on model agree very well with
E. Ivanchina et al.: Oil & Gas Science and Technology – Rev. IFP Energies nouvelles 76, 64 (2021)4

the experimental data from the industrial units (the calcu-lation error should not exceed an error of chromatographicanalysis).
In our case the average calculation error is lessthan 1 wt.%.
3.2 Evaluation of catalyst work efficiency in thepresence of catalyst coking
The efficiency of the catalysts was evaluated. In these calcu-lations the SRR unit 1 were used (Tabs. 1–3). The changes
Table 1. Specifications of reactors and operating conditions of SRR units.
Parameter Numerical value
Unit 1 Unit 2
Reactors inlet temperature, �C 490 480Pressure, MPa 2.0 1.7Mass flow rate, h�1 1.0–1.8 1.4Diameter, length and volume of, m; m; m3:
Reactor 1 2.40; 10.6; 13.0 1.86; 6.49; 12.1Reactor 2 3.20; 11.9; 38.0 2.00; 7.00; 16.4Reactor 3 4.00; 13.9; 76.0 3.2; 10.7; 60.0Reactor 4 – 4.0; 13.05; 118
Table 2. Specifications of naphtha feed and reformate.
Parameter Naphtha feed Reformate
Unit 1Density at 20 �C, kg/m3 755 800–830Distillation fraction, �C:
IBP 85 85FBP 180 218
Group composition, % mas.:Aromatic hydrocarbons 15.0 57.0–65.0Naphtenes 30.0–45.0 2.80–4.00Alkanes 45.0–60.0 25.0–35.0
Unit 2Density at 20 �C, kg/m3 720–750 750–810Distillation fraction, �C:
IBP 80 70FBP 180 205
Group composition, % mas.:Aromatic hydrocarbons 8.00–14.5 55.0–67.0Naphtenes 34.5–40.0 2.10–3.80Alkanes 49.0–55.0 30.0–41.0
Table 3. Specifications of catalyst properties.
Properties of a catalyst R-98 RB 33U Grade Sh RB 44U Grade Sh PR-9 PR-81*
Pt, wt.% 0.25 0.30 0.25 0.25 0.25Re, wt.% 0.25 0.30 0.40 0.25 0.30Packed density, kg/m3 720 700–800 700–800 720 750Promoted by chlorine No Yes Yes Yes Yes* The development of Institute of Hydrocarbons Processing of the Siberian Branch of the RAS.
E. Ivanchina et al.: Oil & Gas Science and Technology – Rev. IFP Energies nouvelles 76, 64 (2021) 5
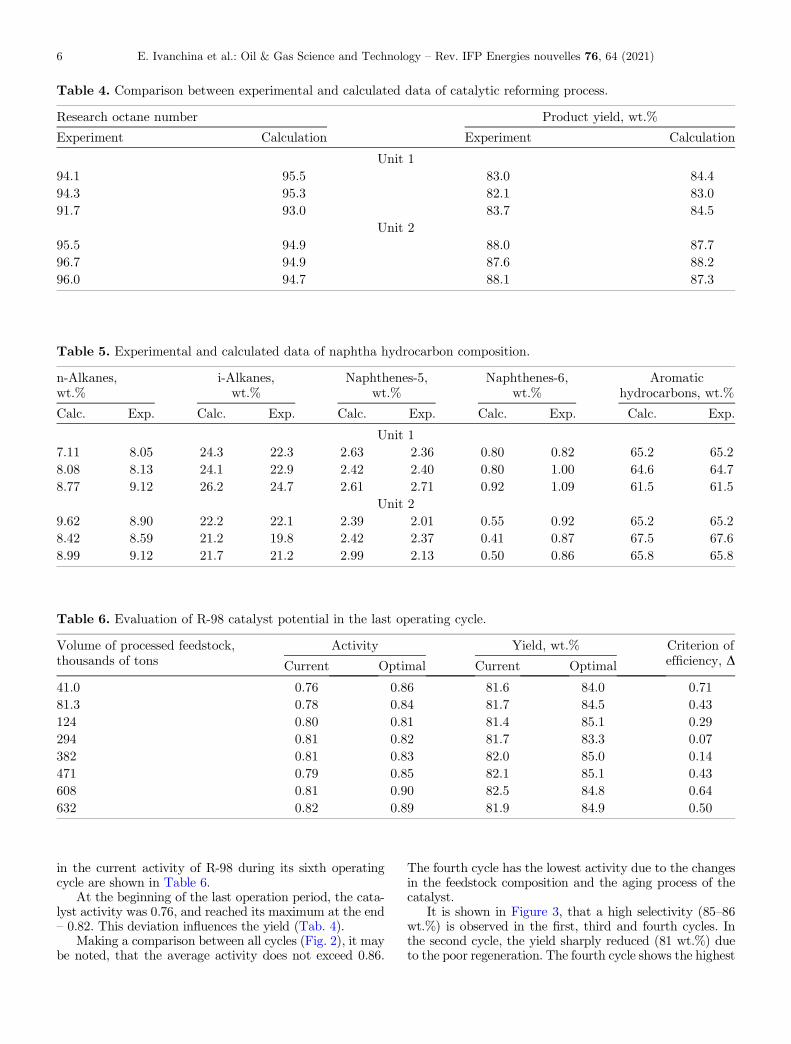
in the current activity of R-98 during its sixth operatingcycle are shown in Table 6.
At the beginning of the last operation period, the cata-lyst activity was 0.76, and reached its maximum at the end– 0.82. This deviation influences the yield (Tab. 4).
Making a comparison between all cycles (Fig. 2), it maybe noted, that the average activity does not exceed 0.86.
The fourth cycle has the lowest activity due to the changesin the feedstock composition and the aging process of thecatalyst.
It is shown in Figure 3, that a high selectivity (85–86wt.%) is observed in the first, third and fourth cycles. Inthe second cycle, the yield sharply reduced (81 wt.%) dueto the poor regeneration. The fourth cycle shows the highest
Table 4. Comparison between experimental and calculated data of catalytic reforming process.
Research octane number Product yield, wt.%
Experiment Calculation Experiment Calculation
Unit 194.1 95.5 83.0 84.494.3 95.3 82.1 83.091.7 93.0 83.7 84.5
Unit 295.5 94.9 88.0 87.796.7 94.9 87.6 88.296.0 94.7 88.1 87.3
Table 5. Experimental and calculated data of naphtha hydrocarbon composition.
n-Alkanes,wt.%
i-Alkanes,wt.%
Naphthenes-5,wt.%
Naphthenes-6,wt.%
Aromatichydrocarbons, wt.%
Calc. Exp. Calc. Exp. Calc. Exp. Calc. Exp. Calc. Exp.
Unit 17.11 8.05 24.3 22.3 2.63 2.36 0.80 0.82 65.2 65.28.08 8.13 24.1 22.9 2.42 2.40 0.80 1.00 64.6 64.78.77 9.12 26.2 24.7 2.61 2.71 0.92 1.09 61.5 61.5
Unit 29.62 8.90 22.2 22.1 2.39 2.01 0.55 0.92 65.2 65.28.42 8.59 21.2 19.8 2.42 2.37 0.41 0.87 67.5 67.68.99 9.12 21.7 21.2 2.99 2.13 0.50 0.86 65.8 65.8
Table 6. Evaluation of R-98 catalyst potential in the last operating cycle.
Volume of processed feedstock,thousands of tons
Activity Yield, wt.% Criterion ofefficiency, DCurrent Optimal Current Optimal
41.0 0.76 0.86 81.6 84.0 0.7181.3 0.78 0.84 81.7 84.5 0.43124 0.80 0.81 81.4 85.1 0.29294 0.81 0.82 81.7 83.3 0.07382 0.81 0.83 82.0 85.0 0.14471 0.79 0.85 82.1 85.1 0.43608 0.81 0.90 82.5 84.8 0.64632 0.82 0.89 81.9 84.9 0.50
E. Ivanchina et al.: Oil & Gas Science and Technology – Rev. IFP Energies nouvelles 76, 64 (2021)6

yield (86 wt.%), but in the fifth and sixth cycles the yield isin the range of 81–84 wt.%. This fact can be explained bythe process of catalyst aging.
The yield and octane number of the product are interre-lated with each other. Figure 3 shows that the lowest selec-tivity cycles correspond to the highest quality products.The average value of research octane number is in the rangeof 93–97, while the desirable RON is 92. Maintaining theoptimal mode of the process, it can be possible to achievea higher yield of desirable quality. In general, the R-98 cat-alyst shows very good results throughout the entire periodof its operation, it allows obtaining a high-quality product.
The R-98 catalyst was used successfully during 6 cyclesand then was replaced for the composition of the two cata-lysts RB 33U/RB 44U Grade Sh. With the mathematicalmodel, the evaluation of RB 33U/RB 44U Grade Sh effi-ciency was carried out.
Figure 4 and Table 7 show that the reforming unit inboth of the cycles was close to the optimal mode.
In the first cycle the catalyst activity varies in the rangefrom 0.75 to 1.20, in the second – from 0.95 to 1.30. The dif-ference between the current and optimal modes is not signif-icant. It can be concluded that the catalyst is used quiteeffectively. The two cycles were compared (Fig. 5), it maybe observed that the current activity in the second cycleexceeds by 0.20 the activity in the first cycle. This factcan be associated with the changes in the hydrocarbon com-position of the feedstock and the technological mode, or theeffective regeneration of the catalyst.
Figure 6 shows, that the yield with the current activityexceeds the yield with the optimal activity. The yieldachieved 91 wt.%, the deviation of the current mode fromthe optimal one in the first cycle is 0.3 wt.%, in the second– 1.0 wt.%.
However, analyses of the quality of the product (Fig. 6)speaks for the fact that in both of the cycles, the octanenumber varies in the range from 88.5 to 92.0 with desirableRON = 92. Maintaining the optimal mode of the process,
the yield of the desirable quality will not greatly differ fromthe current mode.
Using the proposed computer modeling system based onthe mathematical model, it is possible to monitor the indus-trial catalytic reforming unit and evaluate the catalystpotential numerically equal to the deviation of the currentactivity from the optimal one. The yield is dependent onthe activity and changes in its value.
The regulation of the catalyst activity allows the effi-ciency of catalytic reforming process to be rised by anincrease in the yield and duration of the operating cycleof the catalyst. Application of the computer modeling sys-tem based on the mathematical model enables to considerchanges in the operating conditions, feedstock compositionand coke formation.
The coke is progressively accumulated and distributedon the surface of the catalyst during its operation. Coke for-mation process is the reversible reason of catalyst deactiva-tion and the coke depositions can be removed from thesurface [1, 29].
The model considers coke formation process as one ofthe formalized scheme reactions and its concentration canbe calculated according to equation (4). The mechanismof coke formation can be represented by the scheme ofthe sequential reactions: hydrocarbons ? resins ?asphaltenes ? coke, where resins and asphaltenes areUnsaturated Immediate Compacting Products (UICP).The formation and hydrogenation of unsaturated interme-diate products of compaction are possible. Therefore, undercertain conditions coke formation does not occur, becauseasphaltenes (the precursors of coke) can hydrogenate tohydrocarbons or can be in equilibrium with gas-phase reac-tion medium.
Thus, by controlling of the feedstock temperature in areactor, it could be possible to provide the process operationmode with the equilibrium of formation and hydrogenationof the coke structures. However, it is difficult to apply inpractice, because it is required to obtain the final high-octane product, so there is an objective need for the devia-tions from the thermodynamic equilibrium. As a result,accumulation of unsaturated intermediate products of com-paction occurs.
With the mathematical model the coke concentrationis calculated. The coke accumulation rate at the optimaloperating conditions differs from the current one (Tab. 8).
The mathematical model application allows analyz-ing the rate of coke accumulation in the current periodand helps to choose the optimal technological conditionsfor the process. The regulation of the rate of coke accumu-lation using the developed mathematical model allowsextending the operating cycle, while maintaining the highselectivity.
3.3 Optimization of SRR catalytic reformingprocess by pressure reducing
The operating conditions strongly affect the process charac-teristics such as the yield, octane number and coke accumu-lation rate. Such reactions as naphthenic dehydrogenationand paraffin dehydrocyclization are favored at low pressure,
1 2 3 4 5 60.0
0.1
0.2
0.3
0.4
0.5
0.6
0.7
0.8
0.9
1.0
Act
ivity
Number of cycle
R-98
Fig. 2. Comparison of R-98 catalyst current activity (modelcalculation results).
E. Ivanchina et al.: Oil & Gas Science and Technology – Rev. IFP Energies nouvelles 76, 64 (2021) 7

0 200 400 600 8000.70
0.75
0.80
0.85
0.90
0.95
1.00
1.05
1.10
1.15
1.20
1.25
Current Optimal
Act
ivity
Volume of processed feedstock (thousand of tons)
0 200 400 600 800 1000 12001.00
1.05
1.10
1.15
1.20
1.25
1.30
Act
ivity
Volume of processed feedstock (thousand of tons)
Current Optimal
1 cycle 2 cycle
Fig. 4. Comparison between current and optimal activity of catalyst RB 33U/RB 44U Grade Sh (model calculation results).
1 2 3 4 5 60
10
20
30
40
50
60
70
80
90
100
Yie
ld, %
wt.
Number of cycle
1 2 3 4 5 60
10
20
30
40
50
60
70
80
90
100
Res
earc
h oc
tane
num
ber
Number of cycle
Fig. 3. Comparison of reformate yield and octane number (model calculation results).
Table 7. Evaluation of RB 33U/RB 44U Grade Sh catalyst potential in the second operating cycle (model calculationresults).
Volume of processed feedstock,thousands of tons
Activity Yield, wt.% Criterion ofefficiency, DCurrent Optimal Current Optimal
206 1.05 1.21 91.1 90.2 1.00440 1.17 1.20 89.7 89.4 0.19509 1.20 1.22 89.9 89.8 0.13795 1.20 1.23 90.0 89.8 0.19879 1.18 1.23 90.3 89.9 0.31983 1.16 1.20 90.2 89.9 0.251018 1.19 1.24 90.6 90.3 0.311138 1.02 1.16 90.5 89.7 0.88
E. Ivanchina et al.: Oil & Gas Science and Technology – Rev. IFP Energies nouvelles 76, 64 (2021)8

while hydrocracking and hydrogenolysis side reactions areinhibited at the same conditions. This fact can be success-fully used in the process optimization. The effect of thetotal pressure on the product yield and catalyst cokingwas analyzed with the mathematical model. Thesecalculations were performed with the data from SRR unit 2(Tabs. 1–3).
At low pressure, the rate of paraffin aromatizationincreases, while the rate of hydrocracking decreases. Thisleads to the hydrogen yield and aromatics gradual increaseby 0.2% and 1–2% respectively. The hydrogen yield growthresults in the product yield rise. Therefore, the total selec-tivity of the process increases (Fig. 7).
Analyzing influence of feedstock, we can see that itshydrocarbon composition (Tab. 9) in combination with
pressure reduction has a strong effect on the process(Tabs. 10 and 11).
Despite this positive effect, low pressure contributes tothe catalyst deactivation due to coking reactions rateincrease (Fig. 8).
Thus, by reduction of pressure, it is possible to increasethe yield and octane number, hydrogen and aromatichydrocarbons due to the equilibrium shift of the reactionsof dehydrogenation and dehydrocyclization. At the sametime, pressure reduction accelerates coke formation processthat leads to rapid catalyst deactivation and shortening ofits operation cycle.
In this connection, it is necessary to determine the opti-mal process conditions under which the maximum yield ofthe given quality is achieved, but coke formation does notlimit the rate of the target reactions. The quantity of thetarget product, expressed in octanes per tons, is taken asan optimal criterion:
x ¼ w � RON100
; ð14Þ
where x – a yield in octanes per tons; w – a yield, wt.%;RON – a research octane number.
The limiting condition that does not allow reducing thepressure to a minimum is the coke formation rate increasingwith a pressure decrease. The solution to this optimizationproblem will be to find the optimal solution (optimum), atwhich the maximum yield of a product of the given qualitywill be achieved, while not significantly exceeding thecoke formation rate, leading to rapid deactivation of thePt catalyst (Fig. 9).
0 200 400 600 800 1000 12000.70
0.75
0.80
0.85
0.90
0.95
1.00
1.05
1.10
1.15
1.20
1.25
1.30
1 cycle2 cycle
Volume of processed feedstock (thousand of tons)
Act
ivity
Fig. 5. Comparison of RB 33U/RB 44U Grade Sh catalystactivity in two cycles (model calculation results).
0 200 400 600 800 1000 120086
87
88
89
90
91
92
931 cycle2 cycle
Volume of processed feedstock (thousand of tons)
Res
earc
h oc
tane
num
ber
Fig. 6. Change in octane number (model calculationresults).
Table 8. Comparison of coke formation on the surface ofR-98 catalyst between current and optimal activity(model calculation results).
A volume ofprocessed feedstock,thousands of tons
R-98
Coke, wt.% Deviation
Current Optimal
21.8 0.15 0.15 0.0041.0 0.34 0.31 0.0360.8 0.52 0.45 0.0781.3 0.74 0.60 0.14103 1.01 0.77 0.24124 1.27 0.94 0.33145 1.56 1.08 0.48166 1.84 1.23 0.61230 2.68 1.59 1.09294 3.64 2.14 1.50316 3.96 2.26 1.70338 4.23 2.42 1.81382 4.79 2.72 2.07404 5.06 2.88 2.18426 5.38 3.03 2.35
E. Ivanchina et al.: Oil & Gas Science and Technology – Rev. IFP Energies nouvelles 76, 64 (2021) 9

1.2 1.3 1.4 1.5 1.6 1.70.0
0.5
1.0
1.5
2.0
2.5
Yie
ld o
f hyd
roge
n, %
Pressure (MPa)
PR-81PR-9
1.2 1.3 1.4 1.5 1.6 1.760.0
60.5
61.0
61.5
62.0
62.5
63.0
63.5
64.0
64.5
Aro
mat
ic h
ydro
carb
ons,
wt.
%
Pressure (MPa)
PR-81PR-9
Fig. 7. Comparison of pressure effect on the hydrogen and aromatics yield between two catalysts (simulation results).
Table 9. Operating conditions and composition of feedstock.
Parameter Feedstock no. 1 Feedstock no. 2 Feedstock no. 3
A volume of processed feedstock, tons 341 629Hydrogen, % 86.7Temperature, �C 482Mass flow rate, m3/h 68.0n-Alkanes, wt.% 186 17.8 18.3i-Alkanes, wt.% 27.4 26.2 26.6Naphthenes, wt.% 35.1 35.8 35.2Aromatic hydrocarbons, wt.% 17.4 18.3 17.2
Table 10. The change in SRR process parameters with hydrocarbon composition of feedstock and pressure variation forPR-9 (simulation results).
Parameter Feedstock no. 1 Feedstock no. 2 Feedstock no. 3
Pressure, MPa 1.6 1.4 1.2 1.6 1.4 1.2 1.6 1.4 1.2Yield of hydrogen, % 1.79 1.83 1.91 1.78 1.85 1.93 1.74 1.81 1.89Aromatic hydrocarbon, wt.% 62.5 63.0 63.5 63.3 63.8 64.3 61.6 62.2 62.6Research octane number 91.8 92.1 92.4 94.0 94.3 94.5 93.5 93.8 94.0Yield, wt.% 86.3 86.8 87.3 86.7 87.2 87.6 86.5 87.0 87.5
Table 11. Change in SRR process parameters with hydrocarbon composition of feedstock and pressure variation forPR-81 (simulation results).
Parameter Feedstock no. 1 Feedstock no. 2 Feedstock no. 3
Pressure, MPa 1.6 1.4 1.2 1.6 1.4 1.2 1.6 1.4 1.2Yield of hydrogen, % 1.91 1.94 2.02 1.84 2.00 2.09 1.73 2.07 2.15Aromatic hydrocarbon, wt.% 60.7 62.8 63.1 61.3 63.0 63.7 61.8 63.1 64.2Research octane number 92.3 92.7 92.9 94.1 94.3 94.5 93.2 93.6 93.8Yield, %mas. 89.2 89.8 89.9 89.5 90.4 90.2 89.9 91.0 90.5
E. Ivanchina et al.: Oil & Gas Science and Technology – Rev. IFP Energies nouvelles 76, 64 (2021)10

Therefore, it is not recommended to maintain pressurebelow 1.4–1.2 MPa in order to prevent rapid catalystdeactivation.
4 Conclusion
In this paper the optimization approach for SRR catalyticreforming process is introduced. The approach is based onmathematical model application. The model takes intoaccount the catalyst activity, operation instability andchanges in hydrocarbon composition of the feedstock. Themodel enables to monitor the industrial process and findthe optimal mode of the operation, which is determinedby the equilibrium conditions for the reactions of coke for-mation and hydrogenation of the intermediate compactionproducts.
With the mathematical model, it is possible to improvetechnical values of the industrial process, such as the yieldand octane number of the product increase. Besides,mathematical modeling allows evaluating the efficiency ofcatalyst and can help to make a decision about its replace-ment for a new one. The studies have shown that the yieldof a product of the desirable quality increases by 4 wt.% incase of it replacement.
It was found, that a decrease in the pressure range from1.5 to 1.2 MPa at the temperature 478–481 �C and feed-stock space velocity is 1.4–1 h induces an increase in theyield of 1–2 wt.% due to an increase in the aromatizationreaction rate and decrease in the hydrocracking reactionrate depending on the feedstock composition and catalysttype, but at the same time do not influences the isomeriza-tion reactions rate.
It is shown that the decrease in pressure is limited bythe requirements for the catalyst stability due to theincrease in the coke formation rate. It was found that whenthe temperature at the reactor inlet is 478 �C, the feedstockflow rate is 64.3 m3/h and there is more naphthenic feed-stock, the total amount of coke is evenly increased by0.5–1.0 wt.% depending on pressure and catalyst type.
It is proposed that the criterion of optimality is the yieldexpressed in octane per tons. It was calculated with themathematical model that with the naphthenic feedstock,the pressure should vary in the range from 1.3 to 1.5 MPa.
Finally, the model considers the process of catalyst deac-tivation by coke. There is no possibility to prevent this pro-cess fully, but with the mathematical model application, itis possible to monitor and correct the technological regime.Catalytic reforming process optimization can be achievedwith the technological conditions improvement and optimalregime provision. Both ways of the process optimizationcontribute to the product yield increase and cokingreduction.
References
1 Rahimpour M.R., Jafari M., Iranshahi D. (2013) Progress incatalytic naphtha reforming process: A review, Appl. Energy109, 79–93.
2 Sharikov Yu.V., Petrov P.A. (2007) Universal model forcatalytic reforming, Chem. Petrol. Eng. 43, 580–584.
3 Froment G.F. (2001) Modeling of catalyst deactivation,Appl. Catal. A: Gen. 212, 117–128.
4 Aguayo A.T., Gayubo A.G., Atutxa A., Olazar M., Bilbao J.(2002) Catalyst deactivation by coke in the transformationof aqueous ethanol into hydrocarbons. Kinetic modeling andacidity deterioration of the catalyst, Ind. Eng. Chem. Res.41, 4216–4224.
5 Ancheyta J., Villafuerte-Macias E. (2000) Kinetic modelingof naphtha catalytic reforming reactions, Energy Fuels 14,1032–1037.
6 Stijepovic M.Z., Ostojic A., Milenkovic I., Linke P. (2009)Development of a kinetic model for catalytic reforming ofnaphtha and parameter estimation using industrial plantdata, Energy Fuels 23, 979–983.
7 Rodríguez M.A., Ancheyta J. (2011) Detailed description ofkinetic and reactor modeling for naphtha catalytic reforming,Fuel 90, 3492–3508.
1.2 1.3 1.4 1.5 1.6 1.70.0
0.5
1.0
1.5
2.0
2.5
3.0
3.5
Cok
e, w
t. %
Pressure (MPa)
PR-81PR-9
Fig. 8. Coke accumulation on the catalysts with pressure(simulation results).
1.1 1.2 1.3 1.4 1.5 1.6 1.780.0
80.5
81.0
81.5
82.0
82.5
83.0
83.5
Yie
ld in
oct
anes
per
ton
Pressure (MPa)
PR-81 PR-9
Fig. 9. Change in yield with pressure (simulation results).
E. Ivanchina et al.: Oil & Gas Science and Technology – Rev. IFP Energies nouvelles 76, 64 (2021) 11

8 Taskar U., Riggs J.B. (1997) Modeling and optimization of asemiregenerative catalytic naphtha reformer, AIChE J. 3,740–753.
9 Padmavathi G., Chaudhuri K.K. (1997) Modelling andsimulation of commercial catalytic naphtha reformers, Can.J. Chem. Eng. 75, 930–938.
10 Kern C., Jess A. (2005) Regeneration of coked catalysts –
modelling and verification of coke burn-off in single particlesand fixed bed reactors, Chem. Eng. Sci. 60, 4249–4264.
11 Gyngazova M.S., Kravtsov A.V., Ivanchina E.D., KorolenkoM.V., Chekantsev N.V. (2011) Reactor modeling and simula-tion of moving-bed catalytic reforming process, Chem. Eng. J.176–177, 134–143.
12 Belyi A.S. (2005) Reforming catalysts of the PR family:Scientific Foundations and Technological Advancement,Kinet. Catal. 46, 684–692.
13 Hou W., Su H., Hu Y., Chu J. (2006) Modeling, simulationand optimization of a whole industrial catalytic naphthareforming process on Aspen Plus platform, Chin. J. Chem.Eng. 14, 584–591.
14 Lid T., Skogestad S. (2008) Data reconciliation and optimaloperation of a catalytic naphtha reformer, J. ProcessControl. 18, 320–331.
15 Hongjun Z., Mingliang S., Huixin W., Zeji L., Jiang H. (2010)Modeling and simulation of moving bed reactor for catalyticnaphtha reforming, Pet. Sci. Technol. 28, 667–676.
16 Syed A.A., Mohammed A.S., Mohammed A.A. (2006)Parametric study of catalytic reforming process, React.Kinet. Catal. Lett. 87, 199–206.
17 Yakupova I.V., Ivanchina E.D., Sharova E.S., Syskina A.A.(2014) Computer modelling system application for catalyticreforming unit work optimization, Procedia Chem. 10,192–196.
18 Belinskaya N.S., Ivanchina E.D., Ivashkina E.N., ChuzlovV.A., Faleev S.A. (2015) Mathematical modeling of theprocess of catalytic hydrodewaxing of atmospheric gasoil
considering the interconnection of the technological schemedevices, Procedia Eng. 113, 68–72.
19 Ivanchina E.D., Ivashkina E.N., Nazarova G.U. (2017)Mathematical modelling of catalytic cracking riser reactor,Chem. Eng. J. 329, 262–274.
20 Ostrovskii N.M. (2005) Problems in the study of catalystdeactivation kinetics, Kinet. Catal. 46, 693–704.
21 Shakor Z., Abdulrazak A.A., Sukkar K. (2020) A detailedreaction kinetic model of heavy Naphtha reforming, AJSE45, 7361–7370.
22 Arani H., Shirvani M., Safdarian K., Dorostkar E. (2009)Lumping procedure for a kinetic model of catalytic naphthareforming, Braz. J. Chem. Eng. 26, 723–732.
23 Shanying H.U., Zhu X. (2004) Molecular modeling andoptimization for catalytic reforming, Chem. Eng. Commun.191, 500–512.
24 Ren X.-H., Bertmer M., Stapf S., Demco D.E., Blumich B.,Kern C., Jess A. (2002) Deactivation and regeneration of anaphtha reforming catalyst, Appl. Catal. A-Gen. 228, 39–52.
25 Ostrovskii N.M. (2006) General equation for linear mecha-nisms of catalyst deactivation, Chem. Eng. J. 120, 73–82.
26 Zagoruiko A.N., Belyi A.S., Smolikov M.D., Noskov A.S.(2014) Unsteady-state kinetic simulation of naphtha reform-ing and coke combustion processes in the fixed and movingcatalyst beds, Catal. Today. 220–227, 168–177.
27 Yakupova I.V., Ivanchina E.D., Sharova E.S. (2014)Mathematical modelling method application for optimisationof catalytic reforming process, Procedia Chem. 10, 197–202.
28 Davis S.M., Laura F., Somorjai G.A. (1982) The reactivityand composition of strongly adsorbed carbonaceous depositson platinum. Model of the working hydrocarbon conversioncatalyst.J. Catal. 77, 2, 439.
29 Dehghani O., Gholipour M.R., Shokrollahi M.S., Yanchesh-meh S., Seifzadeh Haghigh S., Ghaemi M., Rahimpour M.R.,Shariati A. (2013) A new configuration for decoking processin series reactors, Chem. Eng. J. 215–216, 418–431.
E. Ivanchina et al.: Oil & Gas Science and Technology – Rev. IFP Energies nouvelles 76, 64 (2021)12


![Mathematical methods for theoretical physics · Mathematical methods for theoretical physics Level: General ... 1999). [2] B. O’Neill, Semi ... Mathematical Topics Between Classical](https://static.fdocuments.us/doc/165x107/5ad62b0e7f8b9aff228df397/mathematical-methods-for-theoretical-methods-for-theoretical-physics-level-general.jpg)