Industrial Mathematical and Statistical Modeling Workshop for ...
Upload
truongdiepCategory
view
222download
0
AID-A179 611 MATHEMATICAL AND STATISTICAL SOFTHARE INDEX(U) AIR /FORCE HUMAN RESOURCES LAB BROOKS AFB TX
A LBERT ET AL. AUG B6 RFHRL-TP-B5-47IUNCLASSIFIED F/ 9/2 NL
1EE7EE7hEEEEEEohEEEEohE
EohhEEEEEEohEIEhhEmmhmhohhohE
1-0 2-8 25
1*251*4 III

-'.
AFHRL-TP-85-47
MATHEMATICAL AND STATISTICAL SOFTWARE INDEX:AIR FORCE 1 SECOND EDITION
Ucc Walter G. AlbertMvi Larry K. WhiteheadA
rA MANPOWER AND PERSONNEL DIVISIONBrooks Air Force Base, Texas 78235-5601
N
R August 1986E Iterim Paper for Period November 1984 - June 1985
S0U Approved for public release; distribution is unlimited.
R
ES LABORATORY
'T10 AIR FORCE SYSTEMS COMMANDBROOKS AIR FORCE BASE, TEXAS 78235-5601 ,-
-- . - p. P p - -~~.. ,.-"~.
,. 8 g 3 O O --0• :!:::%

NOTICE
When Government drawings, specifications, or other data are used for anypurpose other than in connection with a definitely Government-relatedprocurement, the United States Government incurs no responsibility or anyobligation whatsoever. The fact that the Government may have formulated orin any way supplied the said drawings, specifications, or other data, isnot to be regarded by implication, or otherwise in any manner construed, aslicensing the holder, or any other person or corporation; or as conveyingany rights or permission to manufacture, use, or sell any patentedinvention that may in any way be related thereto.
The Public Affairs Office has reviewed this paper, and it is releasable tothe National Technical Information Service, where it will be available tothe general public, including foreign nationals.
This paper has been reviewed and is approved for publication.
WILLIAM E. ALLEY, Scientific AdvisorManpower and Personnel Division
RONALD L. KERCHNER, Colonel, USAF
Chief, Manpower and Personnel Division
I,"
)'

Unclassified
SECURITY CLASSIFICATION OF THIS PAGE
REPORT DOCUMENTATION PAGEla. REPORT SECURITY CLASSIFICATION lb RESTRICTIVE MARKINGS
Unclassified
2a. SECURITY CLASSIFICATION AUTHORITY 3 DISTRIBUTION/AVAILABILITY OF REPORTApproved for public release; distribution is unlimited.
2b. DECLASSIFICATION / DOWNGRADING SCHEDULE
4. PERFORMING ORGANIZATION REPORT NUMBER(S) S. MONITORING ORGANIZATION REPORT NUMBER(S)
AFHRL-TP-85-47
6a. NAME OF PERFORMING ORGANIZATION 6b. OFFICE SYMBOL 7a. NAME OF MONITORING ORGANIZATION(if applicable)
Manpower and Personnel Division AFHRL/MOI4
6c. ADDRESS (City, State, and ZIP Code) 7b ADDRESS (City, State, and ZIP Code)
Air Force Human Resources LaboratoryBrooks Air Force Base, Texas 78235-5601
Ba. NAME OF FUNDING/SPONSORING 8b. OFFICE SYMBOL 9 PROCUREMENT INSTRUMENT IDENTIFICATION NUMBERORGANIZATION (If applicable)Air Force Human Resources Laboratory HQ AFHRL
8c. ADDRESS (City, State, and ZIP Code) 10. SOURCE OF FUNDING NUMBERSBrooks Air Force Base, Texas 78235-5601 PROGRAM PROJECT TASK WORK UNIT
ELEMENT NO. NO. NO. ACCESSION NO.62703F 7719 22 01
11, TITLE (Include Security Classification)
Mathematical and Statistical Software Index: Second Edition
12. PERSONAL AUTHOR(S)Albert Walter G. Whitehead. Larry K.
13a. TYPE OF REPORT 13b. TIME COVERED 14. DATE OF REPORT (Year, Month, Day) 15 PAGE COUNTInterimI FROM Noy 84 TO Jn 5I August ,3 6 I 66
16. SUPPLEMENTARY NOTATION
17. COSATI CODES 18 SUBJECT TERMS (Continue on reverse if necessary and identify by block number)FIELD GROUP SUB-GROUP ABCD technique binary classification table05 09 analysis of variance canonical correlation
automatic interaction detector categorical prediction (Continued)
19. ABSTRACT (Continue on reverse if necessary and identify by block number)This paper is an abridged documentation source for the Air Force Human Resources Laboratory (AFHRL)
mathematical and statistical software library for use by Air Force personnel researchers. It provides a singlereference which researchers may quickly scan to identify mathematical or statistical computer software that is
currently operational and available for use on the AFHRL Sperry 1100/81 computer system. The paper is comprisedof four chapters with the first chapter devoted to introductory information; the second chapter, to descriptions
of the library's single function computer programs; the third chapter, to descriptions of the library'ssubroutine systems; and the final chapter, to the nationally recognized statistical packages available in the
software library. --
20. DISTRIBUTION/AVAILABILITY OF ABSTRACT 21 ABSTRACT SECURITY CLASSIFICATIONfI) UNCLASSIFIED/UNLIMITED 0 SAME AS RPT 0 DTIC USERS Unclassified
22a NAME OF RESPONSIBLE INDIVIDUAL 22b. TELEPHONE (Include Area Code) 22c OFICE SYMBOLNancy A. Perrigo. Chief, STINFO Office (512) 536-3877 AFHRL/TSR
DO FORM 1473, 84 MAR 83 APR edtlon may be used unti exhausted. SECURITY CLASSIFICATION OF HIS PAGEAll other editions are obsolete.
Unclassified
""' "." .... .- .... . . .-. *.... -*. . -.. *.. - **..' ,, . . -* , ; . -. :-,, , ... , .v "

18. (Concluded)
CODAP (comprehensive occupational data analysis) mathematical computer software
contingeri:y table method of reciprocal averagescorrelation multidimensional scalingcorrelation correction for curtailment of range mutliphase pivoting algorithmcross-classification multiple discriminant analysiscross-tabul ation mul tipl e-objecti ve modelcurve fitting multivariate analysis of varianceequipercentile equating multivariate normal probabilityfactor analysis nonhierarchical clusteringGuttman's technique nonlinear goal programminghierarchical clustering policy capturinginteractive regression policy specifyingitem analysis PERSUBjudgment analysis regressionlinear goal programming regression equation groupinglinear programing statistical computer softwarelinear structual relationships test for normality
~ 44?.* * -
AFHRL Technical Paper 85-47 August 1986
MATHEMATICAL AND STATISTICAL SOFTWARE INDEX:
SECOND EDITION
Walter G. AlbertLarry K. Whitehead
MANPOWER AND PERSONNEL DIVISION
Brooks Air Force Base, Texas 78235-5601
Reviewed by
C. Deene Gott
Chief, Mathematical/Statistical Methods FunctionManpower and Personnel Division
Submitted for publication by
Robert C. Rue, Lt Col, USAF
Chief, Manpower and Force Management Systems BranchManpower and Personnel Division
This publication is primarily a reference document. It provides information on the mathematical
or statistical computer software currently operational on the AFHRL computer system.
'p
" * '%*.*--.t.;xi-].,-' *- . \y*. .' '.puI 1J" 1

SUM4ARY
One responsibility of the Manpower and Force Management Systems Branch (MOM) of the Manpowerand Personnel Division (MO), Air Force Human Resources Laboratory (AFHRL), is to provide amathematical and statistical software library that can be used in general support of AFHRLresearch and development (R&D) activities. This responsibility includes evaluating, procuring,writing, developing, testing, modifying, implementing, documenting, and disseminating scientificprograming packages, in support of R&D requirements. The software library is available for use
by numerous researchers who have access to the AFHRL SPERRY 1100 computer system.
The first edition of the software index contained brief descriptions ofmathematical/statistical software maintained by personnel in MOM and in the Technical ServicesDivision (TS). In this edition, the scope of the document has been extended to includedescriptions of software maintained by other MO branches and AFHRL divisions. The paper willalso bring the user up to date concerning additions/modifications to the software library anddocumentation due to changes in computer hardware specifications and compilers, identification oferrors, and requirements of special problems. Researchers should be able to scan the paperquickly to identify software that satisfies their methodological/computational requirements,enabling research to be accomplished in a much shorter period of time.
The paper is comprised of four chapters, with the first chapter devoted to introductoryinformation; the second chapter, to descriptions of the library's single function computerprograms; the third chapter, to descriptions of the library's subroutine systems; and the finalchapter, to the nationally recognized statistical packages available in the software library.
DTIC ~c~~~7
~~ 1986
4

PREFACE
The Air Force Human Resources Laboratory (AFHRL) mathematical and statistical
library, which is maintained on the AFHRL Sperry 1100/81 computer system, undergoes
continuous development in support of AFHRL research to facilitate and improve the
analysis of human resources data. This paper will expedite the work of Air Force
personnel researchers by providing a single reference they may quickly scan to identify
mathematical and statistical computer software currently operational on the AFHRLcomputer system. Work on the software index was accomplished under Project 7719, ForceAcquisition and Distribution System; Task 771922, Development of Analytic Methodologyfor Air Force Personnel Research.
Many people who have worked in the AFHRL Manpower and Personnel Division and
Technical Services Division have contributed to the maintenance, development,implementation, and documentation of programs in the AFHRL mathematical and statistical
software library. Although those responsible for certain programs are identified in
the documentation for those programs, it is appropriate to acknowledge the followingkey personnel responsible for the ongoing development of the software library: Dr.
Janos B. Koplyay, Mr. C. Deene Gott, Mr. Charles R. Rogers, Mr. Jacob E. Myer, Jr.,
Mr. William J. Phalen, and Ms. Janice Buchhorn. Special acknowledgement also goes toMs. Doris Black for her commendable efforts in compiling the first edition of the index.
.
4.,
4.,

TABLE OF CONTENTS
Page
*I. INTRODUCTION .. .. .. ...... ..... ...... ..... ...... ...... 1
11. MATHEMATICAL AND STATISTICAL PROGRAMS. .. ... ..... ...... ..... ......
ADIG (Frequency Distribution Generator) .. .. ..... ...... ..... ...... 2AID-4 (Automatic Interaction Detector). .. .. .... ...... ..... ....... 2ALSCAL (Alternating Least Squares Scaling). .. .. .... ...... ..... .... 3
*ANOVA-UNEQ (Unequal N Analysis of Variance). .. ... ...... ..... ....... 3ASSIGN (Assignment of Cases Using the Bayesian Algorithm). .. ... ...... ..... 4BAYS (Bayesian Method for Categorical Prediction) .. .. ..... ...... ...... 4CANCOR (Canonical Correlation). .. .. .... ...... ..... ...... ..... 5CLUSTAR (Hierarchical Cluster Analysis) .. .. ..... ..... ...... ...... 6CLUSTID (Assign New Objects to CLUSTAR Solution) .. .. ... ..... ...... ... 6CORR (Copute and Print a Correlation Matrix). .. ... ...... ..... ...... 7CROSS-CLAS (Cross Classification). .. ... ...... ..... ...... ...... 7CTAB (Cross Tabulation Report). .. .. .... ...... ..... ...... ..... 8CURVE-FIT (Fourier-Pearson Curve Fitting) .. .. ..... ...... ..... ..... 8EQUIP (Equipercentile Scoring Program). .. .. .... ...... ..... ....... 9FFPRT (Print a Frequency File). .. .. .... ...... ..... ...... ..... 9F14PS (Functional Mathematical Programing System). .. ... ...... ..... ... 10GEN-HIER-GRP (Generate HIER-GRP Input Data) .. .. ..... ...... ..... ... 10
*GUTiNAN (Guttman Item Analysis) .. .. ..... ...... ..... ...... .... 10HIER-GRP (Regression Equation Grouping). .. ... ...... ..... ...... .. 11HIST (Histogram from Raw Data) .. .. ... ..... ..... ..... ........12HITABI (Hit Tables for Dichotomous Criteria). .. .. ..... ..... ...... .. 12IAP (Item Analysis of Achievement Tests) .. .. ... ..... ...... ..... .. 12IAPG (Item Analysis of Questionnaires) .. .. ... ..... ...... ..... ... 13IAPG-HITS (Hit Table for Dichotomous Criteria). .. .. ..... ..... ........ 14IREG (Interactive Regression System for Small Problems) .. .. ..... ...... .. 14LGP (Linear Goal Programming). .. ... ...... ..... ...... ..... .. 14
1'MANOVA (Multivariate Analysis of Variance). .. .. ..... ..... ...... ... 15MAPCLUS (Mathematical Programming Clustering) .. .. ..... ...... ..... .. 15MAX-FACTOR (Factor Analysis) .. .. ... ..... ...... ..... ...... .. 16MEANSO (Mean & Standard Deviation from a Frequency File). .. .. .... ...... .. 16MFJ (MAX-FACTOR Score Generator). .. .. .... ...... ..... ...... ... 17MSDRPT (Print MEANSD Output) .. .. ... ..... ...... ..... ...... .. 1714ULT-OISCR (Multiple Discriminant Analysis) .. .. ..... ...... ..... ... 17MULTIVARIANCE (Multivariate Analysis of Variance). .. ... ...... ..... ... 18MULTI-PROS (Multivariate Normal Probability). .. .. .... ...... ...... .. 18NLGP (Nonlinear Goal Programing) .. .. ..... ..... ...... ..... ... 19ONEWAY (One-way Frequency Distribution Print) .. .. ..... ...... ..... .. 19POLCAP (Policy Capturing) .. .. ..... ..... ...... ..... ........20POISPEC (Policy Specifying Programs). .. .. .... ...... ..... ........ 20QCORR (Quick Correlation) .. .. ..... ..... ...... ..... ........ 21
*QSTAT (Quick Statistics). .. .. .... ...... ..... ...... ..... .. 21*RANGEX (Correct Correlations for Curtailment of Range). .. .. .... ...... ... 21*RUMMAGE II (Analysis of Linear Models) .. .. ... ..... ...... ..... ... 22
SLAM II (Simulation Language for Alternative Modeling). .. .. ..... ..... ... 22STAT (Summary Statistics from Raw Data). .. ... ...... ..... ...... .. 22TRICOR (Correlation and Regression Package) .. .. ..... ..... ...... ... 23
iii
. . . . .. . . .-

Table of Contents (Concluded)
Page
TSP (Tim Series Processor). .. .... ..... ...... ..... ...... .. 23VMRSEL (Variable Selection Without an External Criterion) .. .. ...... ....... 23WPRIME (Residuals Test for Normality). .. .... ..... ...... ..... ... 24
III. M4ATHEMATICAL AND STATISTICAL SUBROUTINE SYSTEMS .. .. ..... ...... ....... 25
SPERRY MATH-PACK .. .. ... ..... ...... ..... ...... ..... ... 25General Description. .. .. ..... ..... ...... ..... ...... .. 25List of Subroutines. .. .. ..... ..... ...... ..... ...... .. 25
SPERRY STAT-PACK .. .. ... ...... ..... ...... ..... ...... .. 27General Description. .. .. ..... ..... ...... ..... ...... .. 27List of Subroutines. .. .. ..... ..... ...... ..... ...... .. 28
PERSIB (Personnel Research Laboratory Subroutine) System. .. .. ..... ..... .. 30General Description. .. .. ..... ..... ...... ..... ...... .. 30List of Subroutines. .. .. ..... ..... ...... ..... ...... .. 30
IMSL System .. .. ..... ...... ..... ..... ...... ...... .. 32General Description. .. .. ..... ..... ...... ..... ...... .. 32Li st of Subroutines. .. .. ..... ...... ..... ..... ...... .. 32
IV. NATIONALLY RECOGNIZED STATISTICAL PACKAGES .. .. ... ..... ...... ....... 43
BMDP - Biomedical Computer Program. .. .. ..... ..... ...... ..... .. 43*General Description. .. .. ..... ..... ..... ...... ...... .. 43
Class 0 - Data Description. .. .... ..... ...... ..... ........ 43Class F - Frequency Tables. .. .... ..... ...... ..... ........ 44Class L - Life Tables and Survival Functions .. .. ...... ..... ....... 44Class M - Multivariate Analysis. .. .. ..... ..... ...... ..... .. 45Class R - Regression Analysis. .. .. ..... ..... ...... ..... ... 46Class S - Special Programs. .. ... ...... ...... ..... ........ 46Class T - Time Series Analysis .. .. ..... ...... ..... ...... .. 47Class V - Variance Analysis .. .. ... ...... ..... ..... ........ 47
SPSS - Statistical Package for the Social Sciences .. .. ... ...... ..... .. 48General Description. .. .. ..... ..... ..... ...... ...... .. 48List of Programs and Program Descriptions. .. .. ..... ...... ..... .. 48
STATJOB. .. .. ..... ....... ...... ..... ...... ..... .. 51General Description. .. ...... ..... ...... ..... ...... .. 51List of Programs and Program Descriptions. .. .. ..... ...... ..... .. 51
ASCII CODAP - Comp~rehensive Occupational Data Analysis Programs. .. .... ....... 53General Description. .. ...... ..... ...... ..... ...... .. 53List of Programs and Program Descriptions. .. .. ..... ..... ...... .. 53

MATHEMATICAL AND STATISTICAL SOFTWARE INDEX:
SECOND EDITION
I. INTRODUCTION
One responsibility of the Manpower and Force Management Systems Branch (MOM) of the Manpower
and Personnel Division (MO), Air Force Human Resources Laboratory (AFHRL), is to provide amathematical and statistical software library that can be used in general support of AFHRLresearch and development (R&D) activities. This responsibility includes evaluating, procuring,writing, developing, testing, modifying, implementing, documenting, and disseminating scientificprograming packages, as determined by AFHRL R&D requirements. The software library is availablefor use by numerous researchers who have access to the AFHRL Sperry 1100 computer system.
The first edition of the software index (Black, 1978)1 contained brief descriptions ofmathematical/statistical software maintained by personnel in MOM and in the Technical ServicesDivision (TS). In this edition, the scope of the document has been extended to includedescriptions of software maintained by other MO branches and other AFHRL divisions. This paperwill also bring the user up to date concerning additions/modifications to the software libraryand documentation due to changes in computer hardware specifications and compilers,identification of errors, and requirements of special problems. The availability of anup-to-date abridged documentation of library software has been shown to greatly facilitate and
*" improve the analysis of human resources data associated with AFHRL's personnel and training R&Dactivities. Researchers should be able to scan the index quickly to identify software thatsatisfies their methodological/computational requirements, enabling research to be accomplishedin a much shorter period of time. Since there is a continual requirement to add new programs orupdate existing programs and/or documentation to keep the library current, this paper will beupdated periodically to reflect these additions/changes.
This paper is organized in a manner similar to the first edition (Black, 1978), as follows:Chapter 2 contains brief descriptions of the "stand-alone" (i.e., single-function) computerprograms maintained by system users; Chapter 3 describes the MOM-developed or acquired subroutine
systems; and Chapter 4 describes nationally recognized statistical packages resident in AFHRL'scomputer system.
II. MATHEMATICAL AND STATISTICAL PROGRAMS
The information for each computer program described in this chapter consists of an abstractand references for the user who wishes to obtain the documentation for the program. The abstractpresents a general description of the program, the origin of the program if it was obtained froma source outside of AFHRL, limitations of the program (e.g., maximum number of variablespermitted), and a warning (if applicable) about excessive computer execution time which might beincurred in certain circumstances. Immediately following the abstract is the organizationaldesignation of the AFHRL office that maintains the program and that should be contacted if theuser desires more information. The reference is usually in the form of a technical report/paperor a computerized report available from the Sperry 1100 document processor. A standard formatthat has been designed for software documentation includes such information as purpose of the
program, functions performed, restrictions and limitations, background, control and input dataspecifications, Sperry 1100 runstreams, descriptions of output
1Black, D.E. (1978). Mathematical and statistical software index (AFHRL-TR-78-66, AD-A062991). Brooks AFB, TX: Computational Sciences Division, Air Force Human Resources Laboratory.

and interpretations, program messages, references, user programming considerations, computational
formulas, source listings, flowcharts, layouts, sample runs, technical notes, and personnel to
contact for assistance. For the reader with access to the AFHRL Sperry 1100, the reference for
the computerized report contains the retrieval command which can be executed to obtain a copy of
the report. Requests for documentation by other interested readers will be evaluated on an
individual basis.
ADIG (Frequency Distribution Generator)
Abstract
ADIG provides a fast and efficient method of distributing information on a file. ADIG isactually a program generator that will accept minimal control information, automatically generateinternal code, and execute the created program. The ADIG frequency output file may be reported
using several programs (e.g., FFPRT, CTAB, ONEWAY). (AFHRL/TSCS)
Program Documentation
AFHRL/TSCS. ADIG. An AFHRL Sperry 1100 document processor report. Report retrieval command:@S*S.DOC ADIG
AID-4 (Automatic Interaction Detector)
Abstract
AID I is a computer program written primarily in FORTRAN and adapted from an earlier program(Sonquist & Morgan, 1964) obtained from the University of Michigan. It is useful in theidentification of interactions among predictor variables and is essentially a model
identification process for multiple linear regression analysis. The basic idea of the AID-4algorithm is to explain the variance of the criterion variable by the sequential splitting of theoriginal group into subgroups. The splitting is done in such a way as to minimize thewithin-groups (error) sum of squares. This is accomplished by the examination of each possible
split of every predictor variable of the current candidate group to be split and by the selectionof the split giving the smallest within-groups sum of squares. Three basic statistics may bereported at each split: an R-squared value indicating the percentage of the criterion varianceexplained through the current iteration; an F-value indicating the significance of the reductionin the error sum of squares due to the current split; and an F-value for a one-way analysis ofvariance considering all groups at this iteration. AID-4 will handle up to 300 predictorvariables which may be either categorical or continuous. The maximum number of recode categoriesfor a predictor is 50. (AFHRL/MOMM)
Program Documentation
Gott, C.D., & Koplyay, J.B. (1977, July). Automatic interaction detector - version 4 (AID-4)reference manual addendum I (AFHRL-TR-77-30, AD-A042 968). Brooks AFB, TX: Computational
Sciences Division, Air Force Human Resources Laboratory.
2

Koplyay, J.B., Gott, C.D., & Elton, J.H. (1973, October). Automatic interaction
detector-version 4 (AID-4) reference manual (AFHRL-TR-73-17, AD-773 803). Lackland AFB, TX:
Personnel Research Division, Air Force Human Resources Laboratory.
Whitehead, L.K., Koplyay, J.B., & Gott, C.D. AID-4. An AFHRL Sperry 1100 document processor
report. Report retrieval command: @DA*DA.ADOC AID-4
Reference
Sonquist, J.A., & Morgan, J.N. (1964). The detection of interaction effects. Ann Arbor, MI:
University of Michigan, Survey Research Center, Institute for Social Research.
ALSCAL (Alternating Least Squares Scaling)
Abstract
ALSCAL is a nonmetric (or metric) multidimensional scaling (MDS) program with a number of
individual differences options. This program incorporates individual differences MDS models,
multidimensional unfolding (MDU) models, nonindividual differences MDS models, and external MDS
and MOU models. ALSCAL uses the alternating least squares approach to scaling proposed by
Takane, Young, and de Leeuw (1977), as improved by Young, Takane, and Lewyckyj (1978). ALSCAL is
suitable for any type of two- or three-way data (rectangular or square, symmetric or asymmetric,
conditional or unconditional, replicated or unreplicated, with or without missing data) which may
be measured at the nominal, ordinal, interval, or ratio level of measurement (or may be binary).
ALSCAL permits the analysis of multiple matrices in as many as six dimensions. (AFHRL/MOMM)
Program Documentation
Phalen, W.J., & Whitehead, L.K. ALSCAL. An AFHRL SPERRY 1100 document processor report.
Report retrieval command: @DA*DA.ADOC ALSCAL
Young, F.W., & Lewyckyj, R. (1979). ALSCAL-4 users guide (2d ed.). Chapel Hill, NC:
University of North Carolina, Data Analysis and Theory Associates.
References
Takane, Y., Young, F.W., & de Leeuw, J. (1977). Nonmetric individual differences
multidimensional scaling: An alternating least squares method with optimal scaling features.
Psychometrika, 42, 7-67.
Young, F.W., Takane, Y., & Lewyckyj, R. (1978). Three notes on ALSCAL. Psychometrika, 43,
433-435.
ANOVA-UNEQ (Unequal N Analysis of Variance)
Abstract
ANOVA-UNEQ performs one- or two-way analysis of variance for experimental data having unequal
(or equal) cell frequencies. The two-way analysis is carried out using an approximation
procedure that yields identical F-ratios to those produced in an unweighted means analysis. In
3
...................................................

addition to the customary computations, a chi-square value can be computed for Bartlett'shomogeneity of variance test and, in the one-way analysis of variance, an omega-square strengthof association value can be reported. A Duncan multiple range test for investigation of thedifferences between all pairs of cell means can also be performed. ANOVA-UNEQ will not performan analysis for an experiment having any empty cells or any cells with one observation only. Themaximum number of groups that can be present in the analysis of variance is 20, and the maximumnumber of problems that can be performed on one sample is also 20. (AFHRL/MO4)
Program Documentation
Black, D.E., Whitehead, L.K., & Koplyay, J.B. ANOVA-UNEQ. An AFHRL Sperry 1100 documentprocessor report. Report retrieval command: @DA*OA.AOOC ANOVA-UNEQ
ASSIGN (Assignment of Cases Using the Bayesian Algorithm)
Abstract
The ASSIGN program was designed to supplement the BAYS program, It is more efficient thanBAYS if the user is interested only in the following analyses: (a) forcing all items into themodel, (b) using a particular subset of items, or (c) cross-validation using a previouslydeveloped model. ASSIGN requires the input of endorsement ratios from a BAYS run, a prioriprobabilities (user-supplied or from a BAYS run), and costs of misclassification (user-suppliedor assumed). Raw data may be input from cards, an SDF file, or a COBOL file. Individualassignments may be output on cards or an SDF file. ASSIGN has the following limits: one sample,200 items, five criterion categories, 63 categories per predictor, and 2,000 categories acrossall predictors. (AFHRL/MOI4)
Program Documentation
Whitehead, L.K., & Albert, W.G. ASSIGN. An AFHRL Sperry 1100 document processor report. Reportretrieval command: @DA*OA.ADOC ASSIGN
BAYS (Bayesian Method for Categorical Prediction)
Abstract
With a set of categorical predictors and a categorical criterion as input variables, theobjective of the analysis carried out by BAYS is to find a subset of the predictors that mosteffectively discriminates among the criterion categories. BAYS employs a modified version of theABCD technique described by Moonan (1972). Bayes' formula is used to compute probabilities ofclass membership for each case, with the result that an individual is assigned to the criterioncategory for which that individual's posteriori probability is highest, or the cost ofmisclassification is lowest (at the option of the user).
An improvement to the ABCD technique is employed by BAYS in which a stepwise procedure in themodel-building algorithm can cause variables to be eliminated after they have been added to thepredictive scheme. At each stage of the model-building process, the predictive composite that isformed corresponds to the highest classification accuracy resulting from all possible additions(or deletions) of one variab e to (or from) the predictive composite existing at the previousstage. By reviewing the hit table output produced at each stage, a user can compare the
4

classification accuracies of the predictive composites as they are generated. Additionally,predictive composites can be evaluated in terms of misclassification costs. An assignmentalgorithm provides assignment information at each stage. The following options are available tothe BAYS user: (a) empirical probabilities may be supplied by the user or the program willcompute them from the appropriate sample(s), (b) the items may be selected so as to maximizecorrect classifications or minimize expected costs of misclassifications, (c) certain variablesmay be forced into the predictive scheme initially, and (d) the set of predictors selected may becross-validated on up to two samples within the same run. BAYS will handle up to 200 items, fivecriterion categories, and three samples. Excessive computer run times can occur for problemsinvolving large samples. The ASSIGN program is more efficient than BAYS for certain types ofanalyses; e.g., use of a specified model or cross-validation. (AFHRL/MOM")
Program Documentation
Whitehead, L.K., & Albert, W.G. BAYS. An AFHRL Sperry 1100 document processor report. Reportretrieval command: @DA*DA.ADOC BAYS
Reference
Moonan, W.J. (1972). ABCD: A Bayesian technique for making discriminations with qualitativevariables. Proceedings of 14th Annual Conference of the Military Testing Association (pp.214-245).
CANCOR (Canonical Correlation)
Abstract
The purpose of canonical analyses is to define the primary independent dimensions (basis* vectors) that relate one set of variables to another set of variables. The technique is
primarily descriptive, although the method involves finding sets of weights that maximize thecorrelation between two composite variables (one for each set of original variables). The twooutputs should suggest answers to questions concerning the number of ways the two sets ofmeasures are related, the strengths of the relationships, and the nature of the relationships sodefined. CANCOR is a modification and combination of the routines in Cooley and Lohnes (1962)and Veldman (1967). The program computes a full set of canonical correlations for two sets ofvariables. The output contains means and standard deviations for all variables, correlationsbetween the variables, and Wilks' lambda and chi-square values for the full set of roots.Additionally, for each individual root, the program reports the chi-square value, the degrees offreedom, the significance of the chi-square value, both sets of weights, and correlations betweenthe original and canonical variates. The program is restricted to a maximum of 50 variables perset. (AFHRL/MOt4)
Program Documentation
Whitehead, L.K. CANCOR. An AFHRL Sperry 1100 document processor report. Report retrievalcommand: @DA*DA.DOC CANCOR
References
Cooley, W.W., & Lohnes, P.R. (1962). Multivariate procedures for the behavioral sciences. NewYork: John Wiley and Sons.
5
f
Veldan, D.J. (1967). FORTRAN programming for the behavioral sciences. New York: Holt,
Rinehart and Winston.
CLUSTAR (Hierarchical Cluster Analysis)
Abstract
CLUSTAR performs hierarchical cluster analysis to define classes (clusters) of objects frommeasures on a set of attributes (Romesburg, 1984). The major feature of CLUSTAR is that a mixtureof metric and binary scaled attributes is allowed. CLUSTAR performs hierarchical clusteranalysis using the sequential paradigm described by Sneath and Sokal (1973) as follows: (a) adata matrix of measurements for each of T objects (items, individuals, etc.) over N attributes isread, (b) the data matrix is optionally standardized, (c) a (dis)similarity coefficient is usedto compute a pairwise measure of (dis)similarity among the T(T + 1)/2 object pairs, (d) a clustermethod is used to produce a tree showing the similarity/dissimilarity relationships among the Tobjects. Groups of objects (clusters) that are sufficiently similar to be treated as homogeneousunits are defined on the tree by the user. Results from the CLUSTAR tree can then be used in thecomputer program CLUSTID for the classification of new objects. The program is restricted to amaximum of 250 objects and a product of T objects by N attributes not to exceed 32,000.(AFHRL/MOMM)
Program Documentation
Brown, R.H. CLUSTAR. An AFHRL Sperry 1100 document processor report. Report retrieval
command: @DA*DA.ADOC CLUSTAR
Romesburg, H.C., & Marshall, K. (1984). User's manual for CLUSTAR/CLUSTID: Computer programs
for hierarchical cluster analysis. Belmont, CA: Lifetime Learning Publications.
References
Romesburg, H.C. (1984). Cluster analysis for researchers. Belmont, CA: Lifetime LearningPublications.
Sneath, P.H.A., & Sokal, R.R. (1973). Numerical taxonomy. San Francisco, CA: W. H. Freeman
and Co.
CLUSTID (Assign New Objects to CLUSTAR Solution)
Abstract
CLUSTID assigns "new" objects of .nknown class membership into one of the classes (clusters)dproduced by the CLUSTAR hierarchical clustering program and assesses how well the objects fit in
their assigned clusters. CLUSTID initiates the classification process by producing an augmenteddata matrix consisting of the data matrix input to CLUSTAR augmented by as many columns of
, attribute data as there are *new* objects to be classified. CLUSTID then applies many of thesame subroutines as are used in CLUSTAR: CLUSTID uses the same standardization options tostandardize the augmented data matrix, the same similarity or dissimilarity coefficients totransform the unstandardized or standardized augmented data matrix into a likeness matrix, thesame weighting options to combine likeness matrices, and the same metric or binary linkage
criteria to compute the resemblance coefficient between each "new" object and each cluster
6

defined by the user from the output of CLUSTAR. The output of CLUSTID is a report which shows
(a) the. means, standard deviations, and ranges of data for each attribute by cluster and (b) the
identification of new objects into classes (clusters), together with a measure of their "fit."
(AFHRL/MOMM)
Program Documentation
Brown, R.H. CLUSTID. An AFHRL Sperry 1100 document processor report. Report retrieval
command: @DA*DA.ADOC CLUSTID
Romesburg, H.C., & Marshall, K. (1984). User's manual for CLUSTAR/CLUSTID: Computer programs
for hierarchical cluster analysis. Belmont, CA: Lifetime Learning Publications.
Reference
Romesburg, H.C. (1984). Cluster analysis for researchers. Belmont, CA: Lifetime Learning
Publications.
Sneath, P.H.A., & Sokal, R.R. (1973). Numerical taxonomy. San Francisco: W.H. Freeman and Co.
CORR (Compute and Print a Correlation Matrix)
Abstract
CORR computes and prints a correlation matrix, the minimum and maximum values, means, and
standard deviations for all variables. The generated report is similar to the output from theCORR link of TRICOR. There are options for record selection, using N or N-I in computing thestandard deviation, and performing operations in double precision. (AFHRL/TSOZP)
Program Documentation
O'Hara, S.A. STATISTICS, basic statistics programs. An AFHRL Sperry 1100 document processor
report. Report retrieval command: @Z*ZA.DOC STATISTICS
CROSS-CLAS (Cross-Classification)
Abstract
CROSS-CLAS produces cross-classifications (also called cross-tabulations or contingencytables) in two, three, or four dimensions. Row and column percentages and chi-square and
Kendall's tau values may be computed for all tables if desired. A maximum of 99 problems may beexecuted in one run. Each problem can produce up to 80 tables from a given set of control
cards and data. A given set of data may consist of a maximum of 99,999 observations, with nomore than 80 variables per observation. Several options are available for recoding the data.
(AFHRL/MOMM)
Program Documentation
Whitehead, L.K., & Koplyay, J.B. CROSS-CLAS. An AFHRL Sperry 1100 document processor report.
Report retrieval command: @DA*DA.DOC CROSS-CLAS
7
CTAB (Cross-Tabulation Report)
Abstract
CTAB creates cross-tabulation reports depicting multidimensional frequency distributions.
There are numerous options for controlling the format of the report and for producing statistical
information. CTAB can compute row, column, and total percentages, means and standard deviations,
average cell frequencies, median and mode of row values, and chi-square tests of independence.
The only limit is that an individual two-dimensional matrix must fit into core. (AFHRL/TSOZP)
Program Documentation
O'Hara, S.A. FREQUENCY, frequency distribution programs. An AFHRL Sperry 1100 document
processor report. Report retrieval command: @Z*ZA.DOC FREQUENCY
Reference
O'Hara, S.A. (1984). Frequency distribution system. Unpublished manuscript, Brooks AFB, TX:Manpower and Personnel Division, Air Force Human Resources Laboratory.
CURVE-FIT (Fourier-Pearson Curve Fitting)
Abstract
CURVE-FIT consists of two routines for fitting a continuous distribution to data. Theseroutines were developed by Chisman (1968a, 1968b) at Clemson University. One routine fits a
finite Fourier series to the sample points. The other routine fits each of the 12 Pearsondistribution types (plus the normal distribution) to a set of data. The Fourier routineaccomplishes Fourier curve fitting for up to 100 equally spaced points and will provide the userwith the following: the chi-square test for goodness of fit; various tables, including a table
of cumulative probabilities; an optional graph of the data points and the fitted curve; andappropriate diagnostic messages. The Pearson routine computes the parameters of each of 13Pearson statistical distribution types from the first four moments of the data, as described in
Elderton (1953). A chi-square test is provided to compare the fit of the various distributiontypes on a given set of data. A maximum of 100 input points is allowed, with the requirementthat they be equally spaced. (AFHRL/MOMM)
Program Documentation
Black, D.E., & Whitehead, L.K. CURVE-FIT. An AFHRL Sperry 1100 document processor report.Report retrieval command: @DA*DA.ADOC CURVE-FIT
References
Chisman, J. A. (1968a). An investigation into the use of Fourier analysis in statistical curvefitting. (Engineering ExperimentA1 Station Bulletin No. 112). Clemson, SC: Clemson University,
College of Engineering.
8
. . -- --%'v: .',..-. .... ~..
Chisman, J. A. (968b). The Pearson generalized statistical distribution (Engineering
Experimental Station Bulletin No. 111). Clemson,. SC: Clemson University, College of Engineering.
Elderton, W.P. (1953). Frequency curves and correlation. London: Harren Press.
EQUIP (Equipercentile Scoring Program)
Abstract
EQUIP performs linear and equipercentile equating of two tests or composites (Angoff, 1971).
The original program was obtained from St Mary's University, San Antonio, Texas, and has been
modified to include a jackknifing capability (Gray & Schucany, 1972). (AFHRL/MOMM)
Program Documentation
Soria, A. EQUIP. An AFHRL Sperry 1100 document processor report. Report retrieval command:
@DA*DA.ADOC EQUIP
References
Angoff, W. (1971). Scales, norms, and equivalent scores. In Thorndike (Ed.), Educational
Measurement (2nd ed.). Washington, DC: The American Council on Education.
Gray, H.L., & Schucany, W.R. (1972). The generalized jackknife statistic. New York: Marcel
Dekker, Inc.
FFPRT (Print a Frequency File)
Abstract
FFPRT prints frequency distributions from a mass storage frequency file created by ADIG.
Free format control cards provide information for the block heading page, report titles, and
selection of distributions from the frequency file. Automatic subtotaling is performed on
multiway distributions. Distribution headings are taken from the automated layout for the source
data file. (AFHRL/TSOZP)
Program Documentation
O'Hara, S.A. FREQUENCY, frequency distribution programs. An AFHRL Sperry 1100 document
processor report. Report retrieval command: @Z*ZA.DOC FREQUENCY
Reference
O'Hara, S.A. (1984). Frequency distribution system. Unpublished manuscript.
9

FPS (Functional Mathematical Programming System)
Abstract
FMPS is a mathematical programming system supplied by the Sperry Rand Corporation for use onthe Sperry 1100. The program provides many procedures commonly used to solve linear programmingproblems and has the capability to solve large problems. Additionally, the program has the
facility to produce user-designed optimization procedures through the use of a user-orientedcontrol language, which resembles the FORTRAN language. (AFHRL/MOMM)
Program Documentation
Sperry Systems Reference Library. (1975). Sperry Univac 1100 series functional mathematicalprograming system (FMPS) programmer reference. UP-8198, Sperry Rand Corporation.
Stefancyk, P.R., Richards, W.J., & Olden, D.J. FMPS. An AFHRL Sperry 1100 document processorreport. Report retrieval command: @DA*OA.DOC FMPS
GEN-HIER-GRP (Generate HIER-GRP Input Data)
Abstract
GEN-HIER-GRP generates HIER-GRP control cards and data using the information contained on aTRICOR regression output file. (AFHRL/MOMM)
Program Documentation
Whitehead, L.K. GEN-HIER-GRP. An AFHRL Sperry 1100 document processor report. Report retrievalcommand: @DA*DA.ADOC GEN-HIER-GRP
GUTTMAN (Guttman Item Analysis)
Abstract
GUTTMAN is an adaptation of an item analysis program obtained from Dr. Robert Bayuk of theResearch Office of the School District of Philadelphia. Guttman's technique is designed to beused with multiple-choice tests. This program uses a modified version of the Guttman weightingprocedure known as the Method of Reciprocal Averages (Baker & Ragsdale, 1964). This procedureemploys an interative approach in which predetermined (initial) weights for the item responsecategories are used as a scaling key to compute a total score for each subject. These scores andthe item response categories are then used to derive a new set of item option weights, which areemployed to compute total scores for each subject. This procedure may be repeated untilsuccessive sets of item option weights do not differ appreciably. The ultimate set of weightsmaximizes the internal consistency index of test reliability for the group of subjects on thatinstrument. Iterative output Includes the new item option weights, mean squares for error andsubject variance, Hoyt's Internal consistency coefficient, optional tables of the differencebetween sets of weights on successive iterations, and optional validity coefficients between theexternal and/or internal criterion and the iteration scores. (AFHRL/MOMM)
10
Program Documentation
Whitehead, L.K., & Ree, M.J. GUTTMAN. An AFHRL Sperry 1100 document processor report. Report
retrieval command: @DA*DA.DOC GUTTMAN
Reference
Baker F.B., & Ragsdale, R. (1964). The method of reciprocal averages for scaling of
inventories and questionnaires. Unpublished manuscript.
HIER-GRP (Regression Equation Grouping)
Abstract
HIER-GRP hierarchically groups a set of regression equations so as to minimize the overall
loss of predictive efficiency at each stage of clustering. The HIER-GRP program is described in
Gott (1978). The mathematical procedure on which the HIER-GRP program is based is described in
Bottenberg and Christal (1961). The HIER-GRP program has been used extensively for grouping
regression equations in which the predictor covariance matrix and predictor means are the same
for all equations being considered for grouping. This condition is 'alled the proportionality
assumption. This condition was satisfied in numerous Air Force applications of Judgment Analysis
(JAN) (Christal, 1963), such as the development of enlisted promotion systems (Black, 1973; Gott,1974). Recently, procedures have been proposed to extend the application of HIER-GRP, without
program modification, to grouping analyses in more general situations (Ward, Treat, & Albert,1984). HIER-GRP is limited to a maximum of 200 regression equations, with a maximum of 200
predictor variables per regression equation. The HIER-GRP methodology is also available on theIBM PC for problems having up to 50 regression equations and 100 predictor variables.
(AFHRL/MOMM)
Program Documentation2
Whitehead, L.K., & Gott, C.D. HIER-GRP. An AFHRL Sperry 1100 document processor report. Report
retrieval command: @DA*DA.ADOC HIER-GRP
References
Black, D.E. (1973, April). Development of the E-2 weighted airman promotion system
(AFHRL-TR-73-3, AD-767 195). Lackland AFB, TX: Personnel Research Division, Air Force Human
Resources Laboratory.
Bottenberg, R.A., & Christal, R.E. (1961, March). An iterative technique for clustering
criteria which retains optimum predictive efficiency (WADD-TN-61-30, AD-261 615). Lackland AFB,
TX: Personnel Laboratory, Wright Air Development Division.
Christal, R.E. (1963, February). JAN: A technique for analyzing group judgment (PRL-TDR-63-3,AD-403 813). Lackland AFB, TX: Personnel Research Laboratory, Aerospace Medical Division.
2A users guide is being prepared for the PC *tersion of HIER-GRP.
11
" " "~~ " " " "",.- ,* , **.. ..... . '- .

4II
Gott, C.D. (1974, March). Development of the weighted airman screening system for the Air
Reserve Forces (AFHRL-TR-74-18, AD-781 747). Lackland AFB, TX: Computational Sciences Division,
Air Force Human Resources Laboratory.
Gott, C.D. (1978, June). HIER-GRP: A computer program for the hierarchical grouping of
regression equations (AFHRL-TR-78-14, AD-A058 415). Brooks AFB, TX: Computational SciencesDivision, Air Force Human Resources Laboratory.
Ward, J.H., Treat, B.R., & Albert, W.G. (1984). General applications of hierarchical grouping
using the HIER-GRP program (AFHRL-TP-84-42, AD-A150 266). Brooks AFB, TX: Manpower and Personnel
Division, Air Force Human Resources Laboratory.
HIST (Histogram from Raw Data)
Abstract
HIST computes summary statistics from raw data and produces a histogram as a final report.
The statistics reported include total observations, total valid observations, total observationsout of range, total unique values, minimum and maximum values, mode, median, standard deviation,
skewness, and kurtosis. (AFHRL/TSOZM)
Program Documentation
Drews, H.K. STATISTICS, basic statistics programs. An AFHRL Sperry 1100 document processor
report. Report retrieval command: @Z*ZA.DOC STATISTICS
HITAB$ (Hit Tables for Dichotomous Criteria)
Abstract
HITAB; supplements the TRICOR correlation and regression program by computing binary
classification tables. The input files are TRICOR-predicted score files for thevalidation/cross-validation samples. If the cross-validation predicted scores file is used, the
4 program will apply the "cut score" established by the validation sample scores to the
cross-validation scores. (AFHRL/MOMM)
Program Documentation
Whitehead, L.K. HITAB$. An AFHRL Sperry 1100 document processor report. Report retrievalcommand: @DA*DA.ADOC HITABI
IAP (Item Analysis of Achievement Tests)
S
Abstract
IAP is an item analysis computer program for multiple-choice achievement tests with up to 200
items. IAP makes use of the item characteristic curve and its associated parameters: X50, theability level at which the item discriminates; and Beta, the discrimination index (Baker, 1965;
12

i i- - - -
Tucker, 1946). The analyses performed by IAP enable the user (a) to choose items which haveoptimum discrimination power at a certain ability level, (b) to screen a certain percentage of agroup of examinees, (c) to estimate the true score of an individual, and (d) to compute theprobability of a correct response. The criterion on which the program bases all the statisticalanalyses may be either the total test score, which will be corrected for guessing if desired, ora user-specified criterion. The test may be treated either as a power test, where the analysisof each Item is based on the total sample, or as a speed test, where only those individualsreaching a particular item will be considered in the analysis of that item. Options areavailable to correct for Item/test correlation overlap and for scoring items having more than onealternative designated as the correct answer. For each item alternative, the printed outputincludes: the proportion of subjects choosing the alternative; mean; standard deviation; and thebiserlal and point-biserial correlations with statistical tests of significance for the
biserial. Printed output also includes item difficulty, beta, XSO, phi coefficients (optional),identification of too easy or too difficult items (as specified by the user), and plots of theitem characteristic curves (optional). In addition, the user may request a factor analysis ofthe tetrachoric inter-item correlation matrix. (AFHRL/MOMM)
Program Documentation
Koplyay, J.B. (1981, October). Item analysis program (IAP) for achievement tests(AFHRL-TP-81-22, AD-AI07 884). Brooks AFB, TX: Manpower and Personnel Division, Air ForceHuman Resources Laboratory.
Koplyay, J.6., & Whitehead, L.K. IAP. An AFHRL Sperry 1100 document processor report. Reportretrieval command: @DA*DA.ADOC IAP
References
Baker, F.B. (1965). Origins of the item parameters X50 and beta as a modern item analysistechnique. Journal of Educational Measurement, 2, 167-178.
Tucker, L.R. (1946). Maximum validity of a test with equivalent items. Psychometrlka, 21, 1-13.
IAPG (Item Analys' of Questionnaires)
Abstract
IAPG is a versatile series of item analysis computer programs. The input consists ofresponses to items for which the correctness or incorrectness of a particular alternative is not
the same for all respondents. The comprehensive statistical/mathematical methodology thatcomprises IAPG enables the user to optimize the composite validity of a test instrument subjectto certain restrictions described in Albert and Whitehead (1980). To facilitate hand-scoring,the composite score Is computed using only unit (+l or -1) weights for each item. The data setof responses, which Is normally divided Into three subsamples, can contain a maximum of fivecriteria. The maximum number of alternatives allowed per Item is six, with values ranging fromone to six inclusive. A response for a k-alternative item, where the value of k may vary fromitem to item, is a set of k elements where a value of plus one is assigned to the selectedalternative and a value of zero is assigned to every other alternative. No more than onealternative can be selected for each item. If the number of alternatives for each item is lessthan six, an above-range response (the alternative selected has a value greater than six) and/or
omit response (no alternative was selected) can be considered as an additional alternative.(AFHRL/MOMM)
13
a .. . •... ..-...... .. ...- ,. •..- .. .i..'. ".,.-.. .-.. . -. ,'. . ",..-.'."-.-...-".%.T. ".."....,/'...4 %.V."....' .2-"." %".. ..-..'7€-, ., 'a ".",. ."." . .. .", %.',. aa,"..%' ," ,".'.- "'

Program Documentation
Albert, W.G., & Whitehead, L.K. (1980, August). IAPG: An item analysis program forquestionnaire-type test instruments (AFHRL-TR-80-5, AD-A089 814). Brooks AFB, TX: Manpower andPersonnel Division, Air Force Human Resources Laboratory.
Whitehead, L.K., & Albert, W.G. IAPG. An AFHRL Sperry 1100 document processor report. Reportretrieval command: @DA*DA.DOC IAPG
ZAPG-HITS (Hit Table for Dichotomous Criteria)
Abstract
IAPG-HITS supplements the IAPG methodology by computing binary classification tables tomeasure the predictive accuracy of the composite for dichotomous criteria. The input files arethe Item Selection Sequence File and the Keyed Item Response File generated by IAPG. Thecriterion may be either dichotomous or continuous; however, a continuous criterion will bedichotomized according to user specifications. The number of cases is limited to 2,000 persample, and the number of items must be 400 or less. (AFHRL/MOMM)
Program Documentation
Whitehead, L.K. IAPG-HITS. An AFHRL Sperry 1100 document processor report. Report retrievalcommand: @DA*DA.DOC IAPG-HITS
IREG (Interactive Regression System for Small Problems)
Abstract
IREG is an interactive regression computer package designed to be used on small problems.IREG computes means, standard deviations, and a correlation file for use in the stepwiseregression segment. Using a weight file produced in the regression segment and the raw datafile, the program can generate binary classification tables and cumulative frequencies foruser-selected categorical variables. IREG Is limited to a maximum of 30 variables and a maximumof 1,000 cases if binary classification tables are requested and 500 cases if tables ofcumulative frequency counts are requested. Only SDF mass storage files can be used to inputdata. (AFHRL/MOMM)
Program Documentation
Whitehead, L.K., & Ree, M.J. IREG. An AFHRL Sperry 1100 document processor report. Reportretrieval command: @DA*DA.DOC IREG
LGP (Linear Goal Programing)
Abstract
LGP was obtained from Dr. James P. Ignizio of the Pennsylvania State University. It willsolve linear goal programming models (continuous variables only) by using a multiphase pivoting
14
1 -m _t

algorithm (Ignlzio, 1982). Specifically, LGP allows the user to investigate conventional
(single-objective) linear programming models, priori tized multiobjective models, weightedmultiobjective models, fuzzy multiobjective models, and constrained regression models.Videotapes are available of a seminar conducted by Dr. Ignizio concerning formulation of themultiple-objective model, methods of solution, available software, and areas where the techniquehas been successfully applied. The program has the capability to solve multiple models in onerun and to perform sensitivity analyses. LGP will handle problems with a maximum of 10 prioritylevels, 100 decision variables, and 100 rows (i. e., goals and rigid constraints). (AFHRL/MOMM)
Reference
Ignizio, J. P. (1982). Linear programming in single- and multiple-objective systems. Englewood
Cliffs, NJ: Prentice-Hall, Inc.
MANOVA (Multivariate Analysis of Variance)
Abstract
MANOVA is composed of two programs, BMDX69X and X69HT, which together will solve a variety ofmultivariate analysis of variance and covariance problems. BMDX69X, which is a modification ofthe BMD program BMDX69 (Dixon, 1970), performs Model 1 multivariate analysis of variance orcovariance for any hierarchical design with equal cell sizes. This includes nested, partiallynested and crossed, and fully crossed designs. The design is specified by indicating the nestingrelationships of the indices. Several analyses may be performed for each problem by specifyingdifferent dependent variables or covariates. X69HT reads the covariance matrices file generatedby BMDX69X and computes a new multivariate analysis of variance with an error matrix generatedfrom specified error components. Univariate tests may be performed for each dependent variable.The MANOVA packages are limited to 10 analysis of variance indices (factors) and 40 dependentvariables. (AFHRL/MO4J)
Program Documentation
Whitehead, L.K., & Albert, W.G. MANOVA. An AFHRL Sperry 1100 document processor report. Report* retrieval command: @DA*DA.DOC MANOVA
Reference
Dixon, W.J. (Ed.) (1970). BMD biomedical computer programs X-series supplement. Berkeley, CA:University of California Press.
MAPCLUS (Me matical Programing Clustering)
Abstract
MAPCLUS is an additive, nonhierarchical clustering program which utilizes interstimulusproximities as combinations of discrete overlapping properties (Arabie & Carroll, 1980). Analternating least squares method is combined with a mathematical programming optimizationprocedure based on a penalty function approach to impose discrete (0,I) constraints on parametersdefining cluster membership. This representation consists of a set of m (possibly overlapping)subsets or clusters, each having an associated numerical weight, w(k), where k 1 1, ... m. For
15

any pair of stimuli, the predicted similarity is simply the sum of the weights of those subsets
containing the given pair of stimuli. This procedure is supplemented by several other numericaltechniques (notably a heuristically based combinatorial optimization procedure) to provide anefficient, general-purpose, computer-based algorithm for obtaining additive clusteringrepresentations. Because a satisfactory solution is often not found when the number of stimuli
exceeds 30, this program is limited to a maximum of 30 stimuli. (AFHRL/MOMM)
Reference
Arabie, P., & Carroll, D.J. (1980, July). How to use MAPCLUS, a computer program for fitting
the ADCLUS model. Murray Hill, NJ: Bell Laboratories.
MAX-FACTOR (Factor Analysis)
Abstract
MAX-FACTOR is a factor analysis program for problems having up to 400 variables. The powermethod is used to compute the factors one at a time in descending order according to thepercentage of the total variance each factor explains. This feature enables the user to computeonly as many factors as are required. The input consists of the upper triangular portion of acorrelation matrix. The diagonal entries may be ones, in which case a principal components
analysis is performed; or the diagonal entries may be user-specified estimates of thecommunalities (such as the largest correlation in each row of the matrix, or the squared multiplecorrelation obtained from the regression of each variable on the remaining variables); or thediagonal entries may te read from a file. The user may request that the program be usedIteratively to improve initial estimates of the communalities. The factor loadings can be savedfor subsequent use. Any subset of the factors may be rotated to a simple structure form usingthe varimax criterion. If desired, the factor loadings can be sorted according to absolutevalue. (AFHRL/MOMM)
Program Documentation
Whitehead, L.K. MAX-FACTOR. An AFHRL Sperry 1100 document processor report. Report retrieval
command: @DA*DA.ADOC MAX-FACTOR
MEANSD (Mean and Standard Deviation from a Frequency File)
Abstract
MEANSD calculates the mean and standard deviation of a variable for subgroups within levelsof a second variable. All calculations are performed in double-precision arithmetic. The inputis a frequency file. MEANSD does not produce a printed report. It creates a file containing thefollowing information: total observations, total valid observations, total invalid observations,total observations out of range, total unique values, minimum and maximum values, mode, median,mean, variance, standard deviation, skewness, and kurtosis. The output file may be reported bystandard report writing programs such as RPT or MSDRPT. (AFHRL/TSOZM)
Program Documentation
Drew, H.K. STATISTICS, basic statistics programs. An AFHRL Sperry 1100 document processorreport. Report retrieval command: @Z*ZA.DOC STATISTICS
16
1

MF* (MAX-FACTOR Score Generator)
Abstract
Using raw data and factor loadings (original or rotated) from a MAX-FACTOR file, MF$ computesfactor scores (Harman, 1968). The factor scores may be output on a file and/or printed. Theprogram is limited to a maximum of 400 variables and 200 factors. (AFHRL/MOMM)
Program Documentation
Whitehead, L.K. MF$. An AFHRL Sperry 1100 document processor report. Report retrievalcomand: @DA*DA.ADOC MF$
Reference
Harman, H.H. (1968). Modern factor analysis. Chicago, IL: University of Chicago Press.
MSORPT (Print MEANSO Output)
Abstract
MSORPT produces a listing of the output records from MEANSD containing the following
information: distril,)tion identifier, major field value, total valid observations, total invalid
observations, minimum and maximum values, mode, median, mean, and standard deviation.(AFHRL/TSOZM)
Program Documentation
Orews, H.K. STATISTICS, basic statistics programs. An AFHRL Sperry 1100 document processorreport. Report retrieval command: @Z*ZA.DOC STATISTICS
MULT-OISCR (Multiple Discrimilnant Analysis)
Abstract
MULT-DISCR is a major modification of DISCRM (Veldman, 1967). The program has an option tocompute the amount of core required for a particular multiple discriminant analysis problem sothe user may determine whether the problem may be run. Output from the program includes:discriminant functions and tests of significance; group and total sample means, standarddeviations, and correlation matrices for the original variables; correlations between theoriginal variables and the discriminant functions; means of the scores within each group(centroids); and probabilities that individuals belong to each of the groups. For each group, atable is printed showing how the probabilities are distributed within that group. (AFHRL/MOMM)
Program Documentation
Whitehead, L.K. MULT-DISCR. An AFHRL Sperry 1100 document processor report. Report retrievalcommand: @DA*DA.ADOC MULT-DIScR
17

Reference
Veldman, D.J. (1967). FORTRAN programming for the behavioral sciences. New York: Holt,
Rinehart and Winston.
MULTIVARIANCE (Multivariate Analysis of Variance)
Abstract
MULTIVARIANCE, a program purchased from National Educational Resources, Inc., can perform
univariate and multivariate linear estimation and tests of hypotheses for any crossed and/ornested design where the number of observations in the subclasses may be unequal (some subclasses
may be empty). The program computes an exact least squares solution using the method described
by Bock (1963). The program will accept data in the following formats: (a) raw unsorted data,
each observation with its own cell identification number; (b) raw data sorted by cells; (c)within group variance-covariance matrix and mean-frequency summary data; (d) raw unsorted data to
be read from an independently prepared binary tape; (e) raw data grouped by subclasses to be read
from an independently prepared binary tape; and (f) within group correlation matrix and mean
frequency summary data. The user has access to many common data transformations. The user canprovide a matrix transformation to obtain linear combinations of the original variates. At the
user's option, the transformation matrix can be orthonormalized. The estimation and analysisfunctions of the program are based entirely on the specification of single degree-of-freedom
planned contrasts. MULTIVARIANCE provides a solution for the model of deficient rank by having
the user determine linear combinations of the group membership effects which are of interest.
Multiple runs are necessary for testing all effects in a model where more than one error term isneeded. The user may repeatedly select subsets of variables and covariates from the input data
• set and perform the appropriate analyses. (AFHRL/MOMM)
Program Documentation
Finn, J. D. (1978, October). MULTIVARIANCE: Univariate and multivariate analysis of variance,
covariance, regression, and repeated measures - users guide (Version II, Release 2.
International Standard Book No. 0-89498-003-3). Chicago, IL: International Education Services.
Reference
Bock, R.D. (1963). Programing univariate and multivariate analysis of variance.
Technometrics, 5, 95-117.
MULTI-PROB (Multivariate Normal Probability)
Abstract
MULTI-PROB computes multivariate normal probabilities for up to five jointly distributednormal variables, each having a mean of zero and a variance of one. A complete description of
the methodology is provided by Koplyay and Whitehead (1978). (AFHRL/MOMM)
18
Program Documentation
Whitehead, L.K. MULTI-PROB. An AFHRL Sperry 1100 document processor report. Report retrieval
command: @DA*DA.DOC MULTI-PROB
Reference
Koplyay, J.K., & Whitehead, L.K. (1978). Proportions in multivariate normal distributions.
Unpublished manuscript. Brooks AFB, TX: Manpower and Personnel Division, Air Force Human
Resources Laboratory.
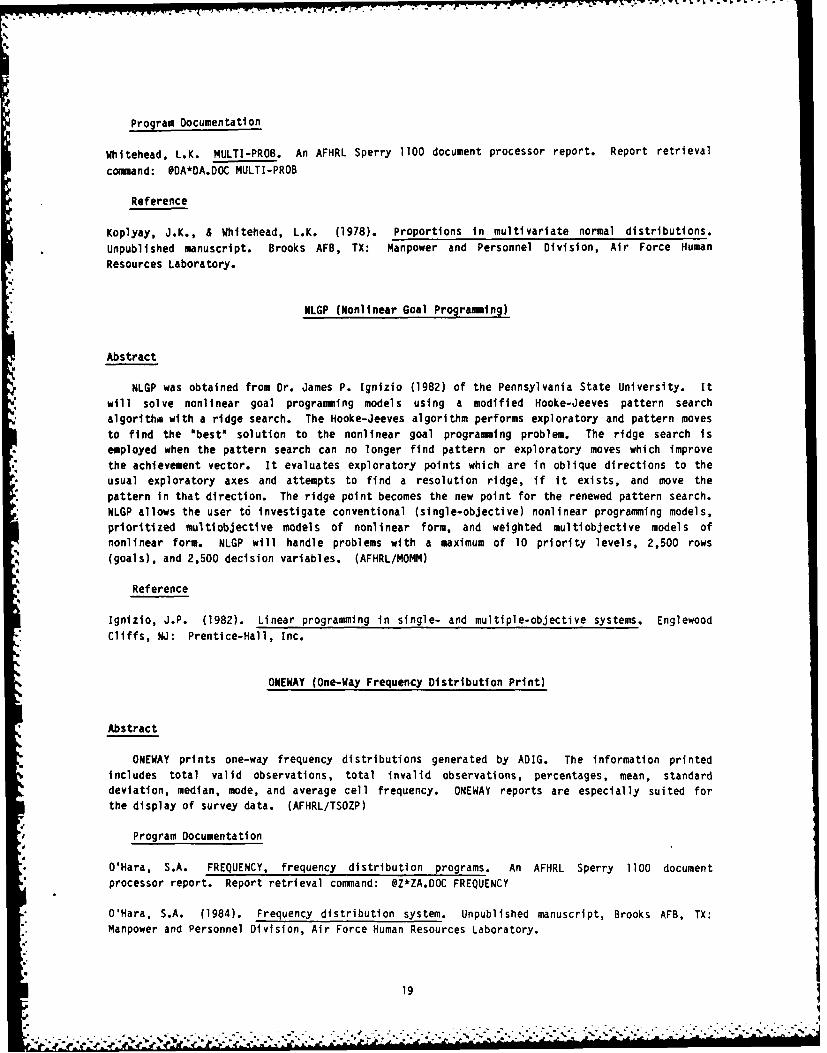
NLGP (Nonlinear Goal Programming)
Abstract
NLGP was obtained from Dr. James P. Ignizio (1982) of the Pennsylvania State University. It
will solve nonlinear goal programming models using a modified Hooke-Jeeves pattern search
algorithm with a ridge search. The Hooke-Jeeves algorithm performs exploratory and pattern moves
to find the "best" solution to the nonlinear goal programing problem. The ridge search is
employed when the pattern search can no longer find pattern or exploratory moves which improvethe achievement vector. It evaluates exploratory points which are in oblique directions to theusual exploratory axes and attempts to find a resolution ridge, if it exists, and move thepattern in that direction. The ridge point becomes the new point for the renewed pattern search.NLGP allows the user t6 investigate conventional (single-objective) nonlinear programming models,prioritized multiobjective models of nonlinear form, and weighted multiobjective models ofnonlinear form. NLGP will handle problems with a maximum of 10 priority levels, 2,500 rows
(goals), and 2,500 decision variables. (AFHRL/MOMM)
Reference
Ignizio, J.P. (1982). Linear programming in single- and multiple-objective systems. Englewood
Cliffs, NJ: Prentice-Hall, Inc.
ONEWAY (One-Way Frequency Distribution Print)
Abstract
ONEWAY prints one-way frequency distributions generated by ADIG. The information printedincludes total valid observations, total invalid observations, percentages, mean, standard
deviation, median, mode, and average cell frequency. ONEWAY reports are especially suited for
the display of survey data. (AFHRL/TSOZP)
Program Documentation
O'Hara, S.A. FREQUENCY, frequency distribution programs. An AFHRL Sperry 1100 document
processor report. Report retrieval command: @Z*ZA.DOC FREQUENCY
SO'Hara, S.A. (1984). Frequency distribution system. Unpublished manuscript, Brooks AFB, TX:
Manpower and Personnel Division, Air Force Human Resources Laboratory.
91 !19
*. . P .. * . . . . .

m - - 4 .: '-. . °. ..- . .. ..
POLCAP (Policy Capturing)
Abstract
POLCAP simplifies the task of generating and gathering data In policy-capturing exercises
conducted at AFHRL. POLCAP generates a random data sample from a truncated multivariate normal
distribution with user-specified population parameters; displays profile data; collects the
rankings of the policy judges; and computes a regression equation for each judge on each deck,
and a hierarchical grouping analysis for each deck. POLCAP is limited to a maximum of 18
variables, 200 observations, 105 judges, and 30 decks. (AFHRL/MOMM)
Program Documentation
Whitehead, L.K. POLCAP. An AFHRL Sperry 1100 document processor report. Report retrieval
command: @DA*DA.DOC POLCAP
POLSPEC (Policy-Specifying Programs)
Abstract
Policy specifying is a decision theory methodology that was developed at AFHRL. The
technique consists of the following steps: (a) identify the concept of interest and the
variables *that will be used to describe it, (b) select experts who will specify their policy in
mathematical form, (c) define a pairwise hierarchy of the variables, and (d) specify the pairwise
models. The POLSPEC programs accomplish steps (c) and (d) and are described in Ward (1977),
which covers the two program packages POLSPC and PAYOFF. POLSPC will allow the user to create or
modify a file that contains parameters for policy functions and to print tables of payoff values
for these functions. Each policy function depends on two arguments (variables and/or
functions). Multivariate functions are defined by building a chain of bivariate functions.
Given the function parameters, PAYOFF will compute payoff (functional) values from the actual
variables in a data file. The POLSPEC methodology is also available on the IBM PC. All programs
will accommodate up to 50 functions and 50 variables. (AFHRL/MOMM)
Program Documentation3
Pina, M., Whitehead, L.K., & Ward, J.H. POLSPEC. An AFHRL Sperry 1100 document processor
report, Report retrieval command: @DA*DA.ADOC POLSPEC
* Reference
Ward, J.H. (1977, August). Creating mathematical models of judgment processes: From
policy-capturing to policy-specifying (AFHRL-TR-77-47, AD-A048 983). Brooks AFB, TX: Occupation
and Manpower Research Division, Air Force Human Resources Laboratory.
'p."I,
3A users manual Is. being prepared for the PC version of POLSPEC.
24.
20
m ~ o . .,. . .. . . ,.. .. .. .. . . . . . . . . .. . . . -.. . ... .. . . ...,.* .. ; . . . . . .? . : .

QCORR (Quick Correlation)
Abstract
QCORR displays a correlation matrix on the terminal and can store it in double precision.The program is limited to a maximum of 14 variables. (AFHRL/TSOZP)
Program Documentation
O'Hara, S.A. STATISTICS, basic statistics programs. An AFHRL Sperry 1100 document processor
report. Report retrieval command: @Z*ZA.DOC STATISTICS
QSTAT (Quick Statistics)
Abstract-I
QSTAT computes the following information in double precision on a single variable in a rawdata file and displays it on the terminal: total observations, total valid observations, totalinvalid observations, total observations out of range, total unique values, minimum and maximumvalues, mode, median, mean, variance, standard deviation, skewness, and kurtosis. A histogramcan also be displayed. (AFHRL/TSOZP)
Program Documentation
O'Hara, SoA. STATISTICS, basic statistics programs. An AFHRL Sperry 1100 document processorreport. Report retrieval command: @Z*ZA.DOC STATISTICS
RANGEX (Correct Correlations for Curtailment of Range)
Abstract
RANGEX, a significant modification of RANGE (Mifflin & Verna, 1977), estimates the* correlations of variables in a large, diverse population from correlations obtained from a
smaller, more restricted population in which the ranges of the variables have been restricted.
The program accepts data from either cards or TRICOR files. Corrected correlation matrix outputis printed and may be written as a TRICOR file. RANGEX has limits of 50 variables in the
% unrestricted population, 55 variables in the restricted population, and up to 50 variables%C difference between the two. Only linearly independent variables can be in the set of directly
curtailed variables. (AFHRL/MOMM)
Program Documentation
Whitehead, L.K. RANGEX. An AFHRL Sperry 1100 document processor report. Report retrieval
-, command: @DA*DA.ADOC RANGEX
21
F

Reference
Mifflin, T.L., & Verna, S.M. (1977, August). A method to correct correlation coefficients forthe effects of multiple curtailment (CRC-336). Arlington, VA: Center for Naval Analyses.(Prepared for the Office of Naval Research, Department of the Navy).
RUI4MAGE II (Analysis of Linear Models)
Abstract
RUMMAGE II performs many types of analyses where the relationship among the variables is
defined by a linear model (Bryce, 1982). The linear model may be expressed by a regressionmodel, an analysis of variance model, or an analysis of covariance model. The design may bebalanced or unbalanced. The factors may be either fixed or random and either crossed or nested.RUMMAGE II also possesses extensive residual plotting capabilities. (OTFS)
Reference
Bryce, G.R. (1982, November). Data analysis In RUM4AGE - A users guide. Provo, UT: AppliedStatistics Group, Department of Statistics, Brigham Young University.
SLAM II (Simulation Language for Alternative Modeling)
Abstract
SLAM II is a FORTRAN-based, general-purpose simulation language. It permits discrete event,continuous and network modeling perspectives, or any combination of the three, to be used indeveloping simulation models (Pritsker & Pegden, 1979). (AFHRL/MOMD)
Reference
Prltsker, A.A.B., & Pegden, C.D. (1979). Introduction to simulation and SLAM. New York: JohnWiley and Sons.
STAT (Summary Statistics from Raw Data)
Abstract
STAT computes the following summary statistics from raw data: total observations, totalvalid observations, total invalid observations, total observations out of range, total uniquevalues, minimum and maximum values, mode, median, mean, variance, standard deviation, skewness,and kurtosis. A histogram can also be printed. (AFHRL/TSOZM)
Program Documentation
Drews, H.K. STATISTICS, basic statistics programs. An AFHRL Sperry 1100 document processorreport. Report retrieval command: @Z*ZA.DOC STATISTICS
22
...-.

TRICOR (Correlation and Regression Package)
APstract
TRICOR is a large modular program that performs a variety of statistical analysis proceduresfrom a standard COBOL input file. TRICOR can edit a raw data file, generate and/or deletevariables, compute a correlation matrix, perform stepwlse regression with residual analysis(Albert, Koplyay, & Whitehead, 1982), compute F statistics for full versus restricted modeltests, and compute predicted scores. The program is limited to a maximum of 400 variables.(AFHRL/TSOZ)
Program Documentation
Buchhorn, J. TRICOR. An AFHRL Sperry 1100 document processor report. Report retrievalcommand: @Z*ZA.DOC TRICOR
Reference
Albert, W.G., Koplyay, J.B., & Whitehead, L.K. (1982, February). REGRX: A computerized stepwiseregression algorithm with residual analysis (AFHRL-TP-82-46, AD-AIZ3 987). Brooks AFB, TX:Manpower and Personnel Division, Air Force Human Resources Laboratory.
TSP (Time Series Processor)
Abstract
TSP, a computer program for econometric analysis of time series data, was developed by TSPInternational, Stanford, California (Hall & Hall, 1981). The package provides the followingeconometric techniques: ordinary least squares, two-stage least squares, three-stage leastsquares, least squares with autoregressive correction, weighted least squares, nonlinear leastsquares, and full information maximum likelihood. (AFHRL/MOMD)
Reference
Hall, B.H., & Hall, R.E. (1981). Time series processor, Version 3.5 - users manual. Stanford,CA: TSP International.
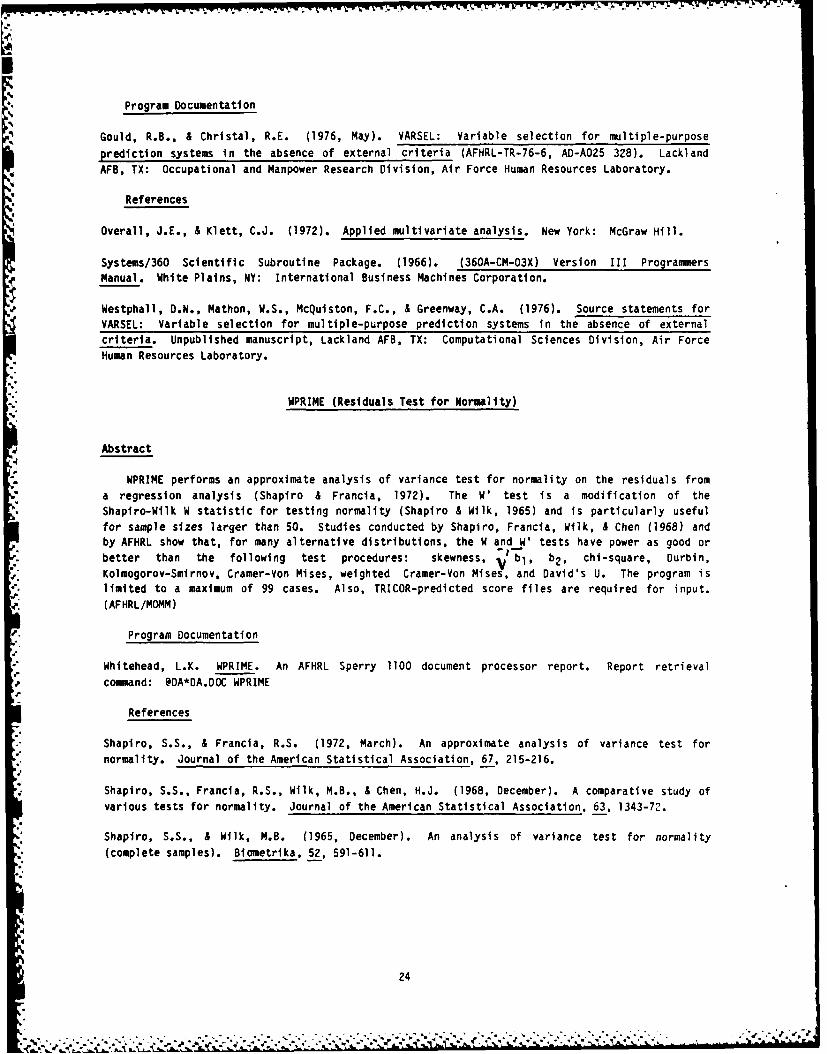
VARSEL (Variable Selection Without an External Criterion)
Abstract
VARSEL is a variable selection algorithm for use when no external criteria are present(Westphall, Mathon, McQuiston, & Greenway, 1976). Using multiple linear regression, thealgorithm starts with a single item or set of items and itetatlvely selects items whichcontribute the greatest amount of unique variance to the prediction system. The selection systemwas designed to take into account item reliabilities when they are available. Cholesky's routine(Overall & Klett, 1972; Systems/360, 1966) is used to compute the coefficient of multipledetermination. VARSEL Is limited to a maximum of 400 variables. (AFHRL/MOMM)
23
<:~%% ," ,-
Program Documentation
Gould, R.B., & Christal, R.E. (1976, May). VARSEL: Variable selection for multiple-purpose
prediction systems in the absence of external criteria (AFHRL-TR-76-6, AD-A025 328). Lackland
AFB, TX: Occupational and Manpower Research Division, Air Force Human Resources Laboratory.
References
Overall, J.E., & Klett, C.J. (1972). Applied multivariate analysis. New York: McGraw Hill.
Systems/360 Scientific Subroutine Package. (1966). (360A-CM-03X) Version III ProgrammersManual. White Plains, NY: International Business Machines Corporation.
Westphal], D.N., Mathon, W.S., McQuiston, F.C., & Greenway, C.A. (1976). Source statements for
VARSEL: Variable selection for multiple-purpose prediction systems in the absence of externalcriteria. Unpublished manuscript, Lackland AFB, TX: Computational Sciences Division, Air Force
Human Resources Laboratory.
WPRIME (Residuals Test for Normality)
Abstract
WPRIME performs an approximate analysis of variance test for normality on the residuals from
a regression analysis (Shapiro & Francia, 1972). The W' test is a modification of theShapiro-Wilk W statistic for testing normality (Shapiro & Wilk, 1965) and Is particularly useful
for sample sizes larger than 50. Studies conducted by Shapiro, Francia, Wilk, & Chen (1968) andby AFHRL show that, for many alternative distributions, the W and W' tests have power as good or
. better than the following test procedures: skewness, I bl, b2 , chi-square, Durbin,Kolmogorov-Smirnov, Cramer-Von Mises, weighted Cramer-Von Mises, and David's U. The program islimited to a maximum of 99 cases. Also, TRICOR-predicted score files are required for input.
(AFHRL/MOMM)
Program Documentation
Whitehead, L.K. WPRIME. An AFHRL Sperry 1100 document processor report. Report retrieval
command: @DA*DA.DOC WPRIME
References
. Shapiro, S.S., & Francla, R.S. (1972, March). An approximate analysis of variance test for
" normality. Journal of the American Statistical Association, 67, 215-216.
Shapiro, S.S., Francia, R.S., Wilk, M.B., & Chen, H.J. (1968, December). A comparative study of
various tests for normality. Journal of the American Statistical Association, 63, 1343-72.
Shapiro, S.S., & Wilk, M.B. (1965, December). An analysis of variance test for normality
(complete samples). Biometrika, 52, 591-611.
24
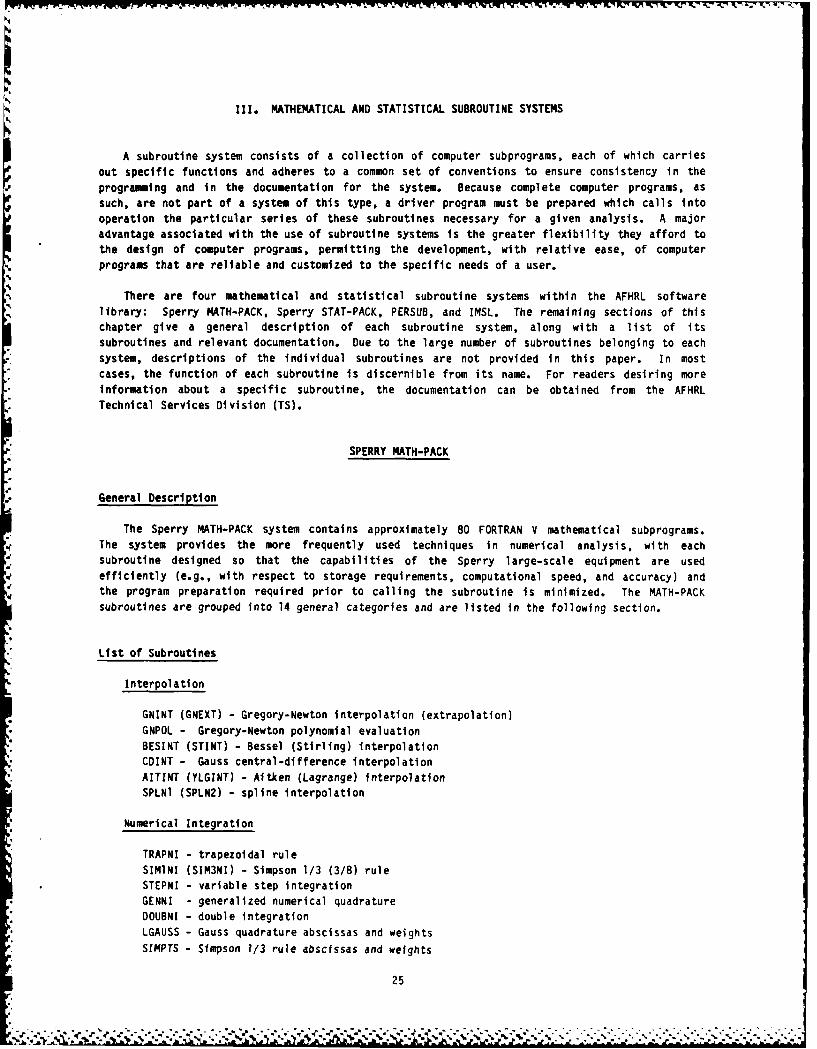
III. MATHEMATICAL AND STATISTICAL SUBROUTINE SYSTEMS
A subroutine system consists of a collection of computer subprograms, each of which carriesout specific functions and adheres to a common set of conventions to ensure consistency in theprograming and in the documentation for the system. Because complete computer programs, assuch, are not part of a system of this type, a driver program must be prepared which calls intooperation the particular series of these subroutines necessary for a given analysis. A majoradvantage associated with the use of subroutine systems is the greater flexibility they afford tothe design of computer programs, permitting the development, with relative ease, of computerprograms that are reliable and customized to the specific needs of a user.
There are four mathematical and statistical subroutine systems within the AFHRL softwarelibrary: Sperry MATH-PACK, Sperry STAT-PACK, PERSUB, and IMSL. The remaining sections of thischapter give a general description of each subroutine system, along with a list of itssubroutines and relevant documentation., Due to the large number of subroutines belonging to eachsystem, descriptions of the individual subroutines are not provided in this paper. In mostcases, the function of each subroutine is discernible from its name. For readers desiring moreinformation about a specific subroutine, the documentation can be obtained from the AFHRLTechnical Services Division (TS).
SPERRY MATH-PACK
General Description
The Sperry MATH-PACK system contains approximately 80 FORTRAN V mathematical subprograms.The system provides the more frequently used techniques in numerical analysis, with eachsubroutine designed so that the capabilities of the Sperry large-scale equipment are usedefficiently (e.g., with respect to storage requirements, computational speed, and accuracy) andthe program preparation required prior to calling the subroutine is minimized. The MATH-PACKsubroutines are grouped into 14 general categories and are listed in the following section.
List of Subroutines
Interpolation
GNINT (GNEXT) - Gregory-Newton interpolation (extrapolation)
GNPOL - Gregory-Newton polynomial evaluationBESINT (STINT) - Bessel (Stirling) interpolationCDINT - Gauss central-difference interpolationAITINT (YLGINT) - Aitken (Lagrange) interpolation
SPLNI (SPLN2) - spline interpolation
Numerical Integration
TRAPNI - trapezoidal rule
SIMINI (SIM3NI) - Simpson 1/3 (3/8) ruleSTEPNI - variable step integration
GENNI - generalized numerical quadratureDOUBNI - double integrationLGAUSS - Gauss quadrature abscissas and weightsSIMPTS - Simpson 1/3 rule abscissas and weights
25

aVVP Y47 , VV -7 -w %i ---
Solution of Equations
NEWTIT - Newton-Raphson iteration
WEGIT (AITIT) - Wegstein (Altken) iterationROOTCP - real and complex roots of a real or complex polynomial
Differentiation
DERIVI (DERIV2) - first (second) derivative approximation
NTHDER - nth derivative of a polynomial
Polynomial Manipulation
GIVZRS - polynomial coefficients given its zerosCVALUE - complex polynomial evaluationPOLYX (CPOLYX) - real (complex) polynomial multiplication
Matrix Manipulation: Real Matrices
MXADD (MXSUB) - matrix addition (subtraction)MXTRN - matrix transpositionMXI'LT (MXSCA) - matrix multiplication (by a scalar)
MXMDIG - matrix multiplication by diagonal matrix stored as a vectorGJR - determinant; inverse; solution of simultaneous equationsMXHOI - inverse accuracy improvement
Matrix Manipulation: Complex Matrices
CMXADD (CMXSUB) - matrix addition (subtraction)
CMXTRN - matrix transpositionCMXMLT (CMXSCA) - matrix multiplication (by a scalar)
CGJR - determinant; inverse; solution of simultaneous equations
Matrix Manipulation: Elgenvalues and Eigenvectors
TRIDMX - tridiagonalization of real symmetric matrixEIGVAL - elgenvalues of tridiagonal matrix by Sturm sequencesEIGVEC - elgenvectors of tridiagonal matrix by Wilkinson's method
Matrix Manipulation: Miscellaneous
DGJR - double-precision determinant; inverse; solution of simultaneous equationsPMXTRI (SCALE) - polynomial matrix triangularization (scaling)
MXROT - matrix rotation
Ordinary Differential Equations
EULDE (HAMDE) - Euler's (Hamming's) method
INVAL - initial values for differential equation solutionRKDE - Runge-Kutta methodSOOE - second-order equationsMRKDE - reduction of mth order system to system of m first-order equations
26
.

Systems of Equations
HJACMX (JACMX) - Jacobi iteration to determine eigenvalues and eigenvectors of Hermitian
(symmetric) matrix
LSIMEQ - solution to a set of linear simultaneous equations
NSIMEQ - functional iteration to determine solution to set of nonlinear equations
Curve Fitting
CFSRIE (DFSRIE) - coefficients of Fourier series on a continuous (discrete) range
FTRANS - Fourier transform
FITO - fitted value and derivative values for a least-squares polynomial
ORTHLS - orthogonal polynomial least-squares curve fitting
FITY - fitted values for a least-squares polynomial
COEFS - coefficients of a least-squares polynomial
Pseudo Random Number Generators
NRAND - interval (0,2**35) generatorMRAND - modified generator
RANOU - uniform distributionRANDN (RANOEX) - iormal (exponential) distribution
Specific Functions
BSSL - zero- and first-order Bessel functionsBESJ (BESY) - regular (irregular) Bessel functions of real argument
BESI (BESK) - regular (irregular) Bessel functions of imaginary argumentGAMMA - gamma function evaluation
LEGEN - Legendre polynomial evaluationARCTNQ - arctangent of a quotient
Documentation References
UNIVAC Systems Reference Library. (1970). UNIVAC large scale systems MATH-PACK programabstracts (UP-4051, rev. 2). Sperry Rand Corporation.
UNIVAC Systems Reference Library. (1970). UNIVAC large scale systems MATH-PACK programmersreference (UP-7542, rev. 1). Sperry Rand Corporation.
SPERRY STAT-PACK
General Description
The Sperry STAT-PACK system is comprised of 91 FORTRAN V statistical subprograms covering awide variety of statistical techniques. Like the subprograms in the Sperry MATH-PACK system, the
STAT-PACK subroutines are designed to reduce the program preparation required prior to calling a
subprogram and to use the capabilities of the Sperry equipment efficiently with respect tocomputational speed, accuracy, and storage requirements. The STAT-PACK subroutines are groupedinto 13 general statistical categories and are listed in the following section.
27
! - -.' ' - -k, . , , , , , .:.. ;.. , ,; , , ".:...,,-., ,. ,.', " ", ,-" -, .. .,..... -..,.. , . .o
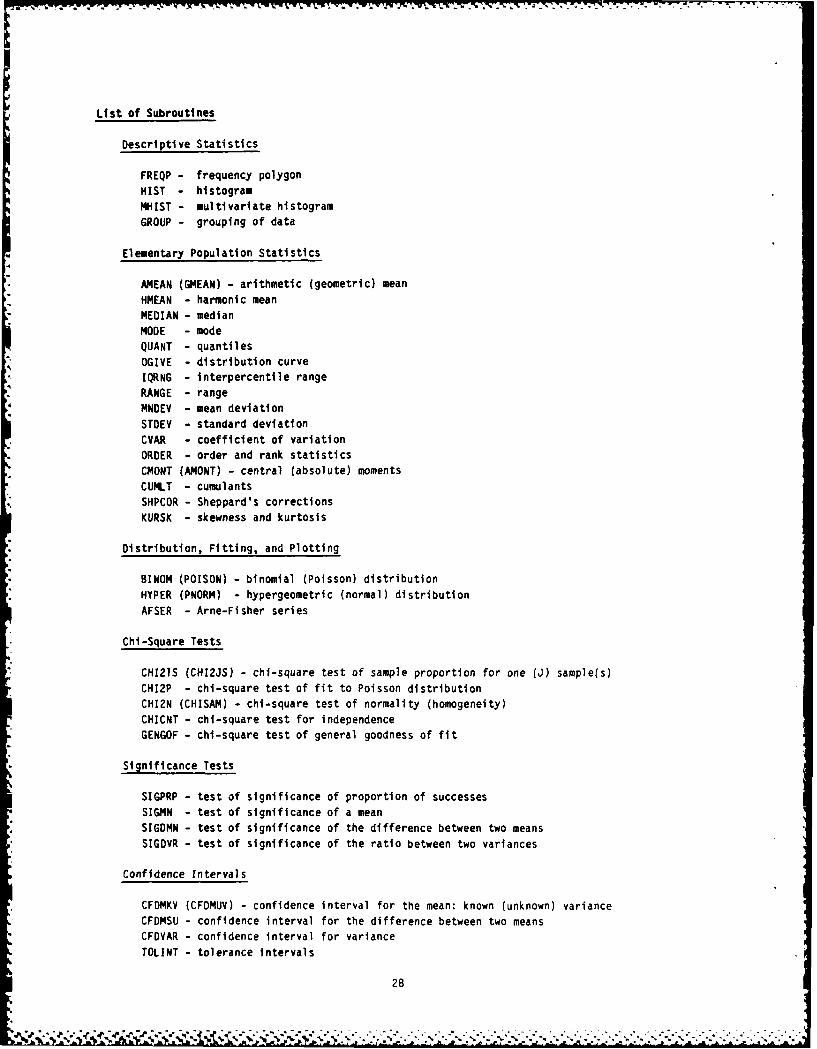
W° 17° - ._7 , ,
List of Subroutines
Descriptive Statistics
FREQP - frequency polygon
HIST - histogram
MHIST - multivariate histogram
GROUP - grouping of data
Elementary Population Statistics
AMEAN (GMEAN) - arithmetic (geometric) mean
HMEAN - harmonic mean
MEDIAN - medianMODE - modeQUANT - quantiles
OGIVE - distribution curve
IQRNG - interpercentile range
RANGE - range
MNDEV - mean deviationSTDEV - standard deviation
CVAR - coefficient of variationORDER - order and rank statisticsCMONT (AMONT) - central (absolute) moments
CUMLT - cumulantsSHPCOR - Sheppard's corrections
KURSK - skewness and kurtosis
Distribution, Fitting, and Plotting
BINOM (POISON) - binomial (Poisson) distributionHYPER (PNORM) - hypergeometric (normal) distribution
AFSER - Arne-Fisher series
Chi-Square Tests
CHI21S (CHI2JS) - chi-square test of sample proportion for one (J) sample(s)
CHI2P - chi-square test of fit to Poisson distributionCHI2N (CHISAM) - chi-square test of normality (homogeneity)
CHICNT - chi-square test for independence
GENGOF - chi-square test of general goodness of fit
Significance Tests
SIGPRP - test of significance of proportion of successes
SIGMN - test of significance of a meanSIGDMN - test of significance of the difference between two means
SIGDVR - test of significance of the ratio between two variances
Confidence Intervals
CFDMKV (CFDMUV) - confidence interval for the mean: known (unknown) variance
CFDMSU - confidence interval for the difference between two meansCFDVAR - confidence interval for variance
TOLINT - tolerance intervals
28
" " '. ' .' " ' '''' ' " " '''" '-'' " ' ." -. ' - ' °
. -"
"". ' '
- -" " --
-" .'-'' . ' : . , '' -

-07 7- 07 .
Analysis of Variance
ANOVI/ANOV2/ANOV3 - one-way/two-way/three-way cross-classification
MISDAT - missing dataVTRANS - variable transformations
ANOVRB - randomized blocksANOVLS - Latin squares
ANOVSP - split-plot design
ANOSSP - split-split plot designANOVN2 (ANOVN3) - two-way (three-way) nested design
ANOCO - analysis of covariance
GLH - general linear hypotheses
Regression Analysis
RESTEM (REBSOM) -stepwise (back solution) multiple regression
CORAN - correlation analysis
Time Series Analysis
MOVAVG - moving averages
SEASHI - Shiskin's seasonality factorsWEMAV - weighted moving averagesTRELS - trend analysis by least squaresVADIME - variate difference method
TSFARG - autoregressive model
GEXSMO - generalized exponential smoothingAUXCOR - auto-correlation and cross-correlation analysis
. POWDEN - power density functions
' RCPROB - residual probabilities4
Multivariate Analysis
GENVAR - generalized varianceDISHOT (DSQ) - Hotelling's (Mahalanobis') distribution
SIGT N - significance of a set of meansDISCRA - discriminant analysis
FACTAN - factor and principal components analysis
Distribution Functions
RNORM - normal distribution
CHI - chi-square distributionSTUD - Student's distributionFISH - Fisher's distribution
POIS - Poisson distribution
BIN - binomial distributionHYGEO - hypergeometric distributionGAMIN - Incomplete gamma distributionBETINC - incomplete beta distribution
Inverse Distribution Functions
TINORM - inverse normal distribution
STUDIN - inverse Student's distributionJ
29
....... ......... ... ...... .... ....:" T ]./ . . . . -.: ". -' " " - -- -" ""~ .2 2 . 2 . . '-" , -" , " . . . . ,-' . j2'.'.-'-'. ',, . -..'.'''' '. '-' '. ',' '
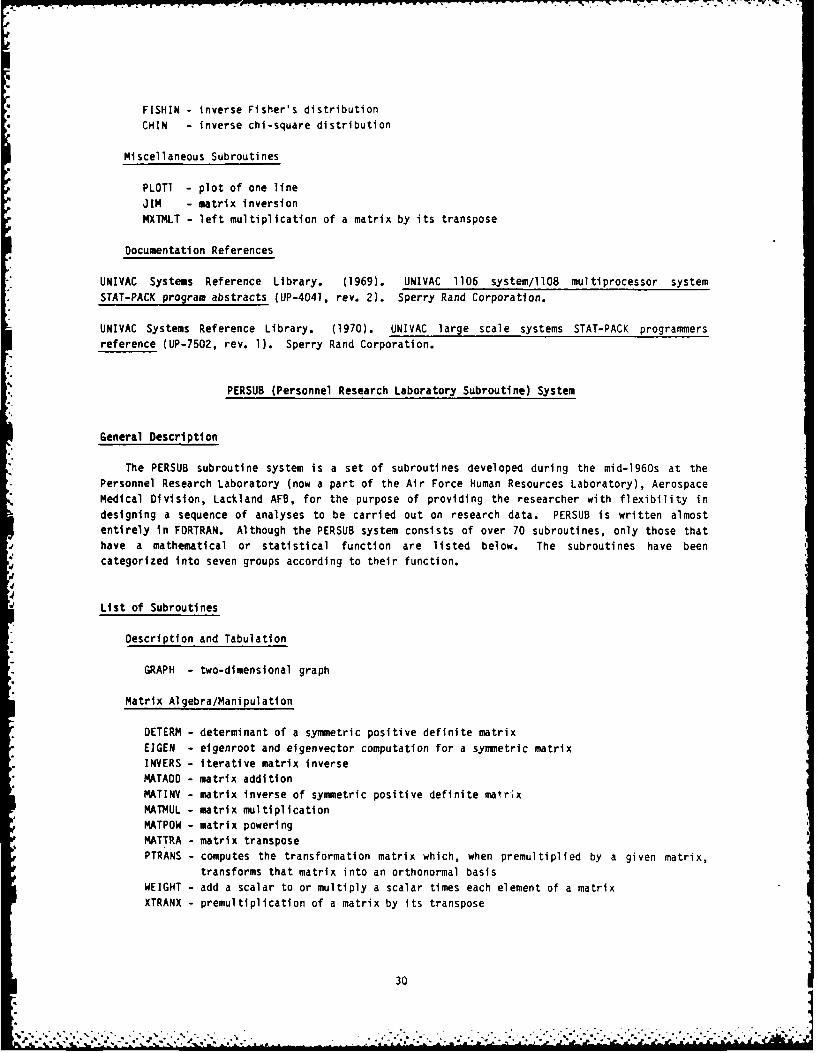
FISHIN - inverse Fisher's distribution
CHIN - inverse chi-square distribution
Miscellaneous Subroutines
PLOT] - plot of one line
JIM - matrix inversionMXTLT - left multiplication of a matrix by its transpose
Documentation References
UNIVAC Systems Reference Library. (1969). UNIVAC 1106 system/1108 multiprocessor systemSTAT-PACK program abstracts (UP-4041, rev. 2). Sperry Rand Corporation.
UNIVAC Systems Reference Library. (1970). UNIVAC large scale systems STAT-PACK programmersreference (UP-7502, rev. 1). Sperry Rand Corporation.
PERSUB (Personnel Research Laboratory Subroutine) System
General Description
The PERSUB subroutine system is a set of subroutines developed during the mid-1960s at thePersonnel Research Laboratory (now a part of the Air Force Human Resources Laboratory), AerospaceMedical Division, Lackland AFB, for the purpose of providing the researcher with flexibility indesigning a sequence of analyses to be carried out on research data. PERSUB is written almostentirely in FORTRAN. Although the PERSUB system consists of over 70 subroutines, only those thathave a mathematical or statistical function are listed below. The subroutines have been
categorized into seven groups according to their function.
List of Subroutines
Description and Tabulation
GRAPH - two-dimensional graph
Matrix Algebra/Manipulation
DETERM - determinant of a symmetric positive definite matrix
EIGEN - elgenroot and elgenvector computation for a symmetric matrixINVERS - iterative matrix inverseMATADD - matrix additionMATINg - matrix inverse of symmetric positive definite matrix
MATUL - matrix multiplicationMATPOW - matrix poweringMATTRA - matrix transposePTRANS - computes the transformation matrix which, when premultiplied by a given matrix,
transforms that matrix into an orthonormal basisWEIGHT - add a scalar to or multiply a scalar times each element of a matrixXTRANX - premultiplication of a matrix by its transpose
30

- . - . . . . .. . . . . . . . . .
Significance Tests/Probability/Distributions
BIPROB - bivariate normal probability
BITRUN - maximum likelihood estimation of the parameters of a bivariate normaldistribution from restricted samples
FSTAT - F-value associated with given degrees of freedom and probabilityMUTRUN - maximum likelihood estimation of the parameters of a multivariate normal
distribution from restricted samplesPENTAP - pentavariate normal probabilityPLEVEL - probability level associated with given F-statistic and degrees of freedomRANDCS - random deviate generation: chi-square distributionRANEXP - random deviate generation: exponential distributionRBTAFT - random deviate generation: beta, F, or t distributionRGAMMA - random deviate generation: gamma distribution
SECANT - maximum likelihood estimation of the parameters of a normal distribution fromtruncated or censored samples
TETRAP - tetravariate normal probability
TRIPR - trivariate normal probability
Variance Analysis
HOMVAR - Box-Schefff homogeneity of variance test
Correlation and Regression Analysis
AKRACY - predicted score accuracy determination
COMPAR - predicted score and actual score comparisonCORRLB - computes and prints means, standard deviations, and correlation matrix in single
precisionCORRLD - computes and prints means, standard deviations, and correlation matrix in double
precision
HITS - computes a binary classification tablePRIMSC - print means, standard deviations, and correlation matrix (used by CORRLB)PREDSC - computes predicted scores
REGRED - iterative regression, single variable correctionREGREF - iterative regression, triple variable correction (useful when highly correlated
variables are present)
STDSCR - computes standardized scoresTABDEV - produces 100 binary classification tables for predicted scores ranging from 0 to
1 (.01) and the "cut score" resulting in the smallest number of misclassificationsTCFFNT - matrix of regression coefficients where the i-th column contains the regression
coefficients regressing variable i on variables 1, 2, 3, .... i-l
Grouping or Clustering
GROUP4 - groups objects on the basis of an input matrix which contains measures ofsimilarity or difference between all pairs of objects
Factor Analysis
COMMUN - computes communalities for a factor loadings matrixPRAXFA - computes principal-axis factor loadings
QTRANS - square root factor analysis of a correlation matrix
VARROT - varimax rotation
31
S.*~~* %* . .

Documentation References
Ward, J. H., Jr., Buchhorn, J., & Hall, K. (1967, August). Introduction to PERSUB(PRL-TR-67-3[I], AD-660 578). Lackland AFB, TX: Personnel Research Laboratory, Aerospace
Medical Division.
Ward, J. H., Jr., Hall, K., & Buchhorn, J. (1967, August). PERSUB reference manual(PRL-TR-67-3[II], AD-660 579). Lackland AFB, TX: Personnel Research Laboratory, AerospaceMedical Division.
The first reference given above (Ward, Buchhorn, & Hall, 1967) contains four examples of theapplication of the PERSUB system to data analysis problems. The second reference (Ward, Hall, &Buchhorn, 1967) contains descriptions of 49 PERSUB subroutines, along with a listing of thesource language statements for each subroutine. Subroutines added to PERSUB after publication ofthe above technical reports are described in the three AFHRL Sperry 1100 document processorreports given below. The first contains descriptions of BIPROB, TRIPR, TETRAP, and PENTAP. Thesecond contains descriptions of HOMVAR, MUTRUN, BITRUN, RANDCS, RANEXP, RBTAFT, RGAMMA, andSECANT. The third report describes AKRACY, COMMUN, COMPAR, CORRLD, HITS, PREDSC, STDSCR, andTABDEV.
Whitehead, L.K. MULTI-PROB: Multivariate normal probability. An AFHRL Sperry 1100 documentprocessor report. Report retrieval command: @DA*DA.ADOC MULTI-PROB
Whitehead, L.K. MISC: Miscellaneous statistical subroutines. An AFHRL Sperry 1100 document
processor report. Report retrieval command: @DA*DA.DOC MISC
Whitehead, L.K. PERSUB. Reference manual addendum for the Sperry 1100. An AFHRL Sperry 1100document orocessor report. Report retrieval command: @DA*DA.ADOC PERSUB
IMSL System
General Description
The IMSL library contains 540 FORTRAN subroutines that were procured from IMSL, Inc.,Houston, Texas, on an annual license agreement basis. These subroutines were implemented andtested on the AFHRL Sperry 1100 computer system for mathematical/statistical problem solving insupport of Armed Services Vocational Aptitude Battery research. IMSL is a widely used collectionof subroutines; e.g., more than 2000 sites have the software package available, the library is inuse in more than 50 countries, and the package is installed on many different types of computersystems. At the expiration of the first year's lease, and each year thereafter, a cost/benefitanalysis will be conducted to determine if the lease should be renewed.
List of Subroutines
Analysis of Variance
ABIBN - Analysis of balanced incomplete block and balanced lattice designsACRDAN (ARCBAN) - Analysis of one-way (two-way) classification design dataACTRST - Contrast estimates and sums of squaresAFACN/AFACT - Full factorial plan analysisAGBACP - Analysis of balanced complete experimental design structure dataAGLMOD - General linear model analysis
32
S . '*-5 555t

AGVACL - One- or two-sided interval estimate of a variance componentAGXPM - Expected mean squares for balanced complete design modelsALSQAN - Analysis of Latin square design dataAMEANS - Preparation of a set of unbalanced data for analysis by the method of unweighted
means
ANCOVI - Covariance analysis for one-way classification design dataANESTE (ANESTU) - Analysis of completely nested design data with equal (unequal) numbers
in the subclassesAORDR - Reordering of the data obtained from any balanced complete experimental designASNKMC - Student-Newman-Keuls multiple comparison test
Basic Statistics
BDCOUl (BDCOU2) - Tally of observations into a one-way (two-way) frequency table
BOLTV - Produce letter value summaryBDTAB - Computations of frequencies of multivariate dataBDTRGI (BDTRGO) - Transgeneration of the columns of a matrix, in- (out- of-) core versionBDTWT - Computations of a two-way frequency tableBECORI (BECOR) - Estimates of means, standard deviations, and correlation coefficients,
in- (out- of-) core versionBECOVM (BECOVW) - Means and variance-covariance matrix (or correlation matrix from data
possibly containing missing observations, with weighting on option)BECTR - Tetrachoric correlation coefficient estimationBECVL (BECVLI) - Variances and covariances of linear functions, in- (out- of-) core versionBEGRPS - Moments estimation for grouped data with and without Sheppard's corrections
BEIGRP (BEIUGR) - Estimation of basic statistical parameters using grouped (ungrouped) dataBELBIN (BELPOS) - Interval estimate of the parameter p (lambda) of the binomial (Poisson)
distributionBEMDP - Median polish of a two-way tableBEMIRI (BEMIRO) - Estimates of means, simple regression coefficients, their intercepts,
standard errors of the regression coefficients, and standard deviationsfor arrays which contain missing values, in- (out- of-) core version
BEMMI (BEMMO) - Estimates of means, standard deviations, correlation coefficients, and
coefficients of skewness and kurtosis from a data matrix containingmissing observations, in- (out- of-) core version
BEMNON (BENSON) - Mean (variance) inferences using a sample from a normal population with
known variance (mean)BEMSON - Mean and variance inferences using a sample from a normal populationBEPAT (BEPET) - Mean and variance inferences using samples from each of two normal
populations with unequal (equal) variancesBESRB - Biserial and point-biserial correlation coefficients for a qualitatively
dichotomized variable and a numerically measurable and classified variableBESRN - Biserial correlation coefficient for a qualitatively dichotomized variable and a
numerically or qualitatively classified variable
BESTAT - Computations of basic univariate statistics from data possibly containing missingvalues, with weighting on option
BESTA2 - Computations of confidence intervals and other basic statistics using output from
IMSL routine BESTAT
Categorized Data Analysis
CBNRHO - Estimation of the bivariate normal correlation coefficient using a contingencytable
CLIFE - Life table analysis
33

CTLLF - Log-linear fit of a contingency tableCTPR - Compute exact probabilities for contingency tables
CTRBYC - Analysis of a contingency table
Differential Equations; Quadrature; Differentiation
DBCEVL - Bicubic spline mixed partial derivative evaluatorDBCQDU - Bicubic spline quadratureDBLIN - Numerical integration of a function of two variablesDCADRE - Numerical integration of a function using cautious adaptive Romberg extrapolationDCSEVU - Cubic spline first and second derivative evaluator
DCSQDU - Cubic spline quadratureDGEAR - Differential equation solver; variable order Adams predictor corrector method or
Gear's methodDMLIN - Numerical integration of a function of several variables over a hyper-rectangle
(Gaussian method)DPDES - Solve a system of partial differential equations of the form UT = FCN
(X,T,U,UX,UXX), using the method of lines with cubic Hermite polynomialsDREBS - Differential equation solver - extrapolation methodDRVTE - Calculate first, second, or third derivative of a user-supplied function
DTPTB - Solve a system of ordinary differential equations with boundary conditions at twopoints, using a multiple shooting method
DVCPR - Solve a system of ordinary differential equations with boundary conditions at twopoints, using a variable order, variable step size finite difference method withdeferred corrections
DVERK - Differential equation solver - Runge-Kutta-Verner fifth- and sixth-order method
Elgensystem Analysis
EIGCC/EIGBS/EIGCH/EIGRF/EIGRS - Eigenvalues and (optionally) eigenvectors of a complexgeneral/real symmetric band/complex Hermitian/real general/real symmetric matrix
EIGZC/EIGZF - Eigenvalues and (optionally) eigenvectors of the system A*x=lambda*B*x where
A and B are complex/real matricesEIGZS - Eigenvalues and (optionally) eigenvectors of the system A*x=lambda*B*x where A and
B are real symmetric matrices and B is positive definiteEQRTIS - Smallest or largest M eigenvalues of a symmetric tridiagonal matrix
EQRT2S - Eigenvalues and (optionally) eigenvectors of a symmetric tridiagonal matrix usingthe QL method
EQRT3S - Smallest (or largest) eigenvalues of a tridiagonal matrix in algebraic value whosesum exceeds a given value
Forecasting; Econometrics; Time Series; Transforms
FFTCC (FFTRC) - Compute the fast Fourier transform of a complex-(real-) valued sequenceFFTSC - Compute the sine and cosine transforms of a real-valued sequenceFFT2C - Compute the fast Fourier transform of a complex-valued sequence of length equal to
a power of twoFFT3D - Compute the fast Fourier transform of a complex-valued 1, 2, or 3 dimensional array
FLINV - Inverse Laplace transform of a user-supplied complex function
FTARPS (FTMA) - Preliminary estimation of the autoregressive(moving average) parameters in an ARIMA stochastic model
FTAUTO - Mean, variance, autocovariances, autocorrelations and partial autocorrelations for
a stationary time series
34

FTCAST - Time series forecasts and probability limits using an ARIMA (Box-Jenkins) model
FTCP - Nonseasonal ARIMA (Box-Jenkins) stochastic model analysis for a single time series
with full parameter iteration and maximum likelihood estimation
FTCROS - Means, variances, cross-covariances, and cross-correlations for two mutuallystationary N channel time series
FTCRXY - Cross-covarlance of two mutually stationary time seriesFTFPS - Fast Fourier transform estimates of power spectra and cross-spectra of time seriesFTFREQ - Single or multichannel time series analysis in the time and frequency domainsFTGEN - Generation of a time series from a given ARIMA (Box-Jenkins) stochastic modelFTKALM - Kalman filteringFTML - Maximum likelihood estimation of autoregressive and moving average parameters in
an ARIMA (Box-Jenkins) stochastic modelFTRDIF - Transformations, differences and seasonal differences of a time series for model
identification
FTTR - Parameter estimates for a univariate transfer function modelFTWEIN - Wiener forecast for a stationary stochastic process
FTWENM - Multichannel Wiener forecastFTWENX - Maximum likelihood parameter estimates for a multichannel, single output time
series model
Generation and Testing of Random Numbers
GFIT - Chi-squared goodness-of-fit testGGANR - One-parameter gamma random deviate generator, and usable as the basis for
two-parameter gamma, exponential, chi-squared, chi, beta, t, and F deviate
generationGGBN/GGBNR/GGBTR/GGCAY/GGCHS/GGEOT/GGEXN/GGHPR/GGMTN/GGNLG/GGNML/GGSTA/GGTRA/GGVCR/GGVMS/
GGWIB - Binomial/negative binomial/beta/Cauchy/chi-squared/geometric/exponential/hypergeo-metric/multinomial/1og-normal/normal/stable distribution/triangular distribution/general continuous distribution/Von Mises/Weibull/random deviate generator
GGCOR - Generate a random orthogonal matrix and a random correlation matrixGGDA (GGDT) - General discrete distribution random deviate generator using alias (table
look-up) method
GGEXT - Random deviate generator for a mixture of two exponentialsGGNO (GGUO) - Generate set of order statistics from normal (uniform [O,l]) distributionGGNPM - Normal random deviate generator via the polar methodGGNPP - Nonhomogeneous Poisson process generator with rate function lambda (t) - fixed
interval, fixed number, or one-at-a-timeGGNSM - Multivariate normal random deviate generator with given covariance matrix
GGPER - Generate a random permutation of the integers 1 to kGGPON (GGPOS) - Poisson random deviate generator where the Poisson parameter changes
frequently (does not change often)
GGSPH - Generation of uniform random deviates from the surface of the unit sphe-e in 3 or4 space
* GGSRS - Generate a simple random sample from a finite populationGGTAB - Generate a random contingency table with given row and column totalsGGUBS - Basic uniform (0,1) pseudo-random number generatorGGUBT - Uniform (0,1) pseudo-random number generator using alternate multiplierGGUD - Discrete uniform random number generator
GGUW - Uniform (0,1) random number generator with shufflingGTCN - Sample size or number of class intervals determination for chi-squared test
applicationsGTDDU - D-square tally
35
-. . .. . . . . . . . ~A:-.. -.. f
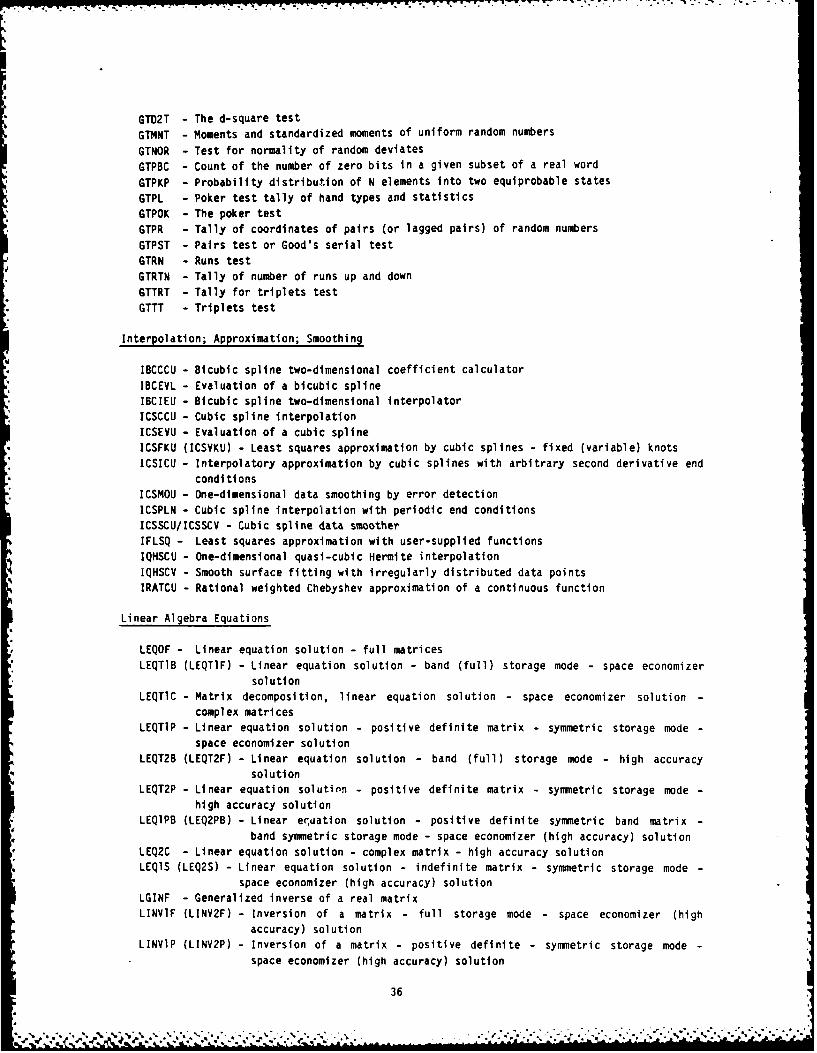
_, . -S m - . - . .
GT02T - The d-square test
GTMNT - Moments and standardized moments of uniform random numbers
GTNOR - Test for normality of random deviates
GTPBC - Count of the number of zero bits in a given subset of a real word
GTPKP - Probability distribution of N elements into two equiprobable states
GTPL - Poker test tally of hand types and statistics
GTPOK - The poker test
GTPR - Tally of coordinates of pairs (or lagged pairs) of random numbers
GTPST - Pairs test or Good's serial test
GTRN - Runs test
GTRTN - Tally of number of runs up and down
GTTRT - Tally for triplets test
GTTT - Triplets test
Interpolation; Approximation; Smoothing
IBCCCU - Bicubic spline two-dimensional coefficient calculator
IBCEVL - Evaluation of a bicubic spline
IBCIEU - Bicubic spline two-dimensional interpolator
ICSCCU - Cubic spline interpolationICSEVU - Evaluation of a cubic spline
ICSFKU (ICSVKU) - Least squares approximation by cubic splines - fixed (variable) knots
ICSICU - Interpolatory approximation by cubic splines with arbitrary second derivative end
conditionsICSMOU - One-dimensional data smoothing by error detectionICSPLN - Cubic spline interpolation with periodic end conditionsICSSCU/ICSSCV - Cubic spline data smoother
IFLSQ - Least squares approximation with user-supplied functions
IQHSCU - One-dimensional quasi-cubic Hermite interpolationIQHSCV - Smooth surface fitting with irregularly distributed data pointsIRATCU - Rational weighted Chebyshev approximation of a continuous function
Linear Algebra Equations
LEQOF - Linear equation solution - full matrices
LEQT1B (LEQT1F) - Linear equation solution - band (full) storage mode - space economizer
solution
LEQTIC - Matrix decomposition, linear equation solution - space economizer solution -complex matrices
LEQTIP - Linear equation solution - positive definite matrix - symmetric storage mode -space economizer solution
LEQT2B (LEQT2F) - Linear equation solution - band (full) storage mode - high accuracysolution
LEQT2P - Linear equation solution - positive definite matrix - symmetric storage mode -high accuracy solution
LEQIPB (LEQ2PB) - Linear eruation solution - positive definite symmetric band matrix -
band symmetric storage mode - space economizer (high accuracy) solutionLEQ2C - Linear equation solution - complex matrix - high accuracy solution
LEQ1S (LEQ2S) - Linear equation solution - indefinite matrix - symmetric storage mode -space economizer (high accuracy) solution
LGINF - Generalized inverse of a real matrix
LINVIF (LINV2F) - Inversion of a matrix - full storage mode - space economizer (highaccuracy) solution
LINVIP (LINV2P) - Inversion of a matrix - positive definite - symmetric storage mode
space economizer (high accuracy) solution
36
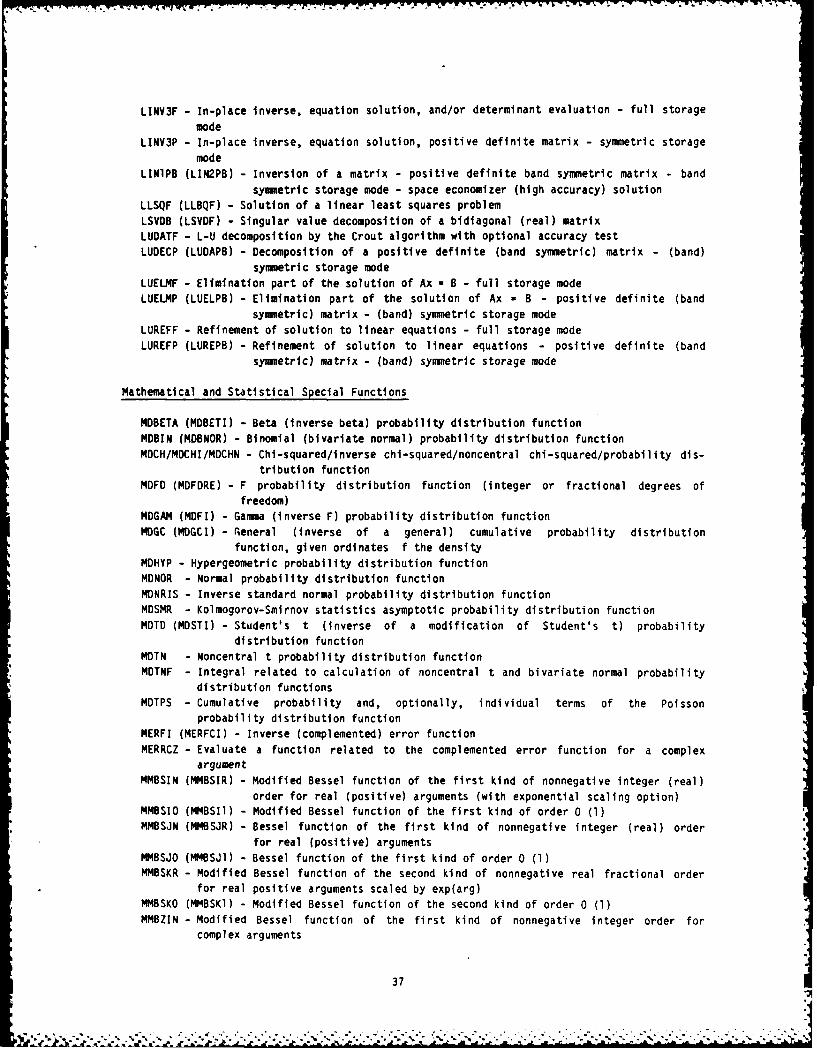
LINV3F - In-place inverse, equation solution, and/or determinant evaluation - full storage
modeLINV3P - In-place inverse, equation solution, positive definite matrix - symmetric storage
modeLINIPB (LIN2PB) - Inversion of a matrix - positive definite band symmetric matrix - band
symmetric storage mode - space economizer (high accuracy) solution
LLSQF (LLBQF) - Solution of a linear least squares problemLSVDB (LSVDF) - Singular value decomposition of a bidiagonal (real) matrixLUDATF - L-U decomposition by the Crout algorithm with optional accuracy testLUDECP (LUDAPB) - Decomposition of a positive definite (band symmetric) matrix - (band)
symmetric storage modeLUELI4F - Elimination part of the solution of Ax - B - full storage modeLUELMP (LUELPB) - Elimination part of the solution of Ax - B - positive definite (band
symmetric) matrix - (band) symmetric storage modeLUREFF - Refinement of solution to linear equations - full storage modeLUREFP (LUREPB) - Refinement of solution to linear equations - positive definite (band
symmetric) matrix - (band) symmetric storage mode
Mathematical and Statistical Special Functions
MOBETA (MOBETI) - Beta (inverse beta) probability distribution functionMDBIN (MDBNOR) - Binomial (bivariate normal) probability distribution functionMDCH/MDCHI/MDCHN - Chi-squared/inverse chi-squared/noncentral chi-squared/probability dis-
tribution functionMDFD (MDFDRE) - F probability distribution function (integer or fractional degrees of
freedom)MDGAM (MDFI) - Gamma (inverse F) probability distribution functionMDGC (MDGCI) - General (inverse of a general) cumulative probability distribution
function, given ordinates f the densityMOHYP - Hypergeometric probability distribution functionMDNOR - Normal probability distribution functionMDNRIS - Inverse standard normal probability distribution functionMDSMR - Kolmogorov-Smirnov statistics asymptotic probability distribution functionMDTD (MOSTI) - Student's t (inverse of a modification of Student's t) probability
distribution functionMOTN - Noncentral t probability distribution functionMDTNF - Integral related to calculation of noncentral t and bivariate normal probability
distribution functionsMDTPS - Cumulative probability and, optionally, individual terms of the Poisson
probability distribution functionMERFI (MERFCI) - Inverse (complemented) error functionMERRCZ - Evaluate a function related to the complemented error function for a complex
argumentMMBSIN (MMBSIR) - Modified Bessel function of the first kind of nonnegative integer (real)
order for real (positive) arguments (with exponential scaling option)MMBSIO (MMBSII) - Modified Bessel function of the first kind of order 0 (1)MMBSJN (MMBSJR) - Bessel function of the first kind of nonnegative integer (real) order
for real (positive) argumentsMMBSJO (MMBSJI) - Bessel function of the first kind of order 0 (1)MMBSKR - Modified Bessel function of the second kind of nonnegative real fractional order
for real positive arguments scaled by exp(arg)MMBSKO (MMBSKl) - Modified Bessel function of the second kind of order 0 (1)MMBZIN - Modified Bessel function of the first kind of nonnegative integer order for
complex arguments
37
- ... --.. - . . .. . . .

MMBZJN (MMBSYN) - Bessel function of the first (second) kind of nonnegative integer (real
fractional) order for complex (real positive) arguments
MMDAS - Dawson integralMMDEI - Exponential integralsMMDELK (MMDELE) - Complete elliptic integral of the first (second) kind
MMDEN - Exponential integrals of integer order for real argument x scaled by exp(x)
MKELD - Derivatives of the Kelvin functions (ber, bei, ker, and kel) of order 0
MMKELO (MMKELl) - Kelvin functions of the first kind (ber, bei) and of the second kind(ker, kel) of order 0 (1)
MMLINC - Elementary integral from which inverse circular functions, logarithms, or inversehyperbolic functions may be computed
MMLINF/MMLIND/MMLINJ - Incomplete elliptic integral of the first/second/third kind
M14PSI - Logarithmic derivative of the gamma functionMMWPQ (MMWPL) - Weierstrass P-function in the equianharmonic (lemniscatic) case for
complex argument with unit period parallelogramMMWPQl (tt4WPLI) - First derivative of the Weierstrass P-function in the equianharmonic
(lemniscatic) case for complex argument with unit period parallelogram
MSENO - Expected values of normal order statisticsMSMRAT - Ratio of the ordinate to the upper tail area of the standardized normal
distribution
Nonparametric Statistics
NAFRE - Friedman's test for randomized complete block designs
NAKI - Kruskal-Wallis test for identical populationsNAWNRP - Wilson's ANOVA (2- or 3-way designs) without replicatesNAWRPE - Wilson's ANOVA (1-, 2-, 3-way designs) with equal replicationNAWRPU - Wilson's ANOVA (1-, 2-, 3-way designs) with unequal replicationNBCYC - Noether's test for cyclical trend
NBQT - Cochran Q testNBSOL - Cox and Stuart sign test for trends in dispersion and location
NBSIGN - Sign test (for percentiles)NDEST - Evaluate probability density function at specified pointsNOKER - Nonparametric probability density function (one-dimensional) estimation by the
Kernel methodNOMPLE - Nonparametric probability density function (one-dimensional) estimation by the
penalized likelihood methodNHEXT - Fisher's exact method for 2 by 2 tables
NHINC - Includance testNKSI (NKS2) - Kolmogorov-Smirnov one- (two-) sample testNMCC - Calculate and test the significance of the Kendall coefficient of concordanceNMKN - Kendall's test for correlation (rank correlation coefficient)NMKSF - Frequency distribution of K and the probability of equaling or exceeding K, where
K, the total score from the Kendall rank correlation coefficient calculations,and N, the sample size, are given
NMKTS - K-sample trends test against ordered alterntivesNMRANK - Numerical rankingNMTIE - Tie statistics, given a sample of observations
NRBHA - Bhapkar V testNRWMD - Wilcoxon's signed rank test
NRWRST - Wilcoxon's rank-sum test (Mann-Whitney test)
38
. .. . ... ~. ''* . -

Observation Structure; Multivariate Statistics
OCDIS - Pairwise Euclidean distances between the columns of a matrix
OCLINK - Perform a single-linkage or complete-linkage hierarchical cluster analysis given
a similarity matrixODFISH - Linear discriminant analysis method by Fisher for reducing the number of variables
ODNORM - Multivariate normal linear discriminant analysis among several known groups
OFCOMM - Compute an unrotated factor loading matrix according to a common factor model byunweighted or generalized least squares, or by maximum likelihood procedures
OFHARR - Transformation of unrotated factor loading matrix to oblique axes byHarris-Kaiser method
OFIMAG - Compute an unrotated factor loading matrix according to an image modelOFIMA3 - Least squares solution to the matrix equation AT - B
OFPRI - Compute an unrotated factor loading matrix according to a principal componentsmodel
OFPROT - Oblique transformation of the factor loading matrix using a target matrix,including pivot and power vector options
OFRESI - Comunalities and normalized factor residual correlation matrix calculationOFROTA - Orthogonal rotation of a factor loading matrix using a generalized orthomax
criterion, including quartimax, varimax, and equamax
OFSCHN - Orthogonal transformation of the factor loading matrix using a target matrixOFSCOR - Compute a set of factor scores given the factor score coefficient matrix
DINO - Wilk's test for the independence of K sets of multinormal variatesOPRINC - Principal components of a multivariate sample of observationsOTMLNR - Maximum likelihood estimation from grouped and/or censored normal data
Regression Analysis
RLCOMP - Generation of an orthogonal central composite designRLDCQM - Decoding of a quadratic regression model
RLDCVA - Variance estimates for decoded orthogonal polynomial regression coefficientsRLDOPM - Coefficient decoder for an orthogonal polynomial regression model
RLEAP - Leaps and bounds algorithm for determining a number of best regression subsetsfrom a full regression model
RLFITI (RLFITO) - Pure replication error degrees of freedom and sum of squares, in- (out-
of-) core version
RLFOR - Fit a univariate curvilinear regression model using orthogonal polynomials withoptional weighting (easy-to-use version)
RLFOTH (RLFOTW) - Fit a univariate curvilinear regression model using orthogonal
polynomials (with weighting)RLGQMI (RLGQMO) - Centering of independent variable settings and generation of centered
(uncentered) square and cross-product terms, in- (out- of-) core version
RLINCF - Response control using a fitted simple linear regression model
RLINPF - Inverse '"ediction using a fitted simple linear regression model
RLLAV - Perfo inear regression using the least absolute values criterionRLLMV - Perform linear regression using the minimax criterion
RLMUL - Multiple linear regression analysisRLONE - Analysis of a simple linear regression modelRLOPDC - Response prediction using an orthogonal polynomial regression model
RLPOL - Generate orthogonal polynomials with the associated constants AA and BB
RLPRDI (RLPRDO) - Confidence intervals for the true response and for the average of a setof future observations on the response, in- (out- of-) core version
RLRES - Perform a residual analysis for a fitted regression model
RLSEP - Selection of a regression model using a forward stepwise algorithm, and
computation of the usual analysis of variance table entries
39

available after each stepRLSUBM - Retrieval of a symmetric submatrix from a matrix stored in symmetric storage mode
by RLSTPRLSUM - Reordering of the rows and corresponding columns of a symmetric matrix stored in
symmetric storage mode
RSMITZ - Least squares fit of the nonlinear regression model Y(i) - alpha +beta*gamma**X(i) + e(i)
Sampling
SSPAND (SSPBLK) - Simple (stratified) random sampling with proportional data - inferencesregarding the population proportion and total
SSRAND (SSRBLK) - Simple (stratified) random sampling with continuous data inferencesregarding the population mean and total using ratio or regression
estimationSSSAND (SSSBLK) - Simple (stratified) random sampling with continuous data - inferences
regarding the population mean and totalSSSCAN - Single-stage cluster sampling with continuous data - inferences regarding the
population mean and totalSSSEST - Two-stage sampling with continuous data and equisized primary units - inferences
regarding the population mean and total
Utility Functions
USBOX - Print a box plot (k samples)USHHST - Print a horizontal histogramUSHST (USHST2) - Print a vertical histogram (plotting two frequencies with one bar of the
histogram)USMNMX - Determination of the minimum and maximum values of a vectorUSPC - Print a sample cdf, a theoretical cdf, and confidence band information. Plot
these on option.USPDF - Plot of two sample cumulative probability distribution functions against their
spectraUSPLO (USPLOD) - Printer plot of up to 10 functions (double precision)USPRP - Probability plotUSSLF - Print a stem and leaf displayUSTREE - Print a binary treeUSWBM (USWBS) - Print a matrix stored in band (band symmetric) storage mode.USWCM (USWCH) - Print a complex (complex Hermitian) matrix stored in full (Hermitian)
storage modeUSWFV (USWCV) - Print a (complex) vectorUSWSM (USWFM) - Print a matrix stored in symmetric (full) storage mode.
Vector, Matrix Arithemetic
VABMXF- Maximum absolute value of the elements of a vector or a subset of the elements of
a vectorVABMXS - Maximum absolute value of the elements of a row or column of a matrix stored in
symmetric storage modeVABSMF - Sum of the absolute values of the elements of a vector or a subset of a vectorVABSMS - Sum of the absolute values of the elements of a row (or column) of a matrix
stored in symmetric storage mode
CAXPY (DAXPY) - Compute a constant times a vector plus a vector, all complex (doublepreci sion) i
40
m.

CCOPY (DCOPY) - Copy a vector X to a vector Y, both complex (double precision)
CDOTC (CDOTU) - Compute complex dot product using conjugated (unconjugated) vector
components
CSCAL (CSSCAL) - Compute a complex (real) constant times a complex vector
CSWAP - Interchange vectors X and Y, both complexCZDOTC (CZDOTU) - Compute complex dot product using conjugated (unconjugated) vector
4components and double precision accumulation
DASUM - Compute double-precision sum of absolute values
DOOT - Compute double-precision dot product
DNRM2 - Compute the Euclidean length or L2 norm of a double-precision vectorDROTG (DROT) - Construct (apply) Givens plane rotation, double precisionDROTMG (DROTM) - Construct (apply) a modified Givens plane rotation, double precisionDSDOT - Compute single-precision dot product using double-precision accumulationICAMAX - Find the smallest index of the maximum magnitude of a complex vectorISAMAX (IDAMAX) - Find the smallest index of the maximum magnitude of a single- (double-)
precision vector
SAXPY - Compute a constant times a vector plus a vector, all single precisionSCASUM (SASUM) - Compute complex (single precision) sum of absolute valuesSCNRM2 (SNRM2) - Compute the Euclidean length or L2 norm of a complex (single precision)
vector
SCOPY - Copy a vector X to a vector Y, both single precisionSDOT (SOSDOT) - Compute single-precision dot product (and add a constant using double-
precision accumulation)SROTG (SROT) - Construct (apply) Givens plane rotation, single precisionSROTMG (SROTM) - Construct (apply) a modified Givens plane rotation, single precisionSSCAL (DSCAL) - Compute a single- (double-) precision constant times a single- (double-)
precision vectorSSWAP (DSWAP) - Interchange vectors X and Y, both single (double) precisionVCONVO - Vector convolution
VCVTBF (VCVTFB) - Storage mode conversion of matrices, band (full) to full (band) storagemode
VCVTCH (VCVTHC) - Storage mode conversion of matrices, full complex (Hermitian) to
Hermitian (full complex)VCVTFQ (VCVTQF) - Storage mode conversion of matrices, full (band symmetric) to band
symmetric (full) storage modeVCVTFS (VCVTSF) - Storage mode conversion of matrices, full (symmetric) to symmetric (full)VCVTQS (VCVTSQ) - Storage mode conversion of matrices, band symmetric (symmetric) to
symmetric (band symmetric) storage modeVDCPS - Decompose an integer into its prime factorsVHSH2C (VHSH2R) - Complex (real) Householder transformation to zero a single element of a
matrixVHSH3R - Real Householder transformation to zero two elements of a matrixVHS12 - Real Householder transformation - computation and applicationVIPRFF - Vector inner product of two vectors or subsets of two vectorsVIPRSS - Vector inner product of two vectors, each of which is a part of some matrix
stored in symmetric modeVMULBB (VMULFF) - Matrix multiplication, band (full) storage modeVMULBF (VMULFB) - Matrix multiplication, band (full) by full (band) matricesVMULBS (VMULSB) - Matrix multiplication, band (symmetric) by symmetric (band) matricesVMULFM - Matrix multiplication of the transpose of matrix A by matrix B, full storage modeVMULFP - Matrix multiplication of matrix A by the transpose of matrix B, full storage modeVMULFQ (VMULQF) - Matrix multiplication, full (band symmetric) by band symmetric (full)
matrices
41
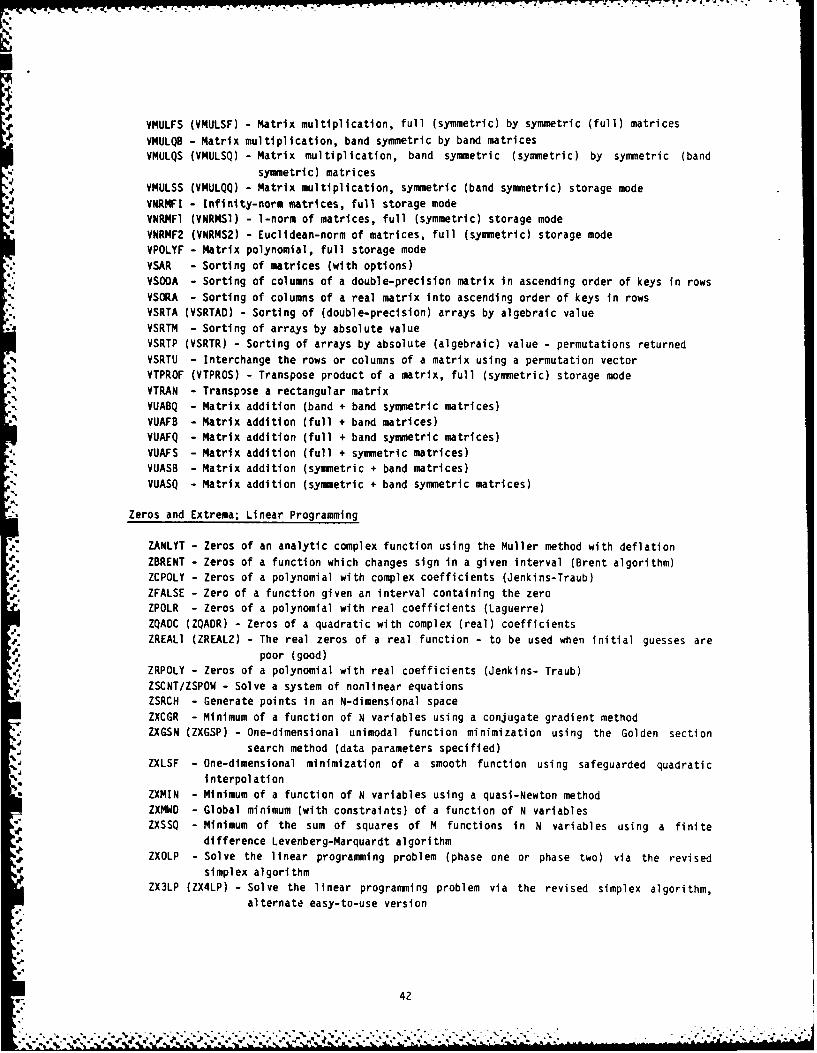
EX
VMULFS (VMULSF) - Matrix multiplication, full (symmetric) by symmetric (full) matrices
VMULQB - Matrix multiplication, band symmetric by band matricesVMULQS (VMULSQ) - Matrix multiplication, band symmetric (symmetric) by symmetric (band
",' symmetri c) matricesVMULSS (VMULQQ) - Matrix multiplication, symmetric (band symmetric) storage mode
VNRMFI - Infinity-norm matrices, full storage modeVNRFl (VNRMS1) - 1-norm of matrices, full (symmetric) storage modeVNRMF2 (VNRMS2) - Euclidean-norm of matrices, full (symmetric) storage modeVPOLYF - Matrix polynomial, full storage mode
VSAR - Sorting of matrices (with options)VSOOA - Sorting of columns of a double-precision matrix in ascending order of keys in rowsVSORA - Sorting of columns of a real matrix into ascending order of keys in rowsVSRTA (VSRTAD) - Sorting of (double-precision) arrays by algebraic valueVSRTM - Sorting of arrays by absolute value
VSRTP (VSRTR) - Sorting of arrays by absolute (algebraic) value - permutations returnedVSRTU - Interchange the rows or columns of a matrix using a permutation vectorVTPROF (VTPROS) - Transpose product of a matrix, full (symmetric) storage mode
VTRAN - Transpose a rectangular matrixVUABQ - Matrix addition (band + band symmetric matrices)VUAFB - Matrix addition (full + band matrices)VUAFQ - Matrix addition (full + band symmetric matrices)VUAFS - Matrix addition (full + symmetric matrices)VUASB - Matrix addition (symmetric + band matrices)VUASQ - Matrix addition (symmetric + band symmetric matrices)
Zeros and Extrema; Linear Programming
ZANLYT - Zeros of an analytic complex function using the Muller method with deflationZBRENT - Zeros of a function which changes sign in a given interval (Brent algorithm)ZCPOLY - Zeros of a polynomial with complex coefficients (Jenkins-Traub)ZFALSE - Zero of a function given an interval containing the zeroZPOLR - Zeros of a polynomial with real coefficients (Laguerre)ZQADC (ZQADR) - Zeros of a quadratic with complex (real) coefficientsZREALI (ZREAL2) - The real zeros of a real function - to be used when initial guesses are
poor (good)ZRPOLY - Zeros of a polynomial with real coefficients (Jenkins- Traub)ZSCNT/ZSPOW - Solve a system of nonlinear equationsZSRCH - Generate points in an N-dimensional spaceZXCGR - Minimum of a function of N variables using a conjugate gradient methodZXGSN (ZXGSP) - One-dimensional unimodal function minimization using the Golden section
search method (data parameters specified)ZXLSF - One-dimensional minimization of a smooth function using safeguarded quadratic
a interpolationa ZXMIN - Minimum of a function of N variables using a quasi-Newton method
ZXMWD - Global minimum (with constraints) of a function of N variablesZXSSQ - Minimum of the sum of squares of M functions in N variables using a finite
difference Levenberg-Marquardt algorithm
ZXOLP - Solve the linear programming problem (phase one or phase two) via the revisedsimplex algorithm
ZX3LP (ZX4LP) - Solve the linear programming problem via the revised simplex algorithm,alternate easy-to-use version
42
Documentation References
IMSL library reference manual: Edition 9. (Vols. 1-4). IMSL LIB-0OOg (rev. ed., June 1982).Volume I - Chapters INTRO-D; Volume 2 - Chapters E-L; Volume 3 - Chapters M-0; Volume 4 -
Chapters R-Z. IMSL Customer Relations, 7500 Bellaire Boulevard, Houston, TX 77036.
IV. NATIONALLY RECOGNIZED STATISTICAL PACKAGES
Three widely recognized and accepted statistical packages are available in the AFHRLmathematical and statistical software library: (a) the Biomedical Computer Programs (BMDP), (b)STATJOB, and (c) the Statistical Package for the Social Sciences (SPSS/SPSSX). A fourthstatistical package, the Comprehensive Occupational Data Analysis Programs (CODAP), is nationallyrecognized and accepted within the occupational analysis community. Each of these packages is acollection of computer programs that share a common main program for handling input data and forinvoking the specific procedures or programs which have been requested. Advantages of usingthese packages include the similarity in the conventions for control card preparation for thevarious programs in each package and the familiarity of the analytical techniques and reportformats to a wide audience of researchers. The features and specific capabilities of each ofthese packages will be discussed in the following sections.
BMDP - Biomedical Computer Programs
General Description
The Biomedical Computer Programs comprise a series of statistical programs which have evolvedas a result of methodological research and programming effort at the UCLA Health SciencesComputing Facility. The Biomedical Computer Programs were originally intended for researchers inthe health sciences, but the programs have also been used in a wide range of biological,physical, and behavioral science ap~iications. The Biomedical Computer programs were distributedunder the name BIMO as early as 1961. Later, the BIMD programs were consolidated and expandedand, in 1964, were issued as BMD programs. By 1965, BMD programs were supplemented by the BMDXprograms, and in 1969, the distribution of the BMDP programs began.
The following subsections contain brief descriptions of the BMDP programs available in thesoftware library. The programs have been grouped together according to the following generalstatistical categories: (a) data description, (b) frequency tables, (c) life tables and survival
analysis, (d) multivariate analysis, (e) regression analysis, (f) special programs, (g) timeseries, and (h) analysis of variance.
Class 0 - Data Description
BMDP1D (Simple Data Description). PlD computes univariate statistics for each variable orseparately for each level of a grouping variable. It can list all cases or selected cases (thosecontaining missing values or values outside minimum or maximum limits) and store the data in aBM0P file. Codes or intervals for a variable can be specified, and for each such variable, PI0prints the number of cases with each code or in each interval.
BMDP2D (Detailed Data Description, Including Frequencies). P2D counts and lists distinct
values, computes univariate statistics, and plots a histogram for each variable. Values of
variables may be truncated or rounded before calculations.
43
. - . -. '- -..-'2.- . .- ..-. .. . -. '. .,.-*, -. .. ,. .... . . .. . -. .-. --- -.- .- .. - ---. -- *- *; - , * * * -.-- -- -- -. ~i;-

BMDP3D (Comparison of Two Groups with t Tests). P3D computes one-group and two-group t
tests. Two-group tests are conducted with and without the assumption of equality of variances.If there are more than two groups, the program computes two-group t tests for each pair ofgroups. Equality of group variances is tested by Levene's test. If several variables areanalyzed, Mahalanobis' D2 and Hotelling's T2 can be requested.
BMDP4O (Single Column Frequencies, Numeric and Nonnumeric). P4 counts the-numeric andnonnumeric characters (symbols) found in single column fields. All data are read in Al format.All keypunch characters are considered legal, and the frequency of each is counted separately.
BMDP5D (Histograms and Univariate Plots). P5D prints histograms and other univariate plots.For each plot, cases belonging to one or more groups can be used. In the plots, cases fromdifferent groups can be identified by distinct letters. The size of the plots can be specified.
BMDP6D (Bivariate Scatter Plots). P60 prints bivariate scatter plots. Cases belonging toone or more groups can be used for each plot. The regression equations for regressing eachvariable on the other can be requested.
BMDP70 (Description of Groups [Strata] with Histograms and Analysis of Variance). For eachvariable, P7D prints histograms for each group, side by side. For one-way analyses of variance,equality of group variances can be tested by Levene's test.
BMDP80 (Missing Value Correlation). P8D computes correlations four different ways from datacontaining missing values. Computations can be performed using (a) all acceptable values--themean of each variable is computed from all acceptable values for that variable and thendeviations from the means are used to compute covariances and correlations, (b) all acceptablepairs of values for covariances--each element of the covariance matrix is computed from the
* existing pairs of values involved and variances are computed using all acceptable values for eachvariable, (c) all acceptable pairs of values for correlations--each element of the correlationmatrix is computed from the acceptable pairs of values involved, or (d) all complete cases--caseswith any missing or out-of-range data are not used. Case weights may be specified.
BMDP90 (Multiway Description of Groups). P9D provides descriptive statistics of groups whenthe data are classified into cells by one or more grouping variables. P90 computes a chi-squaretest for equality of cell frequencies, a one-way ANOVA for equality of cell means, and Bartlett'stest for homogeneity of variances. The program also prints a plot indicating how means shiftfrom cell to cell.
Class F - Frequency Tables
BMDP4F (Two-Way and Multiway Frequency Tables). P4F creates multiway or cross-sections ofmultiway frequency tables. Tabular values can be expressed as percentages of row totals,percentages of column totals, or percentages of the total frequency. Several tests ofindependence and measures of association are available for two-way tables. Options are availablefor the development of log-linear models.
Class L - Life Tables and Survival Functions
BMDPIL (Life Tables and Survival Functions). PlL estimates the survival (time-to-occurrence)curve of subjects who have been observed over varying periods of time. Estimates are provided by
- the actuarial (Cutler-Ederer) life table and product-limit (Kaplan-Meier) methods. Tests of* equality of the survival curves are provided by Mantel-Cox and Breslow statistics.
44
.... .*- " - * " ". " . * .. . . . . . ... . . . ' . . ". - . ". .- - ".- .- ' - ,- - - "- . -' ' - " " ' " :" " / " " , " '
BMDP2L (Survival Analysis With Covariates - Cox Models). P2L analyzes Cox-style proportional
hazards survival analysis models with covariates.
Class M - Multivariate Analysis
BMDPIM (Cluster Analysis of Variables). PIM clusters variables according to four measures ofsimilarity (correlation, absolute value of the correlation, arccosine of the correlation, acuteangle corresponding to the arccosine of the absolute value of the correlation) and three linkagecriteria (single, complete, average).
. BMIP2M (Cluster Analysis of Cases). P2M clusters cases according to four distance measures(Euclidean, sum of the pth power of the absolute difference, chi-square statistic, phi-square)and three linkage criteria (single, centroid, and kth nearest neighbor).
BMDP3M (Block Clustering). P3M forms block clusters from categorical data. Block clusters*correspond to submatrices of the data matrix.
BMDP4M (Factor Analysis). P4M performs factor extraction on a correlation or covariancematrix according to four methods (principal components analysis, maximum likelihood factor,Kaiser's Second Generation Little Jiffy, and principal factor analysis) and eight types ofrotation (varimax, direct quartimin, quartimax, equamax, orthogonal with gamma, direct obliminwith gamma, orthoblique, and no rotation). P4M accepts input in the following forms: raw data,correlation matrix, covariance matrix, factor loadings, and factor score coefficients.
BMDP6M (Canonical Correlation Analysis). P6M performs a canonical correlation analysis fortwo sets of variables. It also tests for the significance of the remaining eigenvalues usingBartlett's test. P6M accepts input in the following forms: raw data, correlation matrix, andcovariance matrix.
BMDP7M (Stepwise Discriminant Analysis). P7M performs a multiple group discriminant analysisusing a forward or backward stepwise variable selection procedure. A jackknife-validationprocedure is available.
BMDP8M (Boolean Factor Analysis). P8tM performs a factor analysis on binary data utilizingBoolean matrix arithmetic. The resulting scores and factor loadings are binary.
BMDP9M (Scoring Based on Preference Pairs). P9M determines a score for each case reflectingthe preferences of one or more judges. The score is derived from a linearly weighted combinationof variables where the coefficients are derived from the judges comparing cases two at a time.For each comparison, the judges denote how much they prefer one case over the other.
BMDPAM (Description and Estimation of Missing Data). PAM describes the pattern of missingvalues and estimates missing and out-of-range values by the following four methods: substitutionof mean, simple regression using the most highly correlated variable, multiple regression on ahighly correlated set of variables, and regression on all variables. Three options are availablefor estimating the covariance and correlation matrices: all cases with valid data for bothvariables, maximum likelihood algorithm, and all cases with valid data for all variables.
BMDPKM (K-Means Clustering). Utilizing user-specified clusters or splitting the data intoclusters, PKM assigns each case to the cluster whose center is closest to the case. The distancecomputed is the Euclidean distance between the mean of the cases in the cluster and the case.There are five options for standardizing the data. PKM will assign cases to clusters even ifthey were not used in the previous computations. Clustering assignments can be made atintermediate clustering steps.
45

Class R - Regression Analysis
BMDP1R (Multiple Linear Regression). PlR performs multiple linear regression analysis withresidual analysis. If the analysis is performed on grouped data, the equality of regressionlines can be tested. Regression equations can be computed with or without intercepts. Weighted
least squares is an option.
BMDP2R (Stepwise Regression). P2R performs multiple linear regression analysis with residualanalysis using a forward or backward stepwise variable selection procedure. Regression equations
can be computed with or without intercepts. An option to force in variables is available.Variables can be grouped and considered for entry or deletion as a set. Weighted least squaresis an option.
BMOP3R (Nonlinear Regression). P3R computes least squares or maximum likelihood estimates ofthe parameters of a nonlinear function. One of six built-in functions can be selected;otherwise, the user can specify the function and its derivatives. Upper and lower limits and
linear constraints can be placed on the parameters. Weighted least squares and a residual
analysis are options.
BMDP4R (Regression on Principal Components). P4R performs a stepwise regression analysis
with residual analysis of a criterion on a set of principal components derived from thepredictors. The magnitude of the eigenvalues or the correlations between the criterion andprincipal components can be used to determine the entry order of the components.
BMDP5R (Polynomial Regression). P5R computes least squares estimates of the parameters of apolynomial function in one predictor variable. Weighted least squares is an option.
BMDP6R (Partial Correlation and Multivariate Regression). P6R computes the partialcorrelation coefficients for pairs of variables after removing the linear effects of a set ofpredictor variables. The program is also useful for performing multiple linear regressionanalyses with multiple criteria. Weighted least squares is an option.
BMDP9R (All Possible Subsets Regression). P9R uses the Furnival-Wilson algorithm to identify
the "best" subset of m variables in a regression. The following three measures of "best" areavailable: squared multiple correlation coefficient, adjusted squared multiple correlationcoefficient, and Mallows' Cp. Weighted least squares, a residual analysis, and no-intercept
-models are options.
BMDPAR (Derivative-Free Nonlinear Regression). PAR computes least squares of maximumlikelihood estimates of the parameters of a nonlinear function when the derivatives of the
function are difficult to specify or compute. Upper and lower limits can be placed on theparameters or linear combinations of the parameters. Weighted least squares and a residualanalysis are options.
BMDPLR (Stepwise Logistic Regression). PLR computes maximum likelihood estimates of the
parameters of a linear logistic function. The stepwise variable selection procedure can beperformed in a forward or backward manner.
Class S - Special Programs
BMDPIS (Multipass Transformation). PIS performs multiple passes of the data which can beuseful for transforming or editing the data.
46

BMDP3S (Nonparametric Statistics). P3S computes the sign test, Wilcoxin signed-rank test,-4• Mann-Whitney rank-sum test, Kru:kal-Wallis one-way analysis of variance, Friedman two-way
analysis of variance, Kenda.l's coefficient of concordance, and the Kendall and Spearman rank
correlation coefficient.
Class T - Time Series Analysis
BMDPlT (Univariate and Bivariate Spectral Analysis). Given a time series or pair of timeseries, PIT splits each time series into a sum of sinc waves at different frequencies with adifferent amplitude and phase at each frequency. The program furnishes univarlate summarystatistics and provides extensive plotting options.
BMDP2T (Box-Jenkins Time Series Analysis). P2T is a tool for identifying a model for timeseries data, estimating the parameters of the model, measuring how well the model fits the data,and forecasting future observations. P2T can handle autoregressive-integrated moving average,regression, intervention, and transfer function models.
Class V - Variance Analysis
BMDP1V (One-Way Analysis of Variance and Covariance). PlV performs a one-way analysis of
variance or covariance with residual analysis. It tests whether the group means or adjustedgroup means are equal and whether linear contrasts of group means defined by the task scientist
are equal to zero.
BMDP2V (Analysis of Variance and Covariance, Including Repeated Measures). P2V performs
analyses of variance and covariance for fixed effects models and repeated measures models. Theprogram can handle equal or unequal cell sizes.
BMDP3V (General Mixed Model Analysis of Variance). P3V uses maximum likelihood estimation to
compute analyses of variance for mixed models of unbalanced design. User-specified hypotheses
can be tested.
BMDP4V (Univariate and Multivariate Analysis of Variance and Covariance, Including RepeatedMeasures). P4V performs univariate and multivariate analyses of variance and covariance. The
" program can handle equal or unequal cell sizes, cell weighting, and repeated measures designs.
BMDP8V (General Mixed Model Analysis of Variance - Equal Cell Sizes). P8V performs analyses
of variance for mixed models with equal cell sizes. The Cornfield and Tukey method is used todefine expected mean squares.
Documentation References
Dixon, W.J., & Brown, M. B. (Eds.). (1977). BMDP-77 biomedical computer programs, P-series.Berkeley: University of California Press.
Dixon, W.J., & Brown, M.B. (Eds.). (1979). BMDP-79 biomedical computer programs, P-series.
Berkeley: University of California Press.
Dixon, W.J. (1981). BMDP statistical software 1981. Berkeley, CA: University of CaliforniaPress.
47

Dixon, W.J. (1983). BMDP statistical software 1983 printing with additions). Berkeley:
University of California Press.
Hill, M. (1982). BMDP user's digest (2nd ed.). Los Angeles. BMDP Statistical Software, Inc.
SPSS.- Statistical Package for the Social Sciences
General Description
SPSSx is a system of data management/statistical programs that have been used for a wide
range of applications in the social sciences area. Early developmental work on the package, thenreferred to as SPSS, was conducted at Stanford University. Later work, on the package wasaccomplished at the National Opinion Research Center at the University of Chicago. The followingsubsections contain brief descriptions of the SPSSx programs available in the software library.
List of Programs and Program Descriptions
FREQUENCIES (One-Way Frequency Distributions with Descriptive Statistics). FREQUENCIES
creates one-way frequency tables of counts or percentages, histograms, univariate summarystatistics, and percentiles.
CONDESCRIPTIVE (Descriptive Statistics for Continuous Variables). CONDESCRIPTIVE producesunivariate summary statistics for continuous variables in a more efficient manner thanFREQUENCIES. This procedure also computes standardized scores (Z scores) for variables andcontains options for handling missing values.
CROSSTABS (Contingency Tables and Related Measures of Association). CROSSTABS createsmultiway frequency tables. Tabular values can be expressed as percentages of row totals,percentages of column totals, or percentages of the total frequency. This procedure also
computes expected frequencies and residuals for each cell, tests of independence, and measures ofassociation.
MULT RESPONSE (One-Way and Multiway Frequency Tables). MULT RESPONSE creates one-way andmultiway frequency tables for the analysis of multiple response items. Tabular values for themultiway tables can be expressed as percentages of row totals, percentages of column totals, orpercentages of total frequency. This procedure also contains options for handling missing values.
BREAKDOWN (Summary Statistics for Subpopulations). BREAKDOWN computes univariate summarystatistics for a criterion for various subpopulations defined by one or more predictor variables,a one-way analysis of variance, and a test of linearity. This procedure also contains optionsfor handling missing values.
REPORT (Report Generator). REPORT furnishes the user with flexibility in controlling the
format for displaying case listings, univariate summary statistics in the population andsubpopulations, and frequency tables. Specifically, REPORT allows the user to control pagelengths, margins, column widths, vertical spacing, page titles, footnotes, and labels forvariables.
T TEST (Comparison of Sample Means). T TEST computes univariate summary statistics,Student's t, tests of the equality of group means for independent and paired samples, and ahomogeneity of variances test.
48
* -*\%.. . . . .

ANOVA (Analysis of Variance for Factorial Designs). ANOVA performs univariate analysis of
variance for factorial designs, with an option for including covariates, and tests whether groupmeans are equal. Options are available to print cell means and a multiple classificationanalysis table; to use the experimental, regression, or hierarchical approaches to decompose thesums of squares; and to control the entry order of the variables.
ONEWAY (One-Way Analysis of Variance). ONEWAY performs a one-way analysis of variance, atest of trends across categories, range tests, homogeneity of variance tests, and testing ofuser-specified contrasts. This procedure can also compute univariate summary statistics for eachgroup.
MANOVA (Multivariate Analysis of Variance). MANOVA performs univariate and multivariateanalysis of variance and covariance for a wide range of designs. This procedure can also performmultiple regression, canonical correlation, principal components analysis, and discriminantanalysis.
LOGLINEAR (Development of Log-Linear Models). LOGLINEAR develops models and performshypothesis testing for applications where the major components are categorical variables. Thisprocedure provides maximum likelihood estimates of the parameters, an examination of residuals,and an option for user-specified cell weights.
SCATTERGRAM (Scatter Diagram of Data Points and Simple Regression). SCATTERGRA4 printsbivarlate scatter plots. The regression equations for regressing each variable on the other canbe requested.
PEARSON CORR (Pearson Product-Moment Correlation Coefficients). PEARSON CORR computesPearson product-moment correlation coefficients and tests for their significance, univariatesummary statistics, covariances, and cross-product deviations.
PARTIAL CORR (Partial Correlation Coefficient). PARTIAL CORR computes partial correlationcoefficients and tests for their significance. This procedure also computes univariate summarystatistics for each variable.
REGRESSION (Multiple Linear Regression Analysis). REGRESSION performs multiple linearregression analysis with residual analysis. Several variable selection techniques and regressionthrough the origin are available, and the entry and removal criteria can be specified by theuser. This procedure also computes univariate and bivariate summary statistics.
DISCRIMINANT (Discriminant Analysis). DISCRIMINANT computes a discriminant function,classifies cases, and calculates statistics to evaluate the classification results. Severalvariable selection techniques are available, and the entry and removal criteria can be specified
by the user.
FACTOR (Principal Components/Factor Analysis). FACTOR performs a principal componentsanalysis or a factor analysis. Several factor extraction techniques and rotations (orthogonaland oblique) are available.
NONPAR CORR (Rank-Order Correlation Coefficients. NONPAR CORR computes Spearman's rho andKendall's tau-b rank-order correlation coefficients and tests for their significance. An optionis available to select a random sample of cases.
NPAR TESTS (Nonparametric Tests). NPAR TESTS performs the following nonparametric tests:chi-square one-sample test, Kolmogorov-Smirnov one-sample test, runs test, binomial test, McNemartest, sign test, Wilcoxon matched-pairs signed-ranks test, Cochran's Q test, Friedman test,
Kendall's W coefficient of concordance, two-sample median test, Mann-Whitney U test,
49%.
................... ** * *

,'wv-, w r. v L ' - -' . -: cz-r.--vjr. r.--.. . ... . . .. . . . . . . . . . .. -. . . . .
Kolmogorov-Smirnov two-sample test, Wald-Wolfowitz runs test, Moses test of extreme reactions,k-sample median test, and Kruskal-Wallis one-way analysis of variance test. Options areavailable to print univariate summary statistics and to select a random sample of cases.
BOX-JENKINS (Box-Jenkins Time Series Analysis). The BOX-JENKINS procedure is a tool foridentifying a model for time series data, estimating the parameters of the model, measuring howwell the model fits the data, and forecasting future observations. The observations must beequally spaced over time without missing values. Options are available to take the logarithmicor power transformation of the series and to perform seasonal or nonseasonal differencing.
Autoregressive, moving average, seasonal autoregressive, and seasonal moving average parameterscan be fit.
RELIABILITY (Coefficients of Reliability for Multiple-Item Scales). RELIABILITY computescoefficients of reliability for multiple-item scales using the alpha model, split model, Guttmanmodel, parallel model, or strictly parallel model. This procedure also computes univariate andbivariate item summary statistics and performs the following analyses of variance: single-factorrepeated measures design, two-way factorial design with one observation per cell, two-wayrandomized block design, Friedman's two-way analysis of variance on ranks, and an analysis ofvariance on dichotomous data.
SURVIVAL (Survival Analysis). SURVIVAL prints life tables, plots survival functions(cumulative survival distribution, probability density, and hazard rate), and performs subgroupcomparisons to determine whether they have the same survival distributions.
AGGREGATE (Summary Statistics for Groups of Cases). AGGREGATE produces summary statisticsfor groups of cases.
Documentation References
Hull, C.H., & Nie, N.H. (1981). SPSS update 7-9 - New procedures and facilities for releases*7-9. New York: McGraw-Hill
Klecka, W.R., Nie, N.H., & Hull, C.H. (1975). SPSS primer. New York: McGraw-Hill.
Nie, N.H., Hull, C.H., Jenkins, J.G., Steinbrenner, K., & Bent, D.H. (1975). SPSS - statisticalpackage for the social sciences - (2nd ed.). New York: McGraw-Hill.
Norusis, M.J. (1979). SPSS statistical algorithms - Release 8.0. Chicago: SPSS, Inc.
Norusis, M.J. (1982). SPSS introductory guide: Basic statistics and operations. New York:McGraw-Hill.
Norusis, M.J. (1983). SPSSX: Introductory statistics guide. New York: McGraw-Hill.
Norusis, M.J., & Wang, C.N. (1983). SPSSx statistical algorithms. Chicago, IL: SPSS, Inc.
SPSS x Basics: (1984). New York: McGraw-Hill.
SPSSx User's Guide. (1983). New York: McGraw-Hill.
50
*:**- ,%* - *..*.- * * . * .

STATJOB
General Description
STATJOB is a series of statistical computer programs developed at the University ofWisconsin-Madison Academic Computing Center (MACC) for use on Sperry 1100 series computers. TheAFHRL mathematical and statistical software library contains Version 10 of STATJOB, which was
released In 1976. The following subsections contain brief descriptions of the STATJOB programsavailable in the library.
List of Programs and Program Descriptions
COLFREQI (Single-Column Frequency Counts). COLFREQ1 performs single-column frequency countsof distinct characters.
CROSTAB2 (Data Tabulation). CROSTAB2 creates multiway frequency tables. Several tests ofindependence are available for two-way tables.
DISCRIMI (Discriminant Analysis). DISCRIMI performs a multiple group discriminant analysis
using a stepwise variable selection procedure. The procedure also performs univariate analysesof variance and prints univariate and bivariate summary statistics for each group.
DSTAT2 (Descriptive Statistics and Correlation). DSTAT2 creates a correlation matrix andcomputes univariate summary statistics. An option is available to replace missing values withmean values; otherwise, only cases with complete data on both variables are used.
FACTOR3 (Factor Analysis). FACTOR3 performs six factor analysis techniques (principalcomponents factoring of the correlation matrix, principal components factoring of the covariancematrix, principal factor procedure, rescaling with estimates of uniqueness, alpha, and image) andtwo rotations (varimax and quartimax).
NWAY1 (Analysis of Variance). NWAY1 performs univariate analyses of variance on manydifferent types of designs. The program cannot handle data sets that have one or more missing
* cells. Several options are available to transform the data.
ONEWAY2 (One-Way Analysis of Variance). ONEWAY2 performs a one-way analysis of variance andseveral homogeneity of variance tests. It also tests whether the group means are equal andwhether linear contrasts of group means specified by the task scientist are equal to zero.
PICTI (Scatterplots, Graphs, and Tables). PICTI produces bivariate scatter plots, graphs,and tables. The regression equations for regressing each variable on the other can be requested.
REGAN2 (Multiple Linear Regression Analysis). REGAN2 performs multiple linear regression
analysis using a forward variable selection procedure.
ROTATEI (Factor Rotation). ROTATEI performs factor analytic rotations of a matrix of factorloadings. Several orthogonal and oblique rotations are available.
STEPREG1 (Stepwise Linear Regression Analysis). STEPREGI performs multiple linear regression
analysis using a forward or backward stepwise variable selection procedure.
TRANS1 (Data Transfer). TRANSI sorts data in ascending or descending order or stratifies a
data set based on unique values of a variable.
51
UNISTAT2 (Univariate Description Statistics and Histograms). UNISTAT2 computes univariate
summary statistics and plots histograms.
Documentation References
The following manuals document the input/output and mathematical/statistical methodology tobe used in executing and interpreting the results of the STATJOB programs.
Introduction to STATJOB, Version 10.
STATJOB summary, Version 10.
COLFREQI. (1971, December). Single-column frequency counts.
CROSTAB2. (1975, March). Data tabulation.
DISCRIMI. (1975, March). Discriminant analysis.
-DSTAT2. (1973, September). Descriptive statistics and correlation.
FACTOR3 (1974, May). Factor analysis.
NWAY1 (1971, May). NWAYI for psychologists.
ONEWAY2. (1975, November). One-way analysis of variance.
PICTI. (1976, April). Scatterplots, graphs, and tables, second revision.
REGAN2. (1971, April). Multiple linear regression analysis.
ROTATEl. (1974, November). Factor rotation.
STEPREGI. (1973, August). Stepwise regression analysis.
TRANSI. (1974, December). Data transfer, first revision.
UNISTAT2. (1976, April). Univariate descriptive statistics and histograms.
Basis system procedures. (1970, May).
Extended system procedures. (1972, February).
STJBANK procedures. (1974, October).
Transformation procedures. (1975, October).
52

ASCII CODAP - Comprehensive Occupational Data Analysis Programs(ASCII FORTRAN Version)
General Description
ASCII CODAP is a package of computer programs used to input, process, organize, and reportoccupational data from job inventories. CODAP was developed by the AFHRL in the 1960s andcontains over 50 ASCII FORTRAN computer programs. The current AFHRL package can process 20,000cases, 3,000 task ratings per case, and 1,000 items of background information per case.
, Hierarchical clustering can be performed on up to 7,000 cases. The CODAP system contains sevenbasic types of programs: data quality control, sample identification and selection, individualand group summary report, individual and group comparison, task factor and task module, clusteranalysis, and standard statistical analysis.
CODAP manipulates and reports task-level and biographical survey data gathered from jobincumbents and expert raters for the purpose of identifying and analyzing current job structuresand task characteristics within an occupational area. In this context, a "Job" consists of theset of tasks a job incumbent has selected from a job survey instrument and rated on a "relativetime spent" scale to reflect the work the individual actually performs. When individual jobdescriptions are consolidated and averaged, group Job descriptions are produced. Group Jobdescriptions may consist of job incumbents who responded similarly to one or more biographicalitems, such as skill or grade level, or who responded similarly in terms of tasks performed, asdetermined by the hierarchical clustering of jobs. Jobs can also be described in terms of taskcharacteristics, such as task learning difficulty, strength and stamina requirements, orrecommended training emphasis. Task characteristics are derived from the pooled task ratings ofexpert raters who are senior members of the occupational area surveyed. CODAP procedures focuson the analysis and comparison of individual and group job descriptions and their associatedbiographical data, as well as on individual tasks and task modules and their associatedcharacteristics.
COAP was initially designed to provide a data-based approach for evaluating and updating AirForce enlisted classification structures and redesigning jobs. CODAP has been extended toofficer and civilian occupational classifications. The greatest payoff in the use of CODAP hasbeen in training, where CODAP has provided data that have been instrumental in eliminatingunnecessary training and in pinpointing specific training requirements. CODAP has alsocontributed significantly to the resolution of problems in the areas of personnel utilization,skills management, manpower requirements, aptitude requirements, job evaluation, and person-jobmatch.
List of Programs and Program Descriptions
ASFACT (Reporting Secondary Factor Data). ASFACT reports the following information on eachtask for any group of individuals whose job description has been computed by JOBSPC or JOBGRP:frequency distribution of responses (0 to 9 scale), number of responses within and outside thespecified range, and mean and standard deviation of acceptable responses.
AUTOJT (Automated Job Typing). AUTOJT evaluates between-group differences for pairs of JobDescriptions to aid in determining distinct job types within the hierarchical clusteringprocess. Six comparisons are computed and reported for each pair of job descriptions. Theseinclude differences in percent time spent on each task, percent time spent on each duty, percentmembers performing each task, number of tasks needed to account for a specified percent of totalgroup time, and average number of tasks performed by each group.
53
,A .

IIAVALUE (Average Value for Each Task). AVALUE computes an average value for each task in the
job inventory based on a selected variable for all cases who perform that task. For example,this program might be used to compute the average grade level of the members performing each task.
AVGPCT (Average Value by Percent Performing). AVGPCT computes an average value for each taskin the job inventory based on the percent of members performing the task at each level of theselected variable. In other words, the average will be adjusted to account for unequalmembership within qach interval.
COOAPI (Interface to Input Data to CODAP). CODAPI provides an interface with other data
analysis packages. It takes a COBOL-format file and creates CODAP-compatible data cards.
COOAPX (Interface to Extract Data from CODAP). CODAPX provides an interface with other data
analysis packages. It takes a CODAP History or KPATH file and creates a COBOL-format file.
COIGEN (Composite Factor Generator). COMGEN allows the user to generate a special FORTRANprogram to perform operations on vectors from the Job Description file and produce new compositetask factors.
CORREG (Correlation and Regression of Case Variables). This program extracts up to 100
background and computed variables from a COOAP History or KPATH file, computes a correlationmatrix, and generates solutions to specified regression problems. The correlation part computesand prints the correlation matrix, number of valid cases In the sample, and means and standarddeviations of the sample. A series of regression problems may be solved using an iterative
technique. The standard and raw score weights for each variable are reported, as well as theregression constants.
CORSET (Core Task Analysis and Comparison Program). This program analyzes and compares a set
of group job descriptions ("contextual" groups) in terms of number of core tasks performed,percent members performing and time spent on each core task, and the ability of each core task todiscriminate each group from all other groups in the set. It also computes for each group anoverall measure of within-group overlap called the "core task homogeneity index," an overallmeasure of between-group difference called the "index of average core task discrimination perunit of core task homogeneity," and an asymmetric measure of the extent to which each group inthe set qualifies as a subgroup or supergroup of every other group in the set. If one or moregroups are input to CORSET, together with a "parent" group (i.e., any larger group which subsumesthem, such as the total sample group), CORSET will compute each group's complementary jobdescription and compare the group job description with it.
CURVES (Curve Fitting and Plotting). This program finds the curve of best fit by using
polynomials to predict one variable (Y) from another variable (X). CURVES can plot the curve ofbest fit superimposed on a scattergram of actual observations. At the end of each report, a
summary is printed that includes the means and standard deviations of the input and computedvariables, the correlation matrix, and a regression problem table, Including RSQ, regressionweights, and constant.
DIAGRM (Diagram of Clustering Process). DIAGRM generates a treelike diagram that visually
displays the order in which groups were merged during the hierarchical clustering process. Eachnode of the tree represents one stage of the clustering process and displays the number ofmembers clustered at that stage, the KPATH range defining the cluster membership, the averageoverlap between the two groups merging at that stage, and the average overlap within the combtinedgroup.
54
* 54........................................
*'-' -" ," " S-"" " *"- -"- '" "," '-" ' - ". - ' • " ""' ""* "" " ,' % "
"" " ."'t" "' "' "' "' .- " " "? " " " """ ,

DICTXX (Print Variable Dictionary). DICTXX will provide the user with a list of variabletitles and their respective formats, as defined on the History or KPATH file.
DIST2X (Two-Way Distribution). DIST2X computes and reports a cross-tabulation of values fortwo variables, either computed or background, for specified cases. In addition to cellfrequencies, percentages of row, colum, and/or tota. sample frequencies, as well as row andcolumn means and standard deviations, may be displayed. An additional row or column labeled4OTHER8 may be added to account for values outside the specified limits.
DUVARS (Compute Duty Variables). For each individual case, DUVARS computes the total percenttime spent in each duty, the number of tasks performed in each duty, and/or the percent of anindividual's responses which are performed in each duty. The computations may be stored as newbackground variables on the History or KPATH file.
EXTRCT (Reprinting of Reports). EXTRCT will reprint any report or group of reports saved on
the CODAP Report file during an analysis.
FACCOR (Correlation and Regression of Task Factors). FACCOR will extract up to 100 vectorsof task values (task factors) on the CODAP FACSET file and compute correlation matrices andregression problems. The computations and reports are like those of CORREG.
FACEXT (Factor Extract). FACEXT will extract up to 100 vectors of task values (i. e., taskfactors) on the CODAP FACSET file and write them to a COBOL file. The purpose of this program isto establish an interface to other statistical packages available outside CODAP.
FACGEN (Factor Generator). The purpose of FACGEN is to modify and/or load task factors forfuture processing within the CODUP system. Modifying consists of raising values to a specifiedpower, standardizing to a mean of 5.0 and standard deviation of 1.0, or the substitution ofrescaled or rank-ordered values.
FACPRE (Predicted Factors). FACPRE will apply the regression equations developed by FACCORor CORREG and produce a task factor deck representing the predicted factor. FACPRE also providesinformation as to how well the predicted factor corresponds to the criterion factor.
FACPRT (Task Factor Print Program). This program allows the user to print any of the vectorson the Job Description file. In addition, the program is capable of calculating and reportingdifferences between vectors, maximums or minimums of sets of vectors, cumulative percentages, andcategories of tasks, by using any one of six arithmetic operators. Sequential numbering andsorting of tasks, as well as the insertion of blank columns and print suppression, are under usercontrol. If used, the suppression and category options automatically provide heading linesindicating the limitations being used. Program-Identified task categories may be punched andadded to the Job Description file for future reference. Reports may be produced by task, by taskwithin duty, or by task within module.
FACSTO (Input Standard for Factor Raters). FACSTD creates the CODAP Rater History file. Itsspecifications are similar to those of INPSTD, except that raw task responses are stored insteadof the percent time spent on tasks.
GR4BRS (Group Membership). This program produces a detailed report which describes the twogroups combining at each stage of the hierarchical clustering process. The information reportedincludes stage numbers of merging groups, number of members in the combined group, KPATH range ofthe group members, number of members in each merging group, average overlap between merginggroups, and average overlap within the combined group.
55

GROUP (Hierarchical Clustering). GROUP is the program that actually performs thehierarchical clustering in the CODAP system. At each stage, the two most similar groups areidentified and combined, based on an average linkage clustering algorithm. Once combined, thesimilarity of this composite group with all remaining groups is reassessed. This collapsingprocess is continued until only one group remains. Single and complete linkage clustering
algorithms are available but seldom-used options in GROUP.
GRPDIF (Compute Group Difference Descriptions). This program will compute and report thetask-level differences between two Job descriptions computed by JOBSPC or JOBGRP. Averagepercent time spent by all members or percent members performing each task is used as the basis of
computation. Correlations between the average percent time spent vectors and between the percentmembers performing vectors may also be obtained.
GRPSUM (Summarizing Job Descriptions). GRPSUM calculates and prints a report of either thepercent of members performing each task in the job inventory or the average percent time spent oneach task by all members for any number of groups whose composite job descriptions were computedby JOBGRP or JOBSPC. The summarized data are printed in task number order and the groupdescriptions are ordered according to the sequence of the input request cards.
INPSTD (Input Standard for Job Incumbents). INPSTD creates the standard CODAP History file.This program stores percent time spent computed from raw relative time spent responses.Duty/Task title cards and History variable definitions are combined with the case data andreorganized in History file format. INPSTD will accept 20,000 cases, 3,000 task ratings, 6,000characters of History data per ca-), and 26 duty categories.
JOBGRP (Compute Stage Job Descriptions). Given a stage number from the hierarchicalclustering process, this program identifies all members in the group formed at that stage andcomputes a composite job description for those cases.
JOBIND (Print Individual Job Descriptions). This program prints a job description withspecified-background information for each individual in a selected group.
JOBPRT (Job Description Print Program). This program prints job descriptions computed byJOBSPC or JOBGRP. They may be ordered by task, task within duty, or by task module.
JOBSPC (Compute Special Job Descriptions). Given the membership criteria in terms ofcomputed or background variables, this program identifies all cases meeting these requirementsand computes a composite job description for that group.
JOBSXX (Audit Job Description). JOBSXX is designed to compute and print a job descriptionfor all cases on a History or KPATH file in three different sort sequences.
KPATH (Create KPATH File). This program will resequence cases on the History file in such away that those cases or groups of cases which merged at each stage of the hierarchical clustering
process will be positioned adjacently.
MEMVAR (Create Membership Variables). This program will create dichotomous computedvariables representing membership in specified groups or samples. Membership is determined by
using request cards created by JOBSPC or JOBGRP.
MODSXX (Audit Module Definitions). MODSXX will print a task listing ordered by modulecategories. Tasks not included in any module description will be placed in a module called"Tasks Not Referenced" and printed at the end of the report.
56
---r -* e-
-A .'~*- *,*%* L.,~ &L..J. *-~ ., -. * 7

MTXPRT (Print Overlap Matrix). This program computes the overlap between all pairs of input
composite job descriptions and reports these values in matrix form. Overlap may be computed in
terms of average percent time spent on tasks or in terms of the number of tasks performed in
comon.
O VRLAP (Overlap of Response Patterns). OVRLAP calculates the similarity between all pairs of
cases on the History file. The data are arranged into a matrix format for processing by theGROUP program. History files of 7,000 cases or less may be input to this program.
PLOTIT (Plot a Task Factor Histogram). This program accepts an input task factor, defines
intervals, and plots a histogram showing the frequency distribution of values.
PLTVAL (Plot Mean and Standard Deviation Values). PLTVAL is designed to produce a plot of
the means and standard deviations of a background or computed variable for a set of groupscomputed by JOBSP or JOBGRP.
PRIJOB (Select Primary Job Identifiers). This program prints a report of those tasks that
are "prlmary Identifiers" of each group In a set of selected groups and aligns these groups in asingle report that allows across-group comparisons on each task that is a primary identifier for
at least one of the groups. Primary identifiers may be defined as the top X-number of tasks in agroup job description in terms of percent of members performing or average percent time spent by
all members, or all tasks which meet or exceed a minimum value on one of these two percentages.
PROGEN (Program Generator). PROGEN generates a FORTRAN program from high-level commands andstandard FORTRAN statements to perform various operations on the History or KPATH file. Itsprimary use is to add new computed or history variables to the appropriate file.
PRTVAR (Print Variable Valups). PRTVAR will print the values of selected variables for allcases on the History or KPATH file. The cases can be ordered on any case variable, althoughKPATH orler is the one most often used.
RANSEL (Random Case Selection). RANSEL will produce a membership identification vector
usable as input to the program SUBSET. Given the membership vector from a job description, thisprogram will randomly select a specified number or percentage of cases from that vector.
REXALL (Interrater Reliabilityl. When tasks are rated by a sample of experts on task factors
such as "learning difficulty" or "recommended training emphasis," REXALL is used to compute andreport measures of interrater agreement (reliability) based on raw or adjusted ratings. The
average tntraclass correlation coefficients for a single rater and for the sample composite are
reported. Also reported are the mean and standard deviation of the ratings for each task. In
addition, REXALL can identify and remove divergent raters from all computations.
SETCHK (Check Sets of Raw Data Cards). SETCIIK edits the raw data which will be input to theprogram INPSTD. Only cases with complete data are kept for further processing.
SUBSET (Create a Subset Hlstory/KPATH File). SUBSET will create a new History/KPATH filecontaining only those members defined by a composite job description.
TASKXX (Print Duty and Task Titles). TASKXX is designed to print a list of the duty and task
titles entered in the INPSTO program.
TSKNDX (Task Index). TSKNOX computes and prints the following information for tasks
performed by a selected group of members: task titles, mean rating value (Task Index), percentof members performing, average percent time spent by members performing, average percent time
spent by all members, and cumulative sum of average percent time spent by all members.
57
%% . %.: "i.) I ' % " :.L -% i ' ' I9 ' - l: ifl ' e "Ill " . % - " " ' " %'" % ,l t " 1 : t

_.7 -W 7 F T. -7 WT
VARGEN (Variable Generator). VARGEN will compute new variables for every case on the History
or KPATH file based on the individual's task response data. Frequently computed variables are:average task difficulty per unit time spent (ATDPUTS) for the Individual's job description,overlap of an individual's time spent with a given job description, and sum of time spent by anindividual on a specified set of tasks. VARGEN can compute the sum of absolute differences, sumof squared differences, and Pearson product-moment correlation between an individual's set oftask ratings and a given set of task values.
VARSUM (Variable Sumary). VARSUM computes and prints frequency distributions for specifiedintervals, reports total frequency counts, and calculates means and standard deviations onselected background and computed variables for groups of individuals whose Job descriptions havebeen generated by JOBSPC or JOBGiP.
VARPCT (Variable Percent Sumary). VARPCT is similar to VARSSUN, except that percentages arereported in place of frequency counts.
VARSXX (Variable Value Audit Distribution). VARSXX produces a listing of the raw backgrounditem or task responses made by all cases on a History or KPATH file. This output is very usefulfor establishing variable specifications for the VARSUM and JOBSPC programs. It is also used toaudit the History file after INPSTD has been run.
Documentation References
CODP Applications Support Section. CODAP: Comprehensive data analysis programs: An automated
report. Brooks AFB, TX: Technical Services Division, Air Force Human Resources Laboratory.
The above report is in an automated form retrievable by those having access to the AFHRLSPERRY 1100/81 computer system. The report retrieval command is: @Z*CODAP.DOC. This report
contains the most current CODAP documentation. Reports of individual programs may also be
obtained via this command.
58.

4
.1
* , 4~ *
................................................