Mathematical Analysis of Data - University of Malta · Mathematical Analysis of Data SC v1...
8
Mathematical Analysis of Data SC v1 24.04.2015 Page 1 UNIVERSITY OF MALTA L-Università ta’ Malta re 1 SIMS – Mathematical Analysis of Data Student Information Management System (SIMS) Office of the Registrar Version 1 SC 24.04.2015
Transcript of Mathematical Analysis of Data - University of Malta · Mathematical Analysis of Data SC v1...

Mathematical Analysis of Data
SC v1 24.04.2015 Page 1
UNIVERSITY OF MALTA L-Università ta’ Malta
re 1
SIMS – Mathematical
Analysis of Data
Student Information Management System (SIMS)
Office of the Registrar
Version 1 SC 24.04.2015
Mathematical Analysis of Data
SC v1 24.04.2015 Page 2
Table of Contents
1.0 Mathematical Quick Analysis and Cross Reference Analysis .................................. 3
1.1 Quick Analysis .................................................................................................... 3
1.2 Cross Reference Analysis .................................................................................... 7
Mathematical Analysis of Data
SC v1 24.04.2015 Page 3
STUDENT INFORMATION MANAGEMENT SYSTEM OFFICE OF THE REGISTRAR
SIMS – Mathematical Analysis of Data
This document is aimed to introduce the SIMS user to system tools available in order to carry out
basic mathematical analysis of data on SIMS.
1.0 Mathematical Quick Analysis and Cross Reference Analysis SIMS allows you to perform basic mathematical analysis and cross referencing of values in fields.
Such analysis may then be exported for further evaluation and use.
1.1 Quick Analysis The Quick Analysis tool may be accessed via the Misc menu then Quick Analysis. Note that prior to
accessing this option you are required to access the relevant table and retrieve the records on which
you wish to perform the mathematical analysis.
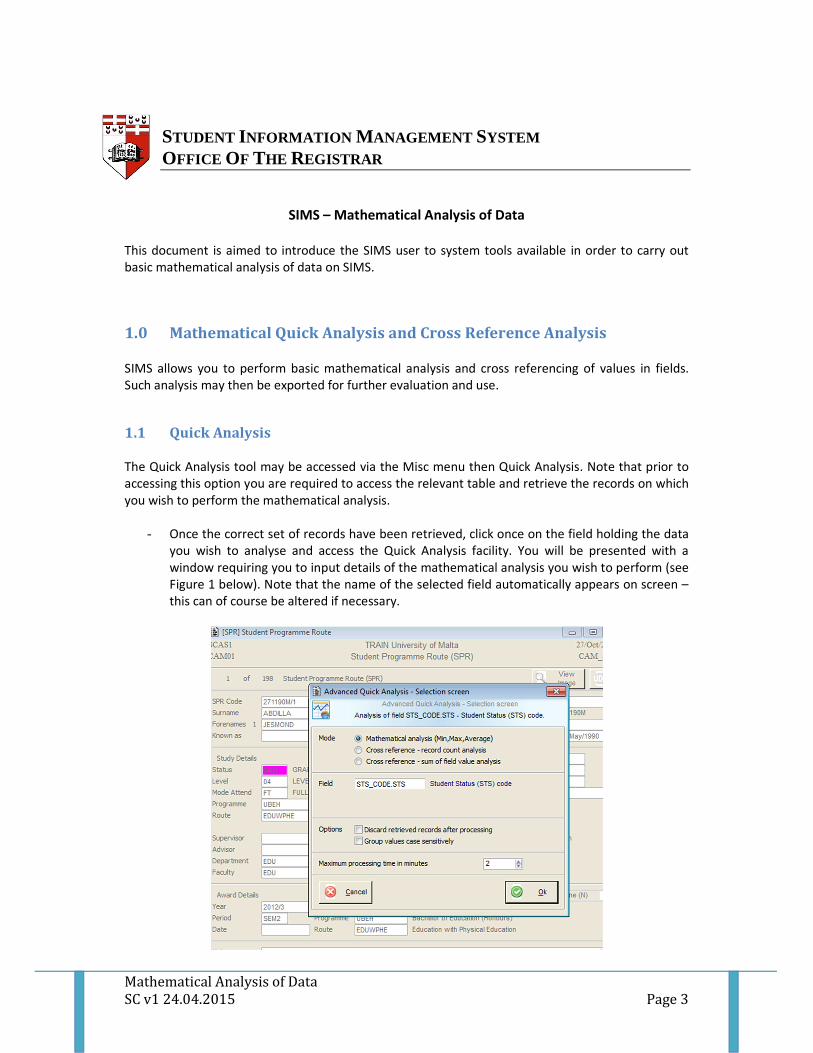
- Once the correct set of records have been retrieved, click once on the field holding the data
you wish to analyse and access the Quick Analysis facility. You will be presented with a
window requiring you to input details of the mathematical analysis you wish to perform (see
Figure 1 below). Note that the name of the selected field automatically appears on screen –
this can of course be altered if necessary.

Mathematical Analysis of Data
SC v1 24.04.2015 Page 4
Fig. 1 – Performing a Mathematical Analysis on a Set of Data
- Leave Mode as ‘Mathematical analysis (Min, Max, Average)’.
- Check that the name of the Field indicated is indeed the field on which you wish to perform
the analysis.
- Click OK.
This analysis will return details of the status of the cohort of students retrieved as shown below.
Note that the field on which the analysis was conducted is displayed on the top left side of the
screen.
Fig. 2 – Sample Quick Analysis Results
The sample analysis in the screen shot above displays the number of records together with the
relative percentage of students whose status is CPR, CUR, GRD or WDR. This data is also provided in
visual mode via a number of charts available in the section to the right of the screen. To the left the
following details (where applicable) are also displayed:
Total Records A count of the total number of records on which the analysis was performed.
Unique Records A count of the number of values including blank, text and date values.
Total Values A count of the total number of values.
Unique Values A count of the number of unique values. This only includes unique numeric
values, all other values are ignored.
Minimum Value The minimum value in the selected field. Note that blank values are taken as
minimum values and hence it would be useful if blank records are dropped
prior to performing the Quick Analysis. Also numeric values are taken to have
a lesser value than text values. This function does not recognize dates as
dates and consequently returns the lowest value text date.
Maximum Value The maximum value in the target field. Like the minimum value above, this
function does not recognize dates.
Total Value The sum of the values in the target field. This function only includes numeric
values – other values are excluded.
Average Value The average of numeric values in the target field. This function includes only

Mathematical Analysis of Data
SC v1 24.04.2015 Page 5
numeric values – other values are excluded.
St. Dev (Sample)
or St. Dev.
(Population)
The standard deviation taking into consideration all numeric values in the
selected field. Other value types are ignored.
The standard deviation can be chosen to be calculated by two methods
namely either Sample or Population.
Median Value The median value in the target field across all selected records.
Mode Value The mode (most common) value. Non numeric values are ignored.
Mode Frequency Returns the count of the mode, if existent.
Sort Value as The following are valid sort values that can be selected from the drop down
list:
String
Number
Date
Time
Date / Time
The default value is taken to be the field type of the target field.
Fig. 3 – Quick Analysis Calculation Details
The second example overleaf demonstrates a mathematical analysis on the age field on STU for a
cohort of students. In this example, the mathematical calculations displayed on the left pane of the
screen are useful.
Fig. 4 – Quick Analysis Results with Bar Chart (Sample 2) Note that the various charts available can be accessed by clicking on the appropriate tab located
within the pane to the right of the screen. The screen shot above demonstrates the data in a bar
chart whilst the example below demonstrates the same data as a pie chart.
Mathematical Analysis of Data
SC v1 24.04.2015 Page 6
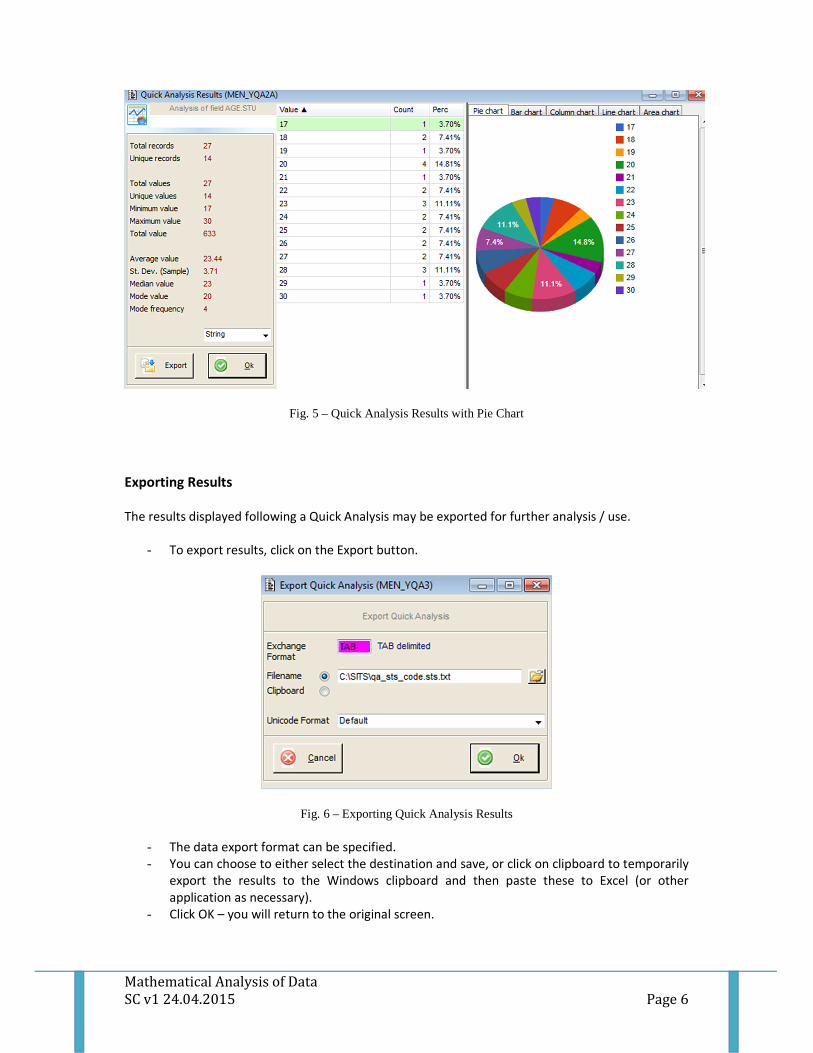
Fig. 5 – Quick Analysis Results with Pie Chart Exporting Results
The results displayed following a Quick Analysis may be exported for further analysis / use.
- To export results, click on the Export button.
Fig. 6 – Exporting Quick Analysis Results
- The data export format can be specified.
- You can choose to either select the destination and save, or click on clipboard to temporarily
export the results to the Windows clipboard and then paste these to Excel (or other
application as necessary).
- Click OK – you will return to the original screen.

Mathematical Analysis of Data
SC v1 24.04.2015 Page 7
Note that it is not possible to extract the charts when exporting Quick Analysis data. If the chart is
required users may take a screen shot and use as necessary.
1.2 Cross Reference Analysis A cross reference analysis allows for the possibility to perform a cross tabulation, showing values
held in two fields.
The first steps required to perform a Cross Reference Analysis are the same as for the Quick Analysis
calculations described in the previous section.
- Retrieve the set of records on which you wish to carry out the Cross Reference Analysis.
- Place the cursor on the first field you wish to include in the analysis.
- Select Misc > Quick Analysis
- On the Advanced Quick Analysis – Selection Screen select ‘Cross reference – record count
analysis’ by clicking on the corresponding radio button.
Fig. 7 – Cross Reference Analysis
- You will notice that the Row Field has already been populated with the name of the field you
had placed the cursor on in step 2 above.
- In the Col. Field enter the name of the field containing the second set of data you wish to
analyse. (If you do not know the name of the field, click on the field on the respective table
and press the F1 button.) A list of fields can also be obtained by pressing the F2 button on
the Col. Field.
- Click on the OK button.
In the example below we will analyse a set of SPR records. The cross reference will be between the
Programme and Route fields.
Mathematical Analysis of Data
SC v1 24.04.2015 Page 8
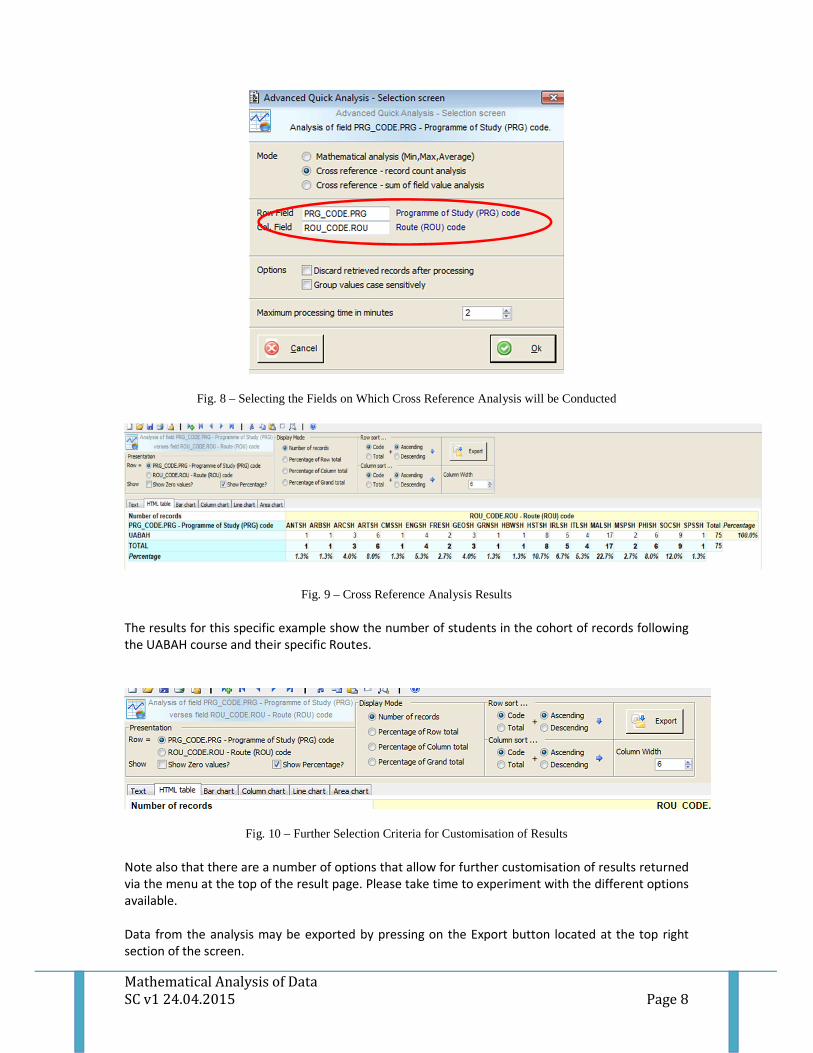
Fig. 8 – Selecting the Fields on Which Cross Reference Analysis will be Conducted
Fig. 9 – Cross Reference Analysis Results
The results for this specific example show the number of students in the cohort of records following
the UABAH course and their specific Routes.
Fig. 10 – Further Selection Criteria for Customisation of Results
Note also that there are a number of options that allow for further customisation of results returned
via the menu at the top of the result page. Please take time to experiment with the different options
available.
Data from the analysis may be exported by pressing on the Export button located at the top right
section of the screen.


![MATLAB Mathematical Analysis [2014]](https://static.fdocuments.us/doc/165x107/56d6c06e1a28ab30169a5bff/matlab-mathematical-analysis-2014.jpg)