Math Study Note Cards. Lateral Area (area around shape) Don’t cover the bases Bases Area Base area...
107
Math Study Note Cards
-
Upload
virgil-allison -
Category
Documents
-
view
215 -
download
0
Transcript of Math Study Note Cards. Lateral Area (area around shape) Don’t cover the bases Bases Area Base area...

MathStudy Note
Cards


Lateral Area(area around shape)
Don’t cover the bases
Bases AreaBase area only
Total Surface AreaCover ALL area
+ =
Rule of Thumb: 1st shade the base

ECI
MAL
ERCENT

.Decimal
Decimal
Percent
Percent.
.89 89%
.08 8%

3 , -48, -38
6, 18, -52

Negative Numbers:the farther the
negative # from zerothe less value it has
-8 -7 -6 -5 -4 -3 -2 -1 0 1 2 3 4 5 6 7 8
Negative Positive


Always convert % into
Decimal 1st

# # #
#
=

Cross Products


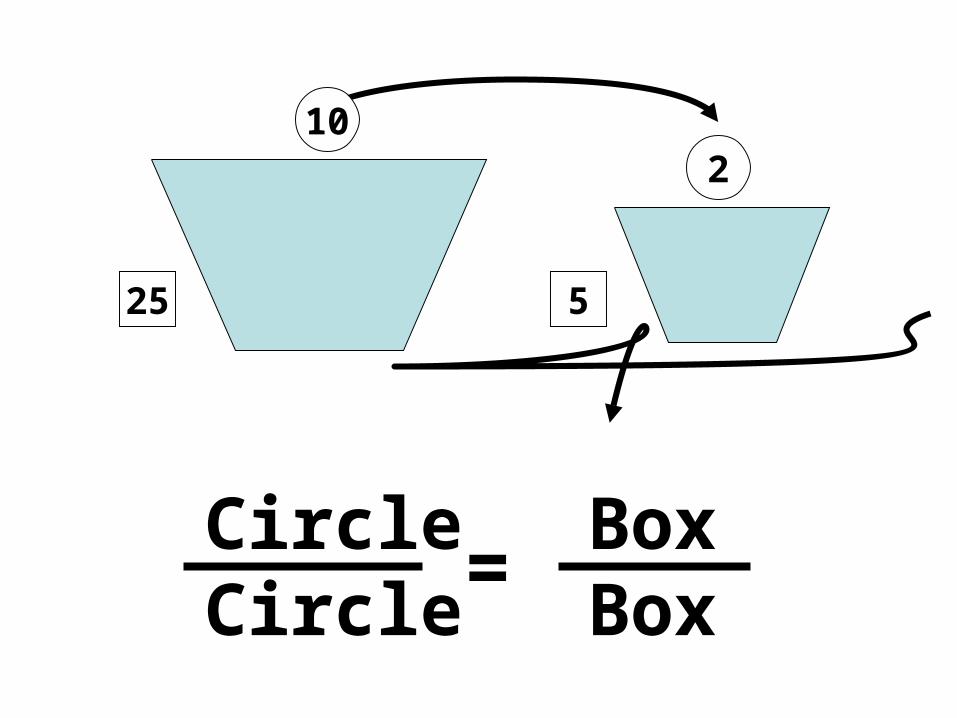
Cut in half to get radius
d r

102
Circle BoxCircle Box=
525


TIBO
TOP
IN
BOTTOM
OUT
NIDO
NUMERATOR
IN
DENOMINATOR
OUT


x and ÷
+
Negative Negative
Positive


PartTotal


What You WantTotal Possibility
“AND” Multiply Fractions “OR” Add Fractions


Scale Factor = NewOld
big figure to small figure = # less than 1
small figure to big figure = # more than 1


Question is Fill the box
1st shade base
Length x width x height

> <


P E M D A SARENTHESIS
( )
XPONENTS
52
ULTIPLY
x
IVIDE
÷
DDITION
+
SUBTRACT
-Use which ever
comes first Use which evercomes first


Align decimalsadd any extra zeros to the right
then compare the #s
11.7, 11.77, 11.07 11.7011.7711.07


Money always goes on top
Time is always on the bottom
$ $time time
=

AddAround
Walk Around
**Cannot Walk UP**
Start andEnd here


Circumferenceof a circle
2πr or πd


Think $$$$
4.6 = $4.60


÷Divide


3 candies for $1.00
each is .33


37
means to divide
3 divided by 7

(4,3)
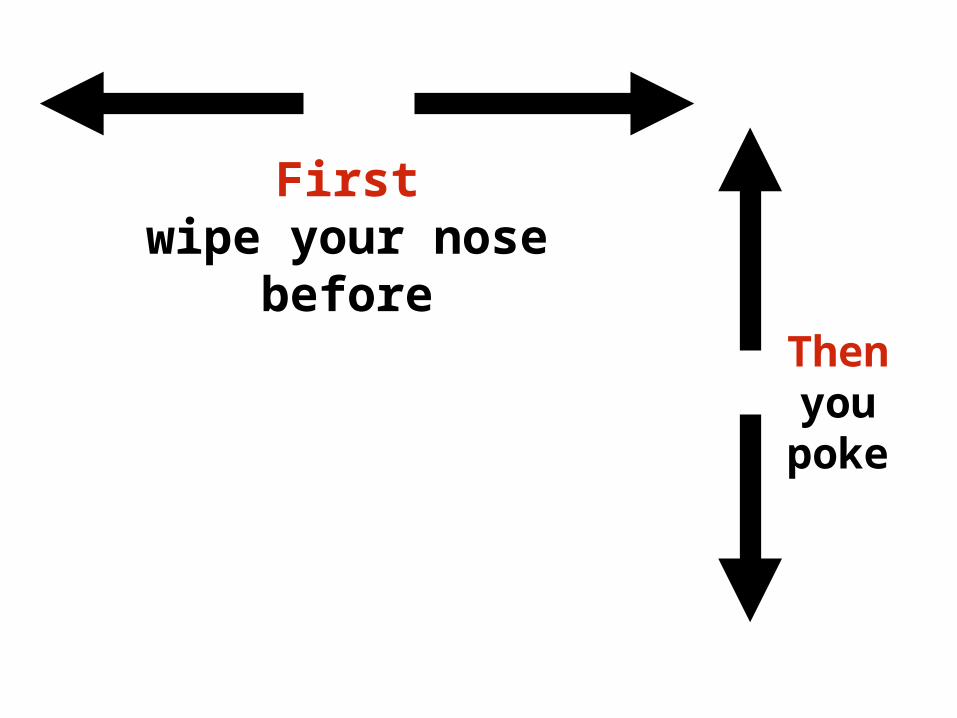
Firstwipe your nose before
Thenyou
poke


subtract


negativenumbers


add


part %total 100
total+ partHow much you pay
=
ADD


part %total 100
total partHow much you pay
=
SUBTRACT

a c
b

TRIPLES that you need to remember
3, 4, 56, 8, 10
5, 12, 139, 40, 41
30, 40, 50

a c
b

1st shade right angle (box)
point arrow across
c = longest side and the biggest #


Average
add all the #s
divide by how many #s you added
1 + 2 + 3 = 6
6 ÷ 3 = 2


Arrange #sBig
Small
BIG # SMALL # Range


Arrange #sBig
Small
MostCommon #


Arrange #sBig
Small
Middle #
If you have 2 #s
#+ # then ÷ by 2


on theX-axis

same toptosame bottom
flip up or flip down
X
Y


SLIDE1st---left or right
2nd---up or down


PER ONE ITEM
÷


Clean AreaCover AllMultiply

Find the side

Need to find the square root


Round to the nearest 10
Ex: 57 60 432 430 31 30

4.86 x 10

if exponent is positive #move decimal to the right
if exponent is negative #move decimal to the left
10
10

Change To

Question to ask yourself ??
Is the # more than $1.00??
Yes exponent positive
No exponent negative


When expression is given --substitute n with 1 , 2 , 3 , 4
EX: 3n + 4 3(1) + 4 = 7 3(2) + 4 = 10 3(3) + 4 = 13 3(4) + 4 = 16


Draw the chart or box
find the difference (subtract) difference (n) -----#n
1 2 3 4 n


Use a line graph to show
how data changes over a period of time


Use a line plot to show
Frequency of values


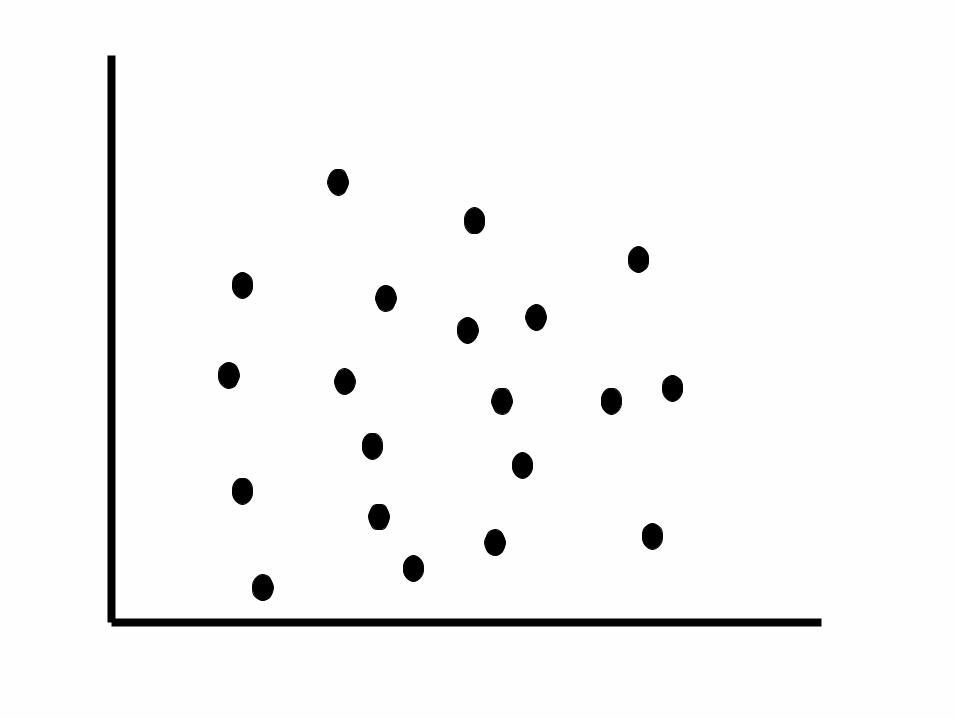
A graph with points plotted
to show
possible relationship between two sets of data

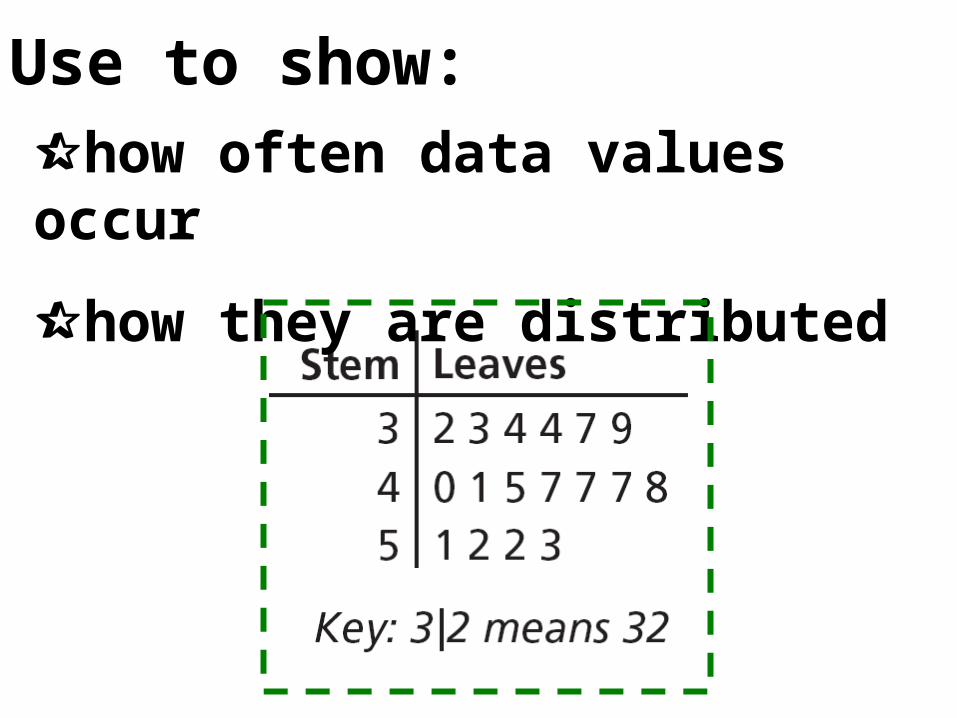
Use to show:how often data values occur
how they are distributed