Math Self-efficacy 1 Running head: SELF-EFFICACY …rap.ucr.edu/efficacy.pdfMath Self-efficacy 2...
46
Math Self-efficacy 1 Running head: SELF-EFFICACY AND STANDARDIZED TEST PERFORMANCE Accepted for publication in the Journal of Educational Psychology. This version may slightly differ from the published version. Does Math Self-efficacy Mediate the Effect of the Perceived Classroom Environment on Standardized Math Test Performance? Lisa A. Fast University of California, Riverside James Lewis University of California, Riverside Michael J. Bryant California Institute of the Arts Kathleen A. Bocian University of California, Riverside Richard A. Cardullo University of California, Riverside Michael Rettig University of California, Riverside Kimberly A. Hammond University of California, Riverside
Transcript of Math Self-efficacy 1 Running head: SELF-EFFICACY …rap.ucr.edu/efficacy.pdfMath Self-efficacy 2...
Math Self-efficacy 1
Running head: SELF-EFFICACY AND STANDARDIZED TEST PERFORMANCE
Accepted for publication in the Journal of Educational Psychology.
This version may slightly differ from the published version.
Does Math Self-efficacy Mediate the Effect of the Perceived Classroom
Environment on Standardized Math Test Performance?
Lisa A. Fast
University of California, Riverside
James Lewis
University of California, Riverside
Michael J. Bryant
California Institute of the Arts
Kathleen A. Bocian
University of California, Riverside
Richard A. Cardullo
University of California, Riverside
Michael Rettig
University of California, Riverside
Kimberly A. Hammond
University of California, Riverside
Math Self-efficacy 2
Abstract
We examined the effect of the perceived classroom environment on math self-efficacy
and the effect of math self-efficacy on standardized math test performance. Upper
elementary school students (n = 1163) provided self-reports of their perceived math self-
efficacy and the degree to which their math classroom environment was mastery-
oriented, challenging, and caring. Individual student scores on the California Standards
Test for Mathematics were also collected. A series of two-level models revealed that
students who perceived their classroom environments as more caring, challenging, and
mastery-oriented had significantly higher levels of math efficacy, and higher levels of
math efficacy positively predicted math performance. Analysis of the indirect effects of
classroom variables on math performance indicated a small significant mediating effect
of self-efficacy. Implications for research on self-efficacy and the perceived classroom
environment are discussed.

Math Self-efficacy 3
Does Math Self-efficacy Mediate the Effect of the Perceived Classroom
Environment on Standardized Math Test Performance?
In the current high-stakes testing environment, any attribute of a student that
positively influences achievement is of interest. The degree to which a student believes
that he/she is capable of performing specific tasks, referred to as self-efficacy, is
particularly relevant given that self-efficacy has been argued to have powerful effects on
achievement behavior (Bandura, 1986). Those with higher self-efficacy are proposed to
have higher aspirations, stronger commitments to their goals, and recover more quickly
from setbacks than those lower in self-efficacy. Beliefs in one’s efficacy can vary across
academic subjects (e.g. reading vs. writing) and self-efficacy for mathematics has
received close attention. Students with higher math self-efficacy persist longer on
difficult math problems and are more accurate in math computations than those lower in
math self-efficacy (Collins, 1982; Hoffman & Schraw, 2009). Math self-efficacy is also
a stronger predictor of math performance than either math anxiety or previous math
experience (Pajares & Miller, 1994; Pajares & Miller, 1995, respectively) and influences
math performance as strongly as overall mental ability (Pajares & Kranzler, 1995).
The demonstrated importance of self-efficacy in academic achievement has
provoked widespread interest in specific factors that affect a student’s self-efficacy
beliefs. Bandura’s (1997) social-cognitive theory proposed that self-efficacy is most
strongly affected by one’s previous performance and research largely supports this (Chen
& Zimmerman, 2007). His theory also suggests that self-efficacy is affected by
observing others (e.g. watching peers succeed at a task), verbal persuasion (e.g.
encouragement from parents and teachers), and interpretation of physiological states (e.g.
Math Self-efficacy 4
lack of anxiety may be a signal that one possesses skills). Although several studies
indicate that manipulating features of learning environments along these theoretical
premises has immediate and detectable effects on self-efficacy (Schunk, 1982, 1983,
1984; Schunk & Hanson, 1985), it seems possible that students’ perceptions of their
learning environments also affect their efficacy beliefs. Ames (1992) argued that
learning environments may not provide a common experience for all students and that
students’ subjective interpretations of their environment determine how they respond to
it. For example, a teacher might be described by an objective observer as helpful, but if a
student perceives him/her as unhelpful, then the perception of unhelpfulness will guide
the students’ behavior more than the teachers’ actual helpfulness. Focusing on
perceptions of the classroom environment is consistent with Bandura’s (1997) theory,
which suggests that self-efficacy is influenced by how an individual interprets relevant
information. For example, a student might interpret a perceived unhelpful teacher as
evidence that he/she lacks ability. In the current study, we focus on three aspects of the
perceived classroom environment that affect self-efficacy: Mastery-orientation,
Challenge, and Caring.
The degree to which students perceive their classroom environment as one that
encourages mastery versus performance goals has been prominently studied (Ames,
1992; Dweck, 1986; Maehr & Nicholls, 1980, respectively). Classrooms structured
around mastery goals emphasize effort and the intrinsic value of learning; students who
adopt mastery goals are more likely to believe that effort leads to success (Weiner, 1979)
and display positive attitudes towards learning (Ames & Archer, 1988). In contrast,
classrooms structured around performance goals emphasize ability and competition

Math Self-efficacy 5
between peers; students who adopt performance goals are more likely to use shallow
learning strategies (Meece et al., 1988) and avoid challenging tasks (Dweck, 1986).
Although both of these classroom goal structures theoretically influence the achievement
goals that students adopt, only mastery goal structures are consistently related to self-
efficacy. Several studies have found that students who perceive their classroom
environment as more mastery oriented have higher academic self-efficacy (Dorman,
2001; Friedel et al., 2007; Middleton & Midgley, 1997), whereas performance oriented
classrooms have been found to be unrelated, positively related, and negatively related to
self-efficacy (Friedel et al., 2007; Wolters et al., 1996; Schunk, 1996, respectively).
Studies using path analysis have also found that self-efficacy mediates the influence of
mastery-oriented classrooms on performance (Bong, 2008; Greene, Miller, Crowson,
Duke, & Akey, 2004). In particular, Wolters (2004) found that mastery goal structure
had a significant positive effect on students’ math grades, but when math self-efficacy
was included in the model, the effect of mastery structure on course grades became non-
significant.
The degree to which a classroom environment is perceived as challenging also
influences self-efficacy. A challenging environment is one in which students are
provided with progressively difficult tasks as their proficiency increases. Vygotsky
(1978) argued that challenge is essential for intellectual development and Grolnick et al.
(2002) proposed that individuals are born with a need to test their abilities and master
their environment. Accordingly, evidence indicates that students enjoy learning when
tasks are challenging (Zahorik, 1996). Although challenge has been most prominently
discussed as an important facilitator of intrinsic motivation (e.g. Malone & Lepper,
Math Self-efficacy 6
1987), some researchers suggest that it also leads to stronger beliefs in one’s academic
abilities (Meyer, Turner, & Spencer, 1997; Stipek, 2001). Participating in challenging
activities allows students to notice their incremental improvement in a subject, which
increases feelings of self-competence. In support of this, Gentry and Owen (2004)
reported that middle and high school students who perceived their classroom as
challenging were more likely to have higher academic self-efficacy. Similarly, Meyer,
Turner, & Spencer (1997) found that fifth and sixth-grade students who were
characterized as “challenge-seekers” had higher math self-efficacy, while students who
were characterized as “challenge-avoiders’ had lower math self-efficacy.
Finally, the degree to which students perceive their classroom as a caring
environment also has an important influence on self-efficacy. In a caring classroom (also
referred to as Teacher Involvement: Newman, 2002; Personalization: Frasier & Fisher,
1982), the teacher expresses personal interest in students, provides emotional support,
and generally creates a comfortable atmosphere. Murdock and Miller (2003) suggest that
students who perceive their teachers as caring are more likely to view themselves as
academically capable and set higher educational goals for themselves. Positive
relationships between students and teachers provide a critical developmental resource for
children; students are more likely to seek help when they need it and develop a wide
range of competencies when they feel emotionally supported by their teachers (Crosnoe,
Johnson, & Elder, 2004; Pianta, Hamre, & Stuhlman, 2003). Accordingly, evidence
suggests that students who perceive their teachers as more caring have significantly
higher academic self-efficacy (Murdock & Miller, 200; Patrick et al., 2007). Pianta et al.
(2008) also found that fifth-grade students had higher performance on math tests when
Math Self-efficacy 7
their classrooms were rated higher in emotional support. In addition, the effect of
emotional support on math achievement was larger than the effect of quantity of math
instruction. The authors noted that, “this is especially interesting because math is perhaps
not a subject where teacher-student relations are as much a focus,” (Pianta et al., 2008,
p.389).
In summary, math self-efficacy appears to play an important role in math
achievement and mediates the influence of mastery-oriented classroom environments on
math achievement. Global academic self-efficacy also seems to be positively affected by
caring and challenging classroom environments. However, several issues remain unclear.
Little is known either about the influence of caring and challenging classroom
environments specifically on math self-efficacy or whether math self-efficacy mediates
the influence of challenging and caring classroom environments on math achievement.
Further, virtually nothing is known about the relationships between math self-efficacy,
perceived classroom environment, and achievement in the context of standardized math
test performance.
These are important gaps in the literature in light of the No Child Left Behind
(NCLB) Act of 2002 that requires all students to take standardized math tests annually in
grades 3 through 8 and once during high school. Scores on these tests are increasingly
being used for “high-stakes” purposes that affect both students and teachers. According
to the National Center for Fair and Open Testing (2007), standardized test scores of
fourth, fifth, and sixth graders can be used for the following purposes in California: to
place students into instructional groups (e.g. remedial or special education programs),
determine school eligibility for federal funding, make decisions about whether principals,

Math Self-efficacy 8
teachers, and staff are offered continued employment, and determine whether or not
teachers get bonuses. Several researchers have argued that the implementation of NCLB
has led to a focus on testing and evaluation that permeates the school environment
(Meece, Anderman, & Anderman, 2006; Ryan et al., 2007). It is important to examine
how student motivation (e.g. self-efficacy) and classroom environments are related to one
another in this legislated performance-oriented environment.
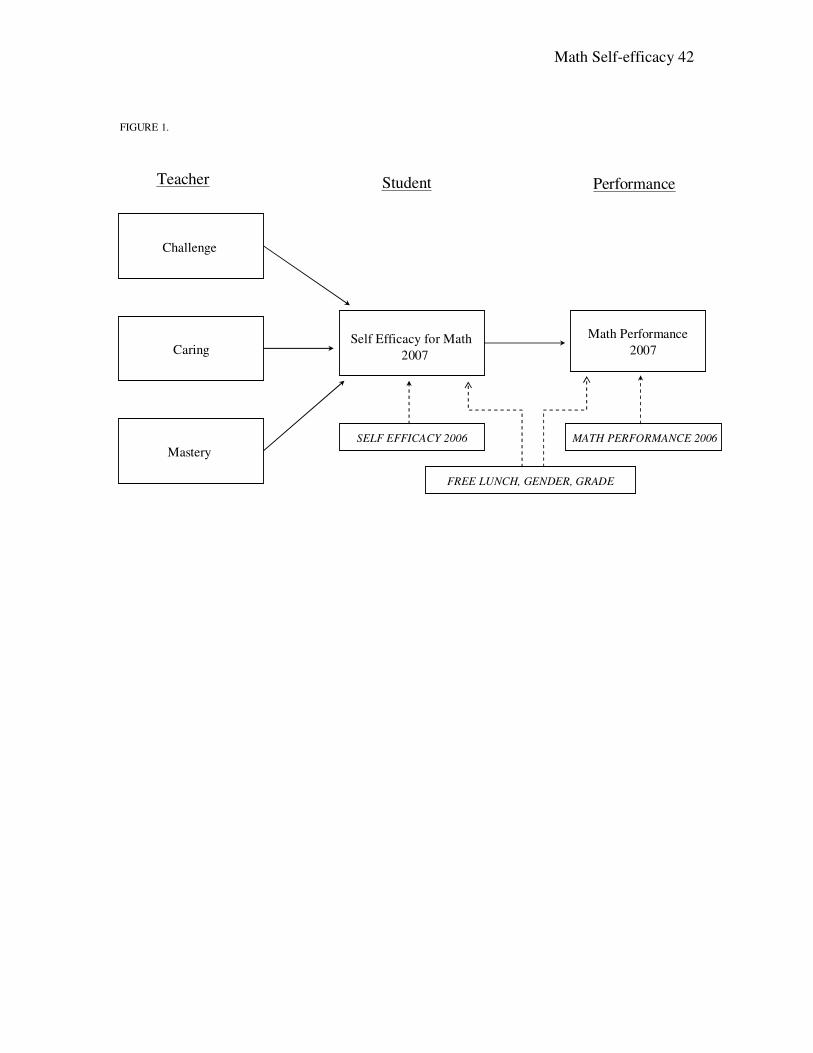
In the current study, we predicted that math self-efficacy mediates the influence
the perceived of classroom environment on standardized math test performance (Figure
1). Specifically, we predict that students’ perceptions of the degree to which their
classroom environment is mastery-oriented, challenging, and caring has a direct and
positive influence on math self-efficacy, and math self-efficacy has a direct and positive
effect on student performance on standardized math tests. Each of these three aspects of
the classroom environment will positively affect self-efficacy for the following reasons.
Mastery-orientation will have a positive influence on math self-efficacy because
environments that encourage students to take pride in their effort and value learning for
its own sake, rather than simply emphasize the importance of good grades, will allow
students to feel more confident in their ability. Challenge will also be associated with
higher math self-efficacy because being afforded the opportunity to progressively master
tasks that are slightly beyond one’s current capacity allows a student to observe his/her
own progress and gradually increase beliefs in his/her ability. Finally, caring will have a
positive influence on math self-efficacy because Bandura (1993) argued that affective
processes affect self-efficacy. In particular, environments that arouse anxiety and other
negative emotions have a negative affect on efficacy beliefs (Usher, 2009). We
Math Self-efficacy 9
hypothesize that environments in which teachers take a personal interest in and
emotionally support students are less likely to arouse negative emotions than
environments in which teachers are impersonal and emotionally disconnected, and
therefore caring environments will positively affect self-efficacy.
Methods
Participants
The 1,163 participants in our study were fourth, fifth, and sixth graders who
attended elementary school in an inland southern California suburban school district
during the 2005-06 and 2006-07 academic years. The schools were located in low to
middle income neighborhoods, with 59% (n = 682) of our participants receiving free
and/or reduced lunch. Participants came from 88 separate classrooms. The mean cluster
size was 13.22 (SD = 5.95) and ranged from 2 to 25 students per classroom. The
majority of our sample consisted of Latino/a (62%) and Caucasian (31%) students and
other ethnic groups included African American (4%), Asian (1%), Pacific Islander
(<1%), Filipino/a (<1%), and American Indian or Alaska Native (<1%). In the 2006-07
academic year, 43% (n = 495) of participants were in 5th
grade and 57% (n = 668) were in
6th
grade. Finally, 51% (n = 594) of our sample were females and 49% (n = 569) were
males.
Data were gathered as part of a larger study on math performance and math
pedagogy, which included 3,259 elementary school students. Participant inclusion for the
current study was based on four criteria. Students were included only if: they were
considered by the school district to be a fluent English speaker; their gender, ethnicity,
and free lunch status were available through the district database; their California

Math Self-efficacy 10
Standards Test for Mathematics scores for both the 2005-06 and 2006-07 academic years
were available through the district database; and finally, they completed the Student
Motivation Questionnaire in both the 2005-06 and 2006-07 academic years. Applying
these criteria resulted in a final sample of 1,163 students.
Measures
The Student Motivation Questionnaire (SMQ: Karabenik & Maehr, 2004;
Karabenik & Maehr, 2007) was the primary instrument used in the current study. This
questionnaire was developed by a group of researchers on the National Science
Foundation funded Math-Science Partnership-Motivation Assessment Project (MSP-
MAP). A major goal of MSP-MAP was to provide Math-Science Partnerships with self-
report instruments that provide reliable and valid scores for assessing a variety of student
motivation variables and perceptions of the classroom environment. These instruments
were created through extensive literature reviews of existing instruments. Items for each
scale were adapted from existing scales and they were specifically worded to be relevant
to math and science classes. For the current study, we were provided with items to
measure the following variables in math classes: Math Self-efficacy, Perceptions of
Teacher Mastery Goal Structure, Perceptions of Teacher Challenge, and Perceptions of
Teacher Caring. All items were responded to using a Likert-rating of 1 to 5 (1 = not at all
true, 3 = somewhat true, and 5 = very true) and scores for each scale were created by
averaging the ratings on the items associated with a particular scale. Information for each
of these scales follows.
Math Self-efficacy. Four items adapted from existing scales (e.g. Tasks Self-
efficacy: Pajares & Miller, 1995; Academic Self Efficacy: PALS: Midgley et al., 2000)

Math Self-efficacy 11
were used to assess math self-efficacy. These items assessed student’s beliefs in their
ability to successfully learn what was taught in their math class (α = .84). The following
items were used: “I’m sure that I can learn everything taught in math,” “I’m sure that I
can do even the hardest work in my math class,” “Even if a new topic in math is hard,
I’m sure that I can learn it,” and “I’m sure that I can figure out the answers to problems
my teacher gives me in math class.” The average 2006-07 math self-efficacy score in our
sample was 3.83 (SD = .91).
Perceptions of Teacher Mastery Goal Structure. Four items from Midgley et al.’s
(2000) Patterns of Adaptive Learning Scales (PALS: Classroom Mastery Goal Structure)
were adapted to assess student perceptions of mastery goal structure. These items
measured student perceptions of the degree to which their math teacher encouraged effort
and the intrinsic value of learning (α = .63). The following items were used: “My teacher
thinks really understanding our math lessons is the main goal,” “My teacher thinks it’s
important to understand our math work, not just memorize it,” “My teacher thinks how
much you improve in math is really important,” and “Our math teacher accepts nothing
less than our full effort.” The average rating of perceived mastery goals in 2006-07 was
4.32 (SD = .65).
Perceptions of Teacher Challenge. Four items from Midgley et al.’s (2000)
Patterns of Adaptive Learning Scales (PALS: Academic Press) were adapted to assess
student perceptions of challenge. These items measured student perceptions of the
degree to which their math teacher provides challenging work (α = .61). The following
items were used: “When we’ve figured out how to do a math problem, our teacher gives
us more challenging work,” “Our math teacher doesn't let us get away with doing easy

Math Self-efficacy 12
work but really makes us think,” “Our math teacher pushes us to take on challenging
work,” and “Our math teacher makes sure that the work we do really makes us think.”
The average rating of perceived challenge in 2006-07 was 3.71 (SD = .74).
Perceptions of Teacher Caring. Three items were created using existing
definitions (e.g. Wentzel, 1997) and existing scales (e.g. Classroom Life Measure:
Teacher Support: Johnson et al., 1985) to assess student perceptions of teacher caring.
These items measured student perceptions of the degree to which their teacher displays
personal interest in the emotional well-being of his/her students. (α = .75). The following
items were used: “Our math teacher takes a personal interest in students,” “Our math
teacher cares about how we feel,” and “Our math teacher listens to what I have to say.”
The average rating of perceived caring in 2006-07 was 3.72 (SD = .1.23).1
California Standards Test for Mathematics. Individual student results from the
late spring 2005-06 and 2006-07 administrations of California Standards Test for
Mathematics were obtained. Each student completed a 65-item test that was appropriate
to his/her grade level (e.g. 4th
, 5th
, or 6th
grade) each year. Item content was based on
California content standards, which define the knowledge and skills that each student
should acquire at each grade-level. The California Standards Test (CST) for Math for
grades 4 through 6 contains questions in four content areas: number sense; algebra and
functions; measurement and geometry; and statistics, data analysis, and probability. Test
scores were calculated by summing the number of items correctly completed.
Procedure
There were two waves of data collection for each academic year. The Student
Motivation Questionnaire (SMQ) was administered in the early spring of the 2005-06 and

Math Self-efficacy 13
2006-07 academic years and the CST for Math was administered at the end of the 2005-
06 and 2006-07 academic years. To minimize wordiness in referring to our variables,
herein we will refer to all variables measured in the 2005-06 academic year as a “2006”
variable, and refer to all variables measured in the 2006-07 academic year as a “2007”
variable.
Distribution and return of the SMQ was handled by the district assessment and
accountability office, which distributed and picked up the questionnaires in sealed
envelopes. At each school site, researchers met with 4th
, 5th
and 6th
grade teachers and
explained the protocol for the class survey administration. Rather than administer
surveys to their own students, teachers were asked to trade rooms with a colleague so that
students could complete surveys in the presence of a teacher other than their own. The
teachers provided practice questions to students before they completed the actual survey
in order to clarify the procedures. All questions were read aloud by the teachers, who
were told to provide sufficient time to allow students to complete the survey
(approximately 30 minutes). Because of the time involved, teachers rarely re-
administered the survey to students who were absent on the day of the testing. In the
2006 academic year, only student responses on the math self-efficacy section of the SMQ
were used in analyses. In the 2007 academic year, student responses from the math self-
efficacy and perceptions of teachers sections of the SMQ were both used in analyses.
Information regarding student ethnicity, gender, English Language Proficiency,
Free or Reduced Lunch status, and scores on the CST for Math in the 2006 and 2007
academic years was accessed from the district database. Scores on the CST for Math for
the 2006 academic year served as control data for models in which 2007 CST math
Math Self-efficacy 14
scores were the outcome variable. The school district and University Institutional
Review Board waived parental permission for both the SMQ and data records collection
because the questionnaire was administered by district personnel (teachers), no one
student or group of students was singled out in the process of data collection, and the data
were made available to teachers in aggregate form only for instructional purposes.
Missing Data. Missing data for individual Likert items from the SMQ were
handled using single imputation via the EM algorithm (Acock, 2005; Dempster, Rubin,
and Laird, 1977). Imputations were based on observed relationships between all Likert
items within the same year. The amount of missing data per item ranged from 0.04% to
3.96%. There were no missing data for CST scores in either year or for any categorical
variable including grade level, gender, or free lunch status. Fifteen cases were removed
from the analysis because they lacked information concerning cluster (classroom)
membership.
Tests for Mediation. To examine the mediating influence of math efficacy, we
used the framework provided by Baron and Kenny (1986) and recent publications that
have expanded upon it (Kenny, Kashy, & Bolger, 1998; Mackinnon, Krull, & Lockwood,
2000; MacKinnon, Lockwood, Hoffman, West, & Sheets, 2002; Mackinnon, Fairchild, &
Fritz, 2007; Mackinnon & Fairchild, 2009). According to this framework, mediation is
tested against 4 conditions such that at least of two of these conditions (conditions 2 and
3 below) must be met to establish mediation.2 First student perceptions of teacher caring,
teacher challenge, and teacher mastery orientation should be significantly related to both
student year-end math performance (condition 1) and math efficacy (condition 2). Math
efficacy should significantly impact student year-end math performance (condition 3),

Math Self-efficacy 15
and it’s impact should be robust to the inclusion of the teacher variables, such that models
in which math performance is regressed on math efficacy and teacher variables
simultaneously should show significant and consistent effects for math efficacy, while
showing nonsignificant effects for teacher variables (condition 4).
We performed tests of conditions 1 through 4 using two-level linear models with
maximum likelihood estimation. Two-level analyses were chosen due to the hierarchical
nature of the data. Students were nested in classrooms such that the residual variance for
any single level analysis would contain variance attributable to both students and the
classrooms in which students are nested. We included no classroom level predictors, and
use two-level analyses only to separate residual variability attributable to classrooms
from residual variability attributable to students such that potential bias in standard errors
is removed (Raudenbush & Bryk, 2002). In each analysis we controlled for student
gender, free lunch status, and grade level. In cases where 2007 math performance was
examined as the outcome, we controlled for 2006 student math performance. In cases
where 2007 student math efficacy was the outcome variable, we controlled for 2006 math
efficacy.
In each case, the inclusion of control variables allowed us to interpret the effects
of explanatory variables as if all students had entered 2007 with the same score on math
performance or math efficacy, respectively. Our control variables and study design
helped to address the possibility of a specification error, involving the possibility that the
outcome variable (2007 math performance) actually causes the mediator (2007 math
efficacy), and that the mediator causes student perceptions of teachers. Since math
efficacy was measured temporally prior to math performance (math efficacy was

Math Self-efficacy 16
measured in the early spring 2007 and math performance was measured in late spring
2007), and since student scores on math performance from the previous year (2006) were
covaried, our test of the impact of math efficacy on math performance was not
confounded by preexisting differences in math ability, nor does it reflect levels of math
efficacy that may have resulted from a high or low score on a recent high profile math
performance assessment. Similarly, our test of the impact of 2007 teacher variables on
2007 math efficacy was not confounded by preexisting differences in math efficacy
(2006) and, as such, rules out the possibility that any observed effects of teacher variables
on math efficacy is a result of preexisting levels of math efficacy.
For each dependent variable we first estimated a model containing only control
variables. Next we examined models containing both control variables and student-level
explanatory variables of interest entered both individually and simultaneously.
Examining and comparing student-level residual variances between models allowed us to
estimate the portion of variability attributable to the explanatory variables of interest. We
also compared models using two fit statistics, including Akaike’s Information Criteria
(AIC) and Bayes’ Information Criteria (BIC), to determine whether models improve
when explanatory variables were included and to identify optimal sets of explanatory
variables.3
Numeric variables were standardized (M = 0, SD = 1) and categorical variables
coded such that the model intercepts represent predicted outcome variable scores for a 5th
grade male student who does not receive free lunch, is in a sample average classroom,
and has sample average scores on all numeric variables in the model. Coefficients for
each categorical control variable represent the change in model intercepts, in standard
Math Self-efficacy 17
deviation units, associated with a positive one unit change in the explanatory variable.
Similarly, coefficients associated with explanatory variables represent the change in the
model intercept, in standard deviation units, associated with a positive one standard
deviation increase in the explanatory variable.
Results
Bivariate Correlations. Bivariate correlations between study variables are shown
in Table 1. As expected, math efficacy (2007) was positively related to all variables
measuring student perceptions of teachers (2007). Math efficacy (2007) was also
significantly related to both 2006 and 2007 math performance. Small but significant
correlations were observed between teacher challenge and math performance (2007) and
teacher mastery orientation and math performance (2007). All variables measuring
student perception of teachers were significantly and positively related to one another.
Finally, female students showed lower math efficacy than males in 2007 and students
who received free lunch tended to have lower math performance scores than students
who did not receive free lunch.
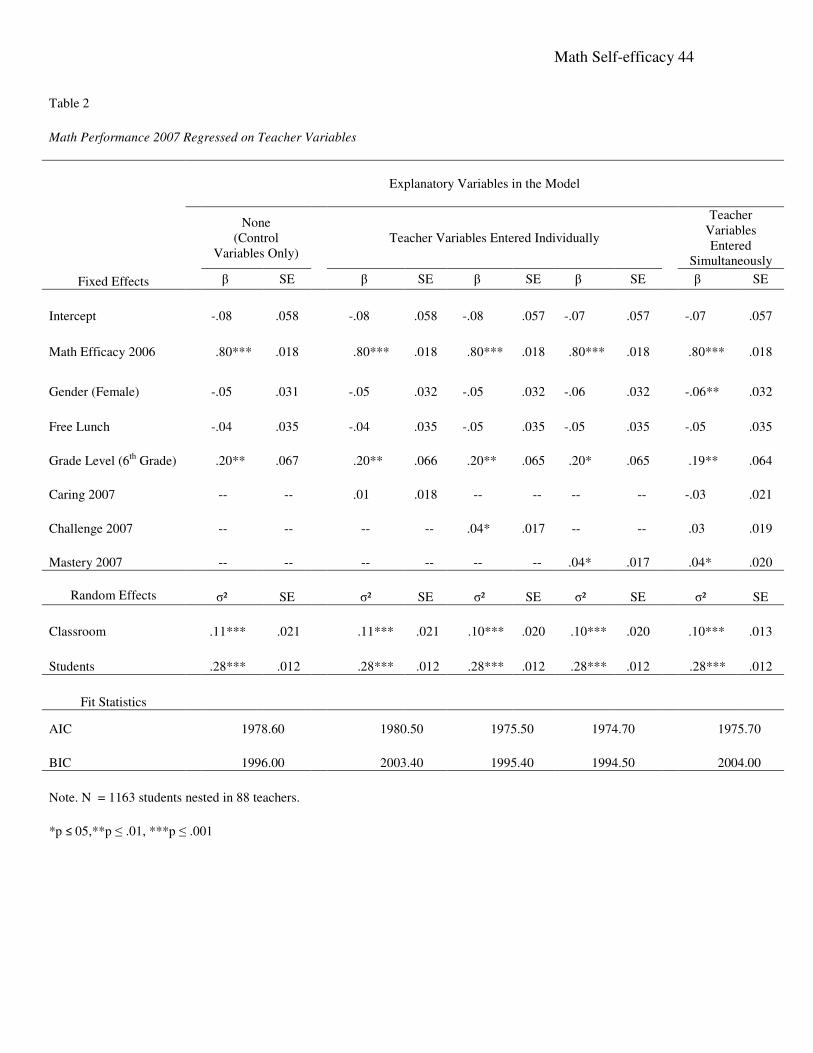
Math Performance Regressed on Teacher Variables. Our initial series of models
examined math performance as the outcome. The initial model, containing only control
variables, indicated significant (and positive) effects only for previous year math
performance, t (1071) = 45.54, p < .001, and being in 6th
grade, t (1071) = 3.04, p < .01.
A considerable portion of the residual variance was attributable to classrooms (28%),
while most (72%) was attributable to students. All subsequent models in this series
indicated a similar pattern of effects for control variables. When examining the influence
of teacher variables entered individually, both teacher challenge (t (1071) = 2.26, p < .05)

Math Self-efficacy 18
and mastery orientation (t (1071) = 2.45, p < .05) were significant. Teacher caring,
however, did not exert a significant impact. A final model examined the three teacher
variables entered simultaneously. In this case, two of the explanatory variables,
including teacher caring and challenge, did not approach significance. Mastery
orientation, however, did exert a significant impact, t (1068) = 2.02, p < .05.
Comparative examination of fit statistics across models indicates that the model
containing teacher mastery as the single explanatory variable provides the optimal fit,
followed closely by the model containing teacher challenge as the single explanatory
variable. Student-level residuals remained essentially unchanged across all models. The
pattern of results indicates that while both teacher challenge and mastery orientation exert
a significant individual impact on year-end math performance, only the latter exerts a
unique effect among the teacher variables. Additional details including standardized
coefficients and standard errors can be examined in Table 2.
Math Efficacy Regressed on Teacher Variables. Our second series of models
examined math efficacy as the outcome. The initial model, containing only control
variables, indicated a significant positive effect for previous year math efficacy, t (1071)
= 14.95, p < .001. A significant impact for gender was also observed, t (1071) = -2.00, p
< .05, indicating that females had lower levels of math efficacy. Most (94%) residual
variance in math efficacy was attributable to students. All subsequent models in this
series indicated a similar pattern of effects for control variables. We continued by
examining the influence of teacher variables entered individually. These models revealed
significant effects for teacher caring (t (1070) = 9.38, p < .001), challenge (t (1070) =
8.04, p < .001) and mastery orientation (t (1070) = 8.65, p < .001), and resulted in

Math Self-efficacy 19
student-level residual variance decreases of 6.4%, 5.1%, and 5.1%, respectively. The
final model examined the impact the control variables and all teacher variables entered
simultaneously. This model again revealed significant effects for previous year math
efficacy and gender, and a significant unique effect for each teacher variable including
teacher caring (t (1068) = 5.17, p < .001) challenge (t (1068) = 4.01, p < .001) and
mastery (t (1068) = 3.21, p < .001). The final model showed a 9.1% reduction in residual
variance compared to the initial model. Comparative examination of fit statistics and
residuals showed that models containing at least one teacher variable were superior to the
model containing only the control variables, while the model in which teacher variables
were entered simultaneously showed the optimal fit. The pattern of effects indicates that
each teacher variable exerts a positive individual and unique impact on math efficacy.
Additional model details can be examined in Table 3.
Math Performance Regressed on Math Efficacy. The final series of models again
examined math performance as the outcome. The initial model, containing only control
variables, was described earlier and presented in Table 2. The model containing both
control variables and math efficacy, revealed a similar pattern for control variables, a
significant and positive effect for math efficacy, t (1071) = 5.27, p < .001, and a 3.6%
decrease in student-level residual variance. In the next four models, we examined
whether the positive and significant effect of math efficacy was robust to the inclusion of
teacher variables entered both individually and simultaneously. In each model the
teacher variables were nonsignificant while math efficacy remained significant and
essentially unchanged with regard to magnitude. Comparative examination of fit
statistics and residual variances indicated that the model containing the control variables

Math Self-efficacy 20
and math efficacy as the only explanatory variable showed the optimal fit. The pattern
of effects shows that students with higher levels of math efficacy achieve higher scores
on year-end math performance. Additional details including standardized coefficients
and standard errors can be examined in Table 4.
Indirect Effects. Overall, results are consistent with existing frameworks for
establishing that teacher variables exert a mediated or “indirect effect” on math
performance via their relationship to math efficacy (e.g., Baron & Kenny, 1986; Kenny,
Kashy, & Bolger, 1998; Mackinnon, Krull, & Lockwood, 2000; MacKinnon, Lockwood,
Hoffman, West, & Sheets, 2002; Mackinnon, Fairchild, & Fritz, 2007; Mackinnon &
Fairchild, 2009). Students who perceive their teachers to be more caring, challenging,
and mastery oriented experience increased levels of math efficacy. Elevated levels of
math efficacy then positively impact student math performance. We estimated the
magnitude of the indirect effect for each teacher variable by multiplying the coefficient
obtained by regressing math efficacy on each teacher variable (entered individually) by
the coefficient obtained by regressing math performance on math efficacy (from the best
fitting model in Table 4).
To examine whether indirect effects were significant, we used the Sobel test
(Sobel, 1982; MacKinnon, Lockwood, Hoffman, West, & Sheets, 2002) . The Sobel test
is ab / b²sa² + a²sb², where a is the coefficient obtained by regressing the mediator on the
initial variable, b is the coefficient obtained by regressing the outcome variable on the
mediator, sa² is the squared standard error for coefficient a, and sb² is the squared
standard error for coefficient b. We report standardized coefficients to describe the
magnitude of each indirect effect, but, as recommended, used unstandardized coefficients

Math Self-efficacy 21
and standard errors to compute the Sobel test. Null hypothesis decisions, however, were
the same whether standardized or unstandardized coefficients were used.
In multilevel models, calculation of mediated/indirect effects involving only
variables assessed on lower level units (students in the current study) requires adjustment
only in the case that the impact of the all variables involved in each mediation chain have
significant nonzero variability attributable to upper level units (classrooms in the current
study). Because math self-efficacy is involved in each mediation chain, we checked for
this possibility first by estimating the variability in the impact of math efficacy on math
achievement across classrooms. We found that this variability estimate was near zero and
nonsignificant (σ² = .0004, p = .24; when adding this source of variability to the first
model shown in Table 4 (furthest left)). In light of the zero variability in math efficacy
slopes across classrooms, we estimate the indirect effect of each initial variable with no
adjustment for the multilevel nature of our models (Kenny, Korchmaros, & Bolger,
2003).
We found that the indirect effect of teacher caring on math performance was
small and significant (z = 4.50, p < .001), indicating that a one standard deviation
increase in teacher caring results in a .02 standard deviation increase in math
performance. The indirect effect of both mastery and challenge were of the same
magnitude (.02), and were also both significant (z = 4.50, p < .001 and z = 4.41, p < .001,
respectively).
Discussion
Bandura’s (1993) theory proposed that self-efficacy is a mediating agentic
mechanism for academic achievement: academic experiences affect self-efficacy and this,

Math Self-efficacy 22
in turn, affects student achievement. Previous research widely supports that learning
environments effect self-efficacy (Schunk, 1982, 1983, 1984; Schunk & Hanson, 1985)
and self-efficacy beliefs for math have a strong influence on math achievement (Pajares
& Kranzler, 1995; Pajares & Miller, 1994; Pajares & Miller, 1995). The main goal of the
current study was to extend this research by examining the relationships between math
self-efficacy, perceived classroom environment, and achievement in the context of
standardized math test performance. We found that students who perceived their
classroom environments as more caring, challenging, and mastery oriented had
significantly higher levels of math efficacy than those in less caring, challenging, and
mastery-oriented classrooms. In addition, we found that higher levels of math efficacy
positively affected student math performance. Finally, our results suggest that student
perceptions of the classroom environment do not directly impact math performance on
standardized tests, but they do impact math performance indirectly via the mediating,
albeit small, effect of math efficacy.
Another goal of the current study was to examine the influence of perceived
challenge and caring in the classroom specifically on math self-efficacy. Few studies
have examined this, particularly with a data set that allows for control of previous math
performance and previous math self-efficacy. The current data suggest that both
challenging and caring environments positively influence math self-efficacy. It is
interesting to note that perceptions of teacher caring effected math self-efficacy as
strongly as perceptions of challenge and mastery. This may be surprising given that
displaying a caring attitude towards students seems less relevant than challenge and
mastery-orientation to skills development in math, and therefore less relevant to self-

Math Self-efficacy 23
efficacy. However, Bandura (1993) argued that affective processes are one of the main
influences on self-efficacy. It is not hard to imagine that when students believe that their
math teachers have a personal interest in their well-being and concerns, they have less
anxiety and are more confident in their ability to do their math work. Moreover, this
finding supports Pianta et al.’s (2008) observation that emotional support in math
instruction may be more important than is typically acknowledged.
Limitations
Before discussing the implications of this work to future research, it is important
to acknowledge limitations of our study. First, previous research has typically observed a
stronger relationship between math self-efficacy and math performance than that
observed in the current study (e.g. Pajares & Graham, 1999). Pajares (1996) suggests
that the magnitude of association between self-efficacy and performance depends largely
on the match between the self-efficacy index and the criterion performance task. For
example, asking students to rate their confidence in their ability to solve a specific math
problem (e.g. 1 + 1) should correlate highly with their success in solving that exact math
problem, whereas asking students to rate their global confidence in their ability to do
math should be relatively less related to their performance on a multidimensional math
test. Moreover, a metanalysis found that self-efficacy beliefs had a weaker relationship
with standardized test performance than other types of performance outcomes, such as
specific skills tasks (e.g. subtraction problems) and classroom-based performance indices
(e.g. course grades) (Multon, Brown & Lent, 1991). The authors concluded that this is
because studies using, “standardized achievement measures involved self-efficacy indices
that less closely matched their companion performance measures” (Multon, Brown &

Math Self-efficacy 24
Lent, 1991, p.35). In the current study, students rated their self-efficacy to do well in
their math class, not their efficacy for solving specific problems, and these ratings were
correlated with performance on state mandated standardized math tests. It seems likely
that the distal match between our self-efficacy and performance indices attenuated the
observed relationship between math self-efficacy and math performance.
The indirect effects of student perceptions of the classroom environment on
standardized math test performance were also modest. Although the true magnitude of
these effects may indeed be small, it is possible that these effects were underestimated in
our study because of our use of composite scores in measuring self-efficacy. Hoyle and
Kenny (1999) note that error in the measurement of the mediator (e.g. self-efficacy)
results in underestimation of mediated effect sizes. We initially considered a structural
equation modeling (SEM) framework because it allows the mediator to be modeled
without error; however, SEM would have introduced cross-classified random effects in
our models due to the presence of both latent and manifest control variables in the
previous year. There is currently no method for dealing with this issue in SEM.
Consequently, the fact that our mediator was not measured free of error may have
attenuated our ability to detect the true magnitude of indirect effects.
The brevity of our self-efficacy and perceptions of teachers scales may have also
resulted in observed effects that underestimated the true effects. Due to practical
considerations, such as the age-range of our sample, administering instruments on
multiple occasions, and using class time for survey completion, we used shorter scales.
A main disadvantage of shorter scales is that they tend to provide less reliable scores than
longer scales, and lower reliability results in underestimation of the true magnitude of
Math Self-efficacy 25
relationship between variables (John & Benet-Martinez, 2000). Still, it is important to
note that reliability is assessed for the greater purpose of establishing validity (reliability
is not an end in and of itself) and several studies suggest that two, even one-item scales
can provide scores that are nearly as valid as scores on longer scales despite the sacrifice
in reliability (Gosling et al., 2003). For example, Robins, Hendin, and Trzesniewski
(2001) found that scores on a single-item scale of self-esteem correlated with scores on
the widespread ten-item Rosenberg Self-Esteem Scale (Rosenberg, 1965) at r = .75, on
average. Moreover, scores on the one-item scale and ten-item scale correlated similarly
with a variety of criterion measures (e.g. physical health, positive group behavior, and
college GPA). In sum, our relatively short scales may have attenuated our ability to
detect true effects, but were not necessarily less valid than longer versions.
Finally, it is important to acknowledge the high correlations observed between the
mastery, challenge, and caring scales. Although large correlations between scales is
usually considered undesirable in that it might indicate redundancy in scale content,
previous research has also found large correlations between various scales measuring
student’s perceptions of aspects of the classroom environment that facilitate learning
(Fisher & Fraser, 1983; Fraser & Fisher, 1982; Gentry & Owen, 2004; Trickett & Moos,
1973). These constructs are often highly correlated with one another because there is a
common denominator underlying them: a teaching disposition that anticipates and is
responsive to student learning needs. A teacher who recognizes that students need to feel
emotionally supported probably also recognizes that they need to feel appropriately
challenged, and a teacher who recognizes that students need to feel challenged probably
also recognizes that they need to believe that their efforts matter. Moreover, despite the

Math Self-efficacy 26
high correlations between teacher variables, we observed unique effects for all teacher
variables on self-efficacy and a unique direct effect for mastery-orientation on
standardized math test performance.
Implications
The current results suggest a variety of directions for future research. First,
further research is needed to more accurately determine the magnitude of relationship
between self-efficacy beliefs and standardized test performance. One possibility is that
the effect of self-efficacy on standardized test performance is small. Another possibility,
suggested by the previously mentioned metanalysis, is that self-efficacy is often weakly
related to standardized test performance because the self-efficacy indices only distally
match the performance criteria of the standardized tests (Multon, Brown & Lent, 1991).
Therefore, we would expect the relationship between self-efficacy and standardized test
performance to be larger when self-efficacy and performance indices are more highly
concordant. In addition, it is possible that self-efficacy more strongly mediates the effect
of perceptions of the classroom environment on standardized test performance when self-
efficacy and performance indices are more highly concordant.
Second, our finding that perceptions of the classroom environment indirectly
effect math performance through self-efficacy suggests that what teachers do in the
classroom matters. Although the indirect effects of our classroom environment variables
were small, it is interesting to consider that they might add up. For example, providing a
challenging classroom environment (in and of itself) might only slightly increase students
self-efficacy beliefs; however, providing a challenging, caring, and mastery-oriented
classroom environment might increase students self-efficacy beliefs by a more notable

Math Self-efficacy 27
degree. Moreover, there are several additional classroom variables, beyond those
measured in the current study, that might further work together to influence student’s
self-efficacy beliefs. These possibilities can be examined in future research by measuring
a wider variety of perceptions of the classroom and examining their influence on self-
efficacy and math performance.
Third, the finding that perceptions of teacher caring and challenge effected math
self-efficacy is relatively new. An interesting direction for future research involves
examining the grade-level generalizability of our results. Our students were in fifth and
sixth grade and it is worth considering if perceptions of caring would have a positive
effect on math self-efficacy in later grades; perhaps older students are more responsive to
cognitive (e.g. challenge and mastery-orientation) than affective aspects of the classroom
environment. However, Patrick et al. (2007) found that perceptions of teacher caring had
a strong effect on academic self-efficacy in seventh and eighth grade students. Moreover,
several studies observe that motivation (e.g. self-efficacy) and achievement decline when
students enter middle school and a commonly suggested reason for this is the change in
classroom environment from elementary to middle school (Eccles & Midgley, 1989).
Students typically perceive middle school classroom environments as more performance-
oriented and less mastery-oriented than elementary school classrooms (Anderman &
Midgley, 1997). Future research should examine the possibility that students also
perceive middle school classroom environments as less caring than elementary school
classrooms and the possibility that this plays a role in declines in math self-efficacy and
math performance in middle school.

Math Self-efficacy 28
Another direction for future research is the possibility that student ability levels
moderate the effect of classroom environments on self-efficacy. Greer (1993) suggested
that students of different ability levels might interpret and respond to the classroom
environment differently. For example, the math self-efficacy of a student with high math
ability might not be strongly affected by a caring teacher, but might be strongly affected
by a challenging one. In contrast, the math self-efficacy of a student with low math
ability might be strongly affected by a caring teacher, but might not be affected by or
even negatively affected by a challenging one.
It is also important to examine how math self-efficacy might mediate the effect of
student perceptions of performance-orientation on standardized math test performance.
We were unable to examine this as we did not have a measure of student perceptions of
their teachers’ performance-orientation. Based on the research previously reviewed (e.g.
Ames, 1992; Dweck, 1986; Maehr & Nicholls, 1980), we would expect that students who
perceive their classroom as higher in performance-orientation would have lower math
self-efficacy, which would in turn negatively affect math performance. However,
researchers have recently suggested that questionnaires should be developed to measure
two different kinds of performance-orientation (Church, et al., 2001; Wolters, 2004):
performance-approach and performance-avoidance. Classrooms structured around
performance-approach goals encourage students to be interested in and take pride in their
grades, whereas as classrooms structured around performance-avoidance goals encourage
students to compare their grades to others and to feel bad when their grades are not better
than others. Future research should explore the possibility that students who perceive
their classroom as higher in performance-approach orientation have higher math self-

Math Self-efficacy 29
efficacy and standardized test performance, while students who perceive their classroom
as higher in performance-avoidance orientation have lower math self-efficacy and
standardized test performance.
Conclusion
Ryan et al. (2007) noted that a fundamental assumption underlying NCLB is a
belief that high-stakes tests will motivate students to perform at higher standards. The
standardized test scores for fourth through sixth graders in the current sample were not
high-stakes in the sense of using them as a basis for grade promotion, however, they can
be used to place students into instructional programs and they are used to determine
school eligibility for federal funding. Consequences like these have led to an intense
focus on testing and evaluation that permeates the school environment and affects
everyone from students, teachers, and administrators. The current study suggests that one
way to increase scores on standardized math tests is to increase student’s math self-
efficacy, and teachers can positively influence math self-efficacy by creating a caring,
challenging, and mastery-oriented classroom environment. Further research is needed to
identify other attributes of students that affect their performance on standardized tests and
how aspects of the perceived classroom environment affect these student attributes.
Math Self-efficacy 30
References
Acock, A. (2005). Working with missing values. Journal of Marriage and Family, 67,
1012-1028.
Ames, C. (1992). Classrooms: Goals, structures, and student motivation. Journal of
Educational Psychology, 84(3), 261-271.
Ames, C., & Archer, J. (1988). Achievement goals in the classroom: Students’ learning
strategies and motivation processes. Journal of Educational Psychology, 80, 260-
267.
Anderman, E. M., & Midgley, C. (1997). Changes in achievement goal orientations,
perceived academic competence, and grades across the transition to middle-level
schools. Contemporary Educational Psychology, 22, 269-298.
Bandura, A. (1986). Social foundations of thought and action: A social-cognitive theory.
Englewood Cliffs, NJ: Prentice Hall.
Bandura, A. (1993). Perceived self-efficacy in cognitive development and functioning.
Educational Psychologist, 28(2), 117-148.
Bandura, A. (1997). Self-efficacy: The exercise of control. New York, NY: Freeman.
Bryk, A. S., & Raudenbush, S. W. (1992). Hierarchical linear models for social and
behavioural research: Applications and data analysis methods. Newbury Park,
CA: Sage Publications.
Bong, M. (2008). Effects of parent-child relationships and classroom goal structures on
motivation, help-seeking avoidance, and cheating. The Journal of Experimental
Education, 76(2), 191-217.
Math Self-efficacy 31
Chen, P., & Zimmerman, B. (2007). A cross-national comparison study on the accuracy
of self-efficacy beliefs of middle school mathematics students. The Journal of
Experimental Education, 75(3), 221-244.
Church, M. A., Elliot, A. J., & Gable, S. (2001). Perceptions of classroom environment,
achievement goals, and achievement outcomes. Journal of Educational
Psychology, 93, 43-54.
Collins, J. L. (1982, March). Self-efficacy and ability in achievement behavior. Paper
presented at the meeting of the American Educational Research Association, New
York.
Crosnoe, R., Johnson, M. K., & Elder, G. H., Jr. (2004). Intergenerational bonding in
school: The behavioral and contextual correlates of student-teacher relationships.
Sociology of Education, 77, 60-81.
Dempster, A. P., Laird, N. M., and Rubin, D. B. (1977). Maximum likelihood from
incomplete data via the EM algorithm. Journal of the Royal Statistical Society,
Series B, 39, 1–39.
Dorman, J. P. (2001). Associations between classroom environment and academic
efficacy. Learning Environments Research, 4, 243-257.
Dweck, C. S. (1986). Motivational processes affecting learning. American Psychologist,
41, 1040-1048.
Eccles, J. S., & Midgley, C. (1989). Stage/environment fit: Developmentally appropriate
classrooms for early adolescents. In R. E. Ames and C. Ames (Eds.), Research on
motivation in education (Vol. 3). New York: Academic Press.

Math Self-efficacy 32
Fraser, B. J., & Fisher, D. L. (1982). Predicting students’ outcomes from their
perceptions of classroom psychosocial environment. American Educational
Research Journal, 19(4), 498-518.
Friedel, J. M., Cortina, K. S., Turner, J. C., & Midgley, C. (2007). Achievement goals,
efficacy beliefs and coping strategies in mathematics: The roles of perceived
parent and teacher goal emphases. Contemporary Educational Psychology, 32,
434-458.
Gentry, M., & Owen, S. V. (2004). Secondary student perceptions of classroom quality:
Instrumentation and differences between advanced/honors and nonhonors classes.
The Journal of Secondary Gifted Education, 16, 20-29.
Greene, B A., Miller, R. B., Crowson, H. M., Duke, B. L., & Akey, K. L. (2004).
Predicting high school students’ cognitive engagement and achievement:
Contributions of classroom perceptions and motivation. Contemporary
Educational Psychology, 29, 462-482.
Greer, C. H. (1993). The effects of cooperative learning on different ability level students'
perceptions of the middle school classroom environment. Paper presented at the
Annual Meeting of the American Educational Research Association (Atlanta, GA,
April 12-16, p.43).
Grolnick, W. S., Gurland, S. T., Jacob, K. F., & Decourcey, W. (2002). The development
of self-determination in middle childhood and adolescence. In A. Wigfeild and J.
Eccles (Eds.), Development of achievement motivation (pp. 147-171). New York,
NY: Academic Press.

Math Self-efficacy 33
Hoffman, B., & Schraw, G. (2009). The influence of self-efficacy and working memory
capacity on problem-solving efficiency. Learning and Individual Differences, 19,
91-100.
Hoyle, R., & Kenny, D. (1999). Sample size, reliability, and tests of statistical mediation.
In R. H. Hoyle (Ed.), Statistical Strategies for Small Sample Research. Thousand
Oaks, CA: Sage Publications.
John, O. P., & Benet-Martinez, V. (2000). Measurement: Reliability, construct validation,
and scale construction. In H. T. Reis & C. M. Judd (Eds.), Handbook of research
methods in social and personality psychology (pp. 339-369). New York:
Cambridge University Press.
Johnson, D. W., Johnson, R. T., Buckman, L. A., & Richards, P. S. (1985). The effect of
prolonged implementation of cooperative learning on social support within the
classroom. Journal of Psychology, 119, 405-411.
Karabenik, S. A., & Maehr, M. L. (2004). First year report to the National Science
Foundation: MSP – Motivation Assessment Program. Retrieved January 13, 2009,
from: http://www.mspmap.org/downloads/mspmap_rpt1.pdf
Karabenik, S. A., & Maehr, M. L. (2007). Final report to the National Science
Foundation: MSP – Motivation Assessment Program. Retrieved March 16, 2009,
from:http://hub.mspnet.org/media/data/MSP_MAP_Final_Report.pdf?media_000
000002609.pdf
Kenny, D., Korchmaros, J., and Bolger, N. (2003). Lower level mediation in multilevel
models. Psychological Methods, 8, 115-128.
Math Self-efficacy 34
Mackinnon, D. P., Fairchild, A. J. (2009). Current directions in mediation analysis.
Current Directions in Psychological Science, 18, 16-20.
Mackinnon, D. P., Fairchild, A. J., & Fritz, M. S. (2007). Mediation Analysis. Annual
Review of Psychology, 58, 593-614.
Mackinnon, D. P., Krull, J. L., & Lockwood, C.M. (2000). Equivalence of the mediation,
confounding, and suppression effect. Prevention Statistics, 1, 173-180.
MacKinnon, D. P., Lockwood, C. M., Hoffman, J. M., West, S. G., & Sheets, V. (2002).
A comparison of methods to test the significance of the mediated effect.
Psychological Methods, 7, 83-104.
Maehr, M. L., & Nicholls, J. G. (1980). Culture and achievement motivation: A second
look. In N. Warren (Ed.), Studies in cross-cultural psychology. San Diego, CA:
Academic Press.
Malone, T. W., & Lepper, M. R. (1987). Making learning fun: A taxonomy of intrinsic
motivation for learning. In R. E. Snow & M. J. Farr (Eds.), Aptitude, learning,
and instruction (Vol. 3). Hillsdale, NJ: Erlbaum.
Meece, J. L., Blumenfeld, P.C., & Hoyle, R. H. (1988). Students’ goal orientations and
cognitive engagement in classroom activities. Journal of Educational Psychology,
80, 514-523.
Meece, J. L., Anderman, E. M., & Anderman, L. H. (2006). Classroom goal structure,
student motivation, and academic achievement. Annual Review of Psychology, 57,
487-503.

Math Self-efficacy 35
Meyer, D. K., Turner, J. C., & Spencer, C. A. (1997). Challenge in a mathematics
classroom: Students’ motivation and strategies in project-based learning. The
Elementary School Journal, 97(5), 501-????
Middleton, M. J., & Midgley, C. (1997). Avoiding the demonstration of lack of ability:
An under-explored aspect of goal theory. Journal of Educational Psychology, 89,
710-718.
Midgley, C., Maehr, M., Hruda, Anderman, E., Anderman, Freeman, K., Gheen, M.,
Kaplan, A., et al. (2000). Manual for the patterns of adaptive learning scales
(PALS). Ann Arbor, MI: University of Michigan.
Multon, K., Brown, S., & Lent, R. (1991). Relation of self-efficacy beliefs to academic
outcomes: A meta-analytic investigation. Journal of Counseling Psychology, 38,
30-38.
Murdock, T B., & Miller, A. (2003). Teachers as sources of middle school students’
motivational identity: Variable-centered and person-centered analytic approaches.
The Elementary School Journal, 103(4), 383-399.
The National Center for Fair and Open Testing (2007). What you need to know about
California’s high-stakes tests. Retrieved March 6, 2009:
http://www.fairtest.org/what-you-need-know-about-californias-high-stakes-t
Newman, R. S. (2002). What do I need to do to succeed… when I don’t understand what
I am doing!?: Developmental influences on students’ adaptive help-seeking. In A.
Wigfeild and J. Eccles (Eds.), Development of achievement motivation (pp. 285-
306). New York, NY: Academic Press.
No Child Left Behind Act of 2001, Pub. L. No. 107-110, Rec. 1425. 115 Stat. (2002).

Math Self-efficacy 36
Pajares, F., & Graham, L. (1999). Self-efficacy, motivation constructs, and mathematics
performance of entering middle school students. Contemporary Educational
Psychology, 24, 124-139.
Pajares, F., & Kranzler, J. (1995). Self-efficacy beliefs and general mental ability in
mathematical problem-solving. University of Michigan.
Pajares, F., & Miller, M. D. (1994). The role of self-efficacy and self-concept beliefs in
mathematical problem-solving: A path analysis. Journal of Educational
Psychology, 86, 193-203.
Pajares, F., & Miller, M. D. (1995). Mathematics self-efficacy and mathematic outcomes:
The need for specificity of assessment. Journal of Counseling Psychology, 42,
190-198.
Patrick, H., Ryan, A., & Kaplan, A., (2007). Early adolescents’ perceptions of the
classroom social environment, motivational beliefs, and engagement. Journal of
Educational Psychology, 99, 83-98.
Pianta, R. C., Hamre, B., & Stuhlman, M. (2003). Relationships between teachers and
children. In W. M. Reynolds, & G. E. Miller (Eds.), Handbook of psychology,
Vol. 7 (p.199-234). Hoboken, NJ: John Wiley & Sons Inc.
Pianta, R. C., Belsky, J., Vandergrift, N., Houts, R., & Morrison, F. J. (2008). Classroom
effects on children’s achievement trajectories in elementary school. American
Educational Research Journal, 45, 365-397.
Raudenbush, S. W., & Bryk, A. S. (2002). Hierarchical linear models: Applications and
data analysis methods. 2nd
Editon. Thousand Oaks, CA: Sage Publications.
Math Self-efficacy 37
Robins, R. W., Hendin, H. M., & Trzesniewski, K. H. (2001). Measuring global self-
esteem: Construct validation of a single-item measure and the Rosenberg self-
esteem scale. Personality and Social Psychology Bulletin, 27(2), 151-161.
Rosenberg, M. (1965). Society and the adolescent self-image. Princeton, NJ: Princeton
University Press.
Ryan, K., Ryan, A., Arbuthnot, K., & Samuels, M. (2007). Students’ motivation for
standardized math exams. Educational Researcher, 36, 5-13.
Schunk, D. (1982). Effects of effort attributional feedback on children's perceived self-
efficacy and achievement. Journal of Educational Psychology, 74(4), 548-556.
Schunk, D. (1983). Ability versus effort attributional feedback: Differential effects on
self-efficacy and achievement. Journal of Educational Psychology, 75(6), 848-
856.
Schunk, D. (1984). Sequential attributional feedback and children's achievement
behaviors. Journal of Educational Psychology, 76(6), 1159-1169.
Schunk, D. (1996). Goal and self-evaluative influences during children’s cognitive skill
learning. American Educational Research Journal, 33(2), 359-382.
Schunk, D., & Hanson, A. R. (1985). Peer models: Influence on children’s self-efficacy
and achievement. Journal of Educational Psychology, 77, 313-322.
Singer, J. D., & Willett, J. B. (2003). Applied longitudinal data analysis: Modeling
change and event occurrence. New York, NY: Oxford University Press, Inc.
Sobel, M. E. (1982). Asymptotic intervals for indirect effects in structural equations
models. In S. Leinhart (Ed.), Sociological methodology 1982 (pp.290-312). San
Francisco: Jossey-Bass.

Math Self-efficacy 38
Stipek, D. J. (2001). Classroom context effects on young children's motivation. In F.
Salili, C. Chiu & Y. Hong (Eds.), Student motivation: The culture and context of
learning. (pp. 273-292). Dordrecht, Netherlands: Kluwer Academic Publishers.
Usher, E. (2009). Sources of middle school students’ self-efficacy in mathematics: A
qualitative investigation. American Educational Research Journal, 46, 275-314.
Vygotsky, L. S. (1978). Thought and language. Cambridge, MA: MIT Press.
Weiner, B. (1979). A theory of motivation for some classroom experiences. Journal of
Educational Psychology, 71, 3-25.
Wentzel, K. R. (1997). Student motivation in middle school: The role of perceived
pedagogical caring. Journal of Educational Psychology, 89, 411-417.
Wolters, C. A. (2004). Advancing achievement goal theory: Using goal structures and
goal orientations to predict students’ motivation, cognition, and achievement.
Journal of Educational Psychology, 96(2), 236-250.
Wolters, C. A., Yu, S., & Pintrich, P. R. (1996). The relation between goal orientation
and students’ motivational beliefs and self-regulated learning. Learning and
Individual Differences, 8, 211-238.
Zahorik, J. (1996). Elementary and secondary teachers’ reports of how they make
learning interesting. Elementary School Journal, 96, 551-564.

Math Self-efficacy 39
Author Note
Lisa A. Fast, University of California, Riverside; James Lewis, University of
California, Riverside; Michael J. Bryant, California Institute of the Arts; Kathleen A.
Bocian, University of California, Riverside; Richard A. Cardullo, University of
California, Riverside; Michael Rettig, University of California, Riverside; and Kimberly
A. Hammond, University of California, Riverside.
Lisa A. Fast is now at the Department of Behavioral Sciences, MiraCosta College,
Cardiff, California.
This research was funded by a Math Science Partnership (MSP) grant from the
National Science Foundation (NSF 0226948: R. Cardullo, PI). We are grateful to the
administrators, teachers, and students of the participating school district for their
cooperation, patience, and enthusiasm throughout this five year research and intervention
study. We are also grateful to Dr. Stuart Karabenick, Dr. Martin Maehr, Dr. Bridget V.
Ammon, Dr. Juliane Blazevski, and Dr. AnnMarie Conley (University of Michigan, Ann
Arbor) for providing us with the Student Motivation Survey through the NSF MSP
Research and Technical Assistance (RETA) project. Finally, we deeply thank our
Mathematical ACTS colleagues at the University of California, Riverside, particularly
Catherine Miller for her assistance with data collection and entry.
Correspondence concerning this article should be addressed to Lisa A. Fast,
MiraCosta College, Department of Behavioral Sciences, MS-17A, 3333 Manchester
Avenue, Cardiff, CA 92007. Electronic mail can be sent to [email protected].

Math Self-efficacy 40
Footnotes
1 We used confirmatory factor analysis with adjustment for clustered observations
to examine our theoretical expectation that the eleven items measuring student
perceptions of teachers would be best expressed as three correlated latent constructs,
including student perceptions of teacher mastery orientation, challenge, and caring. All
factor analyses were conducted using 2006-07 data. We compared three models: a three
factor solution; a two factor solution consisting of the teacher caring factor and a second
factor on which challenge and mastery orientation items were assigned to load together;
and a two factor solution consisting of the teacher challenge factor and a second factor on
which mastery orientation and caring items were assigned to load together. Based on
these comparisons, we concluded that the three factor solution was optimal, χ² (41) =
101.99, p < .001, CFI =.97, TLI = .96, RMSEA = .04.
2 Conditions 1 and 4 are not required to establish mediation, but indicate whether
mediation is complete and consistent. Complete mediation occurs when the antecedent(s)
is significantly associated with the outcome, but is no longer associated with the outcome
when the mediator is included in the model. Complete mediation implies that the
mediator is the primary mechanism that accounts for any relationship between the
antecedent(s) and the outcome. Consistent mediation requires that the sign of the
coefficient(s) describing the relationship between the antecedent(s) and the outcome does
not change depending on whether the mediator is included in the model.
3 Smaller values of both AIC and BIC indicate a superior model fit.

Math Self-efficacy 41
Figure Caption
Figure 1. Conceptual framework for examining the mediational relationship between
student math efficacy and student perceptions of teachers. Solid lines indicate direct
effects and dashed lines indicate control variables.
Math Self-efficacy 42
PerformanceTeacher
Challenge
Mastery
Math Performance
2007Self Efficacy for Math
2007
Student
FIGURE 1.
Caring
SELF EFFICACY 2006 MATH PERFORMANCE 2006
FREE LUNCH, GENDER, GRADE

Math Self-efficacy 43
Table 1
Bivariate Correlations Between Study Variables
1 2 3 4 5 6 7 8 9
1. Gender (Female) --
2. Free Lunch .03 --
3. Grade (6th) .05 .02 --
4. Math Performance 2006 -.02 -.13 -.09 --
5. Math Performance 2007 -.06 -.12 -.20 .78 --
6. Math Self-efficacy 2006 -.05 -.03 -.02 .31 .29 --
7. Math Self-efficacy 2007 -.09 -.05 -.05 .33 .37 .41 --
8. Caring 2007 .01 .04 -.18 .06 .06 .10 .27 --
9. Challenge 2007 -.03 .04 .01 .03 .09 .12 .26 .34 --
10. Mastery 2007 .07 .03 -.01 .07 .12 .14 .28 .50 .43
Note. N = 1163. Point-biserial, Phi, and Pearson Correlations were calculated where
appropriate. Bolded correlations are significant at p < .05 at least.
Math Self-efficacy 44
Table 2
Math Performance 2007 Regressed on Teacher Variables
Fixed Effects
Explanatory Variables in the Model
None
(Control
Variables Only)
Teacher Variables Entered Individually
Teacher
Variables
Entered
Simultaneously
β SE β SE β SE β SE β SE
Intercept -.08 .058 -.08 .058 -.08 .057 -.07 .057 -.07 .057
Math Efficacy 2006
.80*** .018 .80*** .018 .80*** .018
.80*** .018 .80*** .018
Gender (Female) -.05 .031 -.05 .032 -.05 .032 -.06 .032 -.06** .032
Free Lunch -.04 .035 -.04 .035 -.05 .035 -.05 .035 -.05 .035
Grade Level (6th
Grade) .20** .067 .20** .066 .20** .065 .20* .065 .19** .064
Caring 2007 -- -- .01 .018 -- -- -- -- -.03 .021
Challenge 2007 -- -- -- --
.04* .017 -- -- .03 .019
Mastery 2007 -- -- -- -- -- -- .04* .017 .04* .020
Random Effects σ² SE σ² SE σ² SE σ² SE σ² SE
Classroom .11*** .021 .11*** .021 .10*** .020
.10*** .020
.10*** .013
Students .28*** .012 .28*** .012
.28*** .012
.28*** .012
.28*** .012
Fit Statistics
AIC 1978.60 1980.50 1975.50 1974.70 1975.70
BIC 1996.00 2003.40 1995.40 1994.50 2004.00
Note. N = 1163 students nested in 88 teachers.
*p ≤ 05,**p ≤ .01, ***p ≤ .001

Math Self-efficacy 45
Table 3
Math Efficacy 2007 Regressed on Teacher Variables
Explanatory Variables in the Model
Math Efficacy Math Efficacy and Teacher Variables Entered
Individually
Math Efficacy
and
Teacher
Variables
Entered
Simultaneously
Fixed Effects β SE β SE β SE β SE β SE
Intercept .13* .066 .10 .063 .14* .063 .16** .062 .13* .061
Math Efficacy 2006
.40*** .026 .37*** .026
.37*** .026
.37*** .026 .36*** .025
Gender (Female) -.11* .053 -.12* .051 -.10* .051 -.15** .051 -.13** .050
Free Lunch -.05 .056 -.08 .054 -.07 .054 -.07 .054 -.09 .053
Grade Level (6th
Grade) .09 .070 .01 .066 -.09 .065 -.09 .063 -.03 .063
Caring 2007 -- -- .24*** .027 -- -- -- -- .15*** .031
Challenge 2007 -- -- -- --
.21*** .026 -- -- .12*** .029
Mastery 2007 -- -- -- -- -- --
.23*** .026 .11*** .031
Random Effects σ² SE σ² SE σ² SE σ² SE σ² SE
Classroom .05***
.018 .04** .015 .03** .015 .03* .014
.03* .013
Students .78***
.034
.73*** .032
.74*** .032
.74*** .032
.71*** .012
Fit Statistics
AIC 3071.90 2997.80 3000.11 3002.20 2959.90
BIC 3089.20 3017.60 3031.30 3022.00 2984.60
Note. N = 1163 students nested in 88 teachers.
*p ≤ 05,**p ≤ .01, ***p ≤ .001

Math Self-efficacy 46
Table 4
Math Performance 2007 Regressed on Math Efficacy and Teacher Variables
Explanatory Variables in the Model
Math Efficacy Math Efficacy and Teacher Variables Entered
Individually
Math Efficacy
and Teacher
Variables
Entered
Simultaneously
Fixed Effects
SE
SE
SE
SE
SE β β β β β
Intercept -.08 .057 -.08 .057 -.08 .057 -.07 .056 -.07 .057
Math Performance 2006 .77*** .018 .77*** .018
.77*** .018 .77*** .018 .77*** .018
Gender (Female) -.04 .032 -.04 .032 -.05 .035 -.05 .032 -.05 .032
Free Lunch -.04 .035 -.04 .035 -.05 .035 -.05 .035 -.05 .035
Grade Level (6th
Grade) .19** .065 .19* .065 .19* .064 .19* .064 .18** .064
Math Efficacy 2007 .09** .017 .10** .018 .09** .018 .09** .018 .09** .018
Caring 2007 -- -- -.02 .018 -- -- -- -- -.04 .022
Challenge 2007 -- -- -- -- .02 .017 -- -- .02 .019
Mastery 2007 -- -- -- -- -- -- .02 .017 .03 .020
Random Effects σ² SE σ² SE σ² SE σ² SE σ² SE
Classroom .10***
.019 .10*** .019
.10*** .020
.10*** .019
.10*** .019
Students .27***
.012 .27*** .012
.27*** .012
.27*** .012
.27*** .012
Fit Statistics
AIC 1953.20 1954.10 1954.20 1953.80 1954.10
BIC 1973.10 1976.40 1976.50 1976.10 1981.40
Note. N = 1163 students nested in 88 teachers.
*p ≤ 05,**p ≤ .01, ***p ≤ .001