Math Essentials Comprehensive Curriculum - Kenilworth Science
136
Math Essentials
Transcript of Math Essentials Comprehensive Curriculum - Kenilworth Science

Math Essentials

Table of Contents
Unit 1: Ratio and Proportion............................................................................................1 Unit 2: Probability ...........................................................................................................13 Unit 3: Statistics ...............................................................................................................26 Unit 4: Topics in Geometry ...........................................................................................38 Unit 5: Exploring Linear Functions ...............................................................................59 Unit 6: Exploring Step, Piecewise, and Absolute Value Functions .............................78 Unit 7: Exploring Quadratic Functions .........................................................................93 Unit 8: Exploring Other Math Topics..........................................................................112
Some of the math symbols in this document were made with Math Type®
software. Specific fonts must be installed on the user’s computer for the symbols to be read. It is best to use the pdf format of a document if a printed copy is needed. To copy and paste from the Word document, download and install the Math Type
®
for Windows Font from http://www.dessci.com/en/dl/fonts/default.asp on each computer on which the document will be used.

Louisiana Comprehensive Curriculum, Revised 2008 Course Introduction
The Louisiana Department of Education issued the Comprehensive Curriculum in 2005. The curriculum has been revised based on teacher feedback, an external review by a team of content experts from outside the state, and input from course writers. As in the first edition, the Louisiana Comprehensive Curriculum, revised 2008 is aligned with state content standards, as defined by Grade-Level Expectations (GLEs), and organized into coherent, time-bound units with sample activities and classroom assessments to guide teaching and learning. The order of the units ensures that all GLEs to be tested are addressed prior to the administration of iLEAP assessments. District Implementation Guidelines Local districts are responsible for implementation and monitoring of the Louisiana Comprehensive Curriculum and have been delegated the responsibility to decide if
• units are to be taught in the order presented • substitutions of equivalent activities are allowed • GLES can be adequately addressed using fewer activities than presented • permitted changes are to be made at the district, school, or teacher level
Districts have been requested to inform teachers of decisions made. Implementation of Activities in the Classroom Incorporation of activities into lesson plans is critical to the successful implementation of the Louisiana Comprehensive Curriculum. Lesson plans should be designed to introduce students to one or more of the activities, to provide background information and follow-up, and to prepare students for success in mastering the Grade-Level Expectations associated with the activities. Lesson plans should address individual needs of students and should include processes for re-teaching concepts or skills for students who need additional instruction. Appropriate accommodations must be made for students with disabilities. New Features Content Area Literacy Strategies are an integral part of approximately one-third of the activities. Strategy names are italicized. The link (view literacy strategy descriptions) opens a document containing detailed descriptions and examples of the literacy strategies. This document can also be accessed directly at http://www.louisianaschools.net/lde/uploads/11056.doc. A Materials List is provided for each activity and Blackline Masters (BLMs) are provided to assist in the delivery of activities or to assess student learning. A separate Blackline Master document is provided for each course. The Access Guide to the Comprehensive Curriculum is an online database of suggested strategies, accommodations, assistive technology, and assessment options that may provide greater access to the curriculum activities. The Access Guide will be piloted during the 2008-2009 school year in Grades 4 and 8, with other grades to be added over time. Click on the Access Guide icon found on the first page of each unit or by going directly to the url http://mconn.doe.state.la.us/accessguide/default.aspx.

Louisiana Comprehensive Curriculum, Revised 2008
Math Essentials Unit 1 Ratio and Proportion 1
Math Essentials
Unit 1: Ratio and Proportion Time Frame: Approximately 3.5 weeks Unit Description This unit focuses on converting between units of measure, creating and interpreting maps and diagrams using scale values, and determining percentages. Student Understandings In this unit students will develop the ability to accurately use a ratio scale in a map or diagram to determine measurement of the actual distance or size. Additionally, students will be able to determine if a ratio represents a direct or inverse variation, as well as to solve for a variable in a given proportion, and to convert ratios into equivalent percent values. Guiding Questions
1. Can students determine if a given ratio represents a direct or inverse variation? 2. Can students use a scaled map or diagram to determine actual measurement? 3. Can students use proportional reasoning to solve for a missing quantity in a
ratio? 4. Can students use proportional reasoning to convert a ratio into an equivalent
percentage? Unit 1 Grade-Level Expectations (GLEs)
GLE # GLE Text and Benchmarks Number and Number Relations Grade 9 7. Use proportional reasoning to model and solve real-life problems involving
direct and inverse variation (N-6-H) 21. Determine appropriate units and scales to use when solving measurement
problems (M-1-H) (M-2-H)(M-3-H) Grade 10 4. Use ratios and proportional reasoning to solve a variety of real-life problems
including similar figures and scale drawings (N-6-H) (M-4-H) Grade 11-12 1. Read, write, and perform basic operations on complex numbers (N-1-H) (N-
5-H)

Louisiana Comprehensive Curriculum, Revised 2008
Math Essentials Unit 1 Ratio and Proportion 2
Sample Activities Activity 1: Introduction to ratios. (GLEs: Grade 9: 7, Grade 11-12: 1) Materials List: paper, pencil, chalkboard/whiteboard, chalk/markers In this activity, students will develop an understanding of ratio as a relationship of two quantities and will determine speed, time, and distance traveled. After explaining that a ratio is a relationship between two quantities which can be expressed as a fraction (e.g.. miles compared to gallons), have students use brainstorming (view literacy strategy descriptions) to determine other types of ratios they may use in everyday life. Reinforce the concept that a ratio is a relationship of two quantities using examples from the brainstorm activity. Explain that many of these comparisons can yield a rate. For example comparing miles traveled to hours traveled yields the rate of miles per hour. Using the ratio of miles traveled to time, the rate can be found by reducing the ratio to its
simplest form: 3006
mileshours
= 501
mileshour
. The ratio yields a rate of 50 miles per hour.
Reinforce the concept that the rate (speed) is the ratio of miles to hours. Extend this to the equation, distance is equal to rate (speed) times time. If a car is
traveling 60 mph 601
mileshour
⎛ ⎞⎜ ⎟⎝ ⎠
and travels for 4 hours 41
hours⎛ ⎞⎜ ⎟⎝ ⎠
, use the formula below
to find the distance the car will travel:
Distance = 601
mileshour
⎛ ⎞⎜ ⎟⎝ ⎠
X 41
hours⎛ ⎞⎜ ⎟⎝ ⎠
= 240 miles
NOTE: 1hourhour
⎛ ⎞ =⎜ ⎟⎝ ⎠
therefore these units cancel.
At this point students may need to review the concept of unity. For example, the ratio 60 minutes 1
1 hour= . By changing 1 hour to the equivalent of 60 minutes, the ratio becomes
60 minutes 160 minutes
= . Additionally, 1 hour 60 minutes60 minutes 1 hour
= .
Ask students, “How can we determine the time traveled if we are given the rate (speed)
and distance traveled?” Time traveled is the ratio of distancerate
.

Louisiana Comprehensive Curriculum, Revised 2008
Math Essentials Unit 1 Ratio and Proportion 3
Example: time = 150 150 1 3 50 / 1 50
miles miles hourX hoursmiles hour miles
= = .
Provide students with other opportunities to practice determining rate of speed, time traveled, and distance traveled. Activity 2: Direct and Inverse Variation (GLEs: Grade 9: 7; Grade 11-12: 1 ) Materials List: paper, pencil, chalkboard/whiteboard, chalk/markers Explain that direct variations exist when two quantities increase or decrease at the same rate. Example: Your paycheck increases the more hours you work. Note: To be a direct variation, 0 units of the first quantity must equal 0 units of the second quantity. The ratio of your pay per hour to the number of hours you work is not a direct variation. Example: You can buy 10 apples for $5.00 and 20 apples cost $10.00. This information provides the ratios 10 20 and 5 10
. Since both the numerator and denominator double in size, the ratios
represent a direct variation. In order to vary inversely, the ratio must be equal to a given constant (k). If xy = k, where x and y are variables and k is a constant, then x and y vary inversely. The constant (k) is called the constant of variation. Example: In a distance problem, rate and time are inverse variations, with distance
designated as the constant. [ d = (r) (t) ] Therefore, andd dr = t = t r
. Note r and t vary
inversely as each other. Have students discuss some examples from real life that have a direct and inverse variation. Use split page notetaking (view literacy strategy descriptions) to record the scenario on one side and the proportion, along with its solution, opposite the scenario. Activity 3: On the Go! (GLEs: Grade 9: 7; Grade 10: 4; Grade 11-12: 1) Materials List: paper, pencil, chalkboard/whiteboard, chalk/markers, TI-83/84 calculator for each student In this activity, students will learn how ratios are used when traveling by car. The teacher should put the following scenario on the chalk/white board:
Mary drove 150 miles in 3 hours and used 6 gallons of gasoline.
Louisiana Comprehensive Curriculum, Revised 2008
Math Essentials Unit 1 Ratio and Proportion 4
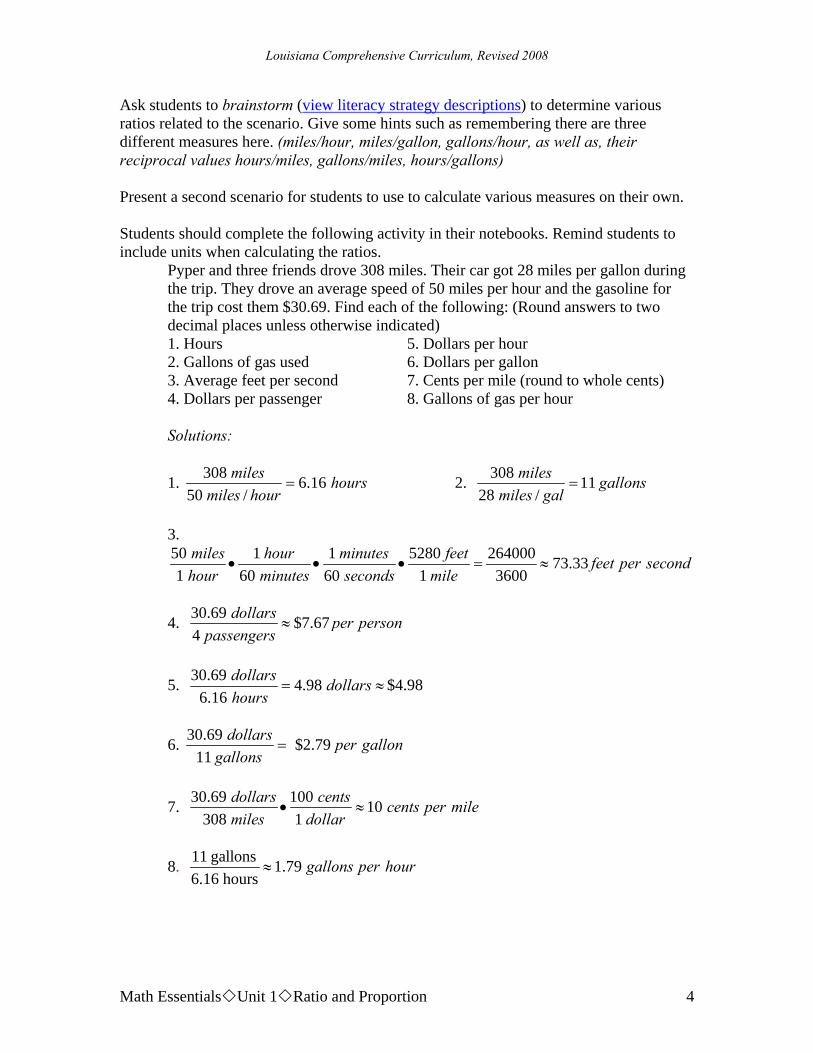
Ask students to brainstorm (view literacy strategy descriptions) to determine various ratios related to the scenario. Give some hints such as remembering there are three different measures here. (miles/hour, miles/gallon, gallons/hour, as well as, their reciprocal values hours/miles, gallons/miles, hours/gallons) Present a second scenario for students to use to calculate various measures on their own. Students should complete the following activity in their notebooks. Remind students to include units when calculating the ratios.
Pyper and three friends drove 308 miles. Their car got 28 miles per gallon during the trip. They drove an average speed of 50 miles per hour and the gasoline for the trip cost them $30.69. Find each of the following: (Round answers to two decimal places unless otherwise indicated) 1. Hours 5. Dollars per hour 2. Gallons of gas used 6. Dollars per gallon 3. Average feet per second 7. Cents per mile (round to whole cents) 4. Dollars per passenger 8. Gallons of gas per hour Solutions:
1. 308 6.16 50 /
miles hoursmiles hour
= 2. 308 11 28 /
miles gallonsmiles gal
=
3. 50 1 1 5280 264000 73.33 1 60 60 1 3600
miles hour minutes feet feet per secondhour minutes seconds mile
• • • = ≈
4. 30.69 $7.67 4
dollars per personpassengers
≈
5. 30.69 4.98 6.16
dollars dollarshours
= ≈ $4.98
6. 30.69 $2.79 11
=dollars per gallon
gallons
7. 30.69 100 10 308 1
dollars cents cents per milemiles dollar
• ≈
8. 11 gallons 1.79 6.16 hours
gallons per hour≈

Louisiana Comprehensive Curriculum, Revised 2008
Math Essentials Unit 1 Ratio and Proportion 5
Upon completion of the activity, students working in groups of four should create a similar scenario using a math story chain (view literacy strategy descriptions). Groups should then exchange papers and determine each of the 8 ratios listed above. For example:
Student 1 begins: Three friends went on a trip to New York which is 250 miles away. Student 2 continues: Their car got 20 miles per gallon during the trip. Student 3 continues: They drove an average speed of 65 miles per hour because they were on the interstate. Student 4: Gasoline for the trip cost them $8.00.
As they complete their story, students need to check for accuracy of the problem they are creating. Note, student 4 does not give a reasonable amount for the cost of the gasoline. Students must be sure that their problem makes sense before attempting to solve it. Additionally, as students determine the 8 ratios, encourage them to ensure that their answers are reasonable. For example: Student 2 wrote that the car got 20 miles per gallon during the trip. Students in the group should be aware that the answer to how many gallons of gas were used must be somewhere between 10 and 15. This is because 10 gallons would take them 200 miles and 15 gallons, 300 miles. If time permits, after all groups have created their stories and determined the ratios, groups could exchange stories and determine the ratios for a new story. Activity 4: Shopping (GLEs: Grade 9: 7; Grade 10: 4; Grade 11-12: 1) Materials List: paper, pencil, chalkboard/whiteboard, chalk/markers, Shopping BLM Understanding ratio and proportion helps students make informed decisions before making a purchase when shopping. For example: Which is the better buy? 3 oranges for $2.00 or 2 oranges for $1.00.
Set up two ratios 3 2and2 1
, then cross-multiply as follows (3 X 1 = 3) and keep this
product on the left side. Then multiply (2 X 2 = 4) and place this product on the right side. This yields 3 4< ; therefore, the ratio on the right (the second option), 2 oranges for $1.00, is the best buy. A second method would be to get equivalent denominators and then compare numerators.
For example, 3 6 2 8 and 2 4 1 4= = . Since the numerator of the second option is larger
when the denominators are equal, the second option is the best buy. A third method for solving this problem would be to simplify both ratios to ratios with a denominator of 1. The first option simplifies to 0.75 to 1. The second option is 2 to 1; therefore, the second option is the best buy.

Louisiana Comprehensive Curriculum, Revised 2008
Math Essentials Unit 1 Ratio and Proportion 6
The teacher should provide a few more examples as guided practice with the students, and then have them complete the Shopping BLM. Students will use proportional reasoning, demonstrated previously by the teacher to determine which purchase Brand A or Brand B is the best deal when purchasing a grocery item. Students should complete the Shopping BLMs individually. Upon individual completion, students should pair and share their findings, discussing strategies and methods used to determine the best buy. Activity 5: Scale Drawings (GLEs: Grade 9: 7, 21; Grade 10: 4; Grade 11-12: 1) Materials List: paper, pencil, chalkboard/whiteboard, chalk/markers, ruler with standard and metric measure, calculators, Blueprints BLM In scale drawings/maps, the ratio of a length on the drawing or map to the corresponding length on the object is called the scale factor or scale ratio.
For example: A scale factor of 1 inch5 feet
would indicate that each inch on the drawing
represents 5 feet in actual measure. Provide a few more examples if needed. Review how to determine perimeter and area of rectangles if needed. In the drawing below, the scale factor is 1 inch = 3 feet. What are the actual measurements of the figure?
To find length 1 inch 1.5 inches3 feet x feet
= , therefore x = 4.5 feet
To find width 1 inch .5 inch3 feet x feet
= , therefore x = 1.5 feet.
Given the Blueprints BLMs, students will determine the actual measurement of each of the rooms using a scale of 1 inch equals 8 feet. Students will also be required to determine area and perimeter of each of the rooms. Activity 6: Get in Gear! (GLEs: Grade 9: 21; Grade 10: 4; Grade 11-12: 1) Materials List: paper, pencil, chalkboard/whiteboard, chalk/markers, Get in Gear! BLM, Internet (optional)
½ inch
1 ½ inches
Louisiana Comprehensive Curriculum, Revised 2008
Math Essentials Unit 1 Ratio and Proportion 7
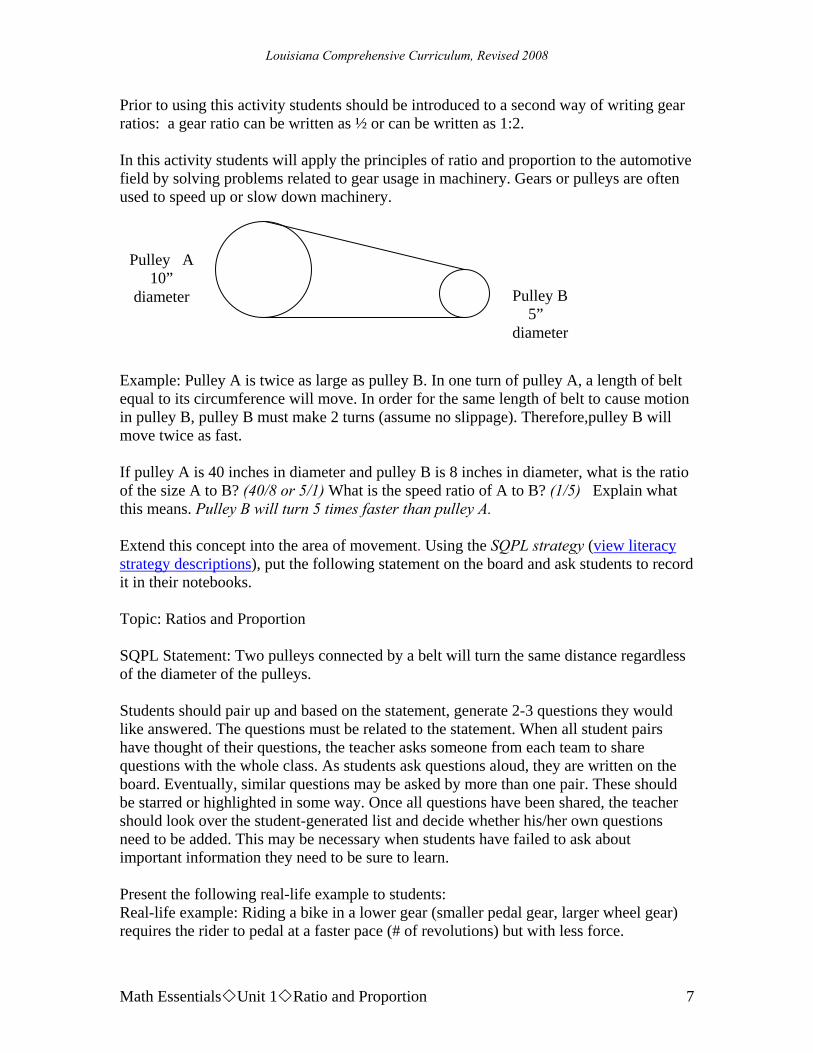
Prior to using this activity students should be introduced to a second way of writing gear ratios: a gear ratio can be written as ½ or can be written as 1:2. In this activity students will apply the principles of ratio and proportion to the automotive field by solving problems related to gear usage in machinery. Gears or pulleys are often used to speed up or slow down machinery. Example: Pulley A is twice as large as pulley B. In one turn of pulley A, a length of belt equal to its circumference will move. In order for the same length of belt to cause motion in pulley B, pulley B must make 2 turns (assume no slippage). Therefore,pulley B will move twice as fast. If pulley A is 40 inches in diameter and pulley B is 8 inches in diameter, what is the ratio of the size A to B? (40/8 or 5/1) What is the speed ratio of A to B? (1/5) Explain what this means. Pulley B will turn 5 times faster than pulley A. Extend this concept into the area of movement. Using the SQPL strategy (view literacy strategy descriptions), put the following statement on the board and ask students to record it in their notebooks. Topic: Ratios and Proportion SQPL Statement: Two pulleys connected by a belt will turn the same distance regardless of the diameter of the pulleys. Students should pair up and based on the statement, generate 2-3 questions they would like answered. The questions must be related to the statement. When all student pairs have thought of their questions, the teacher asks someone from each team to share questions with the whole class. As students ask questions aloud, they are written on the board. Eventually, similar questions may be asked by more than one pair. These should be starred or highlighted in some way. Once all questions have been shared, the teacher should look over the student-generated list and decide whether his/her own questions need to be added. This may be necessary when students have failed to ask about important information they need to be sure to learn. Present the following real-life example to students: Real-life example: Riding a bike in a lower gear (smaller pedal gear, larger wheel gear) requires the rider to pedal at a faster pace (# of revolutions) but with less force.
Pulley A 10”
diameter Pulley B 5” diameter

Louisiana Comprehensive Curriculum, Revised 2008
Math Essentials Unit 1 Ratio and Proportion 8
Conversely, riding in a higher gear (larger pedal gear, smaller wheel gear) allows a higher speed for a given pace but requires greater force. In either case, the distance traveled by both the pedal turning and the rear wheel turning is the same. http://www.windpower.org/en/kids/choose/gear/cycling.htm provides a great example of this concept. On this same site, switch to gear box construction to get an inside view of how gears work. Students should attempt to answer their SQPL questions as they discuss the real-life example above. Stop periodically and review with students which questions have been answered based on the content presented. The statement is true. Although Pulley B is smaller, it is turning faster, therefore, the point on pulley B will travel the same distance. This type of pulley or gear system is set up to enable machines to have more torque or more speed. For more torque, the smaller pulley/gear is the driver and must turn more quickly enabling the larger pulley/gear to move. For more speed, the larger pulley/gear is the driver and only has to turn a small amount to make the smaller pulley/gear turn faster. Students should complete the Get in Gear! BLMs, which provide real-world applications of gear ratios. Activity 7: Percentages (GLEs: Grade 9: 7; Grade 10: 4; Grade 11-12: 1) Materials List: paper, pencil, chalkboard/whiteboard, chalk/markers, calculators Proportions often represent percentages, in which a quantity is compared to 100. For example: If your gross pay was $350 and total taxes deducted were $63, what percentage is being deducted for taxes?
The ratio of taxes deducted to gross pay is $63$350
. Set up a proportion $63$350 100
x= .
Solving for x we get x = .18 or 18%. Provide students with a worksheet that has 10-15 problems that require students to determine the percentage of a ratio of a part to a whole, using proportions as in the example above. After completion and correction of the worksheet problems, have students write in their math learning logs (view literacy strategy descriptions) a possible method for estimating the percentage without actually solving the proportion. (Answers will vary but an example would be: Determine how many sets of 100 are in the denominator and then multiply this by a rounded numerator to get an estimate. There are three sets of 100 in $350, so multiply 3 times 60 to yield 18%.) A math learning log can be a notebook that

Louisiana Comprehensive Curriculum, Revised 2008
Math Essentials Unit 1 Ratio and Proportion 9
serves as the repository for all math writing required throughout this course. Requiring students to document their ideas and strategies offers a reflection of understanding that can lead to further study and alternative learning paths. Activity 8: Business Application 1 (GLEs: Grade 9: 7; Grade 10: 4; Grade 11-12: 1) Materials List: paper, pencil, chalkboard/whiteboard, chalk/markers, calculators, Determining Salaries BLM In the previous activity, students were asked to determine the percentage. In this activity. students will be given a percentage and asked to determine the amount the percentage represents. For example: You earned a 20% commission on your sales of $400. How much was your commission?
Use the proportion Percent Part=100 Whole
. The problem above yields the proportion,
20 Part=100 $400
. Cross multiplying yields (20 x 400) 100 = 80÷ , therefore your commission
is $80. Students may require a few more teacher-generated examples before completing the Determining Salaries BLMs. Activity 9: Estimating Populations (GLEs: Grade 9: 7; Grade 10: 4; Grade 11-12: 1) Materials List: paper, pencil, chalkboard/whiteboard, chalk/markers, one gallon size Ziploc® bag half full with large white beans per group, 1 scooper per group, Estimating Populations BLM Wildlife rangers often use ratio and proportion to estimate populations of animals in the wild. It would be difficult to round them all up and then try to count them. Students may have seen animals in the wild that have been tagged. Tagging an animal allows wildlife rangers to use these animals to determine the entire population. The Estimating Populations BLM allows students to work through the process the wildlife officials use to estimate populations. It is recommended that students do this either as pairs or groups of four, which allows students to discuss the situation before making hypotheses regarding population size. It also speeds up the process. If using pairs, one person scoops and counts while the other records and presents findings to the class. If using groups of four, one student should be each of the following: recorder, scooper, counter and presenter.

Louisiana Comprehensive Curriculum, Revised 2008
Math Essentials Unit 1 Ratio and Proportion 10
NOTE: Answers will vary but this activity should yield a very close estimate of the total number of beans in the bag. Encourage a discussion with students regarding other wildlife populations that might be estimated by the tag and release method. Additionally, the teacher and students can discuss the pros and cons of this type of estimation.
Sample Assessments General Assessments Performance and other types of assessments can be used to ascertain student achievement. Here are some examples. Performance Task: Scale Drawing The student will make a scale drawing of a room in his/her home. The student will require a measuring stick or measuring tape, pencil and grid paper.
1. The student will measure the length and width of any room in his/her home. It is easier to choose a rectangular room, but a non-rectangular room can be chosen. The student will write down the measurements on scratch paper. 2. The student will measure the length and width of a minimum of three objects in the room, such as a bed or table. The student will write down these measurements on scratch paper. 3. The student will measure the distances from the two closest walls to the objects used in #2. The student will write down these measurements on scratch paper. 4. The student will choose an appropriate scale and use it to draw the perimeter of
the room on grid paper. Remind students: scale = drawing sizereal size
.
5. The student will use the measurements found in #2 and #3 to place the objects measured in #2 in the scale drawing of the room. Remind students to be certain that the objects are the correct size and in the correct place. 6. The student will label all objects with measurements and label the distance from the walls.
The student will attach all computational work used to draw the object and will list the scale factor at the bottom right hand of the drawing.

Louisiana Comprehensive Curriculum, Revised 2008
Math Essentials Unit 1 Ratio and Proportion 11
Scoring Rubric Score Description
4 • Student demonstrates an in-depth understanding of the relevant procedures.
• Student completes all important components of the task accurately • Where appropriate the student uses more sophisticated reasoning and/or
efficient procedures. 3 • Student completes most important aspects of the task accurately.
• Correct strategy, but copying error caused incorrect answer. 2 • Student completes some important aspects of the task accurately.
• Correct answer, but the solution process/strategy is unclear. 1 • Evidence of some understanding of the task.
• A correct answer is reached but it is impossible to tell how it was reached.
0 • Nothing is done, except to guess or recopy the problem. • Only an incorrect answer is given.
• The student will submit a portfolio containing items such as:
examples of student products scored tests and quizzes student work (in-class or homework)
• The student will complete journal writings using such topics as: Write a letter to a friend explaining solving for a variable in a
proportion. Describe a situation from your experience of a ratio with a direct or
indirect variation. • Monitor student progress using bellringers or small quizzes to check for
understanding during the unit on such topics as the following: Solve for a variable in a proportion in a variety of real-life problems. Explain why a ratio represents a direct/inverse variation. Use scaled drawings or maps to determine actual size measurements. Use proportions to determine percentages. Use proportions to find the value, given its percentage of a whole
value. • The student will demonstrate proficiency on a comprehensive assessment on
the topics listed above.
Activity Specific Assessments
• Activity 1: Traveling at 40 miles per hour, how many hours will it take for Susie to reach the airport if it is 60 miles away? Give your answer in minutes. (90 minutes)
Louisiana Comprehensive Curriculum, Revised 2008
Math Essentials Unit 1 Ratio and Proportion 12
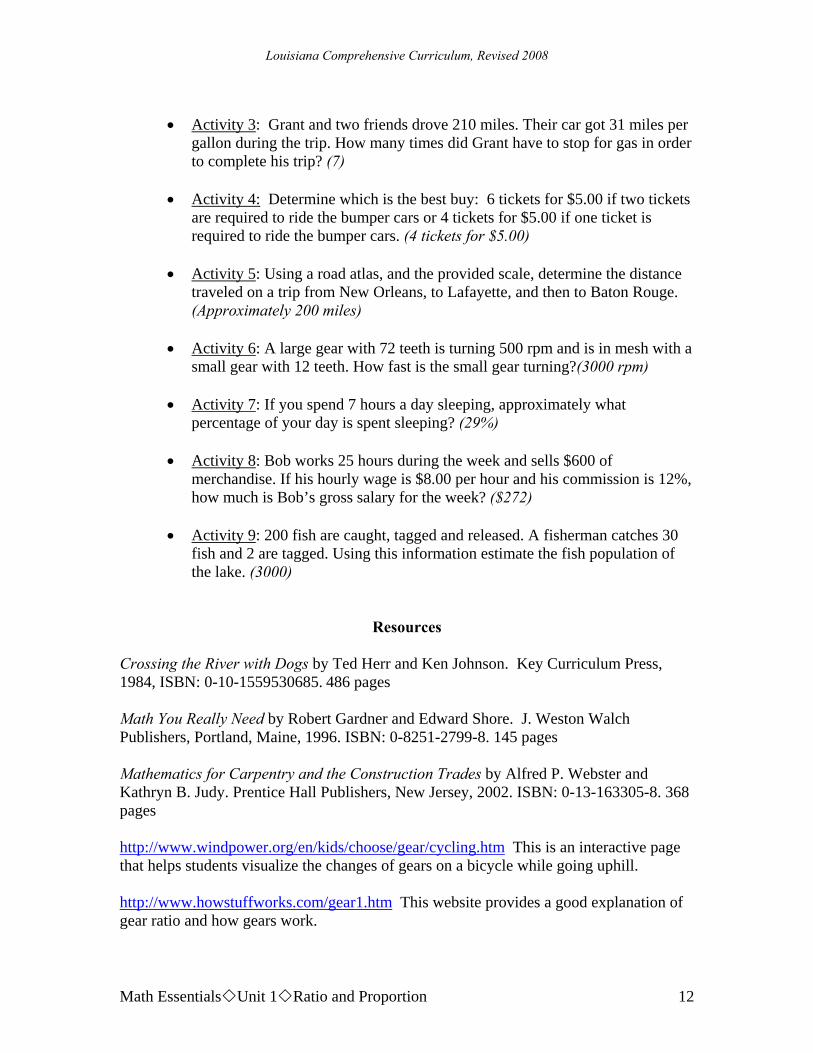
• Activity 3: Grant and two friends drove 210 miles. Their car got 31 miles per
gallon during the trip. How many times did Grant have to stop for gas in order to complete his trip? (7)
• Activity 4: Determine which is the best buy: 6 tickets for $5.00 if two tickets
are required to ride the bumper cars or 4 tickets for $5.00 if one ticket is required to ride the bumper cars. (4 tickets for $5.00)
• Activity 5: Using a road atlas, and the provided scale, determine the distance
traveled on a trip from New Orleans, to Lafayette, and then to Baton Rouge. (Approximately 200 miles)
• Activity 6: A large gear with 72 teeth is turning 500 rpm and is in mesh with a small gear with 12 teeth. How fast is the small gear turning?(3000 rpm)
• Activity 7: If you spend 7 hours a day sleeping, approximately what
percentage of your day is spent sleeping? (29%) • Activity 8: Bob works 25 hours during the week and sells $600 of
merchandise. If his hourly wage is $8.00 per hour and his commission is 12%, how much is Bob’s gross salary for the week? ($272)
• Activity 9: 200 fish are caught, tagged and released. A fisherman catches 30
fish and 2 are tagged. Using this information estimate the fish population of the lake. (3000)
Resources
Crossing the River with Dogs by Ted Herr and Ken Johnson. Key Curriculum Press, 1984, ISBN: 0-10-1559530685. 486 pages Math You Really Need by Robert Gardner and Edward Shore. J. Weston Walch Publishers, Portland, Maine, 1996. ISBN: 0-8251-2799-8. 145 pages Mathematics for Carpentry and the Construction Trades by Alfred P. Webster and Kathryn B. Judy. Prentice Hall Publishers, New Jersey, 2002. ISBN: 0-13-163305-8. 368 pages http://www.windpower.org/en/kids/choose/gear/cycling.htm This is an interactive page that helps students visualize the changes of gears on a bicycle while going uphill.
http://www.howstuffworks.com/gear1.htm This website provides a good explanation of gear ratio and how gears work.
Louisiana Comprehensive Curriculum, Revised 2008
Math Essentials Unit 2 Probability 13
Math Essentials Unit 2: Probability
Time Frame: Approximately 4 weeks Unit Description This unit focuses on providing an introduction to probability using counting techniques such as permutations and combinations, as well as, comparing theoretical and experimental probabilities. Student Understandings In this unit students will develop the ability to define and accurately compute probabilities for both dependent and independent events. Students will use counting techniques to compute probabilities as well as solve real life problems. Students will be able to represent experimental probability in a graphical representation. Students will be able to explain the relationship between odds and probability Guiding Questions:
1. Can students determine which counting principle, permutation or combination, is applicable to a variety of real-life problems?
2. Can students accurately describe the differences between theoretical and experimental probabilities?
3. Can students determine the theoretical probability of both dependent and independent events?
4. Can students represent the outcomes of experimental data in a variety of graphical formats?
5. Can students use permutations or combinations to solve problems in a variety of real life situations?
Unit 2 Grade-Level Expectations (GLEs)
GLE# GLE Text and Benchmarks Data Analysis, Probability, and Discrete Math Grade 9 31. Define probability in terms of sample spaces, outcomes, and events (D-4-H) 32. Compute probabilities using geometric models and basic counting techniques
such as combinations and permutations (D-4-H) 33. Explain the relationship between the probability of an event occurring, and the
odds of an event occurring and compute one given the other (D-4-H)

Louisiana Comprehensive Curriculum, Revised 2008
Math Essentials Unit 2 Probability 14
Grade 10 21. Determine the probability of conditional and multiple events, including
mutually and non-mutually exclusive events (D-4-H) (D-5-H) 22. Interpret and summarize a set of experimental data presented in a table, bar
graph, line graph, scatter plot, matrix, or circle graph (D-7-H) 24. Use counting procedures and techniques to solve real-life problems (D-9-H) 25. Use discrete math to model real-life situation (e.g., fair games, elections)
(D-9-H)
Sample Activities Activity 1: Vocabulary (GLEs: Grade 9: 31) Materials List: pencil, paper, chalk/white board, chalk/marker, Probability Vocabulary Self-Awareness Chart This activity encompasses use throughout the unit. A vocabulary self-awareness (view literacy strategy descriptions) chart should be completed at the beginning of the unit to access previous knowledge. Over the course of the unit, as students are exposed to new concepts, they should be reminded to return often to the chart and add new information to it. The goal is to replace all the check marks (minimal understanding) and minus signs (little or no understanding) with a plus sign (understand well). Students continue to visit the chart throughout the unit. Allow for multiple opportunities to review and update their understanding of the concepts presented throughout the unit. The following are examples of vocabulary words that could be included for this unit. Probability Vocabulary Self-Awareness Chart Word + √ - Example Definition combination event odds outcome(s) permutation probability ratio Activity 2: Ratio to Probability (GLEs: Grade 9: 31) Materials List: paper, pencil, chalk/white board, chalk/marker In this activity students will explore probability written as a ratio. The numerator represents the number of expected outcomes divided by the denominator which is the

Louisiana Comprehensive Curriculum, Revised 2008
Math Essentials Unit 2 Probability 15
total number of possible outcomes. For example: flipping a coin and the probability will be heads. There is one way this can occur out of two possible outcomes (heads or tails).
The probability of rolling a 3 on a die is 16
(one outcome of rolling a three compared to
six possible outcomes). Explain that the ratio that represents probability is a number between 0 and 1. It expresses the likelihood that a given event (or set of outcomes) will occur. 0 – the event will not occur EX: A three-month old baby graduates from high school. 1 – the event will definitely occur EX: If you cut your finger it will bleed. The teacher along with students should brainstorm (view literacy strategy descriptions) other common probabilities and write them as ratios both on the board and in their notebook. Activity 3: Outcomes of Independent and Dependent Events (GLEs: Grade 9: 31; Grade 10: 25) Materials List: paper, pencil, chalk/white board, chalk/marker Explain to students that when they are determining probability, it is important to know if the probability of a single event or a group of events is being determined. Secondly, it is important to know if the outcomes are dependent or independent. In this activity students will learn to determine these two very important criteria. Using split-page notetaking (view literacy strategy descriptions), students should record the type of event, including the description, on the left and examples of these events on the right side of the page. Examples are listed below.
Independent events: Examples: The outcome of one event does not - Choosing the color and size of a t-shirt. affect the outcome of another event - Rolling a 3 on die and picking a face card from a deck of cards. - enrolling in math and robotics courses Dependent events: Examples: The outcome of one event does - Picking the first, second and third place affect the outcome of another event. winners in a contest from 50 contestants. - Earning an A in mathematics and having a 4.0 grade point average

Louisiana Comprehensive Curriculum, Revised 2008
Math Essentials Unit 2 Probability 16
Single events are always independent events. When dealing with more than a single event, it is important to determine if the multiple events are independent or dependent. In determining probability of multiple events, whether dependent or independent, it is important to be able to count the total number of possible outcomes. Set up 4 chairs in the front of the room. After students sit down, call four students to the front of the room and tell them it is their challenge to find as many ways as possible to each sit in a chair. Before allowing the students to begin, have the students in the class try to determine the number of different ways possible. After writing down all choices the four students should begin their activity. Each time they sit, record the order of the students to ensure no duplicates. When finished, discuss who came closest and possible the reasons why. Put four lines on the board and guide students through an understanding of how possible outcomes can be determined mathematically. 4 goes in the first slot as there are 4 possible choices for the first chair. Once someone is seated there are only 3 people to choose from, so write in the second line 3. Point out that there are only 2 possible outcomes for the third line, and only one possible outcome for the fourth line. Multiplying the outcomes together gives total possible outcomes. (4*3*2*1 = 24). This method is much easier than constructing counting trees to determine outcomes, especially with larger numbers. Explain that this concept is the Fundamental Counting Principle. More examples to use: Total possible phone numbers in one area code. (9*10*10*10*10*10*10 = 90,000,000 Note: 9 for the first number because telephone numbers do not begin with 0). Total possible license plates, if the first three spaces are letters and the next three numbers. (26*26*26*10*10*10 = 17,576,000) Brainstorm (view literacy strategy descriptions) real-world uses and determine the total possible outcomes. Examples: PIN codes for a debit card, email password, combination for a safe. Include examples in the student notebooks using split-page notetaking, examining those events that are dependent and those that are independent. Activity 4: Permutation or Combination? (GLEs: Grade 9: 31, 32; Grade 10: 24) Materials List: paper, pencil, chalk/white board, chalk/marker, Out of Order BLM In this activity students will explore the counting techniques of permutations and combinations to determine total possible outcomes of real-world applications. When objects or people are arranged in a certain order it is called a permutation. In the previous activity it was determined, given four chairs the number of different ways four people could sit in the chairs. This is a permutation. The order in which they are seated is also important. If order did not matter in the case of the four students, then there would

Louisiana Comprehensive Curriculum, Revised 2008
Math Essentials Unit 2 Probability 17
be only one way to seat all four. The four would be seated in some manner the first time out. The number of permutations of n objects taken r at a time is defined as:
!( , )( )!
nP n rn r
=−
For example: If choosing 1st, 2nd, and 3rd in a contest from the 10 persons who entered the contest, it would be:
10! 10 9 8(10,3) = =120 (10 3)! 3 2 1
P ⋅ ⋅=
− ⋅ ⋅ways
The number of combinations of n distinct objects taken r at a time is defined as:
!( , )( )! !
nC n rn r r
=−
This counting technique is used when order does not matter. For example, if you are choosing 4 people from 20 people to be on a committee, the order in which they are chosen would not matter. The number of combinations would be:
20! 20 19 18 17(20,4) 4845(20 4)!4! 4 3 2 1
C ⋅ ⋅ ⋅= = =
− ⋅ ⋅ ⋅ways
A combination reduces the number of different ways by removing those outcomes that are duplicates. For example, choosing A, B, C, D is the same as B, A, D, C, or any other combinations of the four letters. Students will complete the Out of Order BLMs to aid in reinforcement of the understanding of permutations and combinations. Activity 5: Gambler’s Fallacy (GLEs: Grade 9: 31; Grade 10: 21, 25) Materials List: paper, pencil, chalk/white board, chalk/marker Use SQPL(student questions for purposeful learning) strategy (view literacy strategy descriptions) providing students with the statement:
If I am flipping a coin 10 times, and the first 5 times it turns up heads, the next time I flip the coin, I will get tails.
Students should pair up, and based on the statement, generate 2-3 questions they would like answered. When all students have thought of and written down their questions, the teacher asks someone from each team to share questions with the whole class. All

Louisiana Comprehensive Curriculum, Revised 2008
Math Essentials Unit 2 Probability 18
duplicate questions should be marked with an asterisk. Provide additional questions if important information has not been asked by the students. Discuss with students answers to the questions generated. Explain that this belief is known as the gambler’s fallacy. Discuss why the belief in the statement might be called the gambler’s fallacy. (Gamblers often believe the statement is true; however, the events are independent and therefore the outcome of the 6th roll of the die is not affected by the any previous roll.) Relate this back to the previous activity in which they had to determine independent and dependent events. Activity 6: Theoretical Probability (GLEs: Grade 9: 31; Grade 10: 21, 22) Materials List: pencil, paper, 12 beans for each student, How Probable Is It? BLM, 2 dice We begin this activity with a warm-up. Ask each student to take out a piece of paper, turn it sideways (landscape), and write across the bottom of the page evenly spaced numbers from 1 – 12. While students are doing this, pass out 12 beans to each student. The goal of the game is to remove the beans one at a time from the playing field as that sum is rolled on the dice. Explain to students that they can put the beans on any number they choose. All the beans can be placed in a row above one number, one bean on each number, or any given number of beans on numerous numbers. Once this is done, roll the pair of dice calling out the sum of the two dice. For example, if a three is rolled each student who has beans on the number three can remove one of them. This process continues until someone has removed all of his/her beans and is declared the winner. This is a fun activity especially when some students put a bean on the number one only to realize much later that the number one is impossible since two dice are rolled. Once a student wins, ask students what they noticed. (The numbers, 6, 7, 8 come up more often.) Play this game again and note the changes the students make in putting the beans on certain numbers. Assess if they are beginning to understand probability intuitively. This activity continues with the How Probable Is It? BLM used to promote applied thinking and reasoning in probability. Students will work with partners to fill in the chart and answer questions. After it is completed, engage the class in a discussion and evaluation of each student pair’s solution. This should include using the counting principle to determine total outcomes. (6 possible outcomes on one die times 6 possible outcomes on the second die yield a total of 36 possible outcomes using both dice.)
Louisiana Comprehensive Curriculum, Revised 2008
Math Essentials Unit 2 Probability 19
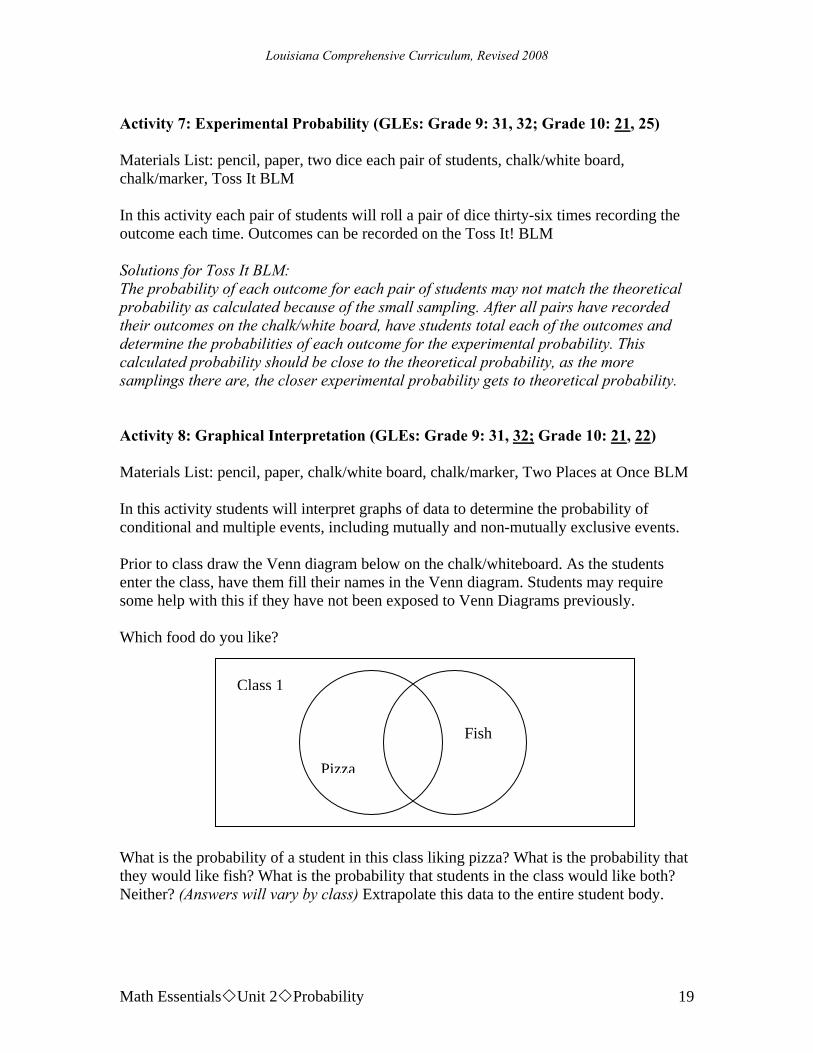
Activity 7: Experimental Probability (GLEs: Grade 9: 31, 32; Grade 10: 21, 25) Materials List: pencil, paper, two dice each pair of students, chalk/white board, chalk/marker, Toss It BLM In this activity each pair of students will roll a pair of dice thirty-six times recording the outcome each time. Outcomes can be recorded on the Toss It! BLM Solutions for Toss It BLM: The probability of each outcome for each pair of students may not match the theoretical probability as calculated because of the small sampling. After all pairs have recorded their outcomes on the chalk/white board, have students total each of the outcomes and determine the probabilities of each outcome for the experimental probability. This calculated probability should be close to the theoretical probability, as the more samplings there are, the closer experimental probability gets to theoretical probability. Activity 8: Graphical Interpretation (GLEs: Grade 9: 31, 32; Grade 10: 21, 22) Materials List: pencil, paper, chalk/white board, chalk/marker, Two Places at Once BLM In this activity students will interpret graphs of data to determine the probability of conditional and multiple events, including mutually and non-mutually exclusive events. Prior to class draw the Venn diagram below on the chalk/whiteboard. As the students enter the class, have them fill their names in the Venn diagram. Students may require some help with this if they have not been exposed to Venn Diagrams previously. Which food do you like? What is the probability of a student in this class liking pizza? What is the probability that they would like fish? What is the probability that students in the class would like both? Neither? (Answers will vary by class) Extrapolate this data to the entire student body.
Class 1
Pizza
Fish

Louisiana Comprehensive Curriculum, Revised 2008
Math Essentials Unit 2 Probability 20
Explain to students that the two events (liking fish or liking pizza) are not mutually exclusive events because they can like both fish and pizza. However, some events are mutually exclusive, for example, choosing cone or cup for a scoop of ice cream. This is an important concept when determining probability because one event can be included in more than one outcome. If two events A and B are mutually exclusive, then the probability that either A or B occurs is the sum of their probabilities, and is written as: P(A or B) = P(A) + P(B) If two events are not mutually exclusive and therefore inclusive, the probability that either A or B occurs is the sum of their probabilities decreased by the probability of both occurring. It is written as: P(A or B) = P(A) + P(B) – P(A and B). Probability can be determined from a variety of statistical graphs including Venn diagrams, bar graphs, pie graphs and tabular data. Students should complete the Two Places at Once BLMs to aid in student conceptual understanding. Activity 9: Fairness (GLEs: Grade 10: 24, 25) Materials List: paper, pencil, chalk/white board, chalk/marker, pair of dice for every 2 students In this activity students will use discrete math to determine fairness in game playing. Upon completion of the activity, students will calculate the probability of each of the possible outcomes. Finally, discussion will ensue regarding the fairness of some popular games. Game 1 Play the paper, scissors, rock game with three players and one recorder, but this time with a twist. All players make a fist, and on the count of three, each player shows either: paper – a flat hand across the palm scissors – point two fingers like a scissors rock - keep the fist closed Decide who is player A, B, and C and play 20 times with these rules: Player A gets a point if all players show the same sign. Player B gets a point if only two players show the same sign. Player C gets a point if all three players show different signs. Tally the winning points:

Louisiana Comprehensive Curriculum, Revised 2008
Math Essentials Unit 2 Probability 21
Player Tally Total A B C Discussion questions:
Is this game fair? (no) Which player would you rather be? (player B) What is the number of total outcomes? (27) What is the total of possible outcomes for player A? (3), player B? (18), player C? (6) How could you make the game fair? (Player A gets 6 points for each hand in his/her favor, player B gets 1 point for each hand in his/her favor and player C gets 3 points for each hand in his/her favor)
Game 2 This is a partner game. Take turns rolling a pair of dice. Player A scores a point if the sum is even. Player B scores a point if the sum is odd. Before the game begins, ask students if they think this game is fair. After the game is over discuss the results with students. Discussion:
Is this game fair? (yes) Why or why not? (There is the same number of possible outcomes for the sums of even numbers as there is odd numbers.) What is the number of total outcomes? (36) What is the total of possible outcomes for player A? (18) What is the total of possible outcomes for player B? (18)
Play the game again, this time finding the product of the two dice. Player A scores a point if the product is even. Player B scores a point if the product is odd. Before the game begins, ask students if they think this game will be fair. After the game is over discuss the results with students. Discussion:
Is this game fair? (no) Why or why not? (Player A wins more often because the product of two even or an odd and an even is even and only the product of two odd numbers is odd) What is the number of total outcomes? (36) What is the total of possible outcomes for player A? (27) What is the total of possible outcomes for player B? (9)

Louisiana Comprehensive Curriculum, Revised 2008
Math Essentials Unit 2 Probability 22
If not fair, how could the rules be changed to make it fair? (Player A could be awarded 1 point for each correct roll and player B could be awarded 2 points for each correct roll.)
Activity 10: Odds Are (GLEs: Grade 9: 33; Grade 10: 21, 24, 25) Materials List: paper, pencil, You Can Bet On It! BLM In this activity students will compute the odds of an event occurring. Explain to students that the odds of an event occurring are expressed as the ratio of the number of favorable outcomes to the number of unfavorable outcomes.
Number of Favorable OutcomesOdds =Number of Unfavorable Outcomes
Odds and probability of an event are related because the odds of an event can be determined if the probability of an event is known. For example:
The probability of rolling a 3 on a die is 1 Number of favorable outcomes6 Total possible outcomes= . Therefore
if the number of favorable outcomes is 1, and the total possible outcomes are 6, then the unfavorable outcomes must be 5. Knowing this, the odds of the event can be computed.
Number of Favorable Outcomes 1Odds =Number of Unfavorable Outcomes 5
= . Odds can also be written as 1:5 (read one
to five). Conversely, if you know the odds of an event you can determine the probability of the event. Students should complete You Can Bet On It BLMs to aid in development of calculating odds given various real-life events or given the probability of an event.

Louisiana Comprehensive Curriculum, Revised 2008
Math Essentials Unit 2 Probability 23
Sample Assessments General Assessments Performance and other types of assessments can be used to ascertain student achievement. Here are some examples. Performance Task: Marbles Each pair of students requires a bag of 10 marbles in which 4 are red, 3 are yellow, 2 are green and 1 is white. Have students complete the following steps of the performance task:
Step 1) Students should pick a marble, without looking, out of the bag of marbles and record the color of the marble drawn. Step 2) Return the drawn marble to the bag and then repeat step 1 again. Repeat the process 20 times.
Use the recorded results to answer the following questions regarding the bag of marbles.
1) Based on the results found in this performance task estimate the number of yellow marbles in the bag. Have students explain their answers. 2) Are each of the picks mutually exclusive? Explain. 3) The marble initially picked was not returned to the bag. How does that change the probability of picking another marble of the same color? Explain. 4) What are the odds of picking a marble that is white? How does this value differ from the probability of picking a white marble from the bag?
The following rubric may be used to assess students’ understanding of determining probability.

Louisiana Comprehensive Curriculum, Revised 2008
Math Essentials Unit 2 Probability 24
Scoring Rubric Score Description
4 • Student demonstrates an in-depth understanding of the relevant procedures.
• Student completes all important components of the task accurately • Where appropriate the student uses more sophisticated reasoning and/or
efficient procedures. 3 • Student completes most important aspects of the task accurately.
• Correct strategy, but copying error caused incorrect answer. 2 • Student completes some important aspects of the task accurately.
• Correct answer, but the solution process/strategy is unclear. 1 • Evidence of some understanding of the task.
• A correct answer is reached but it is impossible to tell how it was reached.
0 • Nothing is done, except to guess or recopy the problem. • Only an incorrect answer is given.
• The student will submit a portfolio containing items such as:
examples of student products scored tests and quizzes student work (in-class or homework)
• The student will complete journal writings using such topics as: Write a letter to a friend explaining how a ratio is related to
determining probability of an event. Describe a situation from experience for which knowing the
probability of an event was important. • Monitor student progress using bellringers or small quizzes to check for
understanding during the unit on such topics as the following: Determine the “fairness” of a game or activity. Explain the difference between a permutation and a combination. Determine the total possible outcomes of an event. Determine the probability of an event. Determine if an event is mutually exclusive. Explain and give examples of independent and dependent events. Given the probability of an event, determine the odds of the event. Given the odds of an event, determine the probability of the event.
• The student will demonstrate proficiency on a comprehensive assessment on the topics listed above.

Louisiana Comprehensive Curriculum, Revised 2008
Math Essentials Unit 2 Probability 25
Activity-Specific Assessments
• Activity 3: How many possible five letter computer passwords are possible if the password must be composed of two letters and three numbers? (676,000)
• Activity 4: Your teacher tells you that you will be given a permutation lock
for your locker. One of the students in your class laughs and states it’s a combination lock not a permutation lock? Who is correct and why? (The teacher is correct because the order in which the numbers are completed is important.)
• Activity 6: What is the probability of tossing an even sum on a pair of dice? (1/2)
• Activity 10: Given that the probability of an event occurring is 25
, what are
the odds of this event occurring? (2:3)
Resources Discovering Algebra: An Investigative Approach by Jerald Murdock, Ellen Kamischke, Eric Kamischke. Key Curriculum Press, Emeryville, CA, 2002. ISBN: 1-55953-340-4. 714 pages Stats, Modeling the World by David E. Bock, Paul F. Velleman, Richard D. DeVeaux. Pearson Education, Boston, MA 2004. ISBN: 0-201-73735-3. 582 pages http://www.teacherlink.org/content/math/interactive/probability/history/briefhistory/home.html This site provides a brief history of probability as well as an activity and additional resources. http://www.schools.utah.gov/curr/science/sciber00/7th/genetics/sciber/probab.htm This page provides some examples of using probability in real-world events. http://www.mathforum.org/library/topics/probability This site provides numerous resources for a unit on probability.
Louisiana Comprehensive Curriculum, Revised 2008
Math Essentials Unit 3 Statistics 26
Math Essentials Unit 3: Statistics
Time Frame: Approximately 3.5 weeks Unit Description The unit will focus on graph construction, graph interpretation, determining bias, and basic descriptive statistics. Student Understandings In this unit students will develop the ability to read, interpret and analyze statistics presented in a variety of formats, including bar graphs, pie charts, box and whisker plots, and scatter plots. Students will be able to devise and conduct surveys and predict future outcomes from the data collected, including the limitations of their predictions. Guiding Questions
1. Can students determine the most appropriate measure of central tendency for a given set of data based on its distributions?
2. Can students identify trends in the data and support conclusions based on the data?
3. Can students describe and interpret data in various forms of presentations including bar graphs, pie charts, box and whisker plots and scatter plots?
4. Can students identify the differences between samples and populations? 5. Can students devise and conduct well-designed surveys or experiments
involving randomization and consider the effects of sample size and bias? Unit 3 Grade-Level Expectations (GLEs)
GLE# GLE Text and Benchmarks Data Analysis, Probability and Discrete Math Grade 9 27. Determine the most appropriate measure of central tendency for a set of data
based on its distribution (D-1-H) 28. Identify trends in data and support conclusions by using distribution
characteristics such as patterns, clusters, and outliers (D-1-H) (D-6-H) (D-7-H) 29. Create a scatter plot from a set of data and determine if the relationship is
linear or nonlinear (D-1-H) (D-6-H) (D-7-H)

Louisiana Comprehensive Curriculum, Revised 2008
Math Essentials Unit 3 Statistics 27
Grade 11-12 17. Discuss the differences between samples and populations (D-1-H) 18. Devise and conduct well-designed experiments/surveys involving
randomization and considering the effects of sample size and bias (D-1-H) 22. Explain the limitations of predictions based on organized sample sets of data
(D-7-H)
Sample Activities Activity 1: Vocabulary (GLE’s: Grade 11-12: 17) Materials List: pencil, paper, chalk/white board, chalk/marker, Probability Vocabulary Self-Awareness Chart This activity should be used throughout the unit. A vocabulary self-awareness (view literacy strategy descriptions) chart should be completed at the beginning of the unit to access previous knowledge. Over the course of the unit, as students are exposed to new concepts, they should be reminded to return often to the chart and add new information to it. The goal is to replace all the check marks (minimal understanding) and minus signs (little or no understanding) with a plus sign (understand well). Students continue to visit the chart throughout the unit. Allow for multiple opportunities to review and update their understanding of the concepts presented throughout the unit. Listed below are possible choices for this unit. Statistics Vocabulary Self-Awareness Chart Word + √ - Example Definition Categorical Data Quantitative Data Measures of Central Tendency
Linear Relationship Survey Sample Survey Population Predictive Value Activity 2: Categorical Data (GLE Grade 9: 28) Materials List: paper, pencil, chalk/whiteboard, chalk/markers, different categorical charts from newspapers or magazines along with an accompanying article (one chart per group of 3 students) In this unit students will explore categorical data and determine if the charts accurately display given information.

Louisiana Comprehensive Curriculum, Revised 2008
Math Essentials Unit 3 Statistics 28
As the name implies data is organized into categories. Examples of categories are ice cream flavors, favorite flower, age, education level, causes of death. Organization of the data can be done by using a frequency chart, a bar chart, or pie chart. Display and describe to students these different types of charts:
Frequency distribution chart (table) – lists the categories in a chart, then gives the counts or percentage of observations of each category.
Bar chart (graph) – shows a bar representing the count of each category. Pie chart (graph) –shows a “whole” is divided into categories, represented by a
wedge (piece) of a circle, whose area corresponds to the proportion in each category.
Use professor know-it-all (view literacy strategy descriptions) to develop students’ conceptual understanding of each of the types of categorical charts. First, give a brief summary of each of the three types of categorical charts, including important features of each type of chart. Pass out one chart along with an accompanying article regarding the data, to each group of 3 students and have them answer the following questions. Explain that each group is to become an expert on the type of chart it is analyzing. 1. Is the graph clearly labeled? 2. Does it display percentages or counts? 3. Does it accurately display the data as described in the article? 4. Does the accompanying article tell who, what, when, where, why and how the data was collected? After students have answered the questions, reassign students to new groups so that each new group has a member with a different type of categorical chart. The new group will have one student with a frequency chart, one with a bar chart, and one with a pie chart, each an expert in his/her own area. Students in the new groups will take turns explaining to the other two students in the new group how to interpret data from the charts. The group will discuss the questions answered in the first group, thus sharing each student’s expertise with others. Provide extra support and assessment of student understanding by circulating about the various groups. After students have had time to share their expertise with the other members of the new group, they should return to their original group. Each group of students is then called randomly to the front of the class to be a team of professor know-it-alls concerning the chart the group was given. Invite questions from the other groups and have the know-it-alls answer each question. Ask questions of those groups who are not know-it-alls as well. Each of the three members of the group should participate in answering questions. After 5 minutes or so, ask a new group of professor know-it-alls to take their place in front of the class. This should be done until all groups have had a chance to serve as know-it-alls.

Louisiana Comprehensive Curriculum, Revised 2008
Math Essentials Unit 3 Statistics 29
Activity 3: Quantitative Data (GLEs Grade 9: 27, 28) Materials List: paper, pencil, chalk/whiteboard, chalk/markers, TI-83/84 graphing calculator (one per student), Displaying Quantitative Data BLM In this activity students will be introduced to charts of quantitative data. Students will create a stem and leaf plot from given data and then create a histogram by hand to display the same data in a different format. Students will learn how to create histograms using a TI-83 or TI-84 graphing calculator. Finally, students will compare the two histograms summarizing information from the graphical representations. Set up a scenario for the data. For example: Using data of test scores from an Algebra 1 class.
89, 95, 87, 76, 62, 79, 85, 84, 85, 88, 55, 94, 84, 97, 99, 78, 63, 81, 73, 81
Use this data to create a stem and leaf plot which helps to organize our data. After showing how to place one data item on the stem and leaf plot, have the students complete the chart. 5 5 6 2, 3 7 6, 9, 8, 3 8 9, 7, 9, 5, 4, 5, 8, 4, 1 which can be 9 5, 4, 7, 9 reorganized numerically Using a stem and leaf plot allows a visual representation of the data. From this chart, a simple histogram can be created from the data. A histogram is a type of bar graph that uses numerical data and is not set up arbitrarily. For example, a bar graph would be created for categorical data such as colors, however, in a histogram intervals used might be scores between 49.5 and 59.5, 59.5 to 69.5, 69.5 to 79.5. In turning the stem and leaf plot on its side, a histogram can be created by drawing rectangles around each section of data. The vertical axis has to be labeled with frequency numbers. Notice how easily data can be presented and interpreted. 9 8 7 6 5 4 3 2 1 49.5 59.5 69.5 79.5 89.5 99.5
5 3 6 2, 3 7 3, 6, 8, 9 8 1, 4, 4, 5, 5, 7, 8, 9, 9 9 4, 5, 7, 9

Louisiana Comprehensive Curriculum, Revised 2008
Math Essentials Unit 3 Statistics 30
Guide students in creating a histogram using the TI 83/84 calculator. Steps are listed below:
• Enter the data above by pressing STAT and then EDIT, enter data in L1. • Press 2nd STAT PLOT and turn ON the plot. • Choose the picture of the histogram under TYPE. • Press GRAPH and the histogram should appear. If not, press ZOOM and then
Statistics. • In order to ensure all students’ graphs are the same have students adjust their
WINDOW to use the same Xmin, Xmax, Xscl.
Walk around the room observing as students work, to ensure their understanding of the task. Aid students, if needed, in using the TI-83/84. Upon completion of this activity, students should be given the Displaying Quantitative Data BLMs to be completed as they continue to work in pairs or small groups. The Displaying Quantitative Data BLM provides students with an opportunity to create histograms from the given data and then to check their results using the graphing capabilities of a TI-83/84. Additionally students will compare the results of the two histograms created to summarize information from a comparison of the graphs. This provides critical thinking, peer facilitation, and discussion. Activity 4: Measures of Central Tendency (GLEs Grade 9: 27, 28) Materials List: paper, pencil, chalk/whiteboard, chalk/markers, numbered (values between 20 – 50) sticky notes, one for each student Divide the chalk/white board into four equal size rectangles with some space left on both sides of the rectangles See diagram below: As students enter the room, give each student a numbered sticky note to be used in the activity. After students are seated call one student to the board and ask him to place the numbered sticky note on the middle line. As each new student comes to the board, explain that the two sides of the board must have an equal number of sticky notes on either side of the middle number. The numbers must also be placed in ascending order. They may therefore have to move the current middle number left or right and replace it with another (or none at all) in order to maintain an equal number of sticky notes on either side of the middle line. Randomly call on students to place their numbers on the board. As this process is repeated, when students replace the middle number (value) and more and more students come up to the board, the median value changes in order to keep the same number of

Louisiana Comprehensive Curriculum, Revised 2008
Math Essentials Unit 3 Statistics 31
sticky notes on each side of the middle line. This process allows students to visualize how the median of group data is created. When all students have placed their sticky notes on the board, have the last student divide the two sides again, forming four quadrants with an equal number of sticky notes in ascending order. (Note: If there is an even number of sticky notes, there will no longer be a middle sticky note.) Have students copy the resultant rectangle drawing and values in their notebook. Explain that the value in the middle is called the median unless there is an even number of sticky notes, then the median is the average of the two sticky note values closest to the middle line.) The median is a measure of central tendency (the tendency for quantitative data to center around one specific value). Guide students in determining the 1st (lower) quartile and 3rd (upper) quartile values, the range value and the inter-quartile range value. Explain that there are other measures of central tendency called mean and mode. Mean is what most people refer to as average; add the data values and divide by the number of data values. Mode is the data item that occurs more often. Have students determine both the mean and the mode of the data items on the board. All statistical terms discussed should be recorded in students’ notebooks for future reference. Activity 5: Statistics using Technology (GLEs Grade 9: 27, 28) Materials List: paper, pencil, chalk/whiteboard, chalk/markers, TI-83/84 calculator, Creating Box and Whisker Plots BLM Now that students have an understanding of how to determine statistical information, show them how to speed up the process by using the statistics capability of a TI-83/84.
89, 95, 87, 76, 62, 79, 85, 84, 85, 88, 55, 94, 84, 97, 99, 78, 63, 81, 73, 81
Record the data items given above on the board. Explain that this is the same data used earlier when creating a histogram, but this time a different type of statistical graph will be created. Go to Stat, choose Edit (If there is already data here, clear it first by hitting Stat-4: Clr List, 2nd, L1, L2 , Enter) Then return to Stat, Edit. Enter the data items under L1.

Louisiana Comprehensive Curriculum, Revised 2008
Math Essentials Unit 3 Statistics 32
After entering the data, hit Stat-Calc-1: 1-Var Stats, L1, Enter. Statistical information will be displayed. Go through the different symbols listed below, defining for students each symbol. Relate each to the rectangle used in Activity 4. The only symbol not used in Activity 4 is standard deviation. Explain to students that standard deviation is related to the “spread” of the data. A small standard deviation would indicate that the data is clustered closely while a larger standard deviation indicates the data is spread out. Without going into detail, explain that for this set of data, the scores are centered around the mean (81.75), with most scores falling between 11.39 points less than the mean and 11.39 points greater than the mean.
1 3
mean 81.75 Standard Deviation 11.39 # of data items n = 20minX = 55 Q 77 Median = 84 Q 88.5 max X= 99
XX σ= == =
Additionally, the mode can be obtained by simply noting which data item occurs the most often. In this case, the data is tri-modal with 84, 85 and 89 all occurring twice. Have students take out their rectangular charts from Activity 4. Guide students in creating a box-and-whisker plot by hand. Give students Creating Box and Whisker Plots BLMs and have them work in pairs or small groups to provide reinforcement of concepts. Activity 6: Misleading and Bias Surveys (GLEs: Grade 11-12: 17, 18) Materials List: paper, pencil, chalk/whiteboard, chalk/markers, Am I Biased BLM People can use statistics to “sway the truth” by using misleading statistics. Surveys that use samples that do not represent the population in some important way, such as overlooking an important group, are said to be biased. Data can be manipulated in a number of ways: first, by conducting the survey in a favorable location, and second, by choosing the central tendency that represents the desired result. Ask students to work with partners to fill in the following process guide (view literacy strategy descriptions) Am I Biased BLM. Completing this process guide will enable students to understand the importance of using the most appropriate measure of central tendency when presenting data. The process guide will also help students become more sophisticated readers of data, knowing that statistics can be manipulated depending on the motive of the person or organization presenting the statistics. Upon completion, engage the entire class in a discussion and evaluation of each student pair’s solution to further reinforce the concept.

Louisiana Comprehensive Curriculum, Revised 2008
Math Essentials Unit 3 Statistics 33
Activity 7: Scatter plots (GLE Grade 9: 29) Materials List: paper, pencil, chalk/whiteboard, chalk/markers, TI-83/84 calculator, Creating Scatter plots BLM In this activity students will explore the relationships of two variables through the creation of scatter plots. Students will determine if the relationship is linear or non-linear and determine if the result indicates a predictive value. Predictive value occurs if the data that is linear in nature can have a cause-effect relationship. Cause-effect relationships must meet three criteria:
• The cause must occur prior to the effect. • There must be some type of relationship (linear is a good indicator). • There can be no likely plausible alternative explanation.
Upon completion of the Creating Scatter plots BLMs, discuss with students their conclusions. Discuss with students how using data, that is linear but does not have a cause/effect relationship can be misleading. Activity 8: Analyzing statistical surveys (GLEs Grade 9: 27, 28, 29; Grade 11-12: 22) Materials List: paper, pencil, chalk/whiteboard, chalk/markers, Internet accessibility In this activity students, working in pairs, will analyze survey data found on the Current Population Survey website, http://www.bls.gov/cps/home.htm . First, introduce students to vocabulary that will be used in discussing survey methods and results. A survey population is the entire group of individuals about which information is wanted. A survey sample is a part of the population from which information is actually colleecte4d. This information is then used to draw conclusions (predictive validity) about the entire survey population. The survey population for the Current Population Survey is more than 100 million U.S. households. The survey sample is about 50,000 households interviewed each month. Use an example from the Current Population Survey website to introduce students to the website and to demonstrate how to determine the important details in summarizing data results from a chosen survey. These important details are: survey topic, survey population, survey sample, predictive validity. The section, on employed persons by occupation, sex, and age survey (found on the website), has a great deal of data and is used in the example below. Demonstrate to
Louisiana Comprehensive Curriculum, Revised 2008
Math Essentials Unit 3 Statistics 34
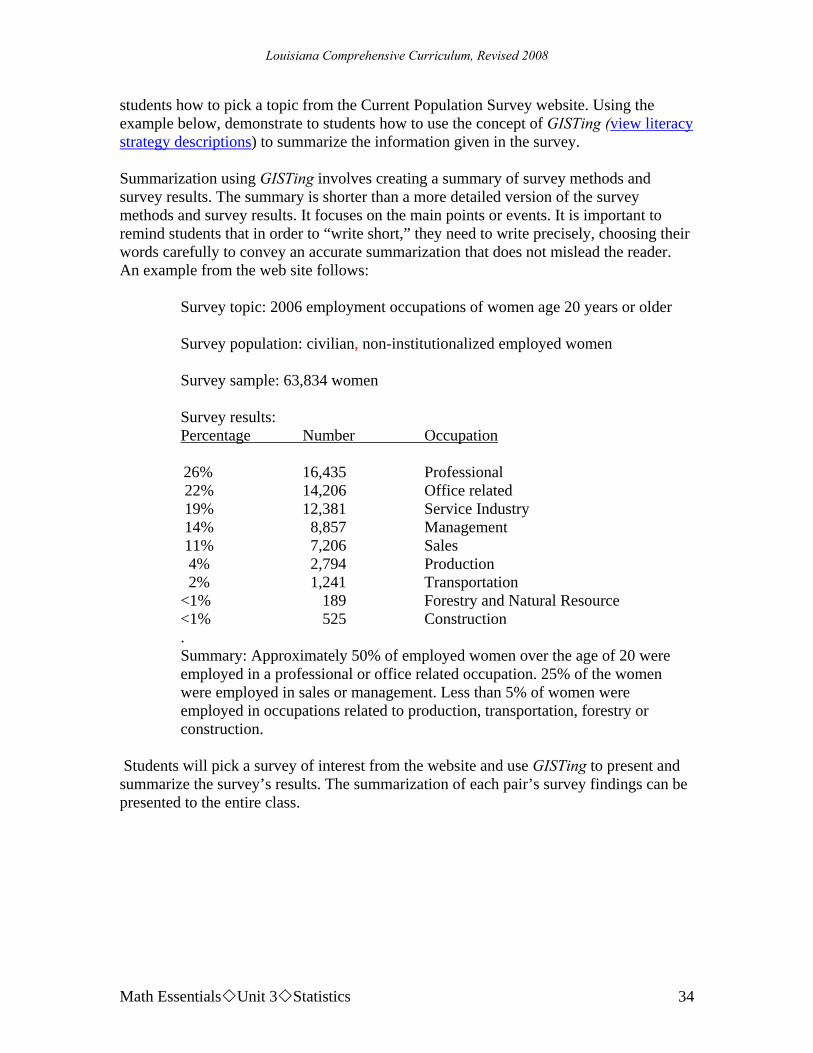
students how to pick a topic from the Current Population Survey website. Using the example below, demonstrate to students how to use the concept of GISTing (view literacy strategy descriptions) to summarize the information given in the survey. Summarization using GISTing involves creating a summary of survey methods and survey results. The summary is shorter than a more detailed version of the survey methods and survey results. It focuses on the main points or events. It is important to remind students that in order to “write short,” they need to write precisely, choosing their words carefully to convey an accurate summarization that does not mislead the reader. An example from the web site follows: Survey topic: 2006 employment occupations of women age 20 years or older Survey population: civilian, non-institutionalized employed women Survey sample: 63,834 women Survey results: Percentage Number Occupation 26% 16,435 Professional 22% 14,206 Office related 19% 12,381 Service Industry 14% 8,857 Management 11% 7,206 Sales 4% 2,794 Production 2% 1,241 Transportation <1% 189 Forestry and Natural Resource <1% 525 Construction . Summary: Approximately 50% of employed women over the age of 20 were employed in a professional or office related occupation. 25% of the women were employed in sales or management. Less than 5% of women were employed in occupations related to production, transportation, forestry or construction. Students will pick a survey of interest from the website and use GISTing to present and summarize the survey’s results. The summarization of each pair’s survey findings can be presented to the entire class.
Louisiana Comprehensive Curriculum, Revised 2008
Math Essentials Unit 3 Statistics 35
Activity 9: Conducting a Survey (GLEs Grade 11-12: 17, 18, 22) Materials List: paper, pencil, a poster board for each group of students, Survey BLM Students will conduct a sample survey, collecting either categorical or quantitative data, summarize their findings and represent their findings using a graphical representation on a poster board. Explain to students that in order to conduct a survey, the students must decide what survey population they will use to draw a survey sample. A survey population is the entire group of individuals about which information is gathered. A survey population is the entire group of individuals about which information is gathered. A sampling method describes the way chosen to survey a sample of the population. The survey sample consists of those people from whom information is actually collected. From this survey, conclusions about the entire population can be drawn. Students should brainstorm (view literacy strategy descriptions) possible survey topics, survey population, and survey sample size. Some examples: Categorical: Favorite ice cream flavor of freshmen students at their high school. Favorite movie this past summer for all students at their high school. Color of shirts worn by students in an advanced level math course. Eye color of sophomore students. Quantitative: Number of televisions compared to the number of rooms in a house. Comparison of after school employment by grade level. Number of hours spent sleeping each night compared to GPA. Prior to polling of the survey, each group of students should submit the Survey BLM and get approval of the survey topic, survey population, sampling method, and the chosen graphical representation of the survey results. Students should then collect data through surveying, give a detailed summary of the survey results, and provide a creative graphical representation of the results from the survey on half of a poster board.

Louisiana Comprehensive Curriculum, Revised 2008
Math Essentials Unit 3 Statistics 36
Sample Assessments General Assessments
• The student will submit a portfolio containing items such as:
examples of student products scored tests and quizzes student work (in-class or homework)
• The student will complete journal writings using such topics as: Describe three different situations in which each of the central
tendencies, respectively should be used to accurately reflect the data. Describe a situation from your experience in which a writer attempted
to mislead or bias the reader based on statistical information. • Monitor student progress using bellringers or small quizzes to check for
understanding throughout the unit on such topics as the following: Use the TI 83/84 calculator to create histograms and box-and-whisker
plots from given data. Create histograms and bar graphs from given data. Determine the mean, median or mode of given data. Create a box and whisker plot without the use of a graphing calculator,
and identify quartiles, range and interquartile range. Determine if a survey or a graph is bias or misleading. Interpret statistical graphs accurately.
• The student will demonstrate proficiency on a comprehensive assessment on the topics listed above.
Activity-Specific Assessments
• Activity 4: Jennifer scored 88, 92, 65, 89, and 85 on five tests in Algebra class. Each test was worth 100 points. Jennifer’s teacher usually uses the mean to calculate each student’s overall score. Is this the best measure of central tendency for Jennifer’s work on the tests? Explain why or why not.
• Activity 5: Given the following ages of college students, create a box-and-
whisker plot of the data and interpret the results. Identify the first and third quartile, the mean, median, and mode, the range and the interquartile range. Also identify any outliers and their effect on the box and whisker plot.
23, 19, 20, 21, 22, 24, 23, 18, 17, 24, 35

Louisiana Comprehensive Curriculum, Revised 2008
Math Essentials Unit 3 Statistics 37
• Activity 9: Use the rubric below to assess the results of the survey for
accuracy of unit concepts. Score Description
4 • Student demonstrates an in-depth understanding of the relevant procedures for conducting a survey.
• Student completes all important components of the graph accurately. • Summarization of survey results is accurately completed.
3 • Student demonstrates a competent understating of the relevant procedures for conducting a survey.
• Student completes most important aspects of the graph accurately. • Correct summarization of survey results but improper/bias survey
sample. 2 • Student demonstrates some understanding of the relevant procedures
for conducting a survey. • Student completes some important aspects of the graph accurately. • Summarization of survey results is not complete.
1 • Student demonstrates little understanding of the relevant procedures for conducting a survey.
• Evidence of some understanding of the aspects of graphing data. • Summarization of survey results is missing key components.
0 • Nothing is done, except to guess or sketch a graph. • An inaccurate summarization of the survey results is given.
Resources
Stats Modeling the World by David Bock, Paul F. Velleman, Richard D. DeVeaux. Pearson-Addison Wesley, 2004, ISBN: 0-201-73735-3. 582 pages Statistics Through Applications by Daniel Yates, Daren Starnes, and David Moore. H. Freeman and Company, 2005, ISBN: 0-10-0-7167-4772-3 http://www.bls.gov/cps/home.htm Current Population Survey website which provides thousands of survey data items regarding employment and other business topics related to the current population. http://statpages.org/ The website provides a wealth of resources, including links to interactive websites, for statistics.
Louisiana Comprehensive Curriculum, Revised 2008
Math Essentials Unit 4 Topics in Geometry 38
Math Essentials Unit 4: Topics in Geometry
Time Frame: Approximately 4 weeks Unit Description This unit will focus on spatial visualization of geometric figures as well as determining the quantitative measurements of two and three dimensional objects. Study of right triangle geometry and trigonometry, including the Pythagorean theorem is also included. Student Understandings In this unit students will understand basic geometric concepts such as distance, midpoint and the Pythagorean Theorem. Students will understand and use trigonometric ratios. Students will understand how to transform polygons in a coordinate plane. Additionally, students will understand the relationship between surface area and volume of rectangular prisms and cylinders. Guiding Questions
1. Can students determine the distance between two points? 2. Can students determine the midpoint of a line segment given the two
endpoints? 3. Can students use the Pythagorean Theorem to solve right triangle problems? 4. Can students transform polygons in a coordinate plane? 5. Can students define sine, cosine, and tangent in ratio form and calculate them
using technology? 6. Can students develop and apply coordinate rules for translations and
reflections of geometric figures? 7. Can students determine the volume and surface area of rectangular prisms and
cylinders and apply these concepts in real-world applications? 8. Can students create orthographic and foundation drawings of three-
dimensional objects from isometric drawings of three-dimensional objects? 9. Can students create isometric drawings given orthographic and foundation
drawings of the objects?

Louisiana Comprehensive Curriculum, Revised 2008
Math Essentials Unit 4 Topics in Geometry 39
Unit 4 Grade-Level Expectations (GLEs)
GLE# GLE Text and Benchmarks Number and Number Relations Grade 9 2. Evaluate and write numerical expressions involving integer exponents (N-2-H) Grade 10 3. Define sine, cosine, and tangent in ratio form and calculate them using
technology (N-6-H) Algebra Grade 9 12. Evaluate polynomial expressions for given values of the variable (A-2-H) Measurement Grade 10 8. Model and use trigonometric ratios to solve problems involving right triangles
(M-4-H) (N-6-H) Geometry Grade 9 23. Use coordinate methods to solve and interpret problems (e.g., slope as
rate of change, intercept as initial value, intersection as common solution, midpoint as equidistant) (G-2-H) (G-3-H)
25. Perform translations and line reflections on the coordinate plane (G-3-H) Grade 10 9. Construct 2- and 3-dimensional figures when given the name, description, or
attributes, with and without technology (G-1-H) 10. Form and test conjectures concerning geometric relationships including lines,
angles, and polygons (i.e., triangles, quadrilaterals, and n-gons), with and without technology (G-1-H) (G-4-H) (G-6-H)
12. Apply the Pythagorean theorem in both abstract and real-life settings (G-2-H) 14. Develop and apply coordinate rules for translations and reflections of
geometric figures (G-3-H) 16. Represent and solve problems involving distance on a number line or in the
plane (G-3-H) 18. Determine angle measures and side lengths of right and similar triangles using
trigonometric ratios and properties of similarity, including congruence (G-5-H) (M-4-H)
Grade 11 -12 16. Represent translations, reflections, rotations, and dilations of plane figures
using sketches, coordinates, vectors, and matrices (G-3-H) Patterns, Relations and Functions Grade 10 26. Generalize and represent patterns symbolically, with and without technology
(P-1-H) 27. Translate among tabular, graphical, and symbolic representations of patterns in
real-life situations, with and without technology (P-2-H) (P-3-H) (A-3-H)

Louisiana Comprehensive Curriculum, Revised 2008
Math Essentials Unit 4 Topics in Geometry 40
Sample Activities Activity 1: Vocabulary Self-Awareness (GLEs: Grade 10: 3, 12; Grade 11-12: 16) Materials List: pencil, paper, chalk/white board, chalk/marker, Vocabulary Self-Awareness Chart This activity encompasses use throughout the unit. A vocabulary self-awareness (view literacy strategy descriptions) chart should be completed at the beginning of the unit to access previous knowledge. As students are exposed to concepts throughout the unit, they should be told to return often to the chart and add new information to it. The goal is to replace all the check marks (minimal understanding) and minus signs (little or no understanding) with a plus sign (understand well). Students continue to visit the chart throughout the unit allowing for multiple opportunities to review and update their understanding of the concepts presented throughout the unit. Listed below are possible choices for this unit. Statistics Vocabulary Self-Awareness Chart Word + √ - Example Definition hypotenuse Pythagorean Theorem right triangle sine cosine tangent transformations reflection rotation translation isometric drawing orthographic drawing Activity 2: Right Triangle Geometry (GLEs: Grade 9: 2; Grade 10: 12) Materials List: paper, pencil, chalk/white board, chalk/markers, graph paper, rulers Have students individually graph a triangle on graph paper, using the two intersecting lines of the graph paper for two of the sides, thus forming a right angle. Explain that this type of triangle is called a right triangle, named for the right angle it contains. Ask students to use a ruler to determine the measures of the three sides to the nearest centimeter. Explain that the third line, drawn opposite the right angle, is called the hypotenuse and is always the longest side in a right triangle. Ask students if their sketch measurements verify this statement. (They should state yes, but if a student states no, ask

Louisiana Comprehensive Curriculum, Revised 2008
Math Essentials Unit 4 Topics in Geometry 41
him/her to list the measurements of the side values to enable other students to contradict this finding.) Now ask students to use the sides of the triangle to draw three squares with one side of the square a side of the triangle. Have students determine the area of each of the side squares and record the value inside the squares. Have them hold their papers up for all to see when completed, thus allowing verification that the task was done accurately. Have students place their papers on their desks and ask them if they notice any relationship between the three squares drawn. (The area of the two smaller squares equals the area of the hypotenuse square.) A mathematician named Pythagoras was credited with this observation as well as the formula 2 2 2a b c+ = (a and b represent the lengths of the sides of a right triangle and c represents the length of the hypotenuse). He probably learned about it during his travels through Egypt in 547 BC, when the Egyptians were using a rope in their contructions with 12 evenly spread knots (draw the diagram below on the board) The Chinese also knew this theorem and they attributed it to Tschou-Gun who lived in 1100 BC. The theorem was also known to the Caldeans and the Babylonians more than a thousand years before Pythagoras. However, to everyone in the modern world, it is known as the Pythagorean theorem. It reads as follows:
The sum of the squares of the two shorter sides in a right triangle equals the square of the hypotenuse. The equation is stated as a2 + b2 = c2, where a and b are the shorter sides of the triangle and c is the hypotenuse.
Have students work in pairs or small groups to determine sets of integers that will work in Pythagoras’s equation. Tell students that a set of three integers that satisfy the Pytagorean theorem is referred to as a Pythagorean triple. Remind students to look for a pattern. Give students about 10 -15 minutes and then bring the class together and discuss the results. Ask each group to give a possible triple and record the triple on the board. After each group has given an example, ask if any of the groups have another possible triple not yet listed. Once all are listed, ask students if they notice a pattern.

Louisiana Comprehensive Curriculum, Revised 2008
Math Essentials Unit 4 Topics in Geometry 42
Possible patterns: One pattern that may emerge is a multiple of the original 3, 4, 5 triangles. Possible triples: 6, 8, 10 12, 16, 20 15, 20, 25 Help students to identify another pattern by having them make a table with four columns. In the first column list the numbers 2 through 6, and then determine the triples shown below. Explain that the sides of the triangle are related to value of n in each case.
n side 1 side 2 hypotenuse 2 3 4 5 3 8 6 10 4 15 8 17 5 24 10 26 6 35 12 37
Have students attempt to determine a pattern from these triples as well. (The 2nd column value is the square of the 1st column value minus 1, the 3rd column value is double the 1st column value and the 4th column value is the square of the 1st column value plus 1. It can also be written as: For any integer n>1 a triple can be formed; side 1is n2-1, side 2 is 2n, hypotenuse is n2+1.) In this manner, students are able to determine an infinite number of Pythagorean triples. Activity 3: Distance (GLEs: Grade 9: 2, 12; Grade 10: 12, 16, 26) Materials List: paper, pencil, chalk/white board, chalk/markers, graph paper, calculator In this activity students will learn how to determine the distance between the endpoints of a line segment. Create an SQPL (Student questions for purposeful learning) (view literacy strategy descriptions) lesson by writing the statement listed below on the board:
The Pythagorean Theorem can be used to determine the distance between two points.
Students should pair up, and based on this statement, generate 2 or 3 questions they would like answered. The questions must be related to the statement and should not be purposely farfetched. When all student pairs have thought of their questions, ask someone from each team to share questions with the entire class. As students ask questions aloud,

Louisiana Comprehensive Curriculum, Revised 2008
Math Essentials Unit 4 Topics in Geometry 43
write the questions on the board. If similar questions are asked by more than one pair, star or highlight these questions in some way. Once all questions have been shared, look over the student-generated list and decide whether other important questions should be added. This may be necessary when students have failed to ask about important information they should learn. Tell the students to listen and pay attention to information that helps answer a question from the board. They should be especially focused on material related to the questions that were starred. As the content is covered, stop periodically to allow students to discuss with their partners which questions could be answered. Demonstrate to students how any drawn segment can be used as the hypotenuse of a right triangle. Use the Pythagorean Theorem equation, but in place of c use the variable d to represent the distance between two points. Ask students how it would be possible to determine a single d rather than d2. (Take the square root of both sides.) Explain that this gives us the new equation: 2 2d a b= + . Explain only the endpoints of the segment are known and that the lengths of a and b are not known. Ask how the endpoints can be used to determine the side lengths. (Take the difference between the x-coordinate values of each point to determine the length of one side and the difference between the y-coordinate values to determine the length of the other side.) Explain that this allows the development of the equation 2 2
2 1 2 1( ) ( )d x x y y= − + − . This is also known as the distance formula and can be used to determine the distance between any two points. If all of the student questions have not been addressed, then return to the questions and address them at this time. Working in pairs and using a calculator, have students determine the distance between the following points: 1) (9,3)(1,9) 2) (0,30) (15, 50) 3) (-5, -2)(7,3) 4) (35, -50)(-35,49) Solutions: 1) 10 2) 25 3) 13 4) 101

Louisiana Comprehensive Curriculum, Revised 2008
Math Essentials Unit 4 Topics in Geometry 44
To enable students to recognize that not all problems yield an integer answer, have students determine the distance between the points (3, 7) (5, 13). ( 40 , which is between 6 and 7). Do not worry about simplifying the radical at this time as that concept will be covered in a later unit. It is, however, important that students are able to generate an approximate value for the radical value, such as the value between two integers. Activity 4: Midpoint Formula (GLEs: Grade 9: 2, 23) Materials List: paper, pencil, chalk/white board, chalk/markers, chart graph paper In this activity students will determine the midpoint between two endpoints, as well as determine an endpoint given one endpoint and the midpoint. 1) On chart graph paper posted on the chalk/white board draw a horizontal line. Ask for a volunteer to come to the board to determine the midpoint. (Most students will do this by counting the squares from either side, either mentally or physically, and will put a dot where the midpoint occurs). Next to the chart graph paper, record on the board the coordinates for the two endpoints you chose and the volunteer student’s choice of midpoint. Ask the rest of the class if it can determine how the volunteer student determined the midpoint. (Answers will vary, although many will say the count method described above.) 2) Repeat the above procedure, this time drawing a vertical line. (Students usually determine that the process for finding the midpoint is essentially the same. Thus the midpoint can be determined by counting the squares. ) 3) Repeat the procedure again, but this time draw a diagonal line between two points. Students will usually find this a more difficult challenge. Ask students to work with partners to determine the relationship between the coordinates of the endpoints of each of the line segments and the midpoints. (After some wait time, students should recognize that the x and y values of the midpoint are midway between the x and y coordinates, respectively, of the endpoints.) Once this recognition occurs present the midpoint formula listed below to the students: Ask students to determine the midpoints of the following sets of coordinate pairs, 1) (9, 3) (1, 9) 2) (0, 30) (15, 50) 3) (-5, -2) (7, 3) 4) (35, -50) (-35, 50)
1 2 1 2, 2 2
x x y y+ +⎛ ⎞⎜ ⎟⎝ ⎠

Louisiana Comprehensive Curriculum, Revised 2008
Math Essentials Unit 4 Topics in Geometry 45
Solutions: 1. (5, 6) 2. (7.5, 10) 3. (1, .5) 4. (0, 0) Upon completion of this activity, have students work in pairs or small groups to determine the other endpoint of a line segment, given an endpoint (10, 3) and the midpoint (5, 1). Follow the same procedure as above to give students an opportunity to think through this challenge. You can give students the hint (work backwards) if they appear to not be on the right track. After four or five minutes, bring the class together and ask for an explanation/procedure for finding the missing endpoint from each of the groups/pairs. Ask the other students to determine if the procedure works. If it does, write the procedure/explanation on the board. Ask if any of the other groups/pairs have a different way to solve the problem. Continue the same process above, until all groups/pairs with different procedures/explanations have had a turn. Relate those procedures/explanations that were successful in determining the endpoint to the formal procedure:
2 1 2 1
1 1
2 2
or filling in the values for the given midpoint and endpoint10 35 1
2 2
m mx x y yx y
x y
− −⎛ ⎞ ⎛ ⎞= =⎜ ⎟ ⎜ ⎟⎝ ⎠ ⎝ ⎠
− −⎛ ⎞ ⎛ ⎞= =⎜ ⎟ ⎜ ⎟⎝ ⎠ ⎝ ⎠
Demonstrate solving for (x1, y1) while students record the process in their notebooks. Provide students with three or four more examples to help reinforce this process of determining the second endpoint, given the midpoint and one endpoint. Activity 5: Right Triangle Trigonometry (GLEs: Grade 10: 3, 8, 18) Materials List: paper, pencil, chalk/white board, chalk/markers, TI-84 graphing calculator, Right Triangle Trigonometry BLM In this activity students will be introduced to trigonometric ratios sine, cosine, tangent and will learn to calculate them using technology with applications to construction. Explain to students that a right triangle is often used in construction for it is important that the walls and the roof be square as this provides the best support for a structure. In addition, angles are helpful in providing measurements of the sides of the triangle.
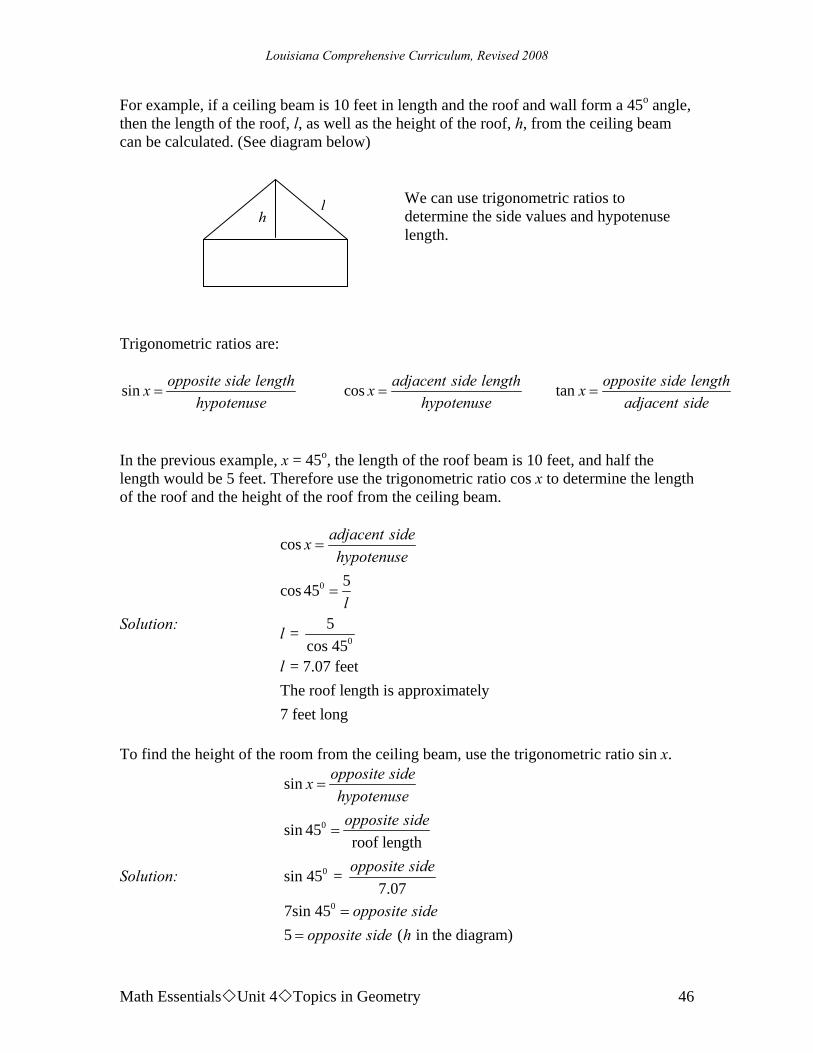
Louisiana Comprehensive Curriculum, Revised 2008
Math Essentials Unit 4 Topics in Geometry 46
For example, if a ceiling beam is 10 feet in length and the roof and wall form a 45o angle, then the length of the roof, l, as well as the height of the roof, h, from the ceiling beam can be calculated. (See diagram below) Trigonometric ratios are:
sin cos tan
opposite side length adjacent side length opposite side lengthx x xhypotenuse hypotenuse adjacent side
= = =
In the previous example, x = 45o, the length of the roof beam is 10 feet, and half the length would be 5 feet. Therefore use the trigonometric ratio cos x to determine the length of the roof and the height of the roof from the ceiling beam.
Solution:
0
0
cos
5cos 45
5 = cos 45
= 7.07 feet The roof length is approximately 7 feet long
=
=
adjacent sidexhypotenuse
l
l
l
To find the height of the room from the ceiling beam, use the trigonometric ratio sin x.
Solution:
0
0
0
sin
sin 45roof length
sin 45 = 7.07
7sin 45 5 ( in the diagram)
=
=
==
opposite sidexhypotenuseopposite side
opposite side
opposite sideopposite side h
We can use trigonometric ratios to determine the side values and hypotenuse length.
x
lh

Louisiana Comprehensive Curriculum, Revised 2008
Math Essentials Unit 4 Topics in Geometry 47
The height of the roof to the ceiling beam is 5 feet high. Students will explore further construction uses by completing the Right Triangle Trigonometry BLMs in small groups. Small groups encourage discussion and comparison of individual processes in determining solutions. Upon completion of the Right Triangle Trigonometry BLMs bring students together to discuss the results. Activity 6: Transformations of Polygons on a Coordinate Plane (GLEs: Grade 9: 25; Grade 10: 14; Grade 11-12: 16) Materials List (technology alternative): paper, pencil, chalk/white board, chalk/markers, Internet access utilizing one computer per pair of students, Transformations Using Technology BLM Materials List (no technology alternative): paper, pencil, overhead projector, screen, grid paper transparency, water soluble marker(s), protractors, each student will require: coordinate graph paper with x-axis and y-axis drawn, ruler, one overhead transparency, overhead markers, moist paper towels (to erase film), Transformations BLM Give a brief review of the terms reflection, rotation, and translation. A reflection over a line, k, is a transformation in which each point of the original
figure has a congruent image that is the same distance from the line of reflection as the original point but is on the opposite side.
A rotation is a transformation that moves every point a given number of degrees around a fixed point (usually the origin). Rotations > 0° are counterclockwise. Rotations < 0° are clockwise.
A translation is a transformation that slides every point of a figure the same distance in the same direction.
Technology alternative: Hand out the Transformations Using Technology BLM.
Have students access the interactive website http://www.shodor.org/interactivate/activities/Transmographer/
Students should work in pairs to complete the Transformations using technologyBLM using the interactive ability of the website.
No technology alternative: Distribute the materials to students, including the
Transformations BLM. Instruct students to put the transparency on top of the graph paper so that the edges align, and then draw and label the x- and y-axes on the transparency. It is important to instruct students to always align axes before drawing and labeling the initial position. Students should work in pairs to complete the Transformations BLMs using the graph paper and transparency.

Louisiana Comprehensive Curriculum, Revised 2008
Math Essentials Unit 4 Topics in Geometry 48
Circulate about the room to ensure students are on task and to aid in any difficulty students may have with the program application. Ask probing questions to help foster understanding. Some examples are:
Do you see a pattern among the x-coordinate values? How are the y-coordinate values changing? Are any of the values remaining constant? What observations can you make about the translation directions (3 right and 2
up) and the coordinates? Upon completion of the Transformations BLM (or Transformations Using Technology BLM) pairs should be combined to form a group of four students. Employing the professor know-it-all (view literacy strategy descriptions) strategy, students are then assigned a polygon and a transformation for which they will be the “expert”. Give each group of students a few minutes to discuss and review the content just covered. Additionally, each group of students should generate 3-5 questions about the content they might anticipate being asked and that they can ask other experts. Call a group to the front of the room and ask the group to face the class standing shoulder to shoulder. The know-it-alls invite questions from the other groups. Students in the class should ask their prepared questions first, then add others if more information is desired. When a question is asked the know-it-alls should huddle together, discuss briefly how to answer it, then have the know-it-all spokesperson give the answer. Remind students asking the questions to think carefully about the answers received, and to encourage the class to challenge or correct the professor know-it-alls if answers are not correct or need elaboration or amending. After 5 minutes or so, a new group of professor know-it-alls can take its place in front of the class, and continue the process of students questioning students. Activity 7: Pick’s Theorem and Area of Polygons (GLEs: Grade 10: 26, 27) Materials List: paper, pencil, chalk/white board, chalk/markers, geoboard paper, Exploring Area and Perimeter of Rectangles BLM, Exploring Area of Polygons BLM In this activity students will understand the relationship between perimeter and area of rectangles. Additionally, students will learn how to calculate the area of polygons using Pick’s Theorem. Create a SQPL - student questions for purposeful learning (view literacy strategy descriptions) lesson by writing the statement listed below on the board: Rectangles with the same perimeter will always have the same area and rectangles with the same area will always have the same perimeter.
Louisiana Comprehensive Curriculum, Revised 2008
Math Essentials Unit 4 Topics in Geometry 49
Students should pair up and based on this statement generate 2 or 3 questions they would like answered. The questions must be related to the statement and should not be purposely farfetched or parodies. When all student pairs have thought of their questions, ask someone from each team to share questions with the entire class. As students ask questions aloud, write the questions on the board. If similar questions are asked by more than one pair, star or highlight these questions in some way. Once all questions have been shared, look over the student generated list and decide whether other important questions should be added. This may be necessary when students have failed to ask about important information they need to be sure to learn. Tell the students to listen and pay attention to information during this lesson that may help answer a question from the board. They should be especially focused on material related to the questions that were starred. As the content is covered, stop periodically to allow students to discuss with their partners which questions could be answered. Pass out geoboard paper and the Exploring Area and Perimeter of Rectangles BLMs. Have students work in small groups of 3 to 4 people. Circulate about the room to ensure students are following directions and to facilitate discussion between students. Upon completion, bring students together and discuss their results, as well as answer the questions created during SQPL. Discuss the area of various polygons and then give the Exploring Area of Polygons BLMs to the students. They should complete the Exploring Area of Polygons BLMs while working in small groups of 3 or 4 students. Circulate about the room to ensure students are following directions, to check the accuracy of answers, and to facilitate discussion between students. Upon completion of the Exploring Area of Polygons BLMs, bring students together to discuss their results. Ask students does Q or N have a greater area? (same) Ask students does R or Z have a greater area? (Z) Ask students does F or S have a greater area? (S) Then have students look at their answers to see if they can spot a pattern. Point out that for U and V, the boundary points are both 6 but the area of U is one more than half the number of boundary points, and for V, the area is one more than half of the boundary points. Guide students toward discovering the difference in the number of interior points.

Louisiana Comprehensive Curriculum, Revised 2008
Math Essentials Unit 4 Topics in Geometry 50
Point out to students that it appears that if the interior point is 2, it’s one more than half the boundary points, and if the interior is 0, then the area is one less than half the boundary points. Ask them to verify if this is true with other polygons. (It is.) Lead this discussion into Pick’s Theorem. Introduce them to Georg Pick. His picture can be found on the Internet. It is important to provide some background information as listed below to help put mathematicians in a more normal light (Think: A Brilliant Mind and Good Will Hunting). It also integrates social studies into the mathematics curriculum. A brief synopsis of his background is found below. Georg Pick was born into a Jewish family in Vienna, Austria on August 10, 1859. A mathematician in his own right and most famous for discovering Pick’s Theorem, Georg Pick was Einstein's colleague and close friend during Einstein's stay in Prague in the years 1911-1913. Pick introduced Einstein into Prague’s scientific and musical societies. Their relationship lasted until the beginning of the Second World War. Hitler's armies invaded Prague on March 14, 1939. Pick had been elected as a member of the Czech Academy of Sciences and Arts, but after the Nazis took over Prague, Pick was excluded from the Academy. The Nazis set up a camp at Theresienstadt in Nordboehmen on November 24, 1941, to house elderly, privileged, and famous Jews. Of around 144,000 Jews sent to Theresienstadt about a quarter died there and around 60% were sent on to Auschwitz or other death camps. Pick was sent to Theresienstadt on July 13, 1942, and he died there two weeks later at age 82. While Dr. Pick wrote a number of books on mathematics, he is perhaps most known for Pick’s Theorem: Let P be a polygon in the plane whose vertices have integer coordinates.
Then the area of P can be determined just by counting the lattice points on
the interior and boundary of the polygon. In fact, the area is given by
Area(A) = i + (b/2) - 1 where i is the number interior lattice points, and b
is the number of boundary lattice points.
Note: Informally, a lattice is an infinite arrangement of points spaced with sufficient regularity like the geoboard paper used in this activity. The points on the lattice are called lattice points.
Challenge Problem: A nice application of Pick's Theorem is that an equilateral triangle whose vertices lie on the lattice points cannot be drawn. Ask the students to try and draw an equilateral triangle noting that the base does not need to be horizontal. Some convincing approximations may be obtained, but explain that none of them is really equilateral. This is true because the area of an equilateral triangle of base a is an irrational multiple of a2. If it is drawn on the lattice, then a2 is an integer (use the Pythagorean

Louisiana Comprehensive Curriculum, Revised 2008
Math Essentials Unit 4 Topics in Geometry 51
theorem) and the area is irrational, contradicting Pick's theorem. (This is also a good opportunity to prove that the square root of 3 is irrational.)
Ask students: Do your answers from the first part of the lesson (Area & Perimeter of Rectangles) fulfill Pick’s Theorem? Have the students explain their reasoning and give examples.
Have students use Pick’s Theorem to calculate the area of each of the polygons from the Exploring Area of Polygons BLM. Ask students if their initial estimates are close? If not, have the students compare answers with another student and determine where the error occurred.
Activity 8: Introduction to Orthographic Drawing (GLEs: Grade 10: 9)
Materials List: paper, pencil, chalk/white board, chalk/markers, geoboard paper (see Activity 8 BLM), cubes (regular or connecting), How Many Blocks? BLM, Orthographic Drawing BLM, Internet access (optional) In this activity students will draw two-dimensional representations from various views of three-dimensional shapes. Some students may need to use cubes to form the three-dimensional shapes in order to “see” what should be drawn. The NCTM Illuminations website, http://illuminations.nctm.org/ActivityDetail.aspx?ID=125, has an interactive, isometric drawing tool which may be used prior to or in conjunction with this activity. Divide students into 10 groups and have them complete the How Many Blocks? BLM. Upon completion, have a member of each group come to the front of the room to present its answer and describe how it determined the number of blocks in the drawing. Ask seated students if they agree or disagree as each group presents its answer. Continue in this manner until all block drawings have been discussed and accuracy of answers is ensured. Explain to students that there are three primary views of three dimensional objects: front, side, and top views. Label front and right side view of drawing D and have students write this on their drawing D on the How Many Blocks? BLMs. (See example below) Guide students in drawing the front side view of this three-dimensional drawing.

Louisiana Comprehensive Curriculum, Revised 2008
Math Essentials Unit 4 Topics in Geometry 52
Solution:
Explain to students that although the very front of the object only has two blocks, the front view of the object would include the front of the cube on the second row.
Now have students individually draw the right side of the object.
Solution:
Now ask students to draw the top view of the object, as if they are looking down on the object from above.
Solution:
Explain to students that this type of drawing is called orthographic drawing. An orthographic drawing is a graphic representation of two-dimensional views of a three dimensional object. It presents the front, side and top views of an object.
In addition to these three views, sometimes foundation drawings are also used to help people visualize the three-dimensional objects. Foundation drawings use the top view of an orthographic drawing and then label each part with the height or number of cubes.

Louisiana Comprehensive Curriculum, Revised 2008
Math Essentials Unit 4 Topics in Geometry 53
For example, the top view of drawing D would be labeled accordingly:
Working in pairs, students should individually draw the top front and right view of each three-dimensional drawing on the Orthographic Drawing BLMs. They should compare their results to ensure accuracy of their drawings.
Circulate about the room to ensure the students understand what they are suppose to be doing and to ensure accuracy of their drawings. Activity 9: Introduction to Isometric Drawing (GLEs: Grade 10: 9) Materials List: paper, pencil, chalk/white board, chalk/markers, geoboard paper, (see Activity 8 BLM) blocks (regular or connecting), Isometric Drawing BLM In this activity students will draw three-dimensional “isometric” representations on isometric dot paper using two-dimensional shapes of various views. Explain to students that given orthographic drawings of a three-dimensional object, they are going to create a three-dimensional drawing of the object. This type of drawing is called isometric sketching. An isometric view is a way of showing a three-dimensional representation of an object. Example: Given the foundation drawing Guide students in creating this shape in three dimensions on isometric dot paper.
2
1
1 1
2 2
1 1

Louisiana Comprehensive Curriculum, Revised 2008
Math Essentials Unit 4 Topics in Geometry 54
Have students work in small groups or pairs to complete the Isometric Drawing BLMs. As students complete the work have them tape or hang it near the front of the class so other students can compare and check for accuracy of their drawings. If a student discovers his/her drawing is inaccurate allow him/her to take back the drawing and correct it. After all the students have completed their work, bring students together to discuss difficulties, as well as insights, in sketching isometric drawings. Activity 10: Volume and Surface Area of Rectangular Prisms (GLEs: Grade 9: 12; Grade 10: 9, 10) Materials List: paper, pencil, chalk/white board, chalk/markers, 12 cubes of one color and 12 cubes of a second color (either 1 centimeter square or 1 inch square cubes) for each group of students, calculator, Exploring Surface Area and Volume of Rectangular Prisms BLM In this activity students will explore the concepts of volume and surface area of rectangular prisms including the relationship between them. Discuss and review with students the terms rectangular prism, surface area, and volume. Give each group of students 24 cubes, 12 of each color. Pass out the Exploring Surface Area and Volume of Rectangular Prisms BLMs and have students work in pairs or small groups to complete. Circulate about the room as students complete the activity to aid in completion of the BLM and to assess student understanding. At the end of the activity bring students together to discuss their results. Activity 11: Exploring Volume of Cylinders (GLEs: Grade 9: 12; Grade 10: 9, 10) Materials List: paper, pencil, chalk/white board, chalk/markers, several sheets of 8½” x 11” construction paper (or cardstock or transparencies), tape, material to fill the cylinders such as dried beans or rice, a large flat box such as the top of a box of paper for each group, calculator, Exploring Volume of Cylinders BLM In this activity students will explore volume of cylinders by constructing cylindrical containers from a sheet of construction paper and by determining the volumes each container can hold. Pass out the Exploring Volume of Cylinders BLMs and have students work in pairs or small groups to complete.

Louisiana Comprehensive Curriculum, Revised 2008
Math Essentials Unit 4 Topics in Geometry 55
Circulate about the room as students complete the activity to aid in completion of the BLM and to assess student understanding. At the end of the activity bring students together to discuss their results. Activity 12: Exploring Surface Area of Cylinders (GLEs: Grade 9: 12; Grade 10: 9, 10) Materials List: paper, pencil, chalk/white board, chalk/markers, several cylindrical containers found in a grocery store, two sheets of 8½” x 11” construction paper or cardstock In this activity students will be asked to construct a cylinder to hold a specified volume using the least amount of surface area. Discuss with students how to determine the surface area of a cylinder by demonstrating using construction paper. Lead students to develop the surface area of a cylinder:
2 ( ).SA r r hπ= + Explain to students that companies that package all types of grocery items use cylindrical containers to reduce the cost of packaging. Show students various cylindrical containers that do so in a grocery store. Explain to students that many items are packaged in similar size containers, as these have been found to be the most efficient surface area for the volume of the container. It is important to have the least amount of surface area in packaging because the item will cost less to produce, which increases the profit for the company. Explain that their challenge is to create the most economical container in surface area (to the nearest quarter inch squared) to hold a volume of 60 cubic inches with an integer height less than or equal to 6. (The optimal surface area is: 84.75 square inches) The chart below may be helpful for students. Volume of 60 in3
Radius (in)
Height (in)
Surface Area (in2)
1 2 3 4 5 6

Louisiana Comprehensive Curriculum, Revised 2008
Math Essentials Unit 4 Topics in Geometry 56
Solutions Radius (in)
Height (in)
Surface Area (in2)
4.37 1 147.45 3.09 2 98.82 2.52 3 87.40 2.18 4 84.65 1.95 5 85.15 1.78 6 87.01 Circulate about the room verifying that students understand the task they are to complete, giving hints as needed. This also provides an opportunity to assess higher order thinking. Upon completion of this task, bring students together and discuss the results, correcting any misconceptions or miscalculations. Discuss the fact that although many items are packaged as cylinders to maximize volume, manufacturers also use rectangular packaging with large front and back faces to attract customers’ attention. What they lose in volume they gain in advertising space.
Sample Assessments General Assessments
• The student will submit a portfolio containing items such as: examples of student products scored tests and quizzes student work (in-class or homework)
• The student will complete journal writings using such topics as: The relationship between the distance formula and the Pythagorean
Theorem. Pick’s Theorem’s application to real world situations.
• Monitor student progress using bellringers or small quizzes to check for understanding during the unit on such topics as the following:
Given two points, determine the distance between the two points and the midpoint of the line segment connecting the two points.
Transformations of squares, triangles, and parallelograms in a coordinate plane.
Determining if a triangle ratio represents a Pythagorean Triple. Using trigonometric ratios to determine the angle of a right triangle. Determining the volume and surface area of rectangular prisms and
cylinders. • The student will demonstrate proficiency on a comprehensive assessment on
the topics listed above.

Louisiana Comprehensive Curriculum, Revised 2008
Math Essentials Unit 4 Topics in Geometry 57
Activity-Specific Assessments
• Activity 2: In order to ensure two walls are square the angle between the two walls must equal 90o. If one wall is 15 feet long and the second new wall is 8 feet long, the distance between the two opposite sides of the wall (x) should be _____________feet.
• Activities 3 and 4: A line segment has an endpoint at (-3, 5) and a midpoint
located at (0, 9). Find the other endpoint and then the length of the line segment. Solution: The other endpoint is (3, 13) and the distance of the line segment is 10.
• Activity 5: A shed roof has a run of 18.35 and a slope of 30o as shown below. Use trigonometric ratios to determine the side of the roof shed (y). (Round to nearest tenth)
18.35 feet
• Activity 8: A square prism is composed of 27 one inch cube blocks. If one of the sides (a layer of cubes) of the square prism is removed, what is the volume of the new prism? Explain
Solution: The new prism would be 2 layers of 9 cubes, thus the new volume would be 18 in3.
30o
Solution: 10.6 feet
y
x
Solution: 17 feet
Louisiana Comprehensive Curriculum, Revised 2008
Math Essentials Unit 4 Topics in Geometry 58
Resources Mathematics for Carpentry and the Construction Trades by Alfred P. Webster and Kathryn B. Judy. Prentice Hall, 2002. ISBN: 0-13-163305. 368 pages. This resource book provides numerous examples of mathematics as used in the construction trades. It has many real-world applications for mathematics, especially geometry. http://www.algebra.com/algebra/homework/Surface-area/Surface-Area-and-Volume.lesson This site is excellent for students who need a little extra review or help with the concepts of surface area and volume of rectangular prisms or cylinders. http://www.arcytech.org/java/pythagoras/problems.html This website provides activities and examples that can be used to demonstrate and explain the Pythagorean theorem. http://192.107.108.56/portfolios/d/desimone_g/discover2/2transfor.htm This interactive website provides students with an opportunity to explore the transformations of polygons. http://mathforum.org/pubs/boxer/tess.html An interactive website that allows students to explore translations, rotations, and reflections. http://www.mathguide.com/lessons/SurfaceArea.html This website provides information for finding the surface area of various polyhedrons. It would make a good enrichment site for those students who need more of a challenge. http://www.mcs.surrey.ac.uk/Personal/R.Knott/Pythag/pythag.html A great website for resources on Pythagorean triples. http://www.shodor.org/interactivate/activities/PythagoreanExplorer/ This interactive website provides students a tutorial on the Pythagorean theorem, as well as an opportunity to test their understanding of the Pythagorean theorem. http://www.shodor.org/interactivate/activities/SurfaceAreaAndVolume This interactive website provides students the opportunity to view the effect changes in dimensions have on the volume and surface area of a rectangular prisms.
http://www.mathsnet.net/geometry/solid/isometric/index.html http://www.learner.org/teacherslab/math/geometry/space/plotplan/ http://www.mathsnet.net/geometry/solid/guessview.html http://www.mathsnet.net/geometry/solid/buildnight.html

Louisiana Comprehensive Curriculum, Revised 2008
Math Essentials Unit 5 Exploring Linear Functions 59
Math Essentials Unit 5: Exploring Linear Functions
Time Frame: 3.5 weeks Unit Description
This unit will focus on exploring linear relationships and linear equations from given data, as well as interpreting and creating the graphs of linear functions. Student Understandings In this unit students will understand the difference between relationship and function. They will translate among tabular, graphical, algebraic, and verbal representations of functions. Students will determine the equation of a line given two points, a point and the slope, and the y-intercept and slope. Students will determine the line of best fit of a scatter plot. Guiding Questions
1. Can students represent relations and functions using a mapping or table, (symbolically), graphically, algebraically, and verbally?
2. Can students determine the graphs, domains, ranges, intercepts, and global characteristics of linear functions by hand and using technology?
3. Can students determine the real-world meanings of domains, ranges, intercepts, and global characteristics of linear functions?
4. Can students determine the slope of a line and classify lines as perpendicular, parallel, same or neither?
5. Can students graph linear equations and inequalities using slope-intercept form, standard form, and point-slope form of a linear equation?
6. Can students write a linear equation given: a. two points? b. a point and the slope? c. the y-intercept and the slope ?
7. Can students use a scatter plot to identify the correlation manifested by a set of data and create a line of best fit with and without graphing technology?
8. Can students define one-to-one correspondence, determine if a relation is a function, and determine if a function is linear?

Louisiana Comprehensive Curriculum, Revised 2008
Math Essentials Unit 5 Exploring Linear Functions 60
Unit 5 Grade-Level Expectations (GLEs)
GLE# GLE Text and Benchmarks Algebra Grade 9 8. Use order of operations to simplify or rewrite variable expressions (A-1-H)
(A-2-H) 9. Model real-life situations using linear expressions, equations, and inequalities
(A-1-H) (D-2-H) (P-5-H) 10. Identify independent and dependent variables in real-life relationships (A-1-H) 11. Use equivalent forms of equations and inequalities to solve real-life problems.
(A-1-H) 12. Evaluate polynomial expressions for given values of the variable (A-2-H) 13. Translate between the characteristics defining a line (i.e., slope, intercepts,
points) and both its equation and graph (A-2-H) (G-3-H) 14. Graph and interpret linear inequalities in one or two variables and systems of
linear inequalities (A-2-H) (A-4-H) 15. Translate among tabular, graphical, and algebraic representations of functions
and real-life situations (A-3-H) (P-1-H) (P-2-H) Grade 10 5. Write the equation of a line of best fit for a set of 2-variable real-life data
presented in table or scatter plot form, with or without technology (A-2-H) (D-2-H)
6. Write the equation of a line parallel or perpendicular to a given line through a specific point (A-3-H) (G-3-H)
Patterns, Relations, and Functions Grade 9 35. Determine if a relation is a function and use appropriate function notation (P-1-
H) 36. Identify the domain and range of functions (P-1-H) 37. Analyze real-life relationships that can be modeled by linear functions (P-1-H)
(P-5-H) 38. Identify and describe the characteristics of families of linear functions, with
and without technology (P-3-H) 39. Compare and contrast linear functions algebraically in terms of their rates of
change and intercepts (P-4-H) 40. Explain how the graph of a linear function changes as the coefficients or
constants are changed in the function’s symbolic representation (P-4-H) Grade 10 27. Translate among tabular, graphical, and symbolic representations of patterns in
real-life situations, with and without technology (P-2-H) (P-3-H) (A-3-H) Geometry Grade 9 25. Explain slope as a representation of “rate of change” (G-3-H) (A-1-H)

Louisiana Comprehensive Curriculum, Revised 2008
Math Essentials Unit 5 Exploring Linear Functions 61
Sample Activities Activity 1: Vocabulary (GLEs: Grade 9: 10, 13, 25, 35, 36) Materials List: pencil, paper, chalk/white board, chalk/marker, Probability Vocabulary Self-Awareness Chart This activity encompasses use throughout the unit. A vocabulary self-awareness (view literacy strategy descriptions) chart should be completed at the beginning of the unit to access previous knowledge. Over the course of the unit, as students are exposed to concepts throughout the unit, they should be reminded to return often to the chart and add new information to it. The goal is to replace all the check marks (minimal understanding) and minus signs (little or no understanding) with a plus sign (understand well). Students continue to visit the chart throughout the unit allowing for multiple opportunities to review and update their understanding of the concepts presented throughout the unit. Listed below are possible choices for this unit. Linear Functions Vocabulary Self-Awareness Chart Word + √ - Example Definition Domain Range Relation Function Function notation Slope y-intercept
Activity 2: Relations and Functions (GLEs: Grade 9: 8, 35, 36) Materials List: pencil/paper, white/chalkboard, chalk/markers, Function or No Function BLM In this activity students will determine if a relation is a function and represent functions in a table or mapping. Two items (things, data points, etc) can be paired together forming a relation. These two items consist of an input value (domain) and output value (range). For example: Bob dating both Cindy and Suzy would represent relations. 100 paper plates sell for both $3 and $4 are relations. However relations are called functions when each input value is related to only one output value.

Louisiana Comprehensive Curriculum, Revised 2008
Math Essentials Unit 5 Exploring Linear Functions 62
For example: Bob dates only Cindy. 100 paper plates sell for only $3. Students are given the Function or No Function BLMs and will work in pairs or small groups to determine if a relation is a function. After completion of the Function or No Function BLMs have students verbalize a definition of a function of x. • Several of the definitions may be:
o A function is a set of ordered pairs in which no x-value is repeated. o A function is a relation if for each value of the x an ordered pairs, there is exactly
one y value. o A function is a relationship between two quantities such that one quantity is
associated with a unique value of the other quantity. The latter quantity, often called y, is said to depend on the former quantity, often denoted x.
• Discuss why the “unique value of the second component” is a key factor in
determining if the relation is a function. Use examples from the Function or No Function BLM to demonstrate this concept. “Erin is the biological daughter of Pat” is a function because Erin can have only one biological mother. Catrina is dating Brian is a relation because Catrina can also be dating Ron.
• Discuss the results of the Function or No Function BLMs to help students understand
how to tell if ordered pairs, equations, and verbal descriptions are functions. Activity 3: Linear Functions (GLEs: Grade 9: 35, 36) Materials List: pencil/paper, white/chalkboard, chalk/markers, TI-83/84 calculator In this activity students will graph a variety of functions using the TI-83/84 to determine the characteristics of a linear function. Using SQPL - student questions for purposeful learning (view literacy strategy descriptions), write the following statement on the board:
Linear functions must contain x- and y-variables with exponents equal to 1.
Have students copy the statement into their notebooks. Next, working with a partner, each pair of students should come up with a question they have about this statement. If a second pair of students has the same or a similar question, place a check next to the duplicate questions to indicate these are important questions. If important questions aren’t asked be sure to contribute those to the list.

Louisiana Comprehensive Curriculum, Revised 2008
Math Essentials Unit 5 Exploring Linear Functions 63
Using a TI-83/84, students should graph the following functions and record if the function is linear (forms a line). Tell students to carefully look for answers to their questions as they are completing this task. 1) y = 3x – 5 (yes) 2) 5x2 – 3y = 10 (no) 3) 8y3 – 2x = 12 (no) 4) 3x – 4y = -4 (yes) 5) 3y + 4x3 = 9 (no) 6) y = 5 (yes) 7) y = -5x (yes) 8) x + y = -6 (yes) 9) 3y – 5 = 8 (yes) 10) 8y4 = 5 (no) Upon completion of this activity revisit the statement above and the questions generated by the statement. Have a class discussion on the students’ findings and mark down answers to questions as they are discussed. If all questions are not answered, work with students to develop a method for answering any remaining questions. Finally, determine if the statement as presented is true. (It is not true because although functions that have x- and y- variables with exponents equal to 1 are linear, linear functions with only a y term do exist. For example #6: y = 5 forms a horizontal line. Therefore a linear function does not necessarily contain both x- and y-variables with exponents equal to 1. It may contain only a y- variable (x- variable exponent of 0) as in the case of example #6.) Remind students it is always important to ask questions first, as this enables them to look for answers as they complete a task or solve a problem. Activity 4: Slope (GLEs: Grade 9: 9, 10, 37, 39; Grade 10: 5, 27) Materials List: pencil/paper, white/chalkboard, chalk/markers, each group requires a graduated cylinder (use 2 or 3 different sizes), 8 -1 0 rocks/marbles*, water, poster size graph paper (one sheet per group), ruler, Water Displacement BLM *Divide rocks/marbles by size. Give each group 8 or 10 same size rocks/marbles, although there should be a variety of marble sizes used by the class.
Louisiana Comprehensive Curriculum, Revised 2008
Math Essentials Unit 5 Exploring Linear Functions 64
In this activity students will develop the concept of slope and discern that slope is also a rate of change. Students will work in groups of three or four to complete the Water Displacement BLM. The group should record their findings on the provided poster-size graph paper. Each groups’ findings should be displayed in class. Upon completion of the Water Displacement BLM, results should be presented to the entire class by each group of students. Possible discussion questions:
Why do you think the group with the larger rocks/marbles had a greater rate of change in its water level? (Larger rocks/marbles displaced more water causing the water to rise faster.) Looking at the graphs, does it appear that the size of the graduated cylinders changed the slope of the line drawn? (The greater in diameter the cylinder, the smaller the rate of change for same size rocks/marbles.) Can you think of a real-world situation where water displacement occurs? (Putting eggs in a boiling pot of water, getting into bathwater, students jumping into a swimming pool are possible examples.)
Explain to students that the rate of change is represented by the slope of the line created by the ordered pairs. That is why it is called the slope. The graph of a linear equation is a line; therefore, a line created by graphing ordered pairs can be represented by a linear equation. A linear equation contains an x- and y-variable, as well as the slope and a y-intercept (where the line crosses the y axis). The slope (m) of the line is the ratio of the change in the y-value (rise) to the change in the x-value (run). If the ratio is positive, then the line slopes upward from left to right. If the ratio is negative, then the line slopes downward from left to right The y-intercept is the value of y when value of x = 0. One form of a linear equation is called slope-intercept or y = mx + b, where (x, y) are variables that represent an ordered pair, m is the slope and b is the y-intercept. Introduce writing a linear equation in this activity, though it will be explored in greater detail in Activity 7. Help students to create a “line of best fit” and to determine a linear equation without using graphing technology for each of the graphs completed on the Water Displacement BLM. To create a “line of best fit” sometimes called a “trend line,” have the students draw a line through the scatter plot points so that the line has an equal number of plots on each

Louisiana Comprehensive Curriculum, Revised 2008
Math Essentials Unit 5 Exploring Linear Functions 65
side of it and are spaced approximately the same distance from the line. Pick two points that the line intersects or closely intersects and use these points to calculate the slope of the line. Extend the line to the y axis; this is the y-intercept. Now write the equation of the “line of best fit” in slope intercept form (y = mx + b). Activity 5: Family of Linear Equations (GLEs: Grade 9: 13, 38, 39, 40) Materials List: pencil/paper, white/chalkboard, chalk/markers, TI83-84 calculator, Families of Linear Equations BLM In this activity students will use the graphing capabilities of the TI-83/84 to determine how the graph of a linear function changes as the coefficients or constants are changed in the function’s symbolic representation. Students should complete the Families of Linear Equations BLMs and upon completion discuss their findings with the rest of the class. Note that when the constant is increased on a positive slope function, some students may determine the graph shifts up while others will determine it shifts left; both are accurate descriptions. In describing the slope of the graph it should be noted that steepness is compared to the parent graph y = x. Therefore those coefficient values greater then 1 or less than -1 increase the steepness of the line, while those between -1 and 1 decrease the steepness of the line. Activity 6: Parallel and Perpendicular Lines (GLEs: Grade 9: 38, 40; Grade 10: 6) Materials List: pencil/paper, white/chalkboard, chalk/markers, TI-83/84 graphing calculators, overhead projector/projection device, Comparing Lines BLM Have students work in pairs to complete the Comparing Lines BLM. After completion of the Comparing Lines BLMs, present the following systems of equations representing parallel lines, perpendicular lines, same lines and oblique lines to students. Ask them to work in pairs/small groups to determine the criteria for determining if lines are parallel, perpendicular, same, or oblique (two lines that are neither perpendicular or parallel). 2y = 6x +2 and y = 3x – 5 are parallel lines.
y = 4x - 7 and 1 34
y x= − + are perpendicular lines
2y = 6x + 10 and y = 3x + 5 are the same line 3y = 4x + 7 and y = 4x – 2 are oblique lines.

Louisiana Comprehensive Curriculum, Revised 2008
Math Essentials Unit 5 Exploring Linear Functions 66
Based on knowledge as determined by the Comparing Lines BLM, use opinionnaire (view literacy strategy descriptions) to help develop a complete understanding of these concepts by having students state their opinions regarding criteria for sets of lines. Then have them briefly explain the reasons for their opinions. Remember the emphasis in this part of the activity is on students’ points of view and not the “correctness” of their opinions. You can place the following on an overhead projector/projection device for students to copy and answer in their notebooks.
What Are Your Opinions About Systems of Lines?
Directions: After each statement, write SA (strongly agree), A (agree), D (disagree) or SD (strongly disagree). Then in the space provided, briefly explain the reasons for your opinions. 1. Perpendicular lines can have the same y-intercept. ___________ Your reasons: 2. Parallel lines always have the same slope. ________________ Your reasons: 3. There is no difference between oblique lines and perpendicular lines.____________ Your reasons: 4. Parallel lines can have the same y intercept. _________________ Your reasons: 5. To be oblique one line must have a positive slope and the other a negative slope._____ Your reasons: Engage the entire class in discussion. Invite students to share their opinions for each statement. Separate supporters from non-supporters. Force each student to take a stand. Then, ask the two groups to briefly debate the statement and allow any students who have changed their minds to move to the other group. Graph each of the sets of lines using a TI-83/84 (be sure to use ZOOM square to get an accurate presentation) and present the view to students, again allowing them to move to the other group. If there is a student who is still in the inaccurate group, ask him/her to

Louisiana Comprehensive Curriculum, Revised 2008
Math Essentials Unit 5 Exploring Linear Functions 67
explain what evidence supports his/her opinion. Through the debate and discussion of their opinions, students will reinforce their understandings of the criteria for each system of lines. Students should use split-page notetaking (view literacy strategy descriptions) to record each of the sets of lines and the criteria necessary for determining if lines are parallel, perpendicular, same, or oblique. Types of Lines Criteria Perpendicular Lines Example: y = 4x – 7
1 34
y x= − +
Parallel Lines Example: 2y = 6x +2 y = 3x – 5 Same Lines Example: 2y = 6x + 10 y = 3x + 5 Oblique Lines Example: 3y = 4x + 7 y = 4x – 2
Have negative reciprocal slopes (algebraically) Have one solution (algebraically) Intersect at right angles (graphically) Have one point of intersection (graphically) Can have the same y-intercept
Have the same slope (algebraically) Have no solution (algebraically) Do not intersect (graphically) Have different y-intercepts (graphically) Can not have the same y-intercept
Have the same slope (algebraically) Have an infinite number of solutions (algebraically) Have the same y-intercept (graphically) Contain the same points (graphically)
Do not have the same slope (algebraically) Have one solution (algebraically) Intersect at only one point (graphically) Angles of intersection are not right angles (graphically)
Once notes are completed, demonstrate for students how they can review the material by covering one column and using the other column to prompt recall of the covered information. Students can pair up and review their notes on lines together, in preparation for quizzes, tests, and other class activities.

Louisiana Comprehensive Curriculum, Revised 2008
Math Essentials Unit 5 Exploring Linear Functions 68
Activity 7: Writing Linear Equations (GLEs: Grade 9: 13, 14, 15, 37; Grade 10: 6, 27) Materials List: pencil/paper, white/chalkboard, chalk/markers, Writing Linear Equations BLM In this activity students will be able to translate among linear data presented numerically, verbally, graphically and algebraically. When writing a linear equation from a set of given information it is always possible to use y = mx + b and then fill in the formula with known information. Two of the following criteria are needed: the slope the y-intercept one or two points EXAMPLES: Given the slope and y-intercept: slope = 5 and y-intercept = 3. Step 1: Simply substitute known information into y = mx + b to get y = 5x + 3. ______________________________________________________________________ Given the slope and a point: Slope = 2
3 and contains point (1, -5).
Step 1: Substitute known information into y = mx + b. 25 (1)3
b− = +
Step 2: Solve for b: b = 25 (1)3
− − = 15 2 173 3 3
−− − =
Step 3: With both the slope and the y-intercept, substitute the values into y = mx + b 2 17
3 3y x= −
______________________________________________________________________ Given two points: (3, 2) and (-1, 4)
Step 1: Find the slope using 2 1
2 1
y ymx x−
=−
= 2 4 2 13 1 4 2− − −
= =− −
.
Step 2: Substitute the slope into y = mx + b: 12
y x b−= + and then substitute one set of
coordinate pairs (either one): 12 (3)
2b−
= + .
Step 3: Solve for b: 1 3 4 3 72 (3) 2 2 2 2 2 2
b = + = + = + = .

Louisiana Comprehensive Curriculum, Revised 2008
Math Essentials Unit 5 Exploring Linear Functions 69
Step 4: Substitute both the known slope and y-intercept into y = mx + b 1 72 2
y x−= +
______________________________________________________________________ A standard form (Ax + By = C) equation can easily be converted to y = mx + b
if and A Cm bB B−
= = are known.
If given two points and the domain values are the same, then the line is x = domain value. If given two points and the range values are the same, then the line is y = range value. Have students determine a linear equation for each set of given information below:
A line whose slope is 5 and a y-intercepts is -8. (y = 5x – 8). A line whose slope is -3 and passess through the point (-2, 5). (y= - 3x – 1) A line that passes through the points ( 3, -5) and (4, 7). (y = 12x – 41)
When finished, students should compare their answers with their partners aiding in self-assessment of the equations. Students are then given the Writing Linear Equations BLMs to aid in their using this concept in real world applications. Activity 8: Linear Regression (GLEs: Grade 9: 25, 37; Grade 10: 5) Materials List: pencil/paper, white/chalkboard, chalk/markers, TI-83/84 graphing calculators, Line of Best Fit BLM In this activity students will use data to create scatter plots and then find the “line of best fit” using the linear regression capabilities of the TI-83/84. Provide students with the Line of Best Fit BLMs and have the students work in pairs to complete the activities. It is important that students have already mastered the skill of entering data into the TI-83/84 calculator and creating scatter plots (Unit 3). If not, a quick refresher may be needed before attempting the Line of Best Fit BLMs.

Louisiana Comprehensive Curriculum, Revised 2008
Math Essentials Unit 5 Exploring Linear Functions 70
Solutions to BLM questions: 2 6 10 14 18 22 For the linear regression equation a = 2.033783784 and b=7.790540541 1. 38 grams of total fat 2. 13.5 grams of saturated fat 3. 26 grams of saturated fat 4. 16 grams of total fat Activity 9: Graphing Linear Equations (GLEs: Grade 9: 9, 10, 11, 12, 15, 40) Materials List: pencil/paper, white/chalkboard, chalk/markers, individual graph paper (two sheets per student) In this activity students will create a SPAWN writing (view literacy strategy descriptions) on the topic of graphing linear equations using knowledge gained from the previous activities in this unit. Students will relate what they have learned thus far in this unit to the concept of graphing linear equations. SPAWN is an acronym that stands for five categories of writing options (Special Powers, Problem Solving, Alternative Viewpoints, What If? and Next). Using these categories you can create numerous thought-provoking and meaningful prompts in mathematics. This kind of writing usually calls for students to anticipate what will be learned that day and requires considered and critical written responses by students. Two of the prompts P-Problem Solving and N-Next will be used for this activity. Give students the following two prompts.
Total Fat (g)
Saturated Fat
50 40
30 20 10

Louisiana Comprehensive Curriculum, Revised 2008
Math Essentials Unit 5 Exploring Linear Functions 71
P-Problem Solving: “We have been learning through use of the graphing calculator the relationship between a linear equation and its graph. What parts of the linear equation can be used to aid in graphing a linear equation by hand? Explain how each part is used to graph a linear equation.”
Sample answer: The coefficient of the x-term and the constant are essential parts. The coefficient of the x-term is the slope and the constant term is the y-intercept. First plot the y-intercept and from that point use the slope to determine a second point. Then connect the points with a line.
N- Next: “We learned in a previous activity to determine the line of best fit by hand and using the graphing calculator. How can this knowledge aid in creating a graph from a linear equation?”
Sample answer: Create a table of values using the equation and the ordered pairs can be plotted. Connect the points to form a line. Since the points all come from the same equation, they would automatically produce the “line of best fit”.
Upon completion of this activity have students share what they have written for each of the prompts. Write down important insights given by students as they relate to graphing linear equations. If the same information is given from a different group, place a star next to the insight signifying its importance. Write a linear equation on the board using the insights as presented by the students and supplemented by the teacher, if needed, to graph the linear equation. Have students reinforce the concept by individually graphing the following equations:
3 52 1
2 23
3 5 103 9
2 8
y xy x
y x
x yx y
y x
= += − +
= −
+ =− =− =
Have students pair and share their results providing an informal assessment of their understanding.

Louisiana Comprehensive Curriculum, Revised 2008
Math Essentials Unit 5 Exploring Linear Functions 72
Activity 10: Interpreting Linear Equations Graphically (GLEs: Grade 9: 9, 12, 15 36, 37) Materials List: pencil/paper, white/chalkboard, chalk/marker, Forensic Investigations BLM In this activity students will explore a real-world application of linear equations as used in forensic investigations. Working in small groups students should complete the Forensic Investigations BLM. Upon completion a whole class discussion should take place to summarize the various groups’ findings. Activity 11: Graphing Linear Inequalities (GLEs: Grade 9: 9, 11, 12, 14, 40) Materials List: pencil/paper, white/chalkboard, chalk/markers In this activity students use the process guide (view literacy strategy descriptions) to graph linear inequalities. They will also use number line inequality representation and extend this understanding to graphing linear inequalities. Example: 2x + 7 > 11 Solving this inequality x > 2 which graphically -2 -1 0 1 2 Note: there is more than one answer; in fact, there are infinite solutions. All numbers that are greater than 2 (to the right of 2 on the number line) are possible solutions. It would not include 2 thus the empty circle. Remind students if the inequality sign also includes the equality part (≥ ) then the circle would be filled in. Similarly, 2x + 7 > y will yield infinite solutions. All solutions in the coordinate plane that are less than the line created by the inequality are accurate. The line would be dashed because it would not include points on the line. Have students work in groups of 3 or 4 to complete the process guide below to help reinforce the concept and process of graphing inequalities. To create the graph of a line:
Two points, OR a point and the slope, OR y-intercept and the slope are needed.
Louisiana Comprehensive Curriculum, Revised 2008
Math Essentials Unit 5 Exploring Linear Functions 73
To determine if the line is solid or dashed: If the inequality uses a ≥ or a ≤ sign, then it is a solid line and would include the points on the line. If the inequality uses > or < sign, then the line is dashed and does not include the points on the line.
To determine which side of the line should be shaded:
Check a point on one side of the line (dashed or solid). If the coordinates of the point work in the equation, shade that side of the line. If not, shade the other side of the line.
Provide students with opportunities to use the process guide with various inequalities. After completion of this activity students should record in their math learning logs (view literacy strategy descriptions) their response to one of the following prompts:
1) Describe some ways in which graphing an inequality on a number line is similar to graphing an inequality in two variables in a coordinate plane. 2) How can what you know about graphing inequalities on a number line help you to graph inequalities in a coordinate plane?

Louisiana Comprehensive Curriculum, Revised 2008
Math Essentials Unit 5 Exploring Linear Functions 74
Sample Assessments General Assessments Performance Task: Chirping Crickets Using the data listed below students should: 1) create a scatter plot using the data items below. 2) graph the “line of best fit” on the same coordinate plane as the scatter plot. 3) without technology, determine an equation for the “line of best fit.” 4) interpret the meaning of the slope and y-intercept for the graph.
Chirping Frequency and Temperature for the Striped Ground Cricket
chirps / second temperature, °F 20.0 88.6 16.0 71.6 19.8 93.3 18.4 84.3 17.1 80.6 15.5 75.2 14.7 69.7 17.1 82.0 15.4 69.4 16.2 83.3 15.0 79.6 17.2 82.6 16.0 80.6 17.0 83.5 14.4 76.3
Scoring Rubric Objective 4 3 2 1 0 Graph • Axes are
labeled • Independent
variable data is used on x axis
• Ordered pairs are accurately graphed
• Graph paper is used
1 inaccurate or missing component
2 inaccurate or missing components
3 inaccurate or missing components
4 inaccurate or missing components

Louisiana Comprehensive Curriculum, Revised 2008
Math Essentials Unit 5 Exploring Linear Functions 75
Line of Best Fit
• Accurately determined equation
• Accurately graphed equation
• Calculations are shown for determining the “line of best fit” equation
1 inaccurate or missing component
2 inaccurate or missing components
3 inaccurate components
3 missing components
Slope & y-intercept
• Accurately determines and interprets meaning of slope and y-intercept of equation
Accurately determines and interprets meaning of slope or y-intercept of equation
Accurately determines but does not interpret slope or y-intercept
Interprets but does not accurately determine slope or y-intercept
Does not accurately determine or interpret slope and y-intercept
• The student will submit a portfolio containing artifacts such as: examples of student products scored tests and quizzes student work (in-class or homework)
• The student will complete learning log writings using such topics as: Interpreting the meaning of the slope and the y-intercept for linear
equations. Determining if a set of lines is parallel, perpendicular or oblique.
• Monitor student progress using bellringers or small quizzes to check for understanding during the unit on such topics as the following:
Effects on the graph of a linear equation based on changes in the coefficient of x or the constant of the equation.
Determining the “line of best fit” for given data. Determining if a relationship is a function. Ability to explain and give examples of independent and dependent
variables. • The student will demonstrate proficiency on a comprehensive assessment on
the topics listed above.

Louisiana Comprehensive Curriculum, Revised 2008
Math Essentials Unit 5 Exploring Linear Functions 76
x y 1 $85 2 $120 3 $155 4 $190 5 $225 6 $260
Activity Specific Assessments • Activity 1: Determine if each of the following is a function of x. If not, explain why
not. (1) the set of ordered pairs { (x, y): (1, 2), (3, 5), (3, 6), (7, 5), (8, 2)} (no, because x = 3 is paired with both y = 5 and y = 6.) (2) the set of ordered pairs {(s, d): (1,1), (2, 4), (3, 9), (-1, 1), (-2, 4), (-3, 9)} (yes) (3) the equation 2x + 3y = 6 (yes) (4) the equation x + y2 = 9 (no, each x value in the domain has two corresponding y values in the range or it does not pass the vertical line test.) (5) the equation y = x2 + 4 (yes) (6) the graph of a circle (no, it does not pass the vertical line test) • Activity 4: Determine a linear function for each of the situations below. (Some possible answers are listed after each situation.) a) filling up your gas tank (cost per gallon of gas) b) weeding your garden (weeds pulled per hour) c) buying lemons (the cost per lemon OR number of lemons per bag)) d) jogging (minutes per mile OR bottles of water per distance) e) playing a video game (number of wins per hour) • Activity 6: A state park campground rents golf carts enabling campers to move
around the large park quickly and quietly. The golf carts rent for $50 plus $35 per day. Show the relationship between the cost and the number of days the golf cart is rented in three ways: (a) in a table, (b) with a graph, and (c) with an algebraic equation.
Solutions: (a) (b) (c)
y = 50 +35x
Days
200 100
C O S T
1 2 3 4 5 6 7 8 9

Louisiana Comprehensive Curriculum, Revised 2008
Math Essentials Unit 5 Exploring Linear Functions 77
• Activities 8 and 9: The principal of Smith High School is buying new computers.
She can buy desktop computers for $500 per unit and laptop computers for $1000 per unit. The budget for the computers is $75,000, so total cost cannot exceed this amount.
a) Write an inequality that describes this situation. (500a + 100b < 75,000). b) Graph the inequality
c) Write three ordered pairs that meet the criteria of the graph. (Answers will vary)
Resources
http://nlvm.usu.edu/en/nav/frames_asid_191_g_4_t_2.html, an interactive website that provides a visual for a function machine http://www.keymath.com/x3297.xml, an interactive website that provides an excellent visual for investigating slope of a line http://standards.nctm.org/document/eexamples/chap6/6.2/index.htm#applet, an interactive website that explores slope as a rate of change http://illuminations.nctm.org/LessonDetail.aspx?id=L298 is a detailed lesson, including worksheets and activities related to graphing linear equations and interpretation related to real world applications. http://illuminations.nctm.org/ActivityDetail.aspx?ID=146 provides an interactive application of “line of best fit” Advanced Algebra with the TI-84 Plus Calculator by Brendan Kelly. Brendan Kelly Publishing, Inc., 2007. ISBN: 1-895997-26-7. 101 pages. $16.95 Punchline Bridge to Algebra by Steve Marcy and Janis Marcy. Creative Publishing. 2002. ISBN 0-9649134-2-9. 192 pages

Louisiana Comprehensive Curriculum, Revised 2008
Math Essentials Unit 6 Step, Piecewise, and Absolute Value Functions 78
Math Essentials Unit 6: Exploring Step, Piecewise, and Absolute Value Functions
Time Frame: Approximately 4 weeks Unit Description This unit will focus on exploring three non-linear functions: step, piecewise, and absolute value functions. Students will interpret and create graphs of step, piecewise, and absolute value functions. Student Understandings In this unit students will develop the ability to create and translate graphs of three non-linear functions: absolute value functions, step functions, and piecewise functions. In addition, students will compose and decompose composition functions and determine the inverse of a function. Guiding Questions
1. Can students determine the graphs, domains, ranges, intercepts, and global
characteristics of absolute value functions, step functions, and piecewise linear functions, both by hand and by using technology, then verbalize the real-world meanings of these?
2. Can students solve absolute value equations and inequalities and state their solutions in five forms when appropriate – number lines or coordinate graphs, roster, set notation containing compound sentences using “and” or “or”, interval notation using ∪ and ∩ , and absolute value notation?
3. Can students use translations, reflections, and dilations to graph new absolute value functions and step functions from parent functions?
4. Can students find the composition of two functions and decompose a composition into two functions?
5. Can students define one-to-one correspondence, find the inverse of a relation and determine if it is a function?

Louisiana Comprehensive Curriculum, Revised 2008
Math Essentials Unit 6 Step, Piecewise, and Absolute Value Functions 79
Unit 6 Grade-Level Expectations (GLEs)
GLE# GLE Text and Benchmarks Algebra Grade 9 8. Use order of operations to simplify or rewrite variable expressions (A-1-H)
(A-2-H) Grade 11-12 4. Translate and show the relationships among non-linear graphs, related tables of
values, and algebraic symbolic representations (A-1-H) 6 Analyze functions based on zeros, asymptotes, and local and global
characteristics of the function (A-3-H) 7. Explain, using technology, how the graph of a function is affected by change
of degree, coefficient, and constants in polynomial, rational, radical, exponential, and logarithmic functions (A-3-H)
8. Categorize non-linear graphs and their equations as quadratic, cubic, exponential, logarithmic, step function, rational, trigonometric, or absolute value (A-3-H) (P-5-H)
10. Model and solve problems involving quadratic, polynomial, exponential, logarithmic, step function, rational, and absolute value equations using technology (A-4-H)
Patterns, Relations, and Functions Grade 9 36. Identify the domain and range of functions (P-1-H) Grade 11-12 24. Model a given set of real-life data with a non-linear function (P-1-H) (P-5-H) 25. Apply the concept of a function and function notation to represent and evaluate
functions (P-1-H) (P-5-H) 28. Represent and solve problems involving the translation of functions in the
coordinate plane (P-4-H) 29. Determine the family or families of functions that can be used to represent a
given set of real-life data, with and without technology (P-5-H)
Sample Activities
Activity 1: Vocabulary Awareness (GLEs: Grade 11-12: 4) Materials List: pencil, paper, chalk/white board, chalk/marker, Vocabulary Self-Awareness Chart A vocabulary self-awareness (view literacy strategy descriptions) chart should be completed at the beginning of the unit to access previous knowledge. Over the course of the unit, as students are exposed to concepts throughout the unit, have them return to the chart and add new information to it. The goal is to replace all the check marks (minimal

Louisiana Comprehensive Curriculum, Revised 2008
Math Essentials Unit 6 Step, Piecewise, and Absolute Value Functions 80
understanding) and minus signs (little or no understanding) with a plus sign (understand well). Students continue to visit the chart throughout the unit allowing for multiple opportunities to review and update their understanding of the concepts presented throughout the unit. Listed below are possible choices for this unit. Statistics Vocabulary Self-Awareness Chart Word + √ - Example Definition Function Composite Function Inverses of Functions
Inverse Function Piecewise Function Step Function Absolute Value Absolute Value Function
Activity 2: Composite Functions (GLEs: Grade 11-12: 4, 7, 24) Materials List: pencil, paper, chalk/white board, chalk/marker, index cards, Composite Functions BLM In this unit students will learn to compose a single function from two other functions. Prior to the start of class give each student an index card with one of the following items written on it.
8 cards should contain a simple linear function equation.
8 cards should contain a whole number from 1 to 10.
8 cards should contain a fraction less than 1. If more than 24 students, increase proportionally, the types of cards listed above. Write the equation f(x) = x + 5 on the whiteboard. Call upon a student with a whole number index card to come forward and substitute his/her value for x. Having students erase the x, and then substitute the value on their cards for x. As students substitute their values into the equation, have them simplify the solution if possible. For example if a student has a 2, he/she would substitute 2 for x yielding, f(2) = 2 + 5 = 7. Have all students write this work in their notebooks.

Louisiana Comprehensive Curriculum, Revised 2008
Math Essentials Unit 6 Step, Piecewise, and Absolute Value Functions 81
Write a new function on the board under the first, then call upon a student that has a fraction less then one to repeat the procedure. Finally, have a student with a function index card repeat the procedure. Unlike the previous two cases, the variable remains in the simplified solution. Randomly call upon a few more students with a function index card to follow the same procedure. When completed, put a check next to the solutions which are composite functions. Explain to students that a composite function occurs when a given function is substituted for the x-variable within a second function. Ask students with a numerical index card to once again come to the board, but this time substitute their values for x in the newly created composite function. Determine the solution. Working in pairs or small groups, have students complete the Composite Functions BLMs in order to reinforce this concept during class. When finished have a class discussion on their results. Activity 3: Determining Inverses Algebraically (GLEs: Grade 11-12: 25) Materials List: pencil, paper, chalk/white board, chalk/marker, deck of cards (use only Ace through 9) In this activity play the game Guess My Number to introduce students to inverse functions. Students will then use split- page notetaking (view literacy strategy descriptions) to record the process of determining an inverse function. Finally, students will determine if two functions are inverses using the composition of functions. Begin Guess My Number by telling students that a number between 1 and 100 has been written on a sheet of paper. Ask them to guess it. After a few incorrect guesses tell them you will give them a hint. (Should a student guess accurately exclaim that he/she must be a good guesser and then write down a second number). Explain to the students that after four mathematical computations the solution will be given. For example: Write down the number 3. Tell students that after multiplying the number by 6 and adding 3, and then multiplying by 10 and dividing by 3, the answer is 70. Have students work in pairs to determine the number written down. After a few minutes, bring the class together to discuss the process they think will work for solving the Guess My Number game. Students should be able to work in reverse order of operations to determine the original number.

Louisiana Comprehensive Curriculum, Revised 2008
Math Essentials Unit 6 Step, Piecewise, and Absolute Value Functions 82
Explain to students that what they are doing when solving backwards is determining the inverse of a function. Ask students to take out their notebooks for some split-page note taking on the process for finding the inverse of a function. Tell students to draw a line from top to bottom approximately 2 to 3 inches from the left hand side. Students should split their pages into one-third and two-thirds. Next explain to students how to determine the inverse of a function. Date: Topic: Inverses Example 1: Given a function Step 1: Replace f(x) with y Step 2: Exchange the x and y variables Step 3: Solve for y Example 2: Given a function Step1: Replace f(x) with y Step 2: Exchange the x and y variables Step 3: Solve for y
( ) 3 4f x x= +
3 4y x= +
- 4 3x y=
2
2
2
2
| |
( ) 2
2
2
- 2
y a x h k
f x x
y x
x y
x y
= − +
= +
= +
= +
=
2x y± − =
Provide students with a number of examples to use for practice in determining the inverse of a function. Activity 4: Exploring Inverse Functions Graphically (GLEs: Grade 11-12: 8, 10) Materials List: pencil, paper, chalk/white board, chalk/marker, Graphing Inverse Functions BLM, TI-83/84 graphing calculator, graph paper In this activity students will determine a pattern when graphing inverses and note that not all inverses of a function are inverse functions. Students will determine if a function’s inverse is also an inverse function using the Horizontal Line Test.

Louisiana Comprehensive Curriculum, Revised 2008
Math Essentials Unit 6 Step, Piecewise, and Absolute Value Functions 83
Working in pairs or small groups, students should complete the Graphing Inverse Functions BLMs which provide an opportunity for students to visually understand the graph of an inverse function and its relationship to the original function. (They are mirror images of each other.) Students are expected to discover that the domain and range of the functions 1( ) and ( )f x f x− were interchanged. Ask students how this concept relates to the process of finding the inverse of a function algebraically as learned in the previous activity. (The x and y variable are exchanged in order to determine the inverse.) Form small groups to discuss their findings. Circulate among these groups to ensure students’ understanding of the concepts. Next, have students graph the following functions and their inverses using graphing calculators. Students should then determine the inverse of the given functions algebraically. This will allow them to create the inverse graphically using their graphing calculators. 1) ( ) 2 3f x x= + 2) 2( ) 2f x x= − 3) 3( ) 3f x x= +
Inverses: 1) 1 3( )2
xf x− −= Inverse is a function.
2) 1( ) 2f x x− = ± + Inverse is not a function 3) 1 3( ) 3f x x− = − Inverse is a function Engage students in a discussion related to the concept of inverses. Possible discussion questions:
• Looking at the table of the two functions, what evidence do you have that they are inverses? (the domain and range values are exchanged for any given value of x)
• What is the axis of reflection? ( y = x) • Is every inverse of a function also a function? (no, in problem 2 the inverse of the
function is not a function as there are two inverses and inverses must be unique to be a function.)
Introduce students to the Horizontal Line Test which states: In order for a function’s inverse to also be a function, a horizontal line drawn through the original function must pass only once through the function. Have students work in small groups using graphing calculators to determine if the functions given on the left pass the Horizontal Line Test and, therefore, have inverse functions. To provide reinforcement of this and previous concepts regarding inverses, the students should then find the algebraic equation of the inverse of each function and determine algebraically their findings using the Horizontal Line Test.

Louisiana Comprehensive Curriculum, Revised 2008
Math Essentials Unit 6 Step, Piecewise, and Absolute Value Functions 84
Solutions:
Activity 5: Piecewise Functions (GLEs: Grade 9: 8, 36; Grade 11-12: 4, 8, 10) Materials List: pencil, paper, chalk/white board, chalk/marker, TI-83/84 graphing calculator In this activity students will explore the concept of piecewise functions as used in real-world applications. Piecewise functions when graphed appear to be broken into different graphs of functions, hence, the term piecewise.
f(x) = 2 4 2
3 9 2x if x
x if x+ > −⎧
⎨− − ≤ −⎩
Note that one function is used for domain values greater than -2 and a second function is used for those values less than or equal to -2. Have students graph the piecewise function above with their graphing calculator by entering the following:.
(2 4)( 2) ( 3 9)( 2)y x x x x= + > − + − − ≤ − The graph of this piecewise function yields two distinct pieces that are not connected. The pieces of a piecewise function can, However, be connected.
2
2
3
1) ( ) 3 2
2) ( ) 52 33) ( )
524) ( )
45) ( ) 3
f x x
f x xxf x
xf x
f x x
= +
= +−
=
−=
= −
1
1 2
1
1
1 3
21) ( )3
2) ( ) 55 33) ( )
24) ( ) 4 2
5) ( ) 3
xf x
f x xxf x
f x x
f x x
−
−
−
−
−
−= ±
= −+
=
= ± +
= −
1) not a function 2) inverse function 3) inverse function 4) not a function 5) inverse function

Louisiana Comprehensive Curriculum, Revised 2008
Math Essentials Unit 6 Step, Piecewise, and Absolute Value Functions 85
For example have students graph the piecewise function:
3 14, 4( )
2 6, 4x x
g xx x− ≤⎧
= ⎨− + >⎩
Although it is obvious that the two pieces of the function are different they do connect at (4, -2). Explain to students that often height and age charts are presented as linear functions when in actuality the function is a piecewise function. The piecewise function for the average height (y) of males as compared to age (x) is:
7 19, 0 < 22 33, 2< 1870 18 < 5070 .005 x 50
x xx x
yx
x
+ ≤⎧⎪ + ≤⎪= ⎨ <⎪⎪ − ≥⎩
Have students work in pairs to create a graph of this function by hand. Upon completion of the graph, students are to determine the average height of males for ages: 1 (27), 5 (43), 10 (55), 15 (63), 20 (70), 25 (70), 30 (70), 35 (70), 40 (70), 45 (70), 50 (69.6), 55 (69.56), 60 (69.52), 65 (69.48), 70 (69.44). Students should summarize the data presented in the piecewise function. Solution: According to the piecewise function, the average male grows 7 inches during the first two years of life. From age 2, the average male grows 2 inches per year until reaching 18 when he reaches his peak height of 70 inches. After age 50 the average male begins to shrink 1/200th of an inch each year. Activity 6: Step Functions (GLEs: Grade 9: 36; Grade 11-12: 8, 10) Materials List: pencil, paper, chalk/white board, chalk/marker, Senior Trip BLM In this activity students will explore the concept of step functions used in real-world mathematics.

Louisiana Comprehensive Curriculum, Revised 2008
Math Essentials Unit 6 Step, Piecewise, and Absolute Value Functions 86
These functions are a special type of piecewise functions in that the ranges of the functions are incremental values over given values of x. Their graphs look like steps, hence, the word step function. For instance: The cost of hiring a cab to return home from the airport is $10 plus .50 per 10 minutes. This would be a step function because the function of hiring a cab would not change fractionally. Every time a minute goes by, the passenger is charged for the next full minute even if the passenger is just one second into the minute. The function is written as a piecewise function over a given interval. If the passenger lives at most 30 minutes from the airport, the step function can be written as a piecewise function as follows:
10 010.50 if 0< 10
( )11.00 if 10< 2011.50 if 20< 30
ifx
f xxx
⎧⎪ ≤⎪= ⎨ ≤⎪⎪ ≤⎩
The graph would resemble steps
Notice that these are not continuous solutions but discrete. Guide students in creating a graph of this type of function by hand. Explain to students that step functions occur when range values change by incremental values rather than continuous values. Ask students for other real life examples of step functions. (shoe sizes, postage rates, tax brackets, cell phone charges) Have students work in pairs or small groups to complete the Senior Trip BLMs in order to reinforce this concept. Circulate about the room to ensure the students’ understanding of the concept. Bring class together after they have completed the Senior Trip BLM to discuss their results. Activity 7: Solving Absolute Value Equations and Inequalities Using Technology (GLEs: Grade 11-12: 7) Materials List: pencil, paper, chalk/white board, chalk/marker, TI-83/84 graphing calculator In this unit students, guided by the teacher, will use the TI-83/84 graphing calculators to solve absolute value equations and inequalities. Absolute value problems can easily be solved using a TI-83 or TI-84. For example: |x + 3| = 5 can be solved in the following manner:

Louisiana Comprehensive Curriculum, Revised 2008
Math Essentials Unit 6 Step, Piecewise, and Absolute Value Functions 87
1) Go to y = and enter the first part of the equation: y = abs(x + 3) abs command can be found: MATH 5 or a shortcut 2nd, Catalog (0 button), and it’s the first command 2) Look at the table of values generated. Use 2nd Table (Graph button) 3) Look at the values given in the table. The x is the domain and y is the range. Students should look for 5 in the range (y) column, since that is what the equation should equal. Once y = 5 is located, the corresponding domain values are in the x column. Therefore, x = 2 or x = -8. This same procedure can be used for inequalities as well such as |x – 7| > 2. For inequalities, the students will not be looking for the y value 2, but when the y value becomes greater than 2.
Remember to search up and down. Notice the patterns in the y values.
The y value becomes > 2 when x < 5 or x > 9 Sometimes the table settings need to be altered to locate a particular value in the range (y) column. To change the table values go to TBLSET (2nd and then Window). The first line Tbl Start is the x-value for which the table will start. The second line Δ Tbl gives you the interval amount it would change, starting from the x-value entered for Tbl Start. For example, to start at the number 5 and use ¼ increments, set Tbl Start = 5 and Δ Tbl equal to 0.25. The x-values shown in the table would begin with 5 and proceed 5.25, 5.50, 5.75….) After completing the guided process above, have students use the table function of the graphing calculator to determine the solutions for the following equations and inequalities: 1) | 5 | < 3 2) |2 - 9| > 5 3) |3 - 4| = 5x x x−
4) | + 7| = 0 5) |6 - | > 4 6) 2| - 3| = 6x x x Solutions: 1) 2 < x < 8 2) x < 4 or x > 7 3) x = -1/3 or 3 4) x = - 7 5) -10 < x < 2 6) x = 0 or 6

Louisiana Comprehensive Curriculum, Revised 2008
Math Essentials Unit 6 Step, Piecewise, and Absolute Value Functions 88
Activity 8: Solving Absolute Value Equations Algebraically (GLEs: Grade 9: 8, 36; Grade 11-12: 6, 8, 10, 25) Materials List: pencil, paper, chalk/white board, chalk/marker, 15 index cards for each pair of students numbered -7 to 7, This activity requires students to solve absolute value problems algebraically which reinforces what the students discovered graphically and symbolically in the previous activity. Explain that the absolute value of a number x, written |x|, is the distance on a number line that the number is from 0. For example the |x| = 5 would be the numbers that are 5 units from 0 on the number line. Draw the number line below to provide a visual. 5 units from zero left 5 units from zero right -6 -5 -4 -3 -2 -1 0 1 2 3 4 5 6 7 Provide a second example: |x + 2| = 1. The possible answers are those that are 1 unit from zero. The value (x + 2) therefore is equal to -1 or 1, because the quantity is 1 unit from zero. This provides two equations x + 2 = -1 and x + 2 = 1. Solving these equations: x = -3 or x = -1. Solving an inequality works much in the same way. For example: |x -1| > 2. Use the number line to demonstrate that the possible values for the absolute value are greater than 2 units away from zero. -6 -5 -4 -3 -2 -1 0 1 2 3 4 5 6 7 This gives us (x -1) < -2 or (x -1) > 2. This yields the answers: x < -1 or x > 3. Use SQPL - student questions for purposeful learning (view literacy strategy descriptions) to further develop a conceptual understanding of this concept. Put the statement below on the board:
All absolute value problems must have two positive solutions. Ask students if they agree with this statement. Have them turn to partners and think of one good question they have about absolute values that might help them discover if the statement is true. As students respond, write their questions on the board. A question that is asked more than once should be marked with a star. When students finish asking

Louisiana Comprehensive Curriculum, Revised 2008
Math Essentials Unit 6 Step, Piecewise, and Absolute Value Functions 89
questions contribute some of your own if they have not been successful in developing questions regarding absolute value equations and inequalities. Some questions that may arise are:
• Can they have no solutions like some of the other problems we do in class? • Can they have only one solution? • Can an absolute value equal a negative value?
Have students, working with partners, complete the Absolute Value BLMs. Explain that as they complete the Absolute Value BLMs they should pay attention to information that helps them answer a question from the board, especially those that have been starred. After completion of the Absolute Value BLMS, bring students together to discuss their answers and check for completion. Engage students in a discussion regarding the inequality symbol. Ask if the answers to an absolute value inequality has an “and” or “or” relationship. Activity 9: Translations with Absolute Value Functions (GLEs: Grade 9: 36; Grade 11 – 12: 7, 28, 29) Materials List: pencil, paper, chalk/white board, chalk/marker, Translations with Absolute Value Functions BLM, TI-83/84 graphing calculator In this activity students will explain, using technology, how the graph of an absolute value function is affected by change of degree, coefficient, and constants. Have students work in pairs or small groups to complete the Translations with Absolute Value Functions BLMs. Students should then summarize their observations using split-page notetaking (view literacy strategy descriptions). Topic: Translations with Absolute Values Observation
Date: Examples
The h value shifts the graph of the absolute value function to the left or right. The graph shifts left h places if the value of h is added to x and right if it is subtracted from x. The k value shifts the graph of the absolute value function up or down. The graph shifts up if k is positive and down if k is negative.
y = |x – 4| shifts the graph 4 units to the right. y = |x + 5| shifts the graph 5 units to the left. y = |x| + 2 shifts the graph 2 units up. y = |x| - 7 shifts the graph 7 units down.

Louisiana Comprehensive Curriculum, Revised 2008
Math Essentials Unit 6 Step, Piecewise, and Absolute Value Functions 90
If a negative is placed in front of the absolute value then the graph reflects over the x-axis.
y = - |x| reflects the graph over the x axis.
Explain to students that the standard form for an absolute value function is
| |y a x h k= − + where h is a constant subtracted from the x-value before the absolute value is determined, and k is a constant added after the absolute value is determined. The other variable a indicates the steepness or wideness of the graphed function. It is similar to the slope in a linear function. The vertex of the absolute value is the coordinate pair (h, k). Have students look back at their work on the BLMs to verify that this is true. Discuss with students that multiple translations of the function can take place. Give the following example and ask students to hypothesize what translations of the graph would occur: y = - |x + 4| - 2. (The graph would shift two units down, 4 units to the left, and reflect over the x axis.) Create this graph on the board for a visual representation or have students verify this result using a graphing calculator.
Sample Assessments General Assessments
• Performance Task Students working in small groups will create a short PowerPoint® presentation on one of the following concepts to be used as a review prior to the quarterly exam:
• Translating absolute value functions. • Solving absolute value equations and inequalities. • Composite functions • Inverse functions • Finding the Inverses of functions.
• The student will submit a portfolio containing artifacts such as:
examples of student products scored tests and quizzes student work (in-class or homework)
• The student will complete journal writings using such topics as:
Describe a situation from your experience in which a step function could be used to represent the cost of an object or service.
Compare the translations of linear functions and the translations of absolute value functions.

Louisiana Comprehensive Curriculum, Revised 2008
Math Essentials Unit 6 Step, Piecewise, and Absolute Value Functions 91
• Monitor student progress using bellringers or small quizzes to check for understanding during the unit on such topics as the following:
Solve for a variable in an absolute value equation or inequality. Explain why solving an absolute value problem requires two
equations; one with a positive value and one with a negative value. Use step functions to draw a graph of a real world application problem
and determine data from the graph. Given two functions create a composite function or given a composite
function decompose it into two functions. Explain how change of degree, coefficient and constants translates the
graph of an absolute value. Determining the inverse of a function and determining if the inverse
is also a function. • The student will demonstrate proficiency on a comprehensive assessment on
the topics listed above. Activity-Specific Assessments
• Activity 2: Given the composite function 2( ( )) 2f g x x= − determine the two functions that comprise the composite function.
Solution: 2( ) ( ) 2f x x g x x= = − • Activity 4: Use a graphing calculator to graph the following functions and to
determine if the function has an inverse which is also a function. Then algebraically determine the inverse function, if applicable. If the inverse is not a function explain why it is not.
(a) ( ) | 3 2 |f x x= − (b) ( ) 3 2g x x= − (c) 2( ) 3 2h x x= − Solutions: (a) Its inverse is not a function. The original function does not pass the
Horizontal Line Test.
(b) Its inverse is a function 1 2( )3
xg x− −= .
(c) Its inverse is not a function. The original function does not pass the Horizontal Line Test.

Louisiana Comprehensive Curriculum, Revised 2008
Math Essentials Unit 6 Step, Piecewise, and Absolute Value Functions 92
Activity 6: Written report: Write a brief summary explaining which of the three plans in the activity will be best for different customers, based upon the number of minutes that they might use the phone in a month.
Answers will vary but basically Plan A is the best when you are using less than 190 minutes. Plan C is best over 190 minutes.
• Activity 8: Give an example of an absolute value equation or inequality that
has no solution.
Possible solutions: 3 2 | 2 | 0 | 5 | 0x x x− = − − + > − <
Resources
http://archives.math.utk.edu/visual.calculus/0/functions.13/index.html A excellent resource for piecewise functions and contains an interactive component for graphing piecewise functions.
http://illuminations.nctm.org/LessonDetail.aspx?id=L667 A lesson that can be used to reinforce the concept of composition of functions using successive discounts. http://www.analyzemath.com/Inverse-Function-Definition/Inverse-Function-Definiti.html A Java applet that allows students to explore the Inverse Function concept. http://www.sosmath.com/algebra/invfunc/fnc4.html Provides information on determining if the inverse of a function is also a function. Discovering Algebra: An Investigative Approach by Jerald Murdock, Ellen Kamischke, Eric Kamischke, Key Curriculum Press, 2002. ISBN: 1-55953-340-4 Explorations Modeling Motion: High School Math Activities with the CBR by Linda Antinone, Sam Gough, and Jill Gough. Texas Instruments Incorporated, 1997. ISBN: 1-886309-14-0

Louisiana Comprehensive Curriculum, Revised 2008
Math Essentials Unit 7 Exploring Quadratic Functions 93
Math Essentials Unit 7: Exploring Quadratic Functions
Time Frame: 3.5 weeks Unit Description This unit will focus on exploring quadratic functions. Students will interpret and create graphs of quadratic functions with and without using graphing technology. It will also include solving quadratic functions using the quadratic formula. Student Understandings In this unit, students will review adding, subtracting, and multiplying polynomials. They will factor polynomials using grouping, and quadratics using various methods including grouping and the quadratic formula. They will find zeroes and roots of quadratics and relate them to the graph of a quadratic function. Students will also discuss the transformations of the graph of a quadratic function. Students will apply the concepts learned to real-world applications. Guiding Questions
1. Can students apply adding and subtracting of binomials to geometric problems?
2. Can students multiply polynomials and identify special products? 3. Can students factor expressions using the greatest common factor, factor
binomials containing the difference of two perfect squares and the sum and difference of two perfect cubes?
4. Can students factor perfect square trinomials and general trinomials? 5. Can students factor polynomials by grouping? 6. Can students select the appropriate technique for factoring? 7. Can students apply multiplication of binomials and factoring to geometric
problems? 8. Can students solve quadratic equations using the zero–product property? 9. Can students relate factoring a quadratic to the zeroes of the graph of a
quadratic? 10. Can students relate multiplicity to the effects on the graph of a quadratic?
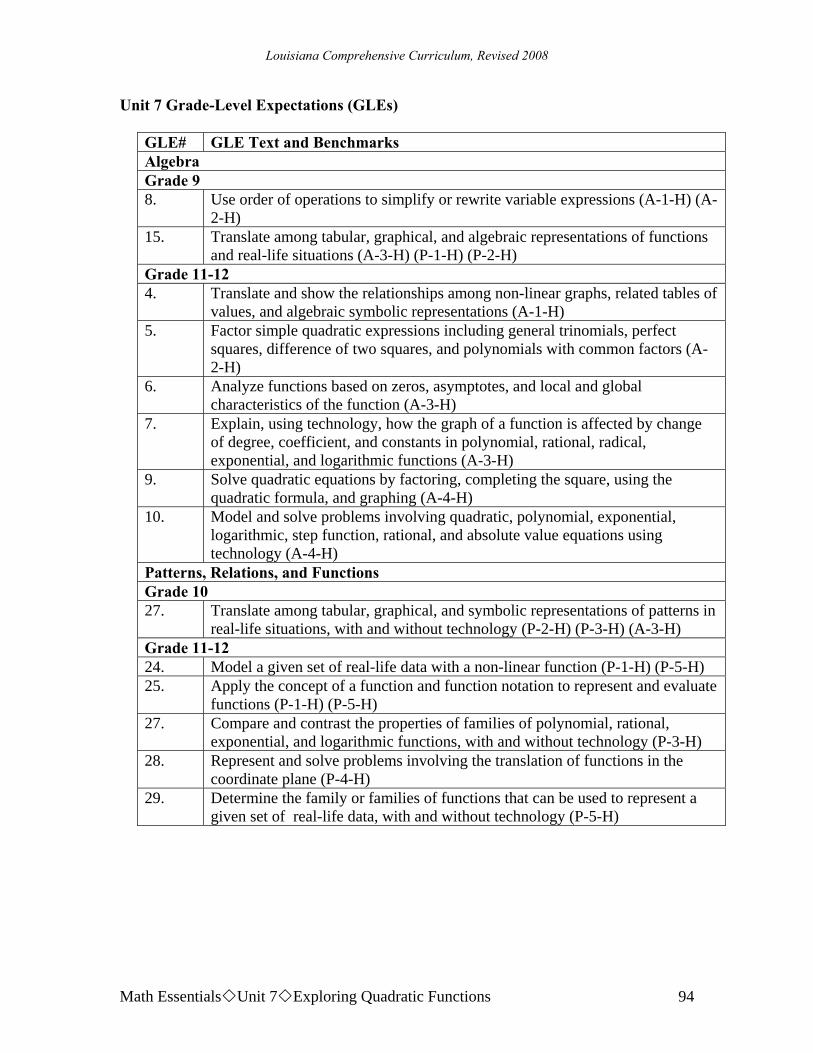
Louisiana Comprehensive Curriculum, Revised 2008
Math Essentials Unit 7 Exploring Quadratic Functions 94
Unit 7 Grade-Level Expectations (GLEs)
GLE# GLE Text and Benchmarks Algebra Grade 9 8. Use order of operations to simplify or rewrite variable expressions (A-1-H) (A-
2-H) 15. Translate among tabular, graphical, and algebraic representations of functions
and real-life situations (A-3-H) (P-1-H) (P-2-H) Grade 11-12 4. Translate and show the relationships among non-linear graphs, related tables of
values, and algebraic symbolic representations (A-1-H) 5. Factor simple quadratic expressions including general trinomials, perfect
squares, difference of two squares, and polynomials with common factors (A-2-H)
6. Analyze functions based on zeros, asymptotes, and local and global characteristics of the function (A-3-H)
7. Explain, using technology, how the graph of a function is affected by change of degree, coefficient, and constants in polynomial, rational, radical, exponential, and logarithmic functions (A-3-H)
9. Solve quadratic equations by factoring, completing the square, using the quadratic formula, and graphing (A-4-H)
10. Model and solve problems involving quadratic, polynomial, exponential, logarithmic, step function, rational, and absolute value equations using technology (A-4-H)
Patterns, Relations, and Functions Grade 10 27. Translate among tabular, graphical, and symbolic representations of patterns in
real-life situations, with and without technology (P-2-H) (P-3-H) (A-3-H) Grade 11-12 24. Model a given set of real-life data with a non-linear function (P-1-H) (P-5-H) 25. Apply the concept of a function and function notation to represent and evaluate
functions (P-1-H) (P-5-H) 27. Compare and contrast the properties of families of polynomial, rational,
exponential, and logarithmic functions, with and without technology (P-3-H) 28. Represent and solve problems involving the translation of functions in the
coordinate plane (P-4-H) 29. Determine the family or families of functions that can be used to represent a
given set of real-life data, with and without technology (P-5-H)

Louisiana Comprehensive Curriculum, Revised 2008
Math Essentials Unit 7 Exploring Quadratic Functions 95
Sample Activities Activity 1: Vocabulary Self-Awareness (GLE: Grade 11-12: 4) Materials List: pencil, paper, chalk/white board, chalk/marker, Quadratics Vocabulary Self-Awareness Chart A vocabulary self-awareness (view literacy strategy descriptions) chart should be completed at the beginning of the unit to access previous knowledge. As students are exposed to concepts throughout the unit, have them return to the chart and add new information to it. The goal is to replace all the check marks (minimal understanding) and minus signs (little or no understanding) with a plus sign (understand well). Students continue to visit the chart throughout the unit allowing for multiple opportunities to review and update their understanding of the concepts presented throughout the unit. Listed below are possible choices for this unit. Quadratic Functions Vocabulary Self-Awareness Chart Word + √ - Example Definition Binomials Trinomials Polynomials Law of Exponents Quadratics Quadratic Formula Perfect Square Trinomials
Difference of Two Squares
Sum & Difference of Two Cubes
Parabola Axis of Symmetry Vertex Activity 2: Add, Subtract and Multiplying Polynomials (GLEs: Grade 9: 8, 15) Materials List: pencil, paper, chalk/white board, chalk/marker, chart paper, markers In this activity students will use the distributive property to multiply polynomials with an emphasis on binomial and trinomial multiplication as well as a review of adding and subtracting polynomials. Give students the expression ( ) ( ) ( )2 33 2 3 5 25 4 2 3 3 5( 2)x x x x x x x+ − − + + − to simplify.

Louisiana Comprehensive Curriculum, Revised 2008
Math Essentials Unit 7 Exploring Quadratic Functions 96
Divide students into groups of three to check their answers to the given expression. Have students list all the rules they used in simplifying the expression, both in their notebooks and on large sheets of chart paper. Tape each group’s chart paper to the board. This allows students to share and compare their rules with other groups. Rules included are: combining like terms, law of exponents, and the commutative, associative and distributive properties. Discuss the results found by the students and then add any important rules students may have missed. Also add mathematical terminology as needed. Discuss all of the rules with students as a review of necessary skills. Upon completion of the discussion guide students should use split-page notetaking (view literacy strategy descriptions) to record the resulting rules for use as a study guide and reference. Be sure to include examples with exponents for associative, commutative and distributive properties. Date: Operation Rule/Example Combining like terms (adding and subtracting polynomials) Law of Exponents: Multiplying terms with exponents: Raising an exponent to a power: Commutative property Associative property Distributive property
The variables in the terms (not including the coefficient) have to be exactly the same. Example: a2 + a2b – 2ab2+3a2b = a2 +4a2b -2ab2 Multiply the coefficients and add the exponents of like variables. Example: (3a3b4) (2a2c) = 6a5b4c Raise the coefficient to the power and multiply the exponents of the term raised to a power. Example: (3a4b3)2 = 9a8b6 Example: a3 + b5 = b5 + a3 Example: (3a3b + 2a) + 5a = 3a3b + (2a + 5a) Example: 2a3 (4a2b4 + 5ab3) = 8a5b4 + 10a4b7

Louisiana Comprehensive Curriculum, Revised 2008
Math Essentials Unit 7 Exploring Quadratic Functions 97
Upon completion of the discussion ask students how the distributive property could be used to multiply ( )(3 4).a b c+ + Point out the rules used to simplify the result. EX 1: (a + b) (3c + 4) = (Think, distributive property!) 3ac + 4a + 3bc + 4b (Multiply) (Combine like terms. In this case there are none.)) EX 2: (a + b) (2a - 3b) (Think, distributive property!) 2a2 - 3ab + 2ab - 3b2 (Multiply) 2a2 - ab -3b2 (Combine like terms.) Provide the following examples for students to try on their own: 1) (m + n) (4m + 3n) 2) (x + y) (2x – 5) 3) (a - b) (a2 – 5b) 4) (2x – y) (x + y) Solutions: 1) 4m2+7mn+3n2 2) 2x2-5x+2xy-5y 3) a3 -5ab-a2b+5b2 4) 2x2+xy-y2
Have students apply their new knowledge to multiplying a binomial by a trinomial and to multiplying two trinomials. Have students record the properties and operations used to simplify the expressions. EX 1: (a + b) (2a – 3b + 4) EX 2: 2 2( 3 2)(3 4 5)x x x x+ + − + Solutions: 1) 2a2+4a-ab+4b-3b2 2) 3x4+5x3-x2+7x+10 Present students with examples of special products: binomials squared and the difference of two squares. Binomials Squared: (x + y)2 = (x + y) (x + y) = x2 + 2xy + y2
(x – y)2 = (x – y) (x – y) = x2 – 2xy + y2
(3a + b)2 = (3a + b) (3a + b) = 9a2 + 6ab + b2
(2m - 3n)2 =(2m - 3n) (2m - 3n) = 4m2 - 12mn + 9n2
Ask students to determine a pattern or rule for this special product. Have them discuss this within their groups and record their observations in their notebooks. Observation: The middle term of the resultant (product) polynomial is the two terms of the binomial multiplied together and then doubled.

Louisiana Comprehensive Curriculum, Revised 2008
Math Essentials Unit 7 Exploring Quadratic Functions 98
Difference of Two Squares: (x + y) (x – y) = x2 – xy + xy – y2 = x2 – y2
(3a + b) (3a – b) = 9a2 – 3ab + 3ab – b2 = 9a2 – b2
(4m – 2n) (4m + 2n) = 16m2 + 8mn – 8mn – 4n2 = 16m2 – 4n2
Ask students to determine a pattern or rule for this special product. Have them discuss this within their groups and record their observations in their notebooks. Observation: There is no middle term in the resultant (product) polynomial. Upon completion of this activity discuss with the entire class their observations regarding these two special products. After expanding several binomial and trinomial products, have students work the following application problems:
(1) The length of the side of a square is x + 5 cm. Express the perimeter and area as a polynomial function using function notation.
(2) A rectangular box is 2x + 5 feet long, x + 1 feet wide and x – 2 feet high. Express the volume as a polynomial in function notation.
3) Write an equation showing that the area of the large rectangle is equal to the sum
of the areas of the smaller rectangles for the figures below.
Solution: (1) P(x) = (4x + 20) cm, A(x) = (x2 + 10x + 25) cm2 (2) V(x) = 2x3 +3 x2 – 9x – 10 (3A) (x + 3)(x + 1) = x2 + 1x + 1x + 1x +1x+ 1 + 1+1 = x2 + 4x + 3 (3B) (2x + 1)( x + 2) = x2 + x2 + 1x + 1x + 1x +1x + 1x + 1 + 1= 2x2 +5x + 2
x x 1
1 1
x
(B)
x 1 1 1
1 x
(A)

Louisiana Comprehensive Curriculum, Revised 2008
Math Essentials Unit 7 Exploring Quadratic Functions 99
Activity 3: Factor by Grouping (GLE: Grade 11-12: 5) Materials List: pencil, paper, chalk/white board, chalk/marker In this activity students will learn to factor polynomials by first grouping like terms together and then using the distributive property to factor. Put the following expressions on the board and have students determine what is common to the terms in each example. 1) 23 9 6x x+ + 2) 2 3 2 3 22 6 8x y xy x y+ − 3) 2 3 2 3 230 15 25a b ac a b+ − Solutions: 1) 3 2) 2xy2 3) 5a Demonstrate to students how this common term can be factored out of the original polynomials. This is the first step in factoring any polynomial. Solutions: 1) 3(x2 + 3 x+ 2) 2) 2xy2(x y+ 3 - 4x2) 3) 5a(6ab3 + 3c2- 5a2b2) Emphasize that the distributive property will be used to factor polynomials. Explain that a polynomial which has four terms can be grouped into pairs and then the distributive property can be applied. Example: 3 212 8 9 6 x x z xy yz+ − − Lead students in a discussion about possible methods to group the terms using the distributive property. Work both possible solutions below because it is important to emphasize that there may be numerous methods of grouping terms that are alike and that this is acceptable.
3 2 3 2
2 2 2
2
12 8 9 6 OR 12 9 8 64 (3 2 ) 3 (3 2 ) 3 (4 3 ) 2 (4 3 )(4 3 )(3 2 )
x x z xy yz x xy x z yzx x z y x z x x y z x yx y x z
+ − − − + −
+ − + − + −
− + 2 (3 2 )(4 3 )x z x y+ −
Provide students with eight to ten polynomial expressions to factor using groupings. Students should work in pairs or small groups to factor the provided expressions and then compare their results. Circulate around the class assessing students’ understanding and clarifying any misunderstandings. Upon completion of the practice problems have students record in their math learning logs (view literacy strategy descriptions) the process for factoring by grouping. Example of possible math learning logs prompts:
Describe the method for factoring by grouping.

Louisiana Comprehensive Curriculum, Revised 2008
Math Essentials Unit 7 Exploring Quadratic Functions 100
Explain and give an example of how the method for grouping can be completed in
two different ways. Activity 4: Factoring Special Products (GLE: Grade 11-12: 5) Materials List: pencil, paper, chalk/white board, chalk/marker In this activity students will use skills learned in previous activities to recognize the factoring patterns for special products, such as binomials squared or cubed and the sum and difference of two squares and cubes. Have students multiply the following binomials as a review at the beginning of class:
21. ( 2) 2. ( 3)( 3) x x x− − + Solutions: x2-4x +4 x2 - 9
Bring students together and discuss student insights to determining if a quadratic expression is a special product. Possible insights: The middle term of perfect square trinomials is the same as the constant.The middle term isn’t there when you multiply two binomials that are the same except for their operation. Do not respond as to the correctness of the insight at this time, but probe student understanding further by giving examples with a leading coefficient greater than 1.
21. (3 2) 2. (2 3)(2 3) x x x− − + Solutions: 9x2-12x+4 (4x2 – 9)
Ask students if their previous insights still hold true. (The first insight example does not, but the second insight example does.) Provide students with the following examples, either written on the board or as a handout. Working individually or in pairs, have them determine if the quadratic expression represents a special product: 1) x2 - 25 (yes) 2) x2 + 3 (no) 3) x2 – 6x + 9 (yes) 4) 16x2 – 24x +9 (yes) 5) 2x2 + 4x + 1 (no) 6) 4x2 – 81 (yes) Once again bring the students together and discuss the strategies they used to determine if the expression represented a quadratic function. Have the students determine the factors of the quadratic equations that represented a special product. Solutions: 1) (x - 5)(x+ 5) 3) (x - 3)2 4) (4x - 3)2 6) (2x – 9)(2x + 9)

Louisiana Comprehensive Curriculum, Revised 2008
Math Essentials Unit 7 Exploring Quadratic Functions 101
Activity 5: Factoring Quadratic Expressions (GLEs: Grade 11-12: 5, 25) Materials List: pencil, paper, chalk/white board, chalk/marker, Factoring Quadratic Expressions BLM This activity requires students to factor quadratics with leading coefficients greater than one. Students will be introduced to a factoring technique that turns trinomials into four terms which in turn can be factored by grouping. Provide students with the Factoring Quadratic Expressions BLMs to complete in pairs. Upon completion bring students together as a class to discuss the method used in the Factoring Quadratic Expressions BLM. Go over each of the steps in detail and answer any questions students may still have regarding this method. RAFT writing (view literacy strategy descriptions) can be used at this time to reinforce the concept of factoring expressions and assess students’ understanding. Using their notes and the completed Factoring Quadratic Expressions BLMs, ask students to work in pairs to create a product that demonstrates their understanding of factoring quadratics. This form of writing gives students the freedom to project themselves into unique roles and to look at content from unique perspectives. From these roles and perspectives, RAFT writing can be used to explain processes or solve a problem. It’s the kind of writing that when crafted appropriately should be creative and informative. Working in small groups, students should write the following RAFT: R – Role (role of the writer – a marketing or advertising executive) A – Audience (to whom or what the RAFT is being written – students) F – Form (the form the writing will take – a marketing poster or advertisement that uses an analogous change of form to represent the factoring process) T – Topic (the subject of the writing – Factoring quadratics) For example: A poster may show the initial quadratic expression as a caterpillar crossing the grass, followed by the caterpillar spinning it’s cocoon in various stages (with the method for factoring included), finally, the butterfly emerges with each wing containing one of the two binomial factors.

Louisiana Comprehensive Curriculum, Revised 2008
Math Essentials Unit 7 Exploring Quadratic Functions 102
Activity 6: Solve equations by Factoring (GLEs: Grade 11-12: 5, 9, 10) Materials List: pencil, paper, chalk/white board, chalk/marker In this activity students will use their understanding of factoring quadratic expressions to solve quadratic equations. This activity emphasizes the process for solving a quadratic equation. Explain to students that solving a quadratic equation can be as easy as factoring. Emphasize to students that not all quadratic equations can be solved this way because most quadratic equations have irrational or imaginary roots. Explain the process while demonstrating through example. The first two steps of solving a quadratic equation are: Process Example: 10x2 – 25x = 15 1. Set the equation equal to zero. 10x2 – 25x – 15 = 0 2. Take out what is common. 5 (2x2 – 5x – 3) = 0 It is important to emphasize these first two steps which will enable students to factor the simplest form of the quadratic equation. Students can then divide both sides by 5 to further simplify the problem to be solved. 2x2 – 5x – 3 = 0 Students should then check to see if the quadratic equation is a special product such as a perfect square trinomial or the difference of two squares. If it is, then determine the two factors of the special product. (In this case it is not.) If the expression contains four terms try factoring by grouping. If it is a trinomial then use the factoring technique learned in Activity 5 to factor the quadratic. (2x +1)(x – 3) = 0 Explain to students that the only way to have this problem equal zero is if one of the two factors are 0. Therefore, either (2x + 1) = 0 or (x – 3) = 0.
Solving each of these equations yields x = 12
− or x = 3.
Work through a second example 4x2 +1 = 4x using the same process to help students reinforce this concept. Solution: (2x - 1)(2x - 1) or (2x - 1)2
Louisiana Comprehensive Curriculum, Revised 2008
Math Essentials Unit 7 Exploring Quadratic Functions 103
Students working in pairs should be assigned quadratic equations to solve to reinforce and develop the process of solving quadratic equations in various forms. Note: It is important at this time, that all assigned quadratic equations to be solved have real roots, as students have not been introduced to imaginary numbers. Circulate about the room stopping briefly at each table to ensure students are on the right track and to aid students as needed. Activity 7: Solving Quadratic Equations Applications (GLEs: Grade 11-12: 5, 9, 10) Materials List: pencil, paper, chalk/white board, chalk/marker, Geometric Applications BLM In this activity students will further develop a conceptual understanding of solving quadratic equations through solving real-world application problems. Use professor know-it-all (view literacy strategy descriptions) in conjunction with the Geometric Applications BLM to reinforce students’ conceptual understanding. Form groups of three or four students and give them a few minutes at the beginning of the class to review the concept covered in Activity 6. Explain to students that while all groups must complete the Geometric Applications BLMs, initially each group will be assigned a particular application problem for which it will be labeled the expert. (Note: The problems get progressively more difficult.) Upon completion of the assigned problem from the Geometric Applications BLM, each group of professor know-it-alls will be expected to explain in detail its strategy for finding a solution to the assigned real-world application. Pass out the Geometric Applications BLMs to each group and assign each group of professor know-it-alls one of the geometric application problems. Circulate about the room, stopping briefly at each table to ensure students are on the right track with their assigned problems and to aid students as needed. Do not be quick to aid students, but rather allow them to discuss the problems, create diagrams and use their knowledge of solving quadratic functions to solve these problems. Upon completion of the Geometric Applications BLMs, call a group to the front of the room and ask it to face the class. Each group should present its solution and then take questions from the rest of the class. Typically, students are asked to huddle after receiving a question, discussing briefly how to answer, then have the professor know-it-all spokesperson give the reply. Remind the other members of the class that they should think carefully about the answers received and challenge or correct the professor know-it-alls if answers are not correct or

Louisiana Comprehensive Curriculum, Revised 2008
Math Essentials Unit 7 Exploring Quadratic Functions 104
need elaboration or amending. After 5 minutes or so, a new group of professor know-it-alls can take its place in front of the class, and continue the process of students questioning students. Have students solve the rest of the application problems from the Geometric Applications BLMs for homework. This reinforces the understanding of the concept and provides students an opportunity to individually work all of problems that were discussed in class as part of this activity. Activity 8: Investigating Graphing Quadratics (GLEs: Grade 11-12: 5, 6, 7, 9, 27, 28, 29) Materials List: pencil, paper, chalk/white board, chalk/marker, Translating Quadratic Functions BLM, graphing calculator In this activity students will investigate graphing quadratic functions and will explain how the graph of a quadratic function is affected by changing the leading coefficient, the constant, and the addition or subtraction of a constant from the variable before squaring. Introduce the graph of a quadratic equation by having students graph y = x2 on their calculators. Point out that the shape of the graph is called a parabola. Engage students in a discussion regarding the symmetry of the parabola, and explain that the line that exists exactly down the middle of the parabola is called the axis of symmetry. The point where the axis of symmetry intersects the parabola is called the vertex. This point indicates where the graph of the parabola changes direction. Students working in pairs or small groups complete the Translating Quadratic Functions BLMs. Circulate about the room during completion of the Translating Quadratic Functions BLM to ensure students’ understanding of this concept and to further probe students regarding their understanding of this concept. Upon completion of Translating Quadratic Functions BLM by students bring the class together to discuss the results.

Louisiana Comprehensive Curriculum, Revised 2008
Math Essentials Unit 7 Exploring Quadratic Functions 105
Activity 9: Further Explorations with Graphing Quadratics (GLEs: Grade 11-12: 5, 6, 7, 9, 27, 28, 29) Materials List: pencil, paper, chalk/white board, chalk/marker, Exploring Quadratic Functions BLM, graphing calculator In this activity students will analyze functions based on zeroes and global characteristics of the function, including determining the axis of symmetry and the vertex from a quadratic equation in standard form. Working in pairs or small groups students should complete the Exploring Quadratic Functions BLMs. Circulate about the room during completion of the Exploring Quadratic Functions BLM to ensure students’ understanding of this concept and to further probe students regarding their understanding of this concept. Bring students together after they have completed the possible relationships portions of the Exploring Quadratics BLMs. Have each group present one of its suggestions of possible relationships. Record possible relationships on the board. If more then one group has the same possible relationship, place a star or asterisk next to it. Add to the list as a possible relationship any relationship between the algebraic and graphic representations that the students may have not discovered. Students should now complete the second half of the Exploring Quadratics BLMs to confirm their possible suggestions, as well as others on the board. Upon completion of the Exploring Quadratics BLM bring students together once again to discuss the students’ findings. Activity 10: Parabolic Problem Solving (GLEs: Grade 9: 15; Grade 10: 27; Grade 11-12: 5, 6, 9, 10, 24, 25) Materials List: pencil, paper, chalk/white board, chalk/marker, Exploring Quadratic Regression BLM, Basketball BLM, graphing calculator In this activity students will first learn to determine a quadratic regression equation for data presented in a table. They will then apply their understanding of solving quadratics in real-world applications by analyzing a quadratic function symbolically (table), algebraically, and graphically. Provide the students with Exploring Quadratic Regression BLMs, which will allow students to follow along during the teacher led/student participation activity on determining a quadratic regression equation from data given in a table format.
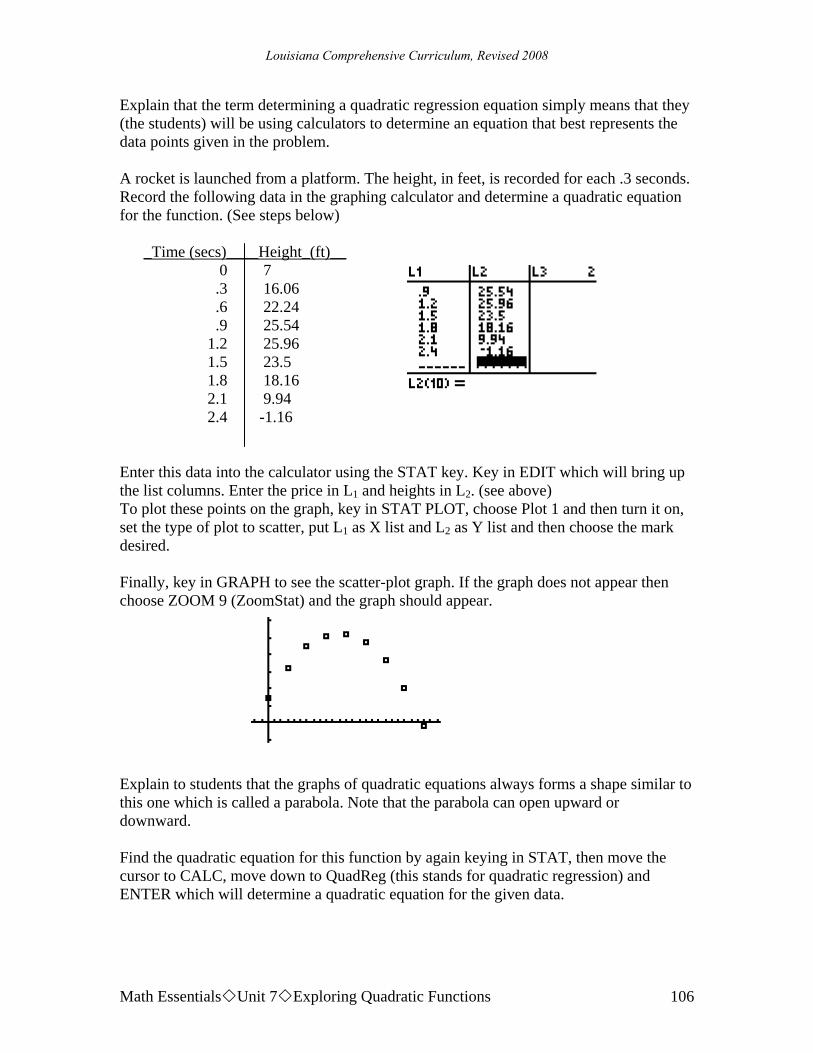
Louisiana Comprehensive Curriculum, Revised 2008
Math Essentials Unit 7 Exploring Quadratic Functions 106
Explain that the term determining a quadratic regression equation simply means that they (the students) will be using calculators to determine an equation that best represents the data points given in the problem. A rocket is launched from a platform. The height, in feet, is recorded for each .3 seconds. Record the following data in the graphing calculator and determine a quadratic equation for the function. (See steps below) _Time (secs)____Height_(ft)__ 0 7 .3 16.06 .6 22.24 .9 25.54 1.2 25.96
1.5 23.5 1.8 18.16 2.1 9.94 2.4 -1.16
Enter this data into the calculator using the STAT key. Key in EDIT which will bring up the list columns. Enter the price in L1 and heights in L2. (see above) To plot these points on the graph, key in STAT PLOT, choose Plot 1 and then turn it on, set the type of plot to scatter, put L1 as X list and L2 as Y list and then choose the mark desired. Finally, key in GRAPH to see the scatter-plot graph. If the graph does not appear then choose ZOOM 9 (ZoomStat) and the graph should appear. Explain to students that the graphs of quadratic equations always forms a shape similar to this one which is called a parabola. Note that the parabola can open upward or downward. Find the quadratic equation for this function by again keying in STAT, then move the cursor to CALC, move down to QuadReg (this stands for quadratic regression) and ENTER which will determine a quadratic equation for the given data.

Louisiana Comprehensive Curriculum, Revised 2008
Math Essentials Unit 7 Exploring Quadratic Functions 107
After the quadratic equation appears, put it in Y= by simply keying in Y= then VARS, then Statistics, move the cursor over to EQ and choose RegEQ. The equation will automatically appear in the Y = screen.
Now GRAPH the equation.
Ask students to determine using the Trace button or the Table the highest point the rocket reached. Approximately 26.14 feet Ask students to determine how long it took the rocket to reach a height of 20 feet. At approximately ½ a second. Explain to students that they will be practicing this newly found skill using the Basketball BLM. Students, working in small groups, should now complete the Basketball BLMs, using the Exploring Quadratic Regression BLM as a reference. Circulate about the room during completion of the Basketball BLM to ensure students’ understanding of this concept and to further probe students regarding their understanding of this concept. Upon completion of the Basketball BLMs by students bring the class together to discuss the results.
y = -16x2 + 35x + 7

Louisiana Comprehensive Curriculum, Revised 2008
Math Essentials Unit 7 Exploring Quadratic Functions 108
Activity 11: Quadratic Formula (GLEs: Grade 11-12: 9) Materials List: pencil, paper, chalk/white board, chalk/marker This activity provides students with an easy method for solving quadratic equations with complex (imaginary) roots. It should, however, be introduced after the concept of factoring has been addressed in earlier activities.
Present to students the quadratic formula: 2 4
2b b acx
a− ± −
=
Explain that each of the variables relates to the coefficients of each of the terms of a quadratic equation when written in the form: ax + by + c = 0.
Example: 3x2 + 13x – 10 = 0 would substitute as follows: 213 (13) 4(3)( 10)
2(3)x
− ± − −=
Notice this formula yields two solutions: x = -5 or x = 2/3. Provide students with problems to solve individually using the quadratic formula. Upon completion of the problems, students should compare their answers with partners to ensure accuracy. It should be mentioned to students that this formula is developed from trigonometry and geometry processes used by Socrates and Aristotle (Greek mathematicians). A mathematician (Indian) named Brahmagupta devised the formula as we know it now. A more thorough historical perspective can be found on the Internet at http://www.bbc.co.uk/dna/h2g2/A2982567 . Equations with non-real roots are introduced at this time. Students can be introduced to the concept of imaginary numbers or they can simply state that the solutions are non-real, dependent on the academic abilities of the student.
Sample Assessments
General Assessments
• The student will submit a portfolio containing items such as: examples of student products scored tests and quizzes student work (in-class or homework)
• The student will complete journal writings using such topics as: Compare and contrast translations of the graphs of linear and quadratic
equations.

Louisiana Comprehensive Curriculum, Revised 2008
Math Essentials Unit 7 Exploring Quadratic Functions 109
Describe a situation from your experience that could be represented by a quadratic equation. Explain your reasoning.
• Monitor student progress using bellringers or small quizzes to check for understanding during the unit on such topics as the following:
Multiplying binomials and trinomial expressions. Factoring special products such as the difference of two squares and
perfect square trinomials. Factor quadratic expressions through grouping. Solving quadratic equations. Applying binomial/trinomial multiplication and factoring techniques to
real-life situations and geometric applications. Translating and graphing quadratic equations.
• The student will demonstrate proficiency on a comprehensive assessment on the topics listed above.
Activity-Specific Assessments
• Activity 2: Create a geometric representation of a rectangle with sides (x + 2) and (x + 1). Determine the perimeter and area of the rectangle.
Perimeter = 2(x + 1) +2 (x + 2) = 4x + 6 x Area = (x + 1) (x +2) = x2+ 3x + 2 + 2
x + 1
• Activity 7: How is the translation of a quadratic function similar to the translation of a linear function? How is it different?
The translation of a quadratic function and a linear function are similar in that the change of the constant value translates the graph up or down, therefore changing the y intercept. Changing the leading coefficient also increases/decreases the absolute value of the slope of the graph.
The linear graph shifts up and left or down and right any time the constant is changed, whereas, the graph of a quadratic changes dependent upon the addition/subtraction of the constant before or after the x variable is squared.
• Activity 9: Many animals are known for their jumping abilities. Most frogs can
jump several times their body lengths. Fleas are tiny, but they can easily leap onto a dog or cat. Some humans have amazing jumping ability as well. Many professional basketball players have vertical leaps of more than 3 feet. Suppose
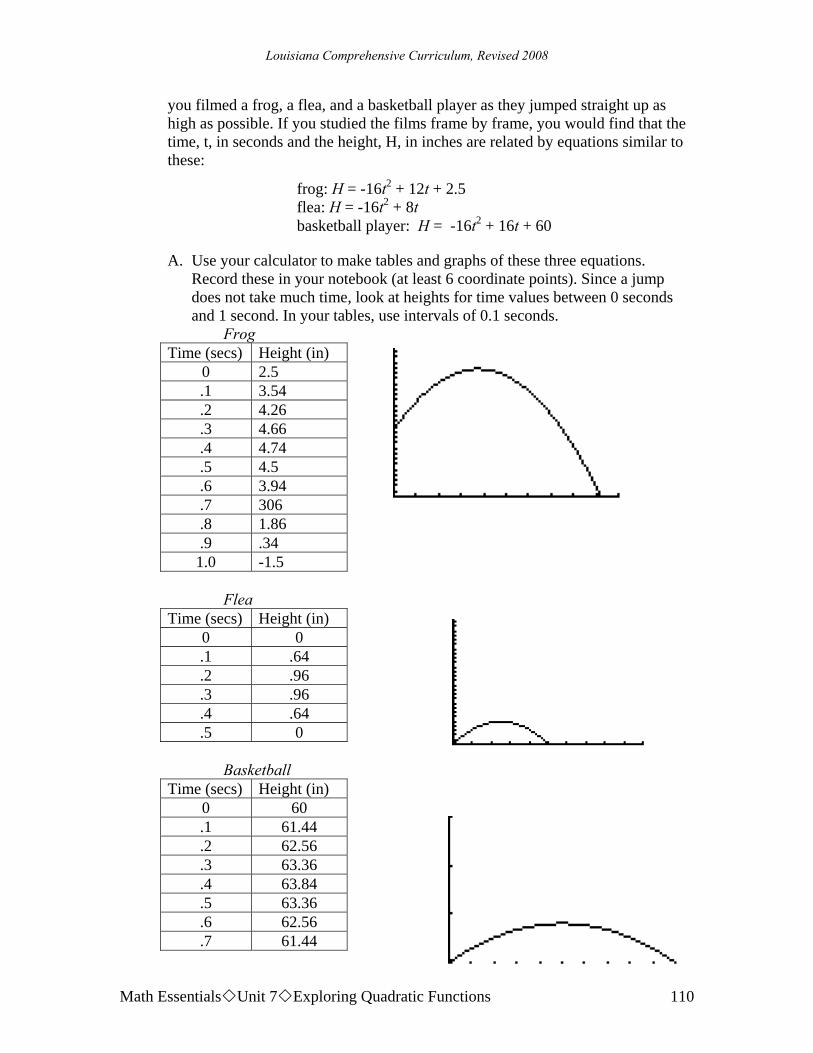
Louisiana Comprehensive Curriculum, Revised 2008
Math Essentials Unit 7 Exploring Quadratic Functions 110
you filmed a frog, a flea, and a basketball player as they jumped straight up as high as possible. If you studied the films frame by frame, you would find that the time, t, in seconds and the height, H, in inches are related by equations similar to these:
A. Use your calculator to make tables and graphs of these three equations. Record these in your notebook (at least 6 coordinate points). Since a jump does not take much time, look at heights for time values between 0 seconds and 1 second. In your tables, use intervals of 0.1 seconds.
Frog Time (secs) Height (in)
0 2.5 .1 3.54 .2 4.26 .3 4.66 .4 4.74 .5 4.5 .6 3.94 .7 306 .8 1.86 .9 .34 1.0 -1.5
Flea Time (secs) Height (in)
0 0 .1 .64 .2 .96 .3 .96 .4 .64 .5 0
Basketball Time (secs) Height (in)
0 60 .1 61.44 .2 62.56 .3 63.36 .4 63.84 .5 63.36 .6 62.56 .7 61.44
frog: H = -16t2 + 12t + 2.5 flea: H = -16t2 + 8t
basketball player: H = -16t2 + 16t + 60

Louisiana Comprehensive Curriculum, Revised 2008
Math Essentials Unit 7 Exploring Quadratic Functions 111
.8 60
.9 58.24 1.0 56.16
B. What is the maximum height reached by each jumper, and when is the
maximum height reached? Explain how you found your answer. Maximum heights are: Frog ( 4.74 inches) Flea ( .96 inches), Basketball Player
(63.84 inches or 3.84 inches off of the floor ) C. How long does each jump last? Explain how you found your answer Length of jumps: (Frog .92 seconds, Flea .5 seconds, and Basketball Player 2.5secs)
Resources
http://www.analyzemath.com/Graphing.html Provides a tutorial on how to determine the properties of the graph of quadratic functions and allows students to explore quadratic graphs. http://members.shaw.ca/ron.blond/QFA.CSF.APPLET/index.html Provides an easy to use applet that allows students to view in motion the translations of a quadratic function. http://orion.math.iastate.edu/algebra/sp/xcurrent/applets/quadraticfunction.html Provides an easy to use applet that allows students to view the translation and the parent graph of a quadratic equation at the same time. http://www.purplemath.com/modules/quadprob.htm Provides applications of quadratic equations for use in the classroom as examples or practice for students. Discovering Algebra an Investigative Approach by Jerald Murdock, Ellen Kamischke and Eric Kamischke. Key Curriculum Press, 2002. ISBN: 1-55953-340-4. 714 pages. This textbook provides an excellent guide to demonstrating the applications of quadratic equations in real-world scenarios and use of the graphing calculator to investigate quadratic functions. Modeling Motion: High School Math Activities with the CBR by Linda Antinone, Sam Gough, and Jill Gough. Texas Instruments, 1997. ISBN: 1-886309-14-0. 114 pages. This book provides 4 activities that model quadratics using the Texas Instrument CBR.

Louisiana Comprehensive Curriculum, Revised 2008
Math Essentials Unit 8 Exploring Other Math Topics 112
Math Essentials Unit 8: Exploring Other Math Topics
Time Frame: 3 weeks Unit Description This unit will focus on exploring various math topics: radials, exponential functions, growth and decay functions, map coloring, and Euler paths and circuits. Student Understandings Exponential growth and decay are integral parts of real-world science phenomena and business applications; therefore, it is important that all students attain at least a rudimentary understanding of exponential functions. They will understand the speed at which the exponential function increases as opposed to the linear or the polynomial function. Students will also explore the discrete mathematics topics of map coloring and Euler paths and circuits. Guiding Questions
1. Can students write radicals in exponential form and vice versa? 2. Can students solve radical equations? 3. Can students use exponential equations including those with base e to
solve real-world applications? 4. Can students explain how the graph of a function is affected by change of
degree, coefficient, and constants in polynomial, rational, radical, exponential, and logarithmic functions?
5. Can students employ the discrete math concept of map-coloring to solve problems?
6. Can students solve real-world problems involving Euler paths and circuits?
Unit 8 Grade-Level Expectations (GLEs)
GLE# GLE Text and Benchmarks Number and Number Relations Grade 9 6. Simplify and perform basic operations on numerical expressions involving
radicals (e.g., 2 3 5 3 7 3+ = ) (N-5-H)

Louisiana Comprehensive Curriculum, Revised 2008
Math Essentials Unit 8 Exploring Other Math Topics 113
Grade 10 1. Simplify and determine the value of radical expressions (N-2-H) (N-7-H) Algebra Grade 9 15. Translate among tabular, graphical, and algebraic representations of functions
and real-life situations (A-3-H) (P-1-H) (P-2-H) Grade 11-12 2. Evaluate and perform basic operations on expressions containing rational
exponents (N-2-H) 4. Translate and show the relationships among non-linear graphs, related tables of
values, and algebraic symbolic representations (A-1-H) 6. Analyze functions based on zeros, asymptotes, and local and global
characteristics of the function (A-3-H) 7. Explain, using technology, how the graph of a function is affected by change
of degree, coefficient, and constants in polynomial, rational, radical, exponential, and logarithmic functions (A-3-H)
8. Categorize non-linear graphs and their equations as quadratic, cubic, exponential, logarithmic, step function, rational, trigonometric, or absolute value (A-3-H) (P-5-H)
10. Model and solve problems involving quadratic, polynomial, exponential, logarithmic, step function, rational, and absolute value equations using technology (A-4-H)
Geometry Grade 11-12 16. Represent translations, reflections, rotations, and dilations of plane figures
using sketches, coordinates, vectors, and matrices (G-3-H) Patterns, Relations, and Functions Grade 9 36. Identify the domain and range of functions (P-1-H) Grade 10 26. Generalize and represent patterns symbolically, with and without technology
(P-1-H) Grade 11-12 24. Model a given set of real-life data with a non-linear function (P-1-H) (P-5-H) 25. Apply the concept of a function and function notation to represent and evaluate
functions (P-1-H) (P-5-H) 28. Represent and solve problems involving the translation of functions in the
coordinate plane (P-4-H) 27. Compare and contrast the properties of families of polynomial, rational,
exponential, and logarithmic functions, with and without technology (P-3-H) 29. Determine the family or families of functions that can be used to represent a
given set of real-life data, with and without technology (P-5-H)
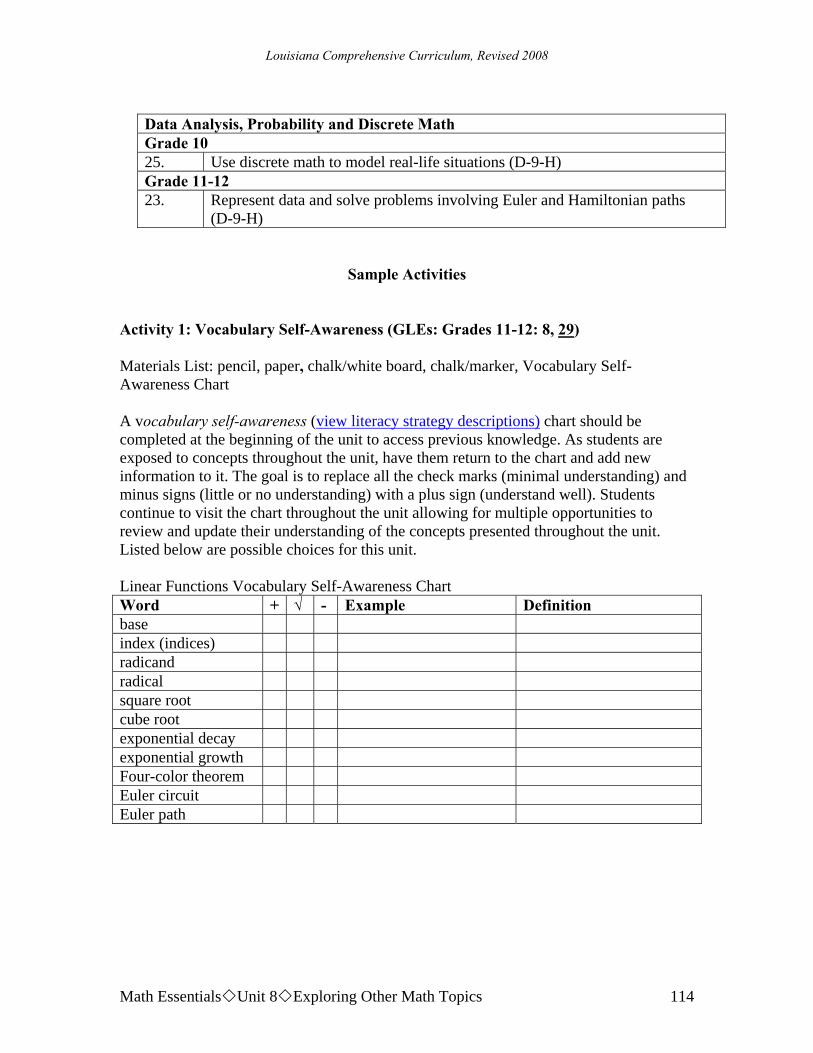
Louisiana Comprehensive Curriculum, Revised 2008
Math Essentials Unit 8 Exploring Other Math Topics 114
Data Analysis, Probability and Discrete Math Grade 10 25. Use discrete math to model real-life situations (D-9-H) Grade 11-12 23. Represent data and solve problems involving Euler and Hamiltonian paths
(D-9-H)
Sample Activities Activity 1: Vocabulary Self-Awareness (GLEs: Grades 11-12: 8, 29) Materials List: pencil, paper, chalk/white board, chalk/marker, Vocabulary Self-Awareness Chart A vocabulary self-awareness (view literacy strategy descriptions) chart should be completed at the beginning of the unit to access previous knowledge. As students are exposed to concepts throughout the unit, have them return to the chart and add new information to it. The goal is to replace all the check marks (minimal understanding) and minus signs (little or no understanding) with a plus sign (understand well). Students continue to visit the chart throughout the unit allowing for multiple opportunities to review and update their understanding of the concepts presented throughout the unit. Listed below are possible choices for this unit. Linear Functions Vocabulary Self-Awareness Chart Word + √ - Example Definition base index (indices) radicand radical square root cube root exponential decay exponential growth Four-color theorem Euler circuit Euler path

Louisiana Comprehensive Curriculum, Revised 2008
Math Essentials Unit 8 Exploring Other Math Topics 115
Activity 2: Rational Exponents and Radicals (GLEs: Grade 9: 6; Grade 10: 1, 26) Materials List: pencil, paper, chalk/white board, chalk/marker In this activity students will be introduced to rational exponents and radicals. Students will be able to express radicals as terms with rational exponents and express terms with rational exponents as radicals. Discuss with students rational numbers. Remind them that rational numbers are numbers that can be expressed in the form a/b where b does not equal zero. Discuss with students their previous use of exponents as reviewed in Unit 7. This can be done by having students simplify the following and explain in words the law of exponents used.
(1) a2a3
(2) 7
3
bb
(3) (c3)4 (4) 2x5 + 3x5 (5) (2x)3 (6) (a + b)2 (7) x0 (8) 2–1
Solutions: (1) a5, Law: When you multiply 2 expressions with the same base, add
exponents. (2) b4, Law: When you divide two expressions with the same base,
subtract the exponents. (3) c12, Law: When you raise a variable with an exponent to a power,
multiply the exponents (4) 5x5, Law: When you add two expressions that have the same variable
raised to the same exponent, add the coefficients. (5) 8x3, Law: When you raise a product to a power, each of the factors are
raised to that power. (6) a2 + 2ab + b2, Rule: When you raise a sum to a power use the
distributive property to multiply the terms. (7) 1, Law: Any variable or number ≠ 0 raised to the zero power = 1. (8) ½, Law: A number or variable raised to a negative exponent, is the
reciprocal. Explain to students that this lesson explores terms with rational exponents: exponents that can be expressed in the form a/b where b does not equal zero. For example:

Louisiana Comprehensive Curriculum, Revised 2008
Math Essentials Unit 8 Exploring Other Math Topics 116
23a . The variable a represents the base of the term. The rational exponent is comprised of
two parts, the numerator which represents the power of the base and the denominator which represents the root (index) of the base. The term can also be written in radical form 3 2a . Note how the exponent is expressed in radical form. The term a2 includes the base and the power and is collectively referred to as the radicand. Have the students discover the equivalency of the following with their calculators and write a rule for fractional exponents. This can be done by getting decimal representations, or the students can use the TEST feature on the TI-83 and TI84 to determine equivalency. Enter ( )5 5 ^ 1/ 2= (The = sign is found under TEST which is above the MATH button.) If the calculator returns a 1, then the statement is true; if it returns a 0, then the statement is false.
(1) 125 5and
(2) 2
32 35 5=
(3) 1
3 36 6and
(4) 3
34 42 2and Solution: #1, #3, #4 are equivalent. The rule for fractional exponents is
( )b bbc cca a a= =
Have students practice changing radicals to fractional exponents and vice versa using the laws of exponents by simplifying complex radicals. Have students simplify problems such as the following without calculators:
(1) 121
100⎛ ⎞⎜ ⎟⎝ ⎠
(2) 138
(3) 15625
(4) 3 64
power Index (root)
3 2a
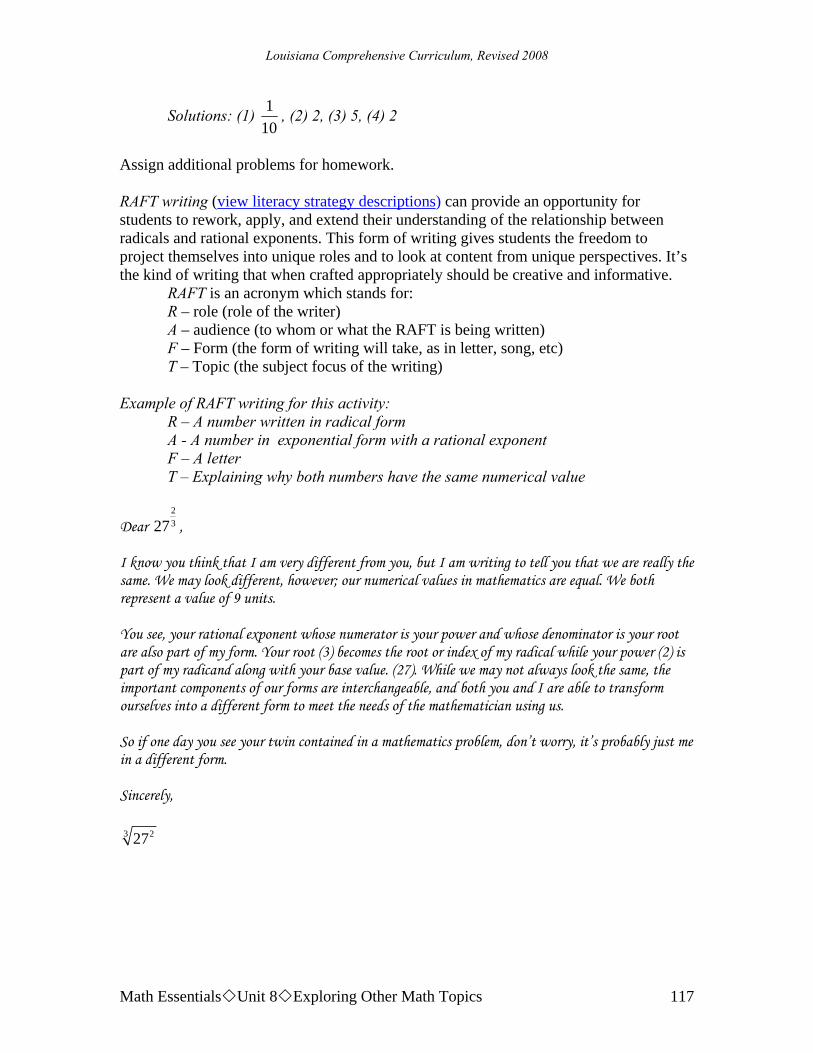
Louisiana Comprehensive Curriculum, Revised 2008
Math Essentials Unit 8 Exploring Other Math Topics 117
Solutions: (1) 110
, (2) 2, (3) 5, (4) 2
Assign additional problems for homework. RAFT writing (view literacy strategy descriptions) can provide an opportunity for students to rework, apply, and extend their understanding of the relationship between radicals and rational exponents. This form of writing gives students the freedom to project themselves into unique roles and to look at content from unique perspectives. It’s the kind of writing that when crafted appropriately should be creative and informative. RAFT is an acronym which stands for: R – role (role of the writer) A – audience (to whom or what the RAFT is being written) F – Form (the form of writing will take, as in letter, song, etc) T – Topic (the subject focus of the writing) Example of RAFT writing for this activity: R – A number written in radical form A - A number in exponential form with a rational exponent F – A letter T – Explaining why both numbers have the same numerical value
Dear 2327 ,
I know you think that I am very different from you, but I am writing to tell you that we are really the same. We may look different, however; our numerical values in mathematics are equal. We both represent a value of 9 units. You see, your rational exponent whose numerator is your power and whose denominator is your root are also part of my form. Your root (3) becomes the root or index of my radical while your power (2) is part of my radicand along with your base value. (27). While we may not always look the same, the important components of our forms are interchangeable, and both you and I are able to transform ourselves into a different form to meet the needs of the mathematician using us. So if one day you see your twin contained in a mathematics problem, don’t worry, it’s probably just me in a different form. Sincerely, 3 227

Louisiana Comprehensive Curriculum, Revised 2008
Math Essentials Unit 8 Exploring Other Math Topics 118
Activity 3: Solving Equations with Radical Expressions (GLEs: Grades 11-12: 2, 4, 6, 7, 10, 16, 24, 28) Materials List: pencil, paper, chalk/white board, chalk/marker, graphing calculator In this activity, students will solve equations that involve radical expressions analytically as well, as using technology, and applying them to real-world applications. Have students use their graphing calculator to graph the two functions and find the points of intersection in order to solve the following: (1) Graph 1 3 2y x= − and y2 = 4 to solve 3 2 4x − = .
(2) Graph 1 3 2y x= − and y2 = –4 to solve 3 2 4x − = − . (3)What is the difference?
Solution: (1) x = 6, (2) no solution , (3) A square root is never negative therefore there is no solution.
Ask the students to solve the following mentally and have students discuss their thought processes:
(1) 4 0x − = (2) 3 2x = (3) 5x = −
Define and discuss extraneous roots. Use the discussion to generate steps to solve equations containing variables under radicals: 1. Isolate the radical 2. Raise both sides of the equation to a power that is the same as the index of the radical 3. Solve 4. Check Have students solve the following algebraically:
(4) 3 2 4x − = (5) 3 2 4x − = − (6) How are the problems above related to the problems solved earlier graphically? (The root 6 is extraneous.)
Have students solve the following algebraically: (7) 3 5x x− + = . (Review the process of solving polynomials by
factoring and using the zero property.) (8) Graph both sides of the equation (i.e. 1 3 5y x= − + and y2 =x) and
explain why 7 is a solution and not 4. (4 is an extraneous root)
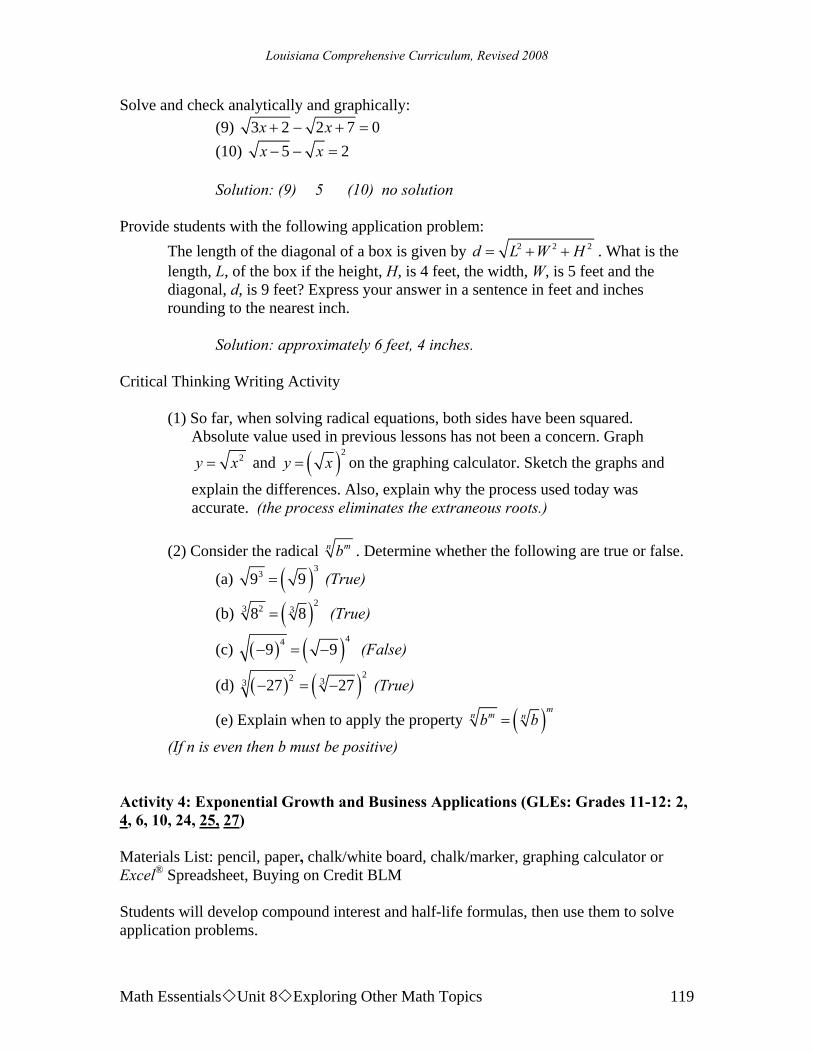
Louisiana Comprehensive Curriculum, Revised 2008
Math Essentials Unit 8 Exploring Other Math Topics 119
Solve and check analytically and graphically: (9) 3 2 2 7 0x x+ − + = (10) 5 2x x− − =
Solution: (9) 5 (10) no solution Provide students with the following application problem:
The length of the diagonal of a box is given by 2 2 2d L W H= + + . What is the length, L, of the box if the height, H, is 4 feet, the width, W, is 5 feet and the diagonal, d, is 9 feet? Express your answer in a sentence in feet and inches rounding to the nearest inch.
Solution: approximately 6 feet, 4 inches.
Critical Thinking Writing Activity (1) So far, when solving radical equations, both sides have been squared.
Absolute value used in previous lessons has not been a concern. Graph 2y x= and ( )2
y x= on the graphing calculator. Sketch the graphs and
explain the differences. Also, explain why the process used today was accurate. (the process eliminates the extraneous roots.)
(2) Consider the radical mn b . Determine whether the following are true or false.
(a) ( )339 9= (True)
(b) ( )223 38 8= (True)
(c) ( ) ( )449 9− = − (False)
(d) ( ) ( )22 33 27 27− = − (True)
(e) Explain when to apply the property ( )mmn nb b=
(If n is even then b must be positive) Activity 4: Exponential Growth and Business Applications (GLEs: Grades 11-12: 2, 4, 6, 10, 24, 25, 27) Materials List: pencil, paper, chalk/white board, chalk/marker, graphing calculator or Excel® Spreadsheet, Buying on Credit BLM Students will develop compound interest and half-life formulas, then use them to solve application problems.

Louisiana Comprehensive Curriculum, Revised 2008
Math Essentials Unit 8 Exploring Other Math Topics 120
Present students with the following problem and have them work in pairs or small groups to solve:
“If you have $2000 dollars and you earn 6% interest in one year, how much money will you have at the end of a year?” Explain the process used.
Solution: $2120. Students will have different discussions of how they came up with the answer. Use this problem to review the process of multiplying by 1.06 to get the final amount in a one-step process. Discuss the meaning of compounding interest semiannually and quarterly. Draw an empty chart similar to the one below on the board or visual presenter and guide students through its completion to develop a process to find the value of an account after 2 years.
o $2000 is invested at 6% APR (annual percentage rate) compounded semiannually (thus 3% each 6 months = 2 times per year). What is the account value after t years?
o While filling in the chart, record on the board the questions the students ask, such as:
1. Why do you divide .06 by 2? (annual interest is calculated at the half-year interval.)
2. Why do you have an exponent of 2t? (The number of times interest is earned occurs twice a year)
3. How did you come up with the pattern? (various answers)
Time years
Do the Math Developing the Formula Account Value
0 $2000 $2000 $2000.00 ½ $2000(1.03) $2000(1+.06/2) $2060.00 1 $2060(1.03) $2000(1+.06/2)(1+.06/2) $2121.80
1½ $2121.80(1.03) $2000(1+.06/2)(1+.06/2)(1+.06/2) $2185.454 2 $2185.454(1.03) $2000(1+.06/2)(1+.06/2)(1+.06/2)(1+.06/2) $2251.01762t $2000(1+.06/2)2t
Use the pattern to derive the formula for finding compound interest: ( ) (1 )ntrA t Pn
= + .
A(t) represents the value of the account in t years, P − the principal invested, r − the APR or annual percentage rate, t − the time in years, n − the number of times compounded in a year.

Louisiana Comprehensive Curriculum, Revised 2008
Math Essentials Unit 8 Exploring Other Math Topics 121
Have students test the formula ( ) 2.062000(1 )2
tA t = + by finding A(10), then using the
iteration feature of the calculator to find the value after 10 years. (2687.83) Have the students use a modified form of questioning the author (QtA) (view literacy strategy descriptions) to work additional problems. The goals of QtA are to construct the meaning of text, to help students go beyond the words on the page, and to relate outside experiences to the texts being read. Participate in QtA as a facilitator, guide, initiator, and responder. Students need to be taught that they can, and should, ask questions of authors as they read. In this modified form of QtA, the student is the author. Assign different rows of students to do the calculations for investing $2000 with APR of 6% for ten years if compounded (1) yearly, (2) quarterly, (3) monthly, and (4) daily. Then have the students swap problems with other students and ask the questions developed earlier. Once each student is sure that his/her partner has answered the questions and solved the problem correctly, ask for volunteers to work the problem on the board.
Solutions:
(1) yearly: ( )1(10).062000( 1 $3581.70
1A t ⎛ ⎞= + =⎜ ⎟
⎝ ⎠
(2) quarterly: ( )4(10).062000( 1 $3628.04
4A t ⎛ ⎞= + =⎜ ⎟
⎝ ⎠
(3) monthly: ( )12(10).062000 1 $3638.79
12A t ⎛ ⎞= + =⎜ ⎟
⎝ ⎠
(4) daily: ( )365(10).062000 1 $3644.06
365A t ⎛ ⎞= + =⎜ ⎟
⎝ ⎠
Have students solve the following problem for their situations using the table function of their graphing calculator. How long will it take to double the money in these situations? Again swap problems and once again facilitate the QtA process. (Round to the nearest tenth)
Solutions:
(1) yearly: 1( ).064000 2000 1
1
t⎛ ⎞= +⎜ ⎟⎝ ⎠
⇒ t =11.90 years
(2) quarterly: 4( ).06$4000 2000 1
4
t⎛ ⎞= +⎜ ⎟⎝ ⎠
⇒ t =11.64
years
(3) monthly: 12( ).064000 2000 1
12
t⎛ ⎞= +⎜ ⎟⎝ ⎠
⇒ t =11.58 years

Louisiana Comprehensive Curriculum, Revised 2008
Math Essentials Unit 8 Exploring Other Math Topics 122
(4) daily: 365( ).064000 2000 1
365
t⎛ ⎞= +⎜ ⎟⎝ ⎠
⇒ t =11.56 years
Credit cards can be a valuable tool and resource if used and managed wisely. One main advantage of credit is convenience. The amount to pay each month, however, can be confusing and often people just pay the minimum balance. The next activity provides an opportunity to explore various payment options as well as percentage rates of interest. The use of an Excel® spreadsheet is recommended but not required for this activity. Present the following scenario to students and have them guess how much will still be owed after 6 months. Write the guesses on the board.
Last week I bought a new computer system for $1500. My credit card company charges 18% annual interest with a minimum payment of $50 per month. How long do you think it will take me to pay off the credit card.
Next create the chart below and guide students in completing the chart: Month New Balance Interest
Charged Minimum payment amount
Amount still owed
1 $1500.00 $22.50 $50 $1472.50 2 $1472.50 $22.09 $50 $1444.59 3 $1444.59 $21.67 $50 $1416.23 4 $1416.23 $21.24 $50 $1387.47 5 $1387.47 $20.81 $50 $1358.28 6 $1358.28 $20.37 $50 $1328.65 Explain to students that after 6 months $300 will have been paid, but the balance on the credit card will only have decreased by $171.35. At this rate it will take a very long time to pay off the credit card. Discuss why loan companies do not mind giving borrowers lower monthly payments. (The lower the payment the longer it takes to pay off and the more interest the loan company makes.) Have students, working in small groups, complete the Buying on Credit BLMs. Upon completion of the Buying on Credit BLMs bring students together to discuss their results. After the class discussion have students respond to the following math prompt in their math learning logs (view literacy strategy descriptions): Explain why paying the minimum payment of $50 on a credit card balance of $5000 accruing 15% annual interest compounded daily is not a good idea.

Louisiana Comprehensive Curriculum, Revised 2008
Math Essentials Unit 8 Exploring Other Math Topics 123
Possible explanation: Sometimes paying the minimum doesn’t even pay the interest that accrued that month on the balance of the credit card; therefore, it is actually going more into debt even though making monthly payments. Example: $5,000 balance at 15% APR, with a monthly payment of $50 will leave a balance of $5013 after making the minimum payment of $50. This is because the one month’s interest is about $63. Since only $50 is paid, the balance is increased to $5013. Activity 5: The Number e (GLEs: Grade 9: 15, 36; Grades 11-12: 2, 4, 7, 24) Materials List: pencil, paper, chalk/white board, chalk/marker, graphing calculator, Buying on Credit BLM from Activity 4 In this activity students will discover the approximation of e and use it to solve exponential equations. Have students do the following activity to discover the approximation of e. Let students use their calculators to complete the following table. Have them put the equation in y1 and use the home screen and the notation y1(1000) to find the values.
n 10 100 1000 10,000 100,000 1,000,000 1,000,000,00011
n
n⎛ ⎞+⎜ ⎟⎝ ⎠
2.05937
2.07048
2.7169
2.7181
2.7182682
2.718280469
2.718281827
Define e as value that this series approaches as n gets larger and larger. It is approximately equal to 2.72 and was named after Leonard Euler in 1750. Stress that e is a transcendental number similar to π . Although it looks as if it repeats, the calculator has limitations. The number is really 2.71828182845904590… and is irrational.
Compare 11n
n⎛ ⎞+⎜ ⎟⎝ ⎠
to the compound interest formula, A(t) = Pert, which is derived by
increasing the number of times that compounding occurs, until interest has been theoretically compounded an infinite number of times. Revisit the problem from Activity 6 in which the students invested $2000 at 6% APR, but this time compound it continuously for one year and discuss the difference.
Solution: $3644.24 Have students revisit the Buying on Credit BLMs from Activity 6 and calculate the interest values and time values if interest is compounded continuously.

Louisiana Comprehensive Curriculum, Revised 2008
Math Essentials Unit 8 Exploring Other Math Topics 124
Activity 6: Applications of Exponential Growth (GLEs: Grade 9: 15, 36; Grades 11-12: 2, 4, 7, 24) Materials List: pencil, paper, chalk/white board, chalk/marker, graphing calculator In this activity students will explore the concept of exponential growth as it relates to population and bacterial growth. Example 1: Population Growth – determining amount During the 20th century the United States’ population grew at an continuous rate of 1.3% annually, from about 76 million in 1900 to 281 million in 2000. If this rate of growth continues, how many million people will inhabit the Unites States at the end of the 21st century? A = 281e1.3(100)
A = 1031 million (over 1 billion people)! Example 2: Bacterial Growth – determining time Cantrell is growing a culture of bacteria for her biology lab. She has calculated that k = 0.658 for the bacterial growth of her culture, when t is measured in hours. How many bacteria will be present after 5 hours?
0.658(5)50013,421
y ey=≈
Provide students with additional problems to complete for independent practice in class and for homework. Note: This concept will be further explored in Louisiana Swamps Growth and Decay at the end of Activity 7. Activity 7: Exponential Decline and Decay: Science Applications (GLEs: Grade 9: 15, 36; Grade 11-12: 2, 4, 7) Materials List: pencil, paper, chalk/white board, chalk/marker, graphing calculator, Louisiana Swamps Growth and Decay BLM In this activity students will explore the concept of half-life and exponential decay/decline as it relates to carbon dating, alligators, and Newton’s Law of Cooling. Explain to students that there are many applications for the number e in science. Newton’s Law of Cooling expresses the relationship between the temperature (F°) of a cooling object, y, and the time, t, elapsed in minutes since cooling began. The

Louisiana Comprehensive Curriculum, Revised 2008
Math Essentials Unit 8 Exploring Other Math Topics 125
relationship is given by the equation kty ae c−= + . The variable c represents the temperature of the medium surrounding the cooling object, the variable t represents time, a represents the current temperature minus the temperature of the surrounding medium of the cooling object, and k represents the rate of cooling. For example, if a cup of coffee is heated to 210°F in a microwave and then removed from the microwave and placed on the counter in a room 70°, what will be the temperature of the coffee after 15 minutes? Note: a = (210° – 70°) k = rate of cooling (in this case -.01) t = time (in minutes) c = the temperature of the surrounding medium
(0.01)(15)
.15
140 70140 70190.5
kty ae cy ey ey
−
−
−
= +
= +
= +=
Another application of the number e in science is the use of an elements half-life to determine the age of an object. Definition of half-life: the amount of time required for a specific amount of a quantity to decrease to half the original quantity’s amount. The formula for half-life is similar to that for interest. y = nekt, where y is the final amount, n is the initial amount, k is a constant, and t is time. If k > 0 then the quantity is growing; if k < 0 then the quantity is decaying. Example: A certain radioactive element has a half-life with rate of decline, k = -0.377, when t is measured in days. If there are 500 grams of the radioactive element initially, how much will remain after two days? y=500e -0.377(2)
235.24y grams≈ Have students, working with a partner or small group, complete the Louisiana Swamp Growth and Decay BLMs. Circulate about the room to facilitate student understanding and to check for accuracy in computations.
Solution: It will cool to 190.5° after 15 minutes.

Louisiana Comprehensive Curriculum, Revised 2008
Math Essentials Unit 8 Exploring Other Math Topics 126
Activity 8: Comparing Interest Rates (GLEs: Grades 11-12: 2, 10, 24, 29) Materials List: paper, pencil, graphing calculator, Interested? Research Project BLM This is an out-of-class activity completed by pairs of students: Interested? Research Project BLM. Have students choose a financial institution in town or on the Internet. If possible, have each pair of students choose a different bank. Have them contact the bank or go online to find out information about the interest rates available for two different types of accounts and how they are compounded. Have students fill in the information listed below and solve the problems that follow. When all projects are in, have students report to the class.
Interested? Research Project Information Sheet: Name of bank, name of person to whom you spoke, bank address and phone number or the URL if online, types of accounts, interest rates, and the method of compounding funds. Problem: Create a hypothetical situation in which you invest $1000.
(1) Find the equation to model two different accounts for your bank. (2) Determine how much you will have at the end of high school, at the end of
college, and at retirement after 50 years, for each account. (Assume you finish high school in one year and college four years later.)
(3) Determine how many years it will take you to double your money for each account.
(4) Determine in which account you will put your money and discuss why. Class Presentation: Display all information on a poster board and report to the class. Grading Rubric for Data Research Project
10 pts. − Information sheet: Name of bank, name of person you spoke to, bank address and phone number or the URL if online, types of accounts, interest rates, and how funds are compounded (source and date of data)
10 pts. − Compound interest equation for each situation. Account value for both accounts at the end of high school, college, and when you retire in 50 years (show all your work).
10 pts. − Solution showing your work to determine how long it will take you to double your money in each account.
10 pts. − Discussion of where you will put your money and why 10 pts. − Poster - neatness, completeness, readability 10 pts. − Class presentation

Louisiana Comprehensive Curriculum, Revised 2008
Math Essentials Unit 8 Exploring Other Math Topics 127
Activity 9: Color Mapping (GLE: Grade 10: 25) Materials List: paper, pencil, color pencils, overhead projector, overhead transparency markers, Maps of Cinnabar and Kelvar BLM, Map of Perouse BLM, Map Coloring BLM In this activity students will explore the discrete math concept of map coloring. Use overhead transparencies of the maps with markers as guided practice for the activity on the next page. Explain to students that a mapmaker wants to use as few colors as possible to color the map of Cinnabar. No two neighboring towns can be colored the same color. Hand out the maps of Cinnabar. Point out that if countries meet at a point, they are not considered neighbors. Neighbors have an adjoining boundary line. Have students work in pairs to color the map of Cinnabar using the least amount of colors. Solution: Two colors are enough, therefore encourage students to keep trying until they reach this conclusion. Demonstrate this on the overhead transparency. Next have students look at the map of Kelvar to determine the minimum number of colors needed to color this map. After a few minutes, ask thow many colors will be needed. (3). If no one responds correctly, have them use only 3 colors. If they are able to determine that only 3 colors are needed, inquire as to why 2 colors are not enough. (Point to 3 regions, such that each shares a border with the other two.) Demonstrate to students that there is an easier way to view the map coloring using graphs. To construct a graph on the map put a dot in each town in Kelvar. Connect the dots of towns that have an adjoining border with another town. Now simply color each vertex so that no adjacent vertex has the same color. No two vertices connected by the same line can be the same color. This helps students to quickly view the minimum number of colors needed to color a map.

Louisiana Comprehensive Curriculum, Revised 2008
Math Essentials Unit 8 Exploring Other Math Topics 128
Finally, give them a map of Perouse (the most difficult map). Ask students to first draw a graph and use the graph vertices to determine the number of different colors this map will have if the mapmaker uses the least amount of colors. (4) Have students practice this concept using the Map Coloring BLMs. Upon completion of the maps, bring students together to allow them to demonstrate their work to the rest of the class. You may even want to hang some of the maps in the class for other students to view. Explain to students that there is a math theorem called the Four-Color Map Theorem which states that every conceivable planar map (one drawn on a flat-surface) can be colored using only four colors. Challenge students to draw a map that proves this theorem false (not possible) or a map that they think the other students would find difficult to complete using only four colors. Once they have drawn a challenging map have them exchange the map with their partner to demonstrate how the map can be colored using only 4 colors. Activity 10: Euler’s Paths and Circuits (GLEs: Grade 11-12: 23) Materials List: paper, pencil, chalk/white board, chalk/marker, overhead projector, overhead transparencies of examples, overhead transparency of Bridges of Konigsberg BLM In this activity students are introduced to Euler paths and circuits. In the previous activity on map coloring, students were introduced to graphing. A graph is composed of vertices and edges. Each vertex is represented by drawing a dot, and each
R
R
R
B
B
Y
Y
No two adjacent vertices are the same color
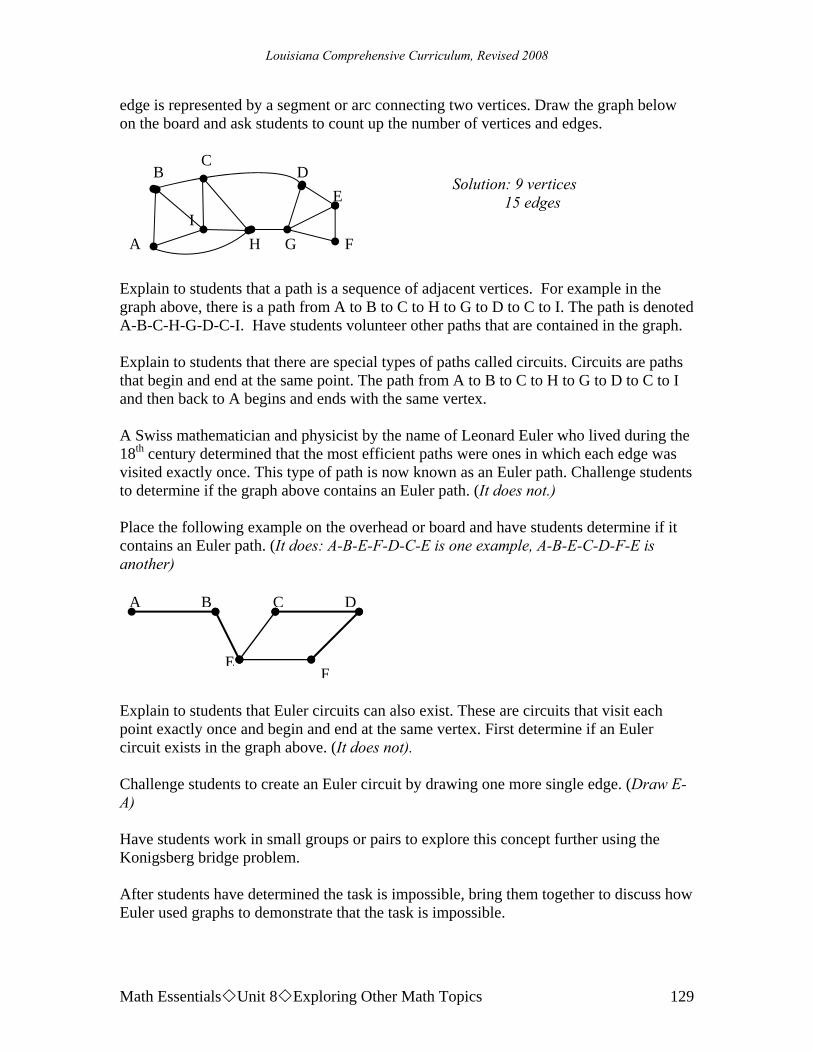
Louisiana Comprehensive Curriculum, Revised 2008
Math Essentials Unit 8 Exploring Other Math Topics 129
edge is represented by a segment or arc connecting two vertices. Draw the graph below on the board and ask students to count up the number of vertices and edges.
Explain to students that a path is a sequence of adjacent vertices. For example in the graph above, there is a path from A to B to C to H to G to D to C to I. The path is denoted A-B-C-H-G-D-C-I. Have students volunteer other paths that are contained in the graph. Explain to students that there are special types of paths called circuits. Circuits are paths that begin and end at the same point. The path from A to B to C to H to G to D to C to I and then back to A begins and ends with the same vertex. A Swiss mathematician and physicist by the name of Leonard Euler who lived during the 18th century determined that the most efficient paths were ones in which each edge was visited exactly once. This type of path is now known as an Euler path. Challenge students to determine if the graph above contains an Euler path. (It does not.) Place the following example on the overhead or board and have students determine if it contains an Euler path. (It does: A-B-E-F-D-C-E is one example, A-B-E-C-D-F-E is another) Explain to students that Euler circuits can also exist. These are circuits that visit each point exactly once and begin and end at the same vertex. First determine if an Euler circuit exists in the graph above. (It does not). Challenge students to create an Euler circuit by drawing one more single edge. (Draw E-A) Have students work in small groups or pairs to explore this concept further using the Konigsberg bridge problem. After students have determined the task is impossible, bring them together to discuss how Euler used graphs to demonstrate that the task is impossible.
Solution: 9 vertices 15 edges
B C
D E
F G H I
A
A B C D
FE

Louisiana Comprehensive Curriculum, Revised 2008
Math Essentials Unit 8 Exploring Other Math Topics 130
Euler used the graph below to show the relationship of the bridges and determined that crossing each bridge exactly once was equivalent to tracing the graph without retracing any edge. He also determined that this was impossible to do.
Euler noted that for an Euler circuit to exist, the degree of each vertex (or number of edges connected by a vertex) had to be even. Have students working in pairs or in small groups, complete the Euler Paths and Circuits BLM Bring students together to discuss their solutions and to check for the accuracy of their answers. Be sure to include in the discussion that an Euler circuit exists if and only if the degree of each vertex is even. Explain to students that paths and circuits can be used to help determine the shortest distance route for a variety of real world applications. Ask students to name some such routes to which paths and circuits can be applied. (mail delivery, garbage pickup, school bus route) To find the shortest path of a graph, find the path that has the least number of edges. However, this is not always the shortest route because the shortest route is the one with the minimal distance. Demonstrate this using the graph below. The shortest path from A to C is A-E-C, however the minimal distance path is A-E-D-C. While A-E-C is considered the shortest path because it only includes three edges, the distance of this path is 10 units. The path A-E-D-C is the one with a minimal distance of 9 units.
A
D B
2 A B
C D
3
4 7
2
9 E

Louisiana Comprehensive Curriculum, Revised 2008
Math Essentials Unit 8 Exploring Other Math Topics 131
Have students work in pairs or small groups to complete the Shortest Path/Minimal Distance BLMs. Upon completion bring students together to discuss results and check for accuracy.
Sample Assessments General Assessments
• The student will submit a portfolio containing artifacts such as: (1) examples of student products (2) scored tests and quizzes (3) student work (in-class or homework)
• Monitor student progress using small quizzes to check for understanding during the unit on such topics as the following:
(1) solving exponential equations with same base (2) graphing y = ex with translations (3) solving exponential equations with base e
• Administer two comprehensive assessments: (1) solving radical equations, relating exponential functions and graphs (2) solving exponential equations with the same base, with base e and with
application problems
Activity-Specific Assessments:
• Activity 2: Critical Thinking Writing
(1) Simplify ( )29− .
(2) Simplify ( )29− .
(3) Discuss why the answers to problems 1 and 2 are different.
(4) Discuss why one of the Laws of Exponents, ( )b bbc cca a a= = , does not
apply to this problem. Solutions:
(1) 9 (2) –9 (3) By order of operations, in problem 1, the -9 must be squared first to
get 81, then find the square root to get 9. In problem 2, first take the square root and that will give a non-real answer.
(4) This Law of Exponents only applies when a > 0.

Louisiana Comprehensive Curriculum, Revised 2008
Math Essentials Unit 8 Exploring Other Math Topics 132
• Activity 6: Critical Thinking Writing
In 1990 statistical data estimated the world population at 5.3 billion with a growth rate of approximately 1.9% each year.
(1) Let 1990 be time 0 and determine the equation that best models population growth.
(2) What will the population be in the year 2010? (3) What will the population be after 50 years? (4) Discuss the validity of using the data to predict the future.
Solution: (1) A = 5.3e .019t, (2) 7.75 billion, (3)13.7 billion (4) There is no real validity because the rate of growth is constantly shifting. It does provide a good estimate if everything else remains the same.
• Activity 10: Evaluate the Interested? Research Project (see activity) using the
following rubric:
Scoring Rubric for Compounding Wealth Research Project 10 pts. − Information sheet: Name of bank, name of person contacted, bank
address and phone number or the URL if online, types of accounts, interest rates, and method of compounding funds (source and date of data).
10 pts. − Compound interest equation for each situation. Account value for both accounts at the end of high school, college and when you retire in 50 years (show all your work).
10 pts. − Solution showing work to determine how long will take to double money in each account.
10 pts. − Discussion of where to put money and why 10 pts. − Poster - neatness, completeness, readability 10 pts. − Class presentation
Resources
How to Get What You Want in Life with the Money You Already Have by Carol Keeffe. Little, Brown, 1995. ISBN: 0-316-488518-7. 235 pages.
Multiplying People, Dividing Resources, Global Math Activities. Edited by Nikos Boutis and Pamela Wasserman. Population Connection, Washington D.C., 2002. ISBN: 0-945219-19-9. 74 pages. http://www.algebralab.org/Word/Word.aspx?file=Algebra_ExponentialGrowth.xml This website is an excellent tutorial site. It provides an explanation of exponential growth and real-life word problems students can solve on their own, with hints given and explanations of solutions provided.

Louisiana Comprehensive Curriculum, Revised 2008
Math Essentials Unit 8 Exploring Other Math Topics 133
http://www-groups.dcs.st-and.ac.uk/~history/Mathematicians/Euler.html This website provides information on Leonard Euler. http://www.lacoast.gov/Programs/2050/MainReport/report1.pdf A report by LA Coast organization on the consequences of wetlands loss in Louisiana. http://www.mathwarehouse.com/exponential-growth/graph-and-equation.php An interactive site and tutorial for helping students understand exponential growth and decay. http://www.physics.uoguelph.ca/tutorials/exp/index.html An excellent website that provides visual representations for exponential growth and decay, including graphs.