Math Class 7 Chapter 3-NCERT Solution-Data Handling · (Chapter – 3) (Data Handling) (Class –...
16
www.mywayteaching.com (Chapter – 3) (Data Handling) (Class – VII) Exercise 3.1 Question 1: Find the range of heights of any ten students of your class. Answer 1: S. No. Name of students Height (in feet) 1. Gunjan 4.2 2. Aditi 4.5 3. Nikhil 5 4. Akhil 5.1 5. Riya 5.2 6. Akshat 5.3 7. Abhishek 5.1 8. Mayank 4.7 9. Rahul 4.9 10. Ayush 4.5 Range = Highest height – Lowest height = 5.3 – 4.2 = 1.1 feet. Question 2: Organize the following marks in a class assessment, in a tabular form: 4, 6, 7, 5, 3, 5, 4, 5, 2, 6, 2, 5, 1, 9, 6, 5, 8, 4, 6, 7. (i) Which number is the highest? (ii) Which number of the lowest? (iii) What is the range of the lowest? (iv) Find the arithmetic mean www.mywayteaching.com Math Class 7 Chapter 3-NCERT Solution 1 Email:[email protected]
Transcript of Math Class 7 Chapter 3-NCERT Solution-Data Handling · (Chapter – 3) (Data Handling) (Class –...

www.myw
aytea
ching
.com
(Chapter – 3) (Data Handling) (Class – VII)
Exercise 3.1
Question 1:
Find the range of heights of any ten students of your class.
Answer 1:
S. No. Name of students Height (in feet)
1. Gunjan 4.2
2. Aditi 4.5
3. Nikhil 5
4. Akhil 5.1
5. Riya 5.2
6. Akshat 5.3
7. Abhishek 5.1
8. Mayank 4.7
9. Rahul 4.9
10. Ayush 4.5
Range = Highest height – Lowest height
= 5.3 – 4.2
= 1.1 feet.
Question 2:
Organize the following marks in a class assessment, in a tabular form:
4, 6, 7, 5, 3, 5, 4, 5, 2, 6, 2, 5, 1, 9, 6, 5, 8, 4, 6, 7.
(i) Which number is the highest?
(ii) Which number of the lowest?
(iii) What is the range of the lowest?
(iv) Find the arithmetic mean
www.mywayteaching.com
Math Class 7 Chapter 3-NCERT Solution 1 Email:[email protected]

www.myw
aytea
ching
.com
Answer 2:
S. No. Marks Tally marks Frequency
(No. of students)
1.
2.
3.
4.
5.
6.
7.
8.
9.
1
2
3
4
5
6
7
8
9
1
2
1
3
5
4
2
1
1
(i) The highest number is 9.
(ii) The lowest number is 1.
(iii) The range of the data is 9 – 1 = 8
(iv) Arithmetic mean =
4 6 7 5 3 5 4 5 2 6 2 5 1 9 6 5 8 4 6 7
20
= 100
20 =5
Question 3:
Find the mean of the first five whole numbers.
Answer 3:
The first five whole numbers are 0, 1, 2, 3 and 4.
Therefore,
Mean of first five whole numbers = Sum of numbers
Total number
= 0 1 2 3 4
5
= 10
5 =2
Thus, the mean of first five whole numbers is 5.
www.mywayteaching.com
Math Class 7 Chapter 3-NCERT Solution 2 Email:[email protected]

www.myw
aytea
ching
.com
Question 4: A cricketer scores the following runs in eight innings: 58, 76, 40, 35, 46, 45, 0, 100 Find the mean score.
Answer 4:
Number of innings = 8
Mean of score = Sum of scores
Number of innings
= 58 76 40 35 46 45 0 100
8
= 400
8 = 50
Thus, the mean score is 50.
Question 5:
Following table shows the points of each player scored in four games:
Player Game 1 Game 2 Game 3 Game 4
A 14 16 10 10
B 0 8 6 4
C 8 11 Did not play 13
Now answer the following questions:
(i) Find the mean to determine A’s average number of points scored per game.
(ii) To find the mean number of points per game for C, would you divide the total
points by 3 or 47? Why?
(iii) B played in all the four games. How would you find the mean?
(iv) Who is the best performer?
Answer 5:
(i) Mean of player A = Sum of scores by A
No. of games played by A
= 14 16 10 10 50
4
= 12.5
(ii) We should divide the total points by 3 because player C played only three
games.
(iii) Player B played in all the four games.
www.mywayteaching.com
Math Class 7 Chapter 3-NCERT Solution 3 Email:[email protected]

www.myw
aytea
ching
.com
Mean of player B = Sum of scores by B
No. of games played by B
= 0 8 6 4 18
4
= 4.5
(iv) To find the best performer, we should know the mean of all players.
Mena of player A = 12.5
Mean of player B = 4.5
Mean of player C = 8 11 13 32
3
= 10.67
Therefore, on comparing means of all players, player A is the best performer.
Question 6:
The marks (out of 100) obtained by a group of students in a science test are 85, 76, 90,
85, 39, 48, 56, 95, 81 and 75. Find the:
(i) The highest and the lowest marks obtained by the students.
(ii) Range of the marks obtained.
(iii) Mean marks obtained by the group.
Answer 6:
(i) Highest marks obtained by the student = 95
Lowest marks obtained by the student = 39
(ii) Range of marks = Highest marks – Lowest marks
= 95 – 39 = 56
Sum of marks(iii) Mean of obtained marks = Total number of marks
= 85 76 90 85 39 48 56 95 81 75
10
= 730
10 = 73
Thus, the mean marks obtained by the group of students is 73.
www.mywayteaching.com
Math Class 7 Chapter 3-NCERT Solution 4 Email:[email protected]

www.myw
aytea
ching
.com
Question 7:
The enrolment in a school during six consecutive years was as follows:
1555, 1670, 1750, 2013, 2540, 2820
Find the mean enrolment of the school for this period.
Answer 7:
Mean enrolment = Sum of numbers of enrolment
Total number of enrolment
= 1555 1670 1750 2013 2540 2820
6
= 12348
6 = 2058
Thus, the mean enrolment of the school is 2,058.
Question 8:
The rainfall (in mm) in a city on 7 days of a certain week was recorded as follows:
Day Mon Tue Wed Thur Fri Sat Sun
Rainfall (in mm) 0.0 12.2 2.1 0.0 20.5 5.5 1.0
(i) Find the range of the rainfall in the above data.
(ii) Find the mean rainfall for the week.
(iii) On how many days was the rainfall less than the mean rainfall?
Answer 8:
(i) The range of the rainfall = Highest rainfall – Lowest rainfall
= 20.5 – 0.0 = 20.5 mm
(ii) Main rainfall = Sum of rainfall recorded
Total number of days
= 0.0 12.2 2.1 2.2 20.5 5.5 1.0
7
= 41.3
7 = 5.9 mm
(iii) 5 days. i.e., Monday, Wednesday, Thursday, Saturday and Sunday rainfalls
were less than the mean rainfall.
www.mywayteaching.com
Math Class 7 Chapter 3-NCERT Solution 5 Email:[email protected]

www.myw
aytea
ching
.com
Question 9:
The height of 10 girls were measured in cm and the results are as follows:
135, 150, 139, 128, 151, 132, 146, 149, 143, 141
(i) What is the height of the tallest girl?
(ii) What is the height of the shortest girl?
(iii) What is the range of data?
(iv) What is the mean height of the girls?
(v) How many girls have heights more than the mean height?
Answer 9:
(i) The height of the tallest girl = 151 cm
(ii) The height of the shortest girl = 128 cm
(iii) The range of the data = Highest height – Lowest height
= 151 – 128 = 23 cm
(iv) The mean height = Sum of heights of the girsl
Total numebr of girls
= 135 150 139 128 151 132 146 149 143 141
10
= 1414
10 = 141.4 cm
(v) Five girls, i.e., 150, 151, 146, 149, 143 have heights (in cm) more than the
mean height.
www.mywayteaching.com
Math Class 7 Chapter 3-NCERT Solution 6 Email:[email protected]

www.myw
aytea
ching
.com
Exercise 3.2 Question 1:
The scores in mathematics test (out of 25) of students is as follows:
19, 25, 23, 20, 9, 20, 15, 10, 5, 16, 25, 20, 24, 12, 20
Find the mode and median of this data. Are they same?
Answer 1: Arranging the given data in ascending order,
5, 9, 10, 12, 15, 16, 19, 20, 20, 20, 20, 23, 24, 25, 25
Mode is the observation occurred the highest number of times.
Therefore,
Mode = 20
Median is the middle observation = 20
Yes, Mode and Median are same of given observation.
Question 2:
The runs scored in a cricket match by 11 players is as follows:
6, 15, 120, 50, 100, 80, 10, 15, 8, 10, 15
Find the mean, mode and median of this data. Are the three same?
Answer 2:
Arranging the given data in ascending order,
6, 8, 10, 10, 15, 15, 15, 50, 80, 100, 120
Mean = Sum of observations
Number of observations
= 6 8 10 10 15 15 15 50 80 100 120
11
= 429
11 = 39
Mode is the observation occurred the highest number of times = 15
Median is the middle observation = 15
Therefore, Mode and Median is 15.
No, the mean, median and mode are not same.
www.mywayteaching.com
Math Class 7 Chapter 3-NCERT Solution 7 Email:[email protected]
www.myw
aytea
ching
.com
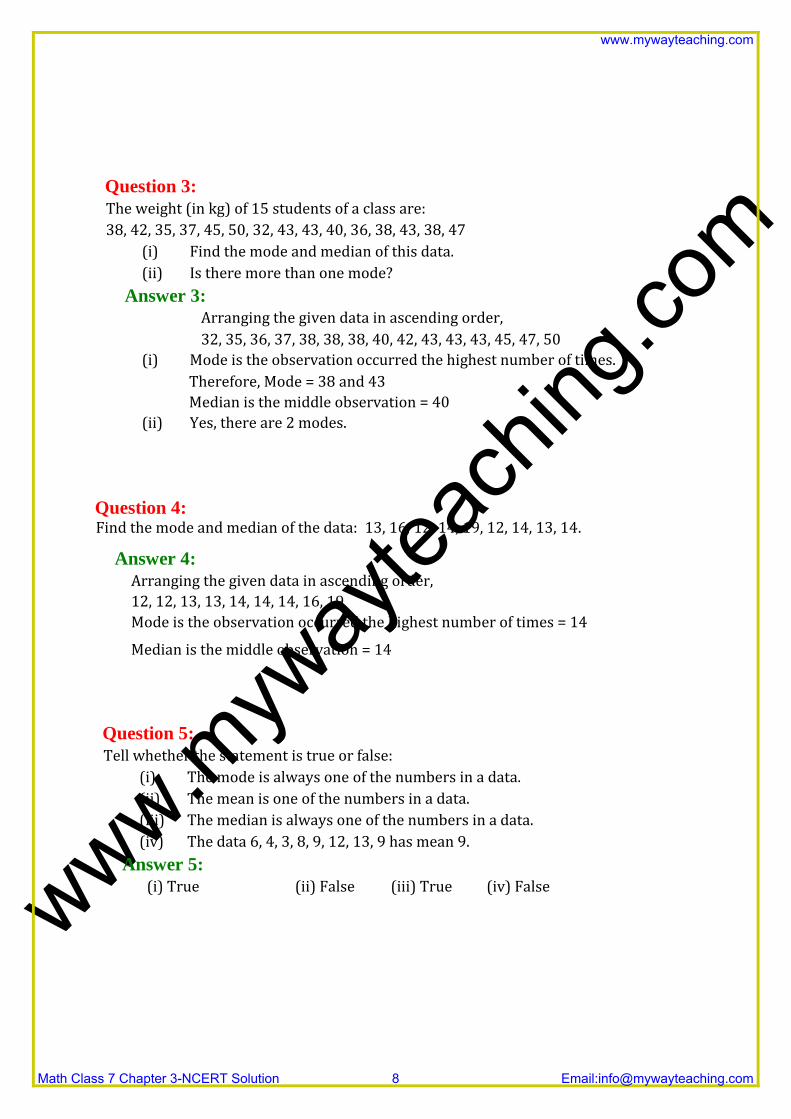
Question 3:
The weight (in kg) of 15 students of a class are:
38, 42, 35, 37, 45, 50, 32, 43, 43, 40, 36, 38, 43, 38, 47
(i) Find the mode and median of this data.
(ii) Is there more than one mode?
Answer 3: Arranging the given data in ascending order,
32, 35, 36, 37, 38, 38, 38, 40, 42, 43, 43, 43, 45, 47, 50
(i) Mode is the observation occurred the highest number of times.
Therefore, Mode = 38 and 43
Median is the middle observation = 40
(ii) Yes, there are 2 modes.
Question 4: Find the mode and median of the data: 13, 16, 12, 14, 19, 12, 14, 13, 14.
Answer 4:
Arranging the given data in ascending order,
12, 12, 13, 13, 14, 14, 14, 16, 19
Mode is the observation occurred the highest number of times = 14
Median is the middle observation = 14
Question 5:
Tell whether the statement is true or false:
(i) The mode is always one of the numbers in a data.
(ii) The mean is one of the numbers in a data.
(iii) The median is always one of the numbers in a data.
(iv) The data 6, 4, 3, 8, 9, 12, 13, 9 has mean 9.
Answer 5:
(i) True (ii) False (iii) True (iv) False
www.mywayteaching.com
Math Class 7 Chapter 3-NCERT Solution 8 Email:[email protected]

www.myw
aytea
ching
.com
Exercise 3.3 Question 1:
Use the bar graph (fig 3.3) to answer the following questions:
(a) Which is the most popular pet?
(b) How many students have dog as a pet?
Answer 1:
(a) Cat is the most popular pet.
(b) 8 students have dog as a pet.
Question 2:
Read the bar graph which shows the number of books sold by a bookstore during five
consecutive years and answer the following questions:
www.mywayteaching.com
Math Class 7 Chapter 3-NCERT Solution 9 Email:[email protected]

www.myw
aytea
ching
.com
(i) About how many books were sold in 1989? 1990? 1992?
(ii) In which year were about 475 books sold? About 225 books sold?
(iii) In which years were fewer than 250 books sold?
(iv) Can you explain how you would estimate the number of books sold in 1989?
Answer 2: According to the given bar graph,
(i) (a) In 1989, 180 books were sold.
(b) In 1990, 475 books were sold.
(c) In 1992, 225 books were sold.
(ii) In 1990, about 475 books were sold and in 1992, about 225 books were sold.
(iii) In 1989 and 1992 fewer than 250 books were sold.
(iv) By reading the graph, we calculate that 180 books were sold in 1989.
Question 3:
Number of children in six different classes are given below. Represent the data on a bar
graph.
Class Fifth Sixth Seventh Eighth Ninth Tenth
No. of children 135 120 95 100 90 80
(a) How would you choose a scale?
(b) Answer the following questions:
(i) Which class has the maximum number of children? And the minimum?
(ii) Find the ratio of students of class sixth to the students of class eighth.
Answer 3: Data represented by the bar graph is as follows:
www.mywayteaching.com
Math Class 7 Chapter 3-NCERT Solution 10 Email:[email protected]

www.myw
aytea
ching
.com
(a) Scale: 1 unit = 25 children
(b) (i) Fifth class has the maximum number of children and
Tenth class has the minimum number of children.
(ii) Ratio = Number of students in class sixth
Number of students in class eighth
= 120
100
= 6
5 = 6:5
Question 4: The performance of a student in 1st term and 2nd term is given. Draw a double bar graph
choosing appropriate scale and answer the following:
Subject English Hindi Maths Science S. Science
1st term (MM. 100) 67 72 88 81 73
2nd term (MM (100) 70 65 95 85 75
(i) In which subject has the child improved his performance the most?
(ii) In which subject is the improvement the least?
(iii) Has the performance gone down in any subject?
Answer 4: Data represented by bar graph is as follows:
www.mywayteaching.com
Math Class 7 Chapter 3-NCERT Solution 11 Email:[email protected]

www.myw
aytea
ching
.com
Difference of marks of 1st term and 2nd term
English = 70 – 67 = 3
Hindi = 65 – 72 = 7
Maths = 95 – 88 = 7
Science = 85 – 81 = 4
S. Science = 75 – 73 = 2
(i) He has most improved in Maths subject.
(ii) In S. Science subject, his improvement is less.
(iii) Yes, in Hindi subject, his performance has gone down.
Question 5:
Consider this data collected from a survey of a colony.
Favourite Sport Cricket Basket Ball Swimming Hockey Athletics
Watching 1240 470 510 423 250
Participating 620 320 320 250 105
(i) Draw a double bar graph choosing an appropriate scale. What do you infer
from the bar graph?
(ii) Which sport is most popular?
(iii) Which is more preferred, watching or participating in sports?
Answer 5:
Data represented by the double bar graph is as follows:
www.mywayteaching.com
Math Class 7 Chapter 3-NCERT Solution 12 Email:[email protected]

www.myw
aytea
ching
.com
(i) This bar graph represents the number of persons who are watching and
participating in their favourite sports.
(ii) Cricket is most popular.
(iii) Watching sports is more preferred.
Question 6:
Take the data giving the minimum and the maximum temperature of various cities given
in the beginning of this Chapter. Plot a double bat graph using the data and answer the
following:
Temperature of Cities as on 20.6.2006
City Ahmedabad Amritsar Bangalore Chennai
Max.
Min.
38o C
29o C
37o C
26o C
28o C
21o C
36o C
27o C
City Delhi Jaipur Jammu Mumbai
Max.
Min.
38o C
28o C
39o C
29o C
41o C
26o C
32o C
27o C
(i) Which city has the largest difference in the minimum and maximum
temperature on the given data?
(ii) Which is the hottest city and which is the coldest city?
(iii) Name two cities where maximum temperature of one was less than the
minimum temperature of the order.
(iv) Name the city which has the least difference between its minimum and the
maximum temperature.
Answer 6: Data represented by double bar graph is as follows:
www.mywayteaching.com
Math Class 7 Chapter 3-NCERT Solution 13 Email:[email protected]

www.myw
aytea
ching
.com
(i) Jammu has the largest difference in temperature i.e.,
Maximum temperature = 41oC and
Minimum temperature = 26oC.
∴ Difference = 41oC – 26oC = 15oC
(ii) Jammu is the hottest city due to maximum temperature is high and
Bangalore is the coldest city due to maximum temperature is low.
(iii) Maximum temperature of Bangalore is 28oC
Minimum temperature of two cities whose minimum temperature is higher
than the maximum temperature of Bangalore are Ahemedabad and Jaipur where
the minimum temperature is 29oC
(iv) Mumbai has the least difference in temperature i.e.,
Maximum temperature = 32oC and
Minimum temperature = 27oC
∴ Difference = 32oC – 27oC = 5oC
www.mywayteaching.com
Math Class 7 Chapter 3-NCERT Solution 14 Email:[email protected]

www.myw
aytea
ching
.com
Exercise 3.4
Question 1:
Tell whether the following is certain to happen, impossible can happen but not certain.
(i) You are older today than yesterday.
(ii) A tossed coin will land heads up.
(iii) A die when tossed shall land up with 8 on top.
(iv) The next traffic light seen will be green.
(v) Tomorrow will be a cloudy day.
Answer 1:
(i) It is certain to happen.
(ii) It can happen but not certain.
(iii) It is impossible.
(iv) It can happen but not certain.
(v) It can happen but not certain.
Question 2:
There are 6 marbles in a box with numbers from 1 to 6 marked on each of them.
(i) What is the probability of drawing a marble with number 2?
(i) What is the probability of drawing a marble with number 5?
Answer 2: Total marbles from 1 to 6 marked in a box = 6
(i) The probability of drawing a marble with number 2.
P (drawing one marble) = 1
6
(ii) The probability of drawing a marble with number 5.
P (drawing one marble) = 1
6
www.mywayteaching.com
Math Class 7 Chapter 3-NCERT Solution 15 Email:[email protected]

www.myw
aytea
ching
.com
Question 3:
A coin is flipped to decide which team starts the game. What is the probability that your
team will start?
Answer 3:
A coin has two possible outcomes Head and Tail.
Probability of getting Head or Tail is equal.
P (Starting game) = 1
2
www.mywayteaching.com
Math Class 7 Chapter 3-NCERT Solution 16 Email:[email protected]