Math Applications - Weebly
10
Math Applications The applications that follow are like the ones you will encounter in many workplaces. Use the mathematics you have learned in this chapter to solve the problems. Wherever possible, use your calculator to solve the problems that require numerical answers. 1 At a constant temperature, the weight of water increases as the volume increases. The graph below shows the relationship between water’s weight and volume at 60°F. 0 20 10 0 40 30 60 50 80 70 2 4 Volume (gal) Water at 60°F Weight (lb) 6 8 a. What is the approximate weight of 2 gallons of water at 60°F? What is the weight of 6 gallons of water at 60°F? b. What is the slope of the graphed line? What is the y-intercept of the graphed line? c. Write the equation of the graphed line in slope-intercept form. 2 For each range of data below, use the maximum length of the axis given for a graph to determine a scale unit for that axis. For example, for a data range of 0 to 4 hours to fit an axis 4 inches in length, you can use a scale unit of 1 hour per inch. Data Range Maximum Length of Axis Scale Unit a. 0 to 800 miles 8 inches b. 0 to 500,000 persons 5 inches c. 0 to 60 seconds 12 centimeters d. 25 to 30 minutes 10 centimeters e. 80°C to 120°C 10 centimeters 256 Chapter 4 Linear Equations
Transcript of Math Applications - Weebly
3 Pressure changes with depth in water and with altitude in air. The following tables list values of pressures measured in atmospheres, at different depths, in feet below sea level, and altitudes, in feet above sea level.
Water Pressure vs Depths Air Pressure vs AltitudeDepth
(ft)Pressure
(Atm)Altitude (1,000 ft)
Pressure (Atm)
0 1 0 1.0033 2 10 0.6966 3 20 0.46
100 4 30 0.30133 5 40 0.19166 6 50 0.11200 7 60 0.07300 10400 13500 16
a. Plot graphs of the two sets of data.
b. Does either graph show a linear relationship? If so, which graph(s)?
c. If any of the graphs are linear, identify the slope of the graph and the y-intercept of the graph.
d. Use your values of the slope and the intercept to write an equation for the linear relationship(s).
4 The points on the coordinate plane represent the location of three ships.
a. What is the midpoint between ship X and ship Y? S
Pressure changes with depth in water and with altitude in air. The followingtables list values of pressures at different depths below and altitudes abovesea level. see margin 9–12
Water Pressure vs Depths Air Pressure vs AltitudeDepth (ft) Pressure (Atm) Altitude (1000 ft) Pressure (Atm)
0 1 0 1.0033 2 10 0.6966 3 20 0.46
100 4 30 0.30133 5 40 0.19166 6 50 0.11200 7 60 0.07300 10400 13500 16
Plot graphs of the two sets of data.
Does either graph show a linear relationship? If so, which graph(s)?
If any of the graphs are linear, identify the slope of the graph and the y-intercept of the graph.
Use your values of the slope and the intercept to write an equation for thelinear relationship(s).
Steers weighing 800 to 900 pounds consume an average of 22.3 pounds offeed per day. These steers should gain weight at an average rate of 2.7 pounds per day.
Write an equation in slope-intercept form showing the number of days for asteer in this weight range to gain W pounds of body weight. d 2
1.7W
13
12
11
10
9
266 Chapter 4 Linear Equations
(72,
32 )
(1,72 )
( 12, 2)
D b. What is the midpoint
between ship Y and ship Z? S
Pressure changes with depth in water and with altitude in air. The followingtables list values of pressures at different depths below and altitudes abovesea level. see margin 9–12
Water Pressure vs Depths Air Pressure vs AltitudeDepth (ft) Pressure (Atm) Altitude (1000 ft) Pressure (Atm)
0 1 0 1.0033 2 10 0.6966 3 20 0.46
100 4 30 0.30133 5 40 0.19166 6 50 0.11200 7 60 0.07300 10400 13500 16
Plot graphs of the two sets of data.
Does either graph show a linear relationship? If so, which graph(s)?
If any of the graphs are linear, identify the slope of the graph and the y-intercept of the graph.
Use your values of the slope and the intercept to write an equation for thelinear relationship(s).
Steers weighing 800 to 900 pounds consume an average of 22.3 pounds offeed per day. These steers should gain weight at an average rate of 2.7 pounds per day.
Write an equation in slope-intercept form showing the number of days for asteer in this weight range to gain W pounds of body weight. d 2
1.7W
13
12
11
10
9
266 Chapter 4 Linear Equations
(72,
32 )
(1,72 )
( 12, 2)
D c. What is the midpoint
between ship X and ship Z? S
Pressure changes with depth in water and with altitude in air. The followingtables list values of pressures at different depths below and altitudes abovesea level. see margin 9–12
Water Pressure vs Depths Air Pressure vs AltitudeDepth (ft) Pressure (Atm) Altitude (1000 ft) Pressure (Atm)
0 1 0 1.0033 2 10 0.6966 3 20 0.46
100 4 30 0.30133 5 40 0.19166 6 50 0.11200 7 60 0.07300 10400 13500 16
Plot graphs of the two sets of data.
Does either graph show a linear relationship? If so, which graph(s)?
If any of the graphs are linear, identify the slope of the graph and the y-intercept of the graph.
Use your values of the slope and the intercept to write an equation for thelinear relationship(s).
Steers weighing 800 to 900 pounds consume an average of 22.3 pounds offeed per day. These steers should gain weight at an average rate of 2.7 pounds per day.
Write an equation in slope-intercept form showing the number of days for asteer in this weight range to gain W pounds of body weight. d 2
1.7W
13
12
11
10
9
266 Chapter 4 Linear Equations
(72,
32 )
(1,72 )
( 12, 2)D
Math ApplicationsThe applications that follow are like the ones you will encounter in many workplaces. Use the mathematics you have learned in this chapter to solve the problems. Wherever possible, use your calculator to solve the problems that require numerical answers.
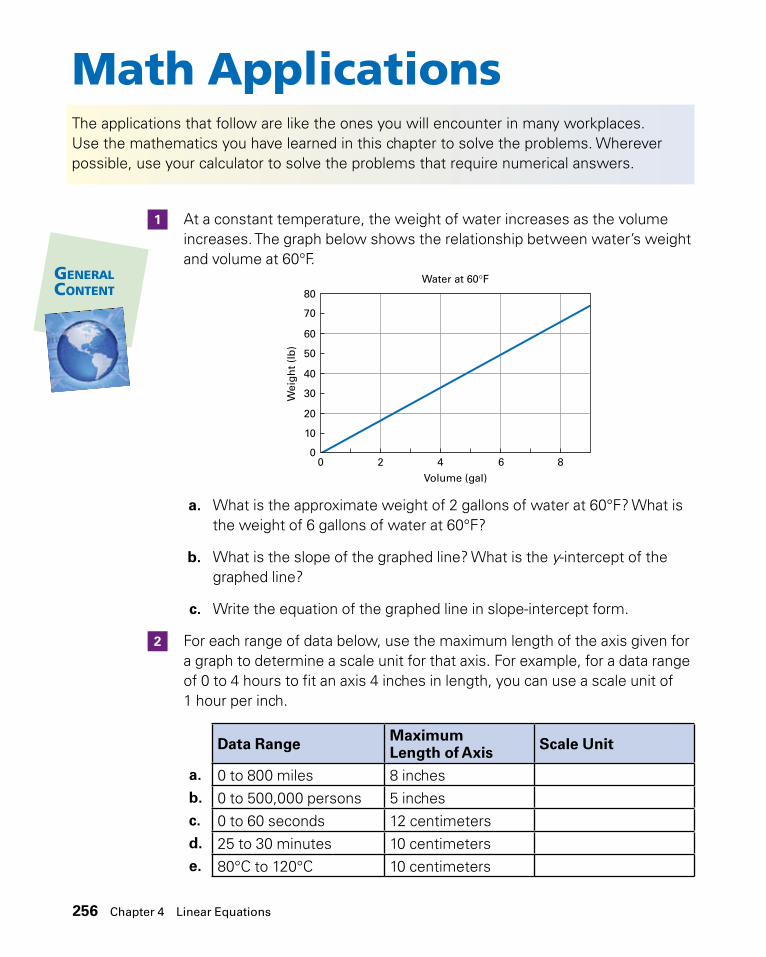
1 At a constant temperature, the weight of water increases as the volume increases. The graph below shows the relationship between water’s weight and volume at 60°F.
0
20
10
0
40
30
60
50
80
70
2 4
Volume (gal)
Water at 60°FW
eig
ht
(lb
)
6 8
a. What is the approximate weight of 2 gallons of water at 60°F? What is the weight of 6 gallons of water at 60°F?
b. What is the slope of the graphed line? What is the y-intercept of the graphed line?
c. Write the equation of the graphed line in slope-intercept form.
2 For each range of data below, use the maximum length of the axis given for a graph to determine a scale unit for that axis. For example, for a data range of 0 to 4 hours to fit an axis 4 inches in length, you can use a scale unit of 1 hour per inch.
Data Range Maximum Length of Axis Scale Unit
a. 0 to 800 miles 8 inches
b. 0 to 500,000 persons 5 inches
c. 0 to 60 seconds 12 centimeters
d. 25 to 30 minutes 10 centimeters
e. 80°C to 120°C 10 centimeters
256 Chapter 4 Linear Equations

3 Pressure changes with depth in water and with altitude in air. The following tables list values of pressures measured in atmospheres, at different depths, in feet below sea level, and altitudes, in feet above sea level.
Water Pressure vs Depths Air Pressure vs AltitudeDepth
(ft)Pressure
(Atm)Altitude (1,000 ft)
Pressure (Atm)
0 1 0 1.0033 2 10 0.6966 3 20 0.46
100 4 30 0.30133 5 40 0.19166 6 50 0.11200 7 60 0.07300 10400 13500 16
a. Plot graphs of the two sets of data.
b. Does either graph show a linear relationship? If so, which graph(s)?
c. If any of the graphs are linear, identify the slope of the graph and the y-intercept of the graph.
d. Use your values of the slope and the intercept to write an equation for the linear relationship(s).
4 The points on the coordinate plane represent the location of three ships.
a. What is the midpoint between ship X and ship Y? S
Pressure changes with depth in water and with altitude in air. The followingtables list values of pressures at different depths below and altitudes abovesea level. see margin 9–12
Water Pressure vs Depths Air Pressure vs AltitudeDepth (ft) Pressure (Atm) Altitude (1000 ft) Pressure (Atm)
0 1 0 1.0033 2 10 0.6966 3 20 0.46
100 4 30 0.30133 5 40 0.19166 6 50 0.11200 7 60 0.07300 10400 13500 16
Plot graphs of the two sets of data.
Does either graph show a linear relationship? If so, which graph(s)?
If any of the graphs are linear, identify the slope of the graph and the y-intercept of the graph.
Use your values of the slope and the intercept to write an equation for thelinear relationship(s).
Steers weighing 800 to 900 pounds consume an average of 22.3 pounds offeed per day. These steers should gain weight at an average rate of 2.7 pounds per day.
Write an equation in slope-intercept form showing the number of days for asteer in this weight range to gain W pounds of body weight. d 2
1.7W
13
12
11
10
9
266 Chapter 4 Linear Equations
(72,
32 )
(1,72 )
( 12, 2)
D b. What is the midpoint
between ship Y and ship Z? S
Pressure changes with depth in water and with altitude in air. The followingtables list values of pressures at different depths below and altitudes abovesea level. see margin 9–12
Water Pressure vs Depths Air Pressure vs AltitudeDepth (ft) Pressure (Atm) Altitude (1000 ft) Pressure (Atm)
0 1 0 1.0033 2 10 0.6966 3 20 0.46
100 4 30 0.30133 5 40 0.19166 6 50 0.11200 7 60 0.07300 10400 13500 16
Plot graphs of the two sets of data.
Does either graph show a linear relationship? If so, which graph(s)?
If any of the graphs are linear, identify the slope of the graph and the y-intercept of the graph.
Use your values of the slope and the intercept to write an equation for thelinear relationship(s).
Steers weighing 800 to 900 pounds consume an average of 22.3 pounds offeed per day. These steers should gain weight at an average rate of 2.7 pounds per day.
Write an equation in slope-intercept form showing the number of days for asteer in this weight range to gain W pounds of body weight. d 2
1.7W
13
12
11
10
9
266 Chapter 4 Linear Equations
(72,
32 )
(1,72 )
( 12, 2)
Pressure changes with depth in water and with altitude in air. The followingtables list values of pressures at different depths below and altitudes abovesea level. see margin 9–12
Water Pressure vs Depths Air Pressure vs AltitudeDepth (ft) Pressure (Atm) Altitude (1000 ft) Pressure (Atm)
0 1 0 1.0033 2 10 0.6966 3 20 0.46
100 4 30 0.30133 5 40 0.19166 6 50 0.11200 7 60 0.07300 10400 13500 16
Plot graphs of the two sets of data.
Does either graph show a linear relationship? If so, which graph(s)?
If any of the graphs are linear, identify the slope of the graph and the y-intercept of the graph.
Use your values of the slope and the intercept to write an equation for thelinear relationship(s).
Steers weighing 800 to 900 pounds consume an average of 22.3 pounds offeed per day. These steers should gain weight at an average rate of 2.7 pounds per day.
Write an equation in slope-intercept form showing the number of days for asteer in this weight range to gain W pounds of body weight. d 2
1.7W
13
12
11
10
9
266 Chapter 4 Linear Equations
(72,
32 )
(1,72 )
( 12, 2)
D c. What is the midpoint
between ship X and ship Z? S
Pressure changes with depth in water and with altitude in air. The followingtables list values of pressures at different depths below and altitudes abovesea level. see margin 9–12
Water Pressure vs Depths Air Pressure vs AltitudeDepth (ft) Pressure (Atm) Altitude (1000 ft) Pressure (Atm)
0 1 0 1.0033 2 10 0.6966 3 20 0.46
100 4 30 0.30133 5 40 0.19166 6 50 0.11200 7 60 0.07300 10400 13500 16
Plot graphs of the two sets of data.
Does either graph show a linear relationship? If so, which graph(s)?
If any of the graphs are linear, identify the slope of the graph and the y-intercept of the graph.
Use your values of the slope and the intercept to write an equation for thelinear relationship(s).
Steers weighing 800 to 900 pounds consume an average of 22.3 pounds offeed per day. These steers should gain weight at an average rate of 2.7 pounds per day.
Write an equation in slope-intercept form showing the number of days for asteer in this weight range to gain W pounds of body weight. d 2
1.7W
13
12
11
10
9
266 Chapter 4 Linear Equations
(72,
32 )
(1,72 )
( 12, 2)D
Math Applications 257
�112��
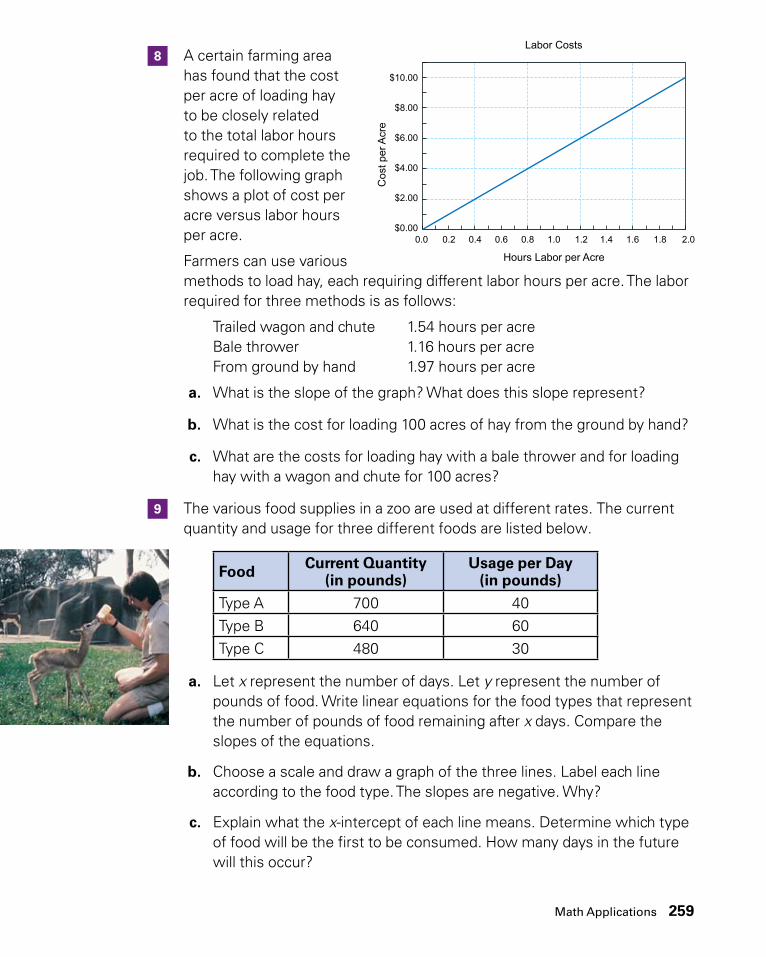
8 A certain farming areahas found that the cost per acre of loading hay to be closely related to the total labor hours required to complete the job. The following graph shows a plot of cost per acre versus labor hours per acre.
Farmers can use various methods to load hay, each requiring different labor hours per acre. The labor required for three methods is as follows:
Trailed wagon and chute 1.54 hours per acreBale thrower 1.16 hours per acreFrom ground by hand 1.97 hours per acre
a. What is the slope of the graph? What does this slope represent?
b. What is the cost for loading 100 acres of hay from the ground by hand?
c. What are the costs for loading hay with a bale thrower and for loading hay with a wagon and chute for 100 acres?
9 The various food supplies in a zoo are used at different rates. The current quantity and usage for three different foods are listed below.
Food Current Quantity (in pounds)
Usage per Day (in pounds)
Type A 700 40 Type B 640 60 Type C 480 30
a. Let x represent the number of days. Let y represent the number of pounds of food. Write linear equations for the food types that represent the number of pounds of food remaining after x days. Compare the slopes of the equations.
b. Choose a scale and draw a graph of the three lines. Label each line according to the food type. The slopes are negative. Why?
c. Explain what the x-intercept of each line means. Determine which type of food will be the first to be consumed. How many days in the future will this occur?
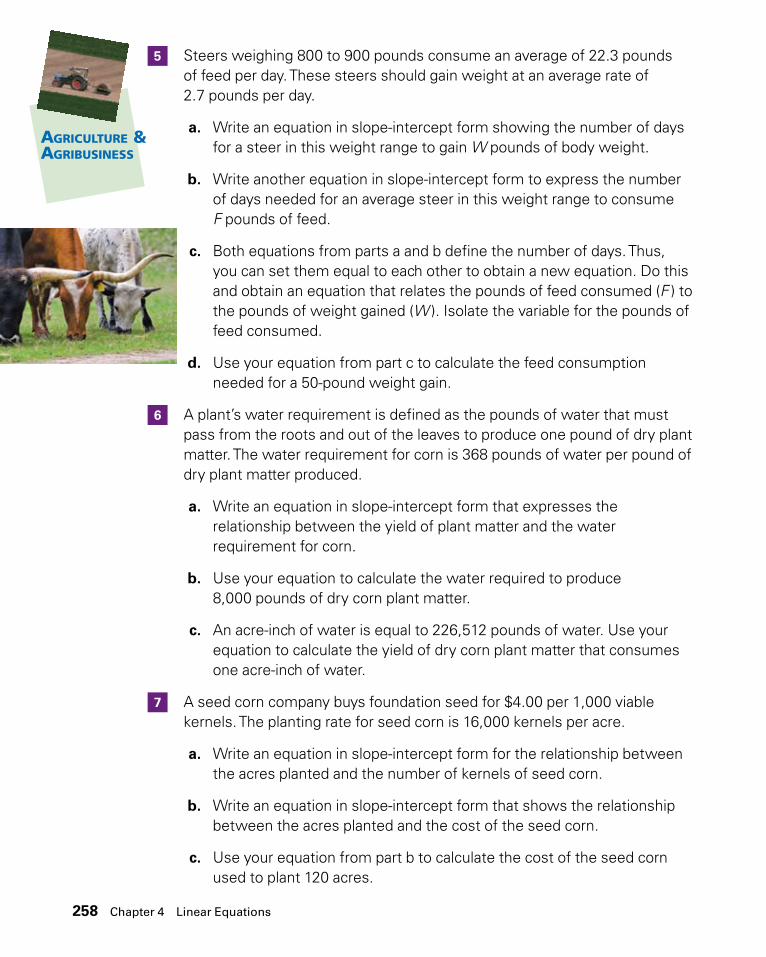
5 Steers weighing 800 to 900 pounds consume an average of 22.3 pounds of feed per day. These steers should gain weight at an average rate of 2.7 pounds per day.
a. Write an equation in slope-intercept form showing the number of days for a steer in this weight range to gain W pounds of body weight.
b. Write another equation in slope-intercept form to express the number of days needed for an average steer in this weight range to consume F pounds of feed.
Write another equation in slope-intercept form to express the number ofdays needed for an average steer in this weight range to consume F poundsof feed. d 22
1.3F
Both equations from Exercises 13 and 14 define the number of days. Thus,you can set them equal to each other to obtain a new equation. Do this andobtain an equation that relates the pounds of feed consumed (F ) to thepounds of weight gained (W ). Isolate the variable for the pounds of feedconsumed. F 8.26W
Use your equation from Exercise 15 to calculate the feed consumptionneeded for a 50-pound weight gain. about 413 pounds
A plant’s water requirement is defined as the pounds of water that mustpass from the roots and out of the leaves to produce one pound of dry plantmatter. The water requirement for corn is 368 pounds of water per pound ofdry plant matter produced.
Write an equation in slope-intercept form that expresses the relationshipbetween the yield of plant matter and the water requirement for corn. W 368PUse your equation to calculate the water required to produce 8,000 poundsof dry corn plant matter. 2,944,000 pounds
An acre-inch of water is equal to 226,512 pounds of water. Use yourequation to calculate the yield of dry corn plant matter that consumes oneacre-inch of water. 615.52 pounds
A seed corn company buys foundation seed from a seed stock company for$4.00 per 1,000 viable kernels. The planting rate for seed corn is 16,000kernels per acre.
Write an equation in slope-intercept form for the relationship between theacres planted and the number of kernels of seed corn. N 16,000A
Write an equation in slope-intercept form that shows the relationshipbetween the acres planted and the cost of the seed corn. C $64A
Use your equation from Exercise 21 to calculate the cost of the seed cornused to plant 120 acres. $7680
A certain farming area has found that the cost per acre of loading hay to beclosely related to the total labor hours required to complete the job. Thefollowing graph shows a plot of cost per acre versus labor hours per acre.
22
21
20
19
18
17
16
15
14
Math Applications 267
c. Both equations from parts a and b define the number of days. Thus, you can set them equal to each other to obtain a new equation. Do this and obtain an equation that relates the pounds of feed consumed (F ) to the pounds of weight gained (W ). Isolate the variable for the pounds of feed consumed. F 8.26W
d. Use your equation from part c to calculate the feed consumption needed for a 50-pound weight gain. about 413 pounds
6 A plant’s water requirement is defined as the pounds of water that must pass from the roots and out of the leaves to produce one pound of dry plant matter. The water requirement for corn is 368 pounds of water per pound of dry plant matter produced.
a. Write an equation in slope-intercept form that expresses the relationship between the yield of plant matter and the water requirement for corn. W 368P
b. Use your equation to calculate the water required to produce 8,000 pounds of dry corn plant matter. 2,944,000 pounds
c. An acre-inch of water is equal to 226,512 pounds of water. Use your equation to calculate the yield of dry corn plant matter that consumes one acre-inch of water. 615.52 pounds
7 A seed corn company buys foundation seed for $4.00 per 1,000 viable kernels. The planting rate for seed corn is 16,000 kernels per acre.
a. Write an equation in slope-intercept form for the relationship between the acres planted and the number of kernels of seed corn. N 16,000A
b. Write an equation in slope-intercept form that shows the relationship between the acres planted and the cost of the seed corn. C 64A
c. Use your equation from part b to calculate the cost of the seed corn used to plant 120 acres. $7,680
Pressure changes with depth in water and with altitude in air. The followingtables list values of pressures at different depths below and altitudes abovesea level. see margin 9–12
Water Pressure vs Depths Air Pressure vs AltitudeDepth (ft) Pressure (Atm) Altitude (1000 ft) Pressure (Atm)
0 1 0 1.0033 2 10 0.6966 3 20 0.46
100 4 30 0.30133 5 40 0.19166 6 50 0.11200 7 60 0.07300 10400 13500 16
Plot graphs of the two sets of data.
Does either graph show a linear relationship? If so, which graph(s)?
If any of the graphs are linear, identify the slope of the graph and the y-intercept of the graph.
Use your values of the slope and the intercept to write an equation for thelinear relationship(s).
Steers weighing 800 to 900 pounds consume an average of 22.3 pounds offeed per day. These steers should gain weight at an average rate of 2.7 pounds per day.
Write an equation in slope-intercept form showing the number of days for asteer in this weight range to gain W pounds of body weight. d 2
1.7W
13
12
11
10
9
266 Chapter 4 Linear Equations
(72,
32 )
(1,72 )
( 12, 2)
258 Chapter 4 Linear Equations
8 A certain farming areahas found that the cost per acre of loading hay to be closely related to the total labor hours required to complete the job. The following graph shows a plot of cost per acre versus labor hours per acre.
Farmers can use various methods to load hay, each requiring different labor hours per acre. The labor required for three methods is as follows:
Trailed wagon and chute 1.54 hours per acreBale thrower 1.16 hours per acreFrom ground by hand 1.97 hours per acre
a. What is the slope of the graph? What does this slope represent?
b. What is the cost for loading 100 acres of hay from the ground by hand?
c. What are the costs for loading hay with a bale thrower and for loading hay with a wagon and chute for 100 acres?
9 The various food supplies in a zoo are used at different rates. The current quantity and usage for three different foods are listed below.
Food Current Quantity (in pounds)
Usage per Day (in pounds)
Type A 700 40 Type B 640 60 Type C 480 30
a. Let x represent the number of days. Let y represent the number of pounds of food. Write linear equations for the food types that represent the number of pounds of food remaining after x days. Compare the slopes of the equations.
b. Choose a scale and draw a graph of the three lines. Label each line according to the food type. The slopes are negative. Why?
c. Explain what the x-intercept of each line means. Determine which type of food will be the first to be consumed. How many days in the future will this occur?
Math Applications 259
12 A department store pays each of its senior sales clerks a weekly salary of $150 plus a 3% commission on the clerk’s gross sales. This graph shows the pay scale.
$0 $1,000 $2,000 $3,000 $4,000 $5,000 $6,000
$350
$300
$250
$200
$150
$100
$50
$0
Gross Sales
Clerk Weekly Pay
Tota
l In
com
e
a. What is the y-intercept of the graph? What quantity does this intercept represent? Explain why there is no x-intercept on the graph.
b. What is the slope of the graph? What rate does the slope represent?
c. Write the equation for the graphed line in slope-intercept form.
d. Suppose the store increased the commission to 5% but decreased the weekly salary to $100. How would this change affect the graph? Write the equation for these new conditions.
13 The financial department of a production firm presented the graph shown at the right of the production costs for a certain item. The graph shows the fixed costs—the costs for tooling and overhead that are required to produce even one item—and the variable costs—the costs due to materials, labor, marketing, transportation, and so on.
a. Identify the slope and y-intercept of the graph for total production cost.
b. How are these (slope and y-intercept) related to the fixed costs and the variable costs?
0 5 10 15 20
20181614121086420
Hundred Units Produced
Fixed and Variable Costs
Variable Costs
Fixed Costs$1,0
00 o
f Pr
od
uct
Co
st
10 A farmer can estimate the cost of transporting crops to market as a sum of the cost of fuel and the cost of the vehicle, as they relate to the distance to market. Fuel costs for the vehicle are about $0.095 per mile. The cost of the vehicle is a fixed value of $2,500 per year.
a. Write an equation for the annual transportation cost as a function of total annual miles traveled.
b. What is the slope of your equation? What does this rate represent?
c. What is the meaning of the y-intercept of the equation?
d. Draw a graph of the equation.
e. Suppose another farmer has a vehicle with fixed annual costs of $2,500 and fuel costs of $0.115 per mile. Compare the graph of this line with the graph of the line from part d. What do the lines have in common?
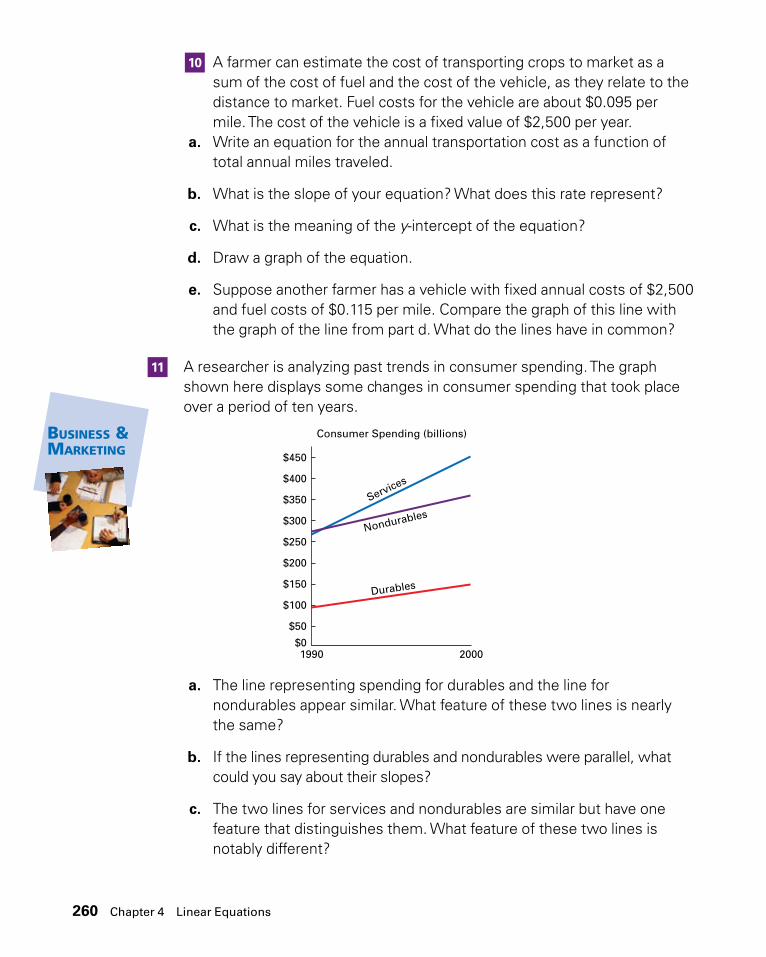
11 A researcher is analyzing past trends in consumer spending. The graph shown here displays some changes in consumer spending that took place over a period of ten years.
SW7216/Cord AlgebraFigure 5.76.TA
1990 2000
$50
$100
$150
$200
$250
$300
Consumer Spending (billions)
Services
$350
$400
$450
$0
Nondurables
Durables
a. The line representing spending for durables and the line for nondurables appear similar. What feature of these two lines is nearly the same?
b. If the lines representing durables and nondurables were parallel, what could you say about their slopes?
c. The two lines for services and nondurables are similar but have one feature that distinguishes them. What feature of these two lines is notably different?
260 Chapter 4 Linear Equations

12 A department store pays each of its senior sales clerks a weekly salary of $150 plus a 3% commission on the clerk’s gross sales. This graph shows the pay scale.
$0 $1,000 $2,000 $3,000 $4,000 $5,000 $6,000
$350
$300
$250
$200
$150
$100
$50
$0
Gross Sales
Clerk Weekly Pay
Tota
l In
com
e
a. What is the y-intercept of the graph? What quantity does this intercept represent? Explain why there is no x-intercept on the graph.
b. What is the slope of the graph? What rate does the slope represent?
c. Write the equation for the graphed line in slope-intercept form.
d. Suppose the store increased the commission to 5% but decreased the weekly salary to $100. How would this change affect the graph? Write the equation for these new conditions.
13 The financial department of a production firm presented the graph shown at the right of the production costs for a certain item. The graph shows the fixed costs—the costs for tooling and overhead that are required to produce even one item—and the variable costs—the costs due to materials, labor, marketing, transportation, and so on.
a. Identify the slope and y-intercept of the graph for total production cost.
b. How are these (slope and y-intercept) related to the fixed costs and the variable costs?
0 5 10 15 20
20181614121086420
Hundred Units Produced
Fixed and Variable Costs
Variable Costs
Fixed Costs$1,0
00 o
f Pr
od
uct
Co
st
Math Applications 261

14 Research indicates thatblood flow through the kidneys decreases with age, as shown in this simplified graph of experimental findings.
a. Would you say that the changing blood flow shows a linear relationship, or close to it? If not, could you say that it was linear for some ages?
b. A computer analysis of these data reported the following equation for relative blood flow.
F 1.18A 141
A is the age in years, from 35 to 85 years.
Evaluate the equation for several ages to see if it agrees with the graphed data. (Round your answers to the nearest whole number before comparing to the graph.)
15 A “stress test” is a method of evaluating the health of a patient’s cardiovascular system. In this test, a technician monitors the patient’s pulse rate during an exercise session on a treadmill or stationary bicycle. A patient’s pulse rate is not allowed to exceed a maximum rate. The maximum rate is based on the patient’s age, from the following graph.
a. What is the y-intercept of the graph?
b. What is the slope of the graph?
c. Write an equation for the graphed line in slope-intercept form.
d. Use your equation to find the maximum heart rate in a stress test for a 44-year-old patient.
SW7216/Cord AlgebraFigure 5.81.TA
00
100
80
60
40
20
20 30 40 50 60 70 80 90
Age – Years
Flo
w (
% N
orm
al F
low
)
0 20 40 60 80 100
190
180
170
160
150
140
130
120
110
100
Age (yr)
Maximum Heart Rate
Hea
rt R
ate
(Bea
ts p
er m
in)
262 Chapter 4 Linear Equations

16 Weight loss occurs when more calories are expended in physical activity than are consumed in the daily diet. When 3,500 calories more are used in physical activity than are consumed in the diet, about 1 pound of fat is lost. The following graph shows the weight loss versus calories expended in physical activity that can be expected by a 5 foot 6 inch,132-pound woman who consumes a 2,400-calorie daily diet. (Her weight remains stable with the 2,400-calorie daily diet and normal activity.)
0 200 400 600 800 1,000 1,2000.0
0.4
0.8
1.2
1.6
2.0
2.4
Daily Calories Used (cal)
Wee
kly
Wei
gh
t Lo
ss (
lb)
a. What is the slope of the line?
b. What is the equation of the line?
c. How much weight will the woman lose each week if her physical activity uses 350 calories per day?
d. If the woman decreases her dietary calories from 2,400 calories to 2,150 calories per day, how will this affect the graphed line? What is the equation for the new line? How is this line related to the original line?
17 A pickle recipe requires
What is the slope of the line? 0.002
What is the equation of the line? W 0.002C
How much weight will the woman lose each week if her exercise uses 350calories per day? 0.7 pounds
If the woman decreases her dietary calories from 2400 calories to 2150calories per day, how will this affect the graphed line? What is the equation forthe new line? How is this line related to the original line? W 0.002c 0.5; parallel
A pickle recipe requires 34 ounce of salt per pound of cucumbers.
34oz
34oz
Write an equation in slope-intercept form that shows the relationshipbetween the pounds of cucumbers and the ounces of salt. S
34C
How much salt do you need to pickle 1 ton of cucumbers? Remember that1 ton 2000 pounds. 1500 ounces
How many pounds of cucumbers can you pickle with 100 pounds of salt?Remember that 1 pound 16 ounces. 2133
13 pounds
Cynthia is considering the cost of satellite television service. Dish Starcharges $150 for the equipment and the cost of installation. In addition tothis, the monthly rate is $37.50 for 125 channels.
58
57
56
1 lb
+ =
4 oz3
55
54
53
52
0 200 400 600 800 1000 12000.0
0.4
0.8
1.2
1.6
2.0
2.4
Daily Exercise Calories Used (cal)
Wee
kly
Wei
gh
t Lo
ss (
lb)
Math Applications 273
Family andConsumerScience
ounce of salt per pound of cucumbers.
1 lb
� �
4 oz3
a. Write an equation in slope-intercept form that shows the relationship between the pounds of cucumbers and the ounces of salt.
What is the slope of the line? 0.002
What is the equation of the line? W 0.002C
How much weight will the woman lose each week if her exercise uses 350calories per day? 0.7 pounds
If the woman decreases her dietary calories from 2400 calories to 2150calories per day, how will this affect the graphed line? What is the equation forthe new line? How is this line related to the original line? W 0.002c 0.5; parallel
A pickle recipe requires 34 ounce of salt per pound of cucumbers.
34oz
34oz
Write an equation in slope-intercept form that shows the relationshipbetween the pounds of cucumbers and the ounces of salt. S
34C
How much salt do you need to pickle 1 ton of cucumbers? Remember that1 ton 2000 pounds. 1500 ounces
How many pounds of cucumbers can you pickle with 100 pounds of salt?Remember that 1 pound 16 ounces. 2133
13 pounds
Cynthia is considering the cost of satellite television service. Dish Starcharges $150 for the equipment and the cost of installation. In addition tothis, the monthly rate is $37.50 for 125 channels.
58
57
56
1 lb
+ =
4 oz3
55
54
53
52
0 200 400 600 800 1000 12000.0
0.4
0.8
1.2
1.6
2.0
2.4
Daily Exercise Calories Used (cal)W
eekl
y W
eig
ht
Loss
(lb
)
Math Applications 273
Family andConsumerScience
b. How much salt do you need to pickle 1 ton of cucumbers? Remember that 1 ton 2,000 pounds.
c. How many pounds of cucumbers can you pickle with 100 pounds of salt? Remember that 1 pound 16 ounces.
Math Applications 263

18 Cynthia is considering the cost of satellite television service. There is a charge of $150 for the equipment and installation. In addition to this, the monthly rate is $37.50 for 125 channels.
a. Write a linear function that describes the total cost, C, of the satellite service after using it for m months.
b. Cynthia thinks that she will keep the satellite service for at least 2 years. What is a suitable window that she can use in her graphing calculator to examine the cost function during this period?
c. Graph the linear cost function on a calculator using the window from part b. Use the trace feature to find the total cost of the satellite service after 2 years. Verify your answer by substituting m 24 into the linear equation and simplifying.
d. There is also the option of leasing the satellite equipment with no up front charges for installation. The monthly rate for 125 channels includes an additional lease fee of $7.50. How are the slope and y-intercept different from the linear function in part a?
e. Graph the two linear cost functions. If Cynthia will keep the service for at least 2 years, should she buy or lease the equipment?
19 When you use a thermocouple to measure the temperature at a location, you must convert a voltage reading from the thermocouple into a temperature. You recorded the following voltages from a voltmeter and the corresponding temperatures from a thermometer.
a. Graph the data. Based on your graph, is the relationship between temperature and thermocouple voltage a linear one? Explain your answer.
b. Find the slope and y-intercept of the data using the table. Write a formula for a line, in slope-intercept form, that will describe the relationship between the two variables T and V. This is the calibration equation for the thermocouple.
c. How can you use this equation for temperature measurements?
d. What is the meaning of the y-intercept? What is the meaning of the x-intercept? What rate does the slope represent?
Temperature (°C)
Voltage (mV)
0 0.00100 6.32200 13.42300 21.03400 28.94500 37.00600 45.09
264 Chapter 4 Linear Equations

20 You have a standard assembly used toconstruct large exhaust fans for industrial warehouse facilities. The assembly is designed so that the motor pulley and the fan pulley are 28 inches apart. A small adjustment is available for belt tension. The motor pulley has a diameter of 3 inches. Based on the required fan speed and fan size, you can vary the size of the fan pulley. To help you determine the belt sizes, you have the formula
B 2L 1.625(D d ).
B is the length of the belt needed.L is the distance between the two pulley centers.D is the diameter of one pulley.d is the diameter of the other pulley.
a. Substitute the known values given above into the formula and rewrite the formula as a linear equation in slope-intercept form. Identify the variables, the coefficient, and the constant. In linear equations, what are other names for the coefficient and the constant?
b. Try your equation for fan pulley diameters of 6 inches and 10 inches. Check your results with the original formula.
21 You can use a flow test to determine if a radiator is clogged. In a flow test, you measure the volume of water that flows through a radiator by gravity in a measured time period. Automotive manufacturers establish the standards for these tests. If less water than the standard flows through a radiator, it is clogged. One company’s standard is 42.5 gallons per minute.
a. Write an equation in slope-intercept form that shows the relationship between the time in seconds and the volume in gallons measured by the flow test.
b. Use the equation to calculate the water that should flow through a radiator that is not clogged in 20 seconds.
c. Use the equation to calculate the time needed for a radiator that is not clogged to fill a 5 gallon bucket.
d. Suppose you test a radiator and measure a flow of 25 gallons of water in 40 seconds. Should you consider the radiator clogged?
SW7216/Cord AlgebraFigure 5.87.A
Fan Pulley
Motor Pulley
Belt
Math Applications 265