1 Comnet 2010 - Recitation 2 - Sockets Communication Networks Recitation 2.
Upload
phamkhuongCategory
view
218download
2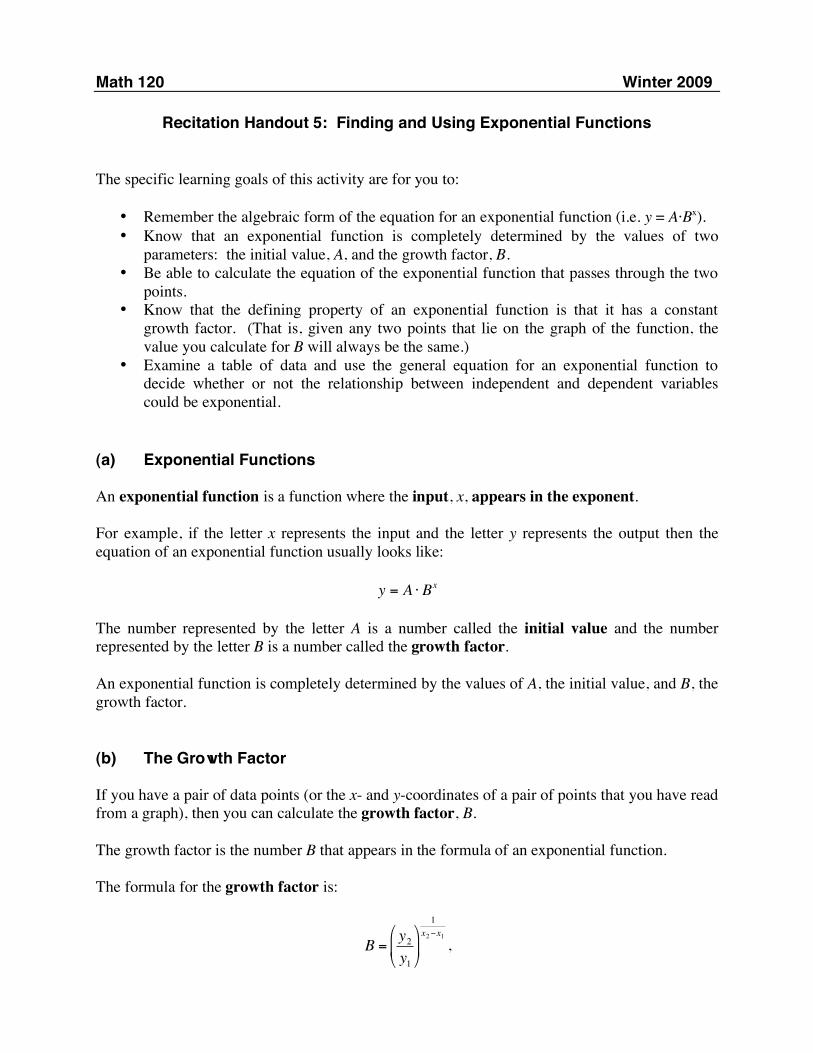
Math 120 Winter 2009
Recitation Handout 5: Finding and Using Exponential Functions The specific learning goals of this activity are for you to:
• Remember the algebraic form of the equation for an exponential function (i.e. y = A⋅Bx). • Know that an exponential function is completely determined by the values of two
parameters: the initial value, A, and the growth factor, B. • Be able to calculate the equation of the exponential function that passes through the two
points. • Know that the defining property of an exponential function is that it has a constant
growth factor. (That is, given any two points that lie on the graph of the function, the value you calculate for B will always be the same.)
• Examine a table of data and use the general equation for an exponential function to decide whether or not the relationship between independent and dependent variables could be exponential.
(a) Exponential Functions An exponential function is a function where the input, x, appears in the exponent. For example, if the letter x represents the input and the letter y represents the output then the equation of an exponential function usually looks like:
!
y = A " Bx
The number represented by the letter A is a number called the initial value and the number represented by the letter B is a number called the growth factor. An exponential function is completely determined by the values of A, the initial value, and B, the growth factor. (b) The Growth Factor If you have a pair of data points (or the x- and y-coordinates of a pair of points that you have read from a graph), then you can calculate the growth factor, B. The growth factor is the number B that appears in the formula of an exponential function. The formula for the growth factor is:
!
B =y2
y1
"
# $
%
& '
1
x2(x
1
,

where (x1, y1) and (x2, y2) are the x- and y-coordinates of the two points. (c) Great Moments in American Literature
In the novel “Catch 22” by Joespeh Heller, the reader is introduced to a character named Major Major. (Major Major is an officer in the army - naturally, his rank is major.) In Chapter 9, Major Major’s father is introduced. “Major Major’s father was a sober God-fearing man whose idea of a good joke was to lie about his age. He was a long-limbed farmer, a God-fearing, freedom-loving, law-abiding rugged individualist who held that federal aid to anybody but farmers was creeping socialism. He advocated thrift and hard work and disapproved of loose women who turned him down. His specialty was alfalfa, and he made a good thing out of not growing any. The government paid him well for every bushel of alfalfa he did not grow. The more alfalfa he did not grow, the more money the government paid him, and he spent every penny he didn’t earn on new land to increase the amount of alfalfa he did not produce. Major Major’s father worked without rest at not growing alfalfa. On long winter evenings he remained indoors and did not mend harness, and he sprang out of bed at the crack of noon every day just to make certain that the chores would not
be done. He invested in land wisely and soon was not growing more alfalfa than any other man in the county. Neighbors sought him out for advice on all subjects, for he had made much money and was therefore wise. “As ye sow, so shall ye reap,” he counseled one and all, and everyone said, ‘Amen.’”
To get an idea of how quickly exponential functions can grown, we will make the very modest assumptions that Major Major’s father starts with an average sized farm for 1910 of 139 acres1, and that the government pays him enough to increase the amount of land that he has by 8% each year. 1. Use the information given above to complete the table below. Year
1910 1911 1912 1913
Acres
139
1 Source: US Bureau of the Census. Statistical History of the United States.

2. Use the entries from your table to calculate the growth factor for the size of the farm. 3. We assumed that the size of the farm grew by 8% each year. How this reflected in the
value of the growth factor? 4. Suppose the farm grew by r% per year (where r is a positive number). What do you
think the value of the growth factor, B would be? 5. Find an equation that will give the size of Major Major’s father’s farm (in acres) after
Major Major’s father has been paid not to grow alfalfa for x years. 6. In 1996, Congress repealed price guarantees on most major crops. The government
payments that Major Major’s father depended on were included in this action. Assuming that the farm continued to grow at 8% per year from 1910 to 1996, how large was the farm when Congress stopped paying the farmer not to grow alfalfa?

(d) Biological Invaders The brown Treesnake (Bioga irreularis) is a fairly large, semi-venomous snake native to Australia, Papua New Guinea and Indonesia. In approximately 1952, the snakes were accidentally introduced to the Pacific island of Guam. Since 1952, the snakes’ numbers have increased considerably. Seven of Guam’s known native birds are now completely extinct and two more survive only in captivity2. Predation by Treesnakes is the most important factor in this extinction.
7. The population density of the brown Treesnake on Guam was been estimated at 0.01
snakes per square mile in 1952. According to a study conducted in 19923, the snake population grew by 28% each year thereafter. Estimate the number of snakes per square mile on Guam this year (2009).
If you are skeptical of your answer, compare it to the official USGS estimate available at:
http://www.fort.usgs.gov/resources/education/bts/bioeco/btsnake.asp The brown tree snake is not directly dangerous to humans, and is rarely seen by humans on Guam. The chief problem snake-related problem for humans on Guam is electrical blackouts, caused when the snakes climb electrical poles. The snake poses a serious ecological threat to the indigenous animals and birds of other Pacific islands, notably Hawaii. 2 The Micronesian Kingfisher and Guam rail survive at the National Zoo in Washington, DC. 3 Source: Rodda, G.H., T.H. fritts and P.J. Conry. 1992. Origin and population growth of the brown tree snake, Boiga irregularis, on Guam. Pacific Science, 46: 46-57.

(e) Perfectly and Approximately Exponential Data A table of data or graph is called perfectly exponential if you get the same number for the growth factor, B, no matter which points you use to calculate it. If a table of data or a graph is close to being perfectly exponential, then the relationship defined by the table or graph will be very well approximated by an exponential function with a formula resembling:
!
y = A " Bx .
(f) HIV/AIDS in the Former Soviet Union
The first epidemic of HIV/AIDS in a former Soviet state was reported in 1996 in the Baltic city of Kaliningrad. The epidemic was initially confined to male injection drug users (IDUs) and their sexual partners, but quickly spread to the city’s female sex workers, many of whom also used injection drugs and contracted HIV by sharing contaminated needles. As the epidemic has progressed, the HIV virus has spread into other populations, including women whose husbands consort with prostitutes, and infants born to HIV-positive mothers and workers accidentally exposed to HIV-infected drug paraphernalia or blood products.
“KALININGRAD, RUSSIA – The young man sitting before the psychiatrist stared darkly at the wall and bit his lip to keep from crying. He had answered a dozen questions about his sexual habits and absorbed in silence a lecture about how AIDS would change his life. ‘Aleksei, everything now is up to you,’ the psychiatrist, Oleg Petrosuk, told him gently. ‘If you take care of yourself you can live a long time. I know how hard this is, but you have to believe me: nothing ends here.’ As if in answer, Alexsei stripped to the waist. He has three tattoos, but the one that draws the eye covers his left shoulder. It is a skull engulfed in huge batwings. Above the wings two English words have been burned into his skin: ‘No Future.’”4
In the four years following this initial outbreak, HIV/AIDS was spread (predominantly through sharing of contaminated needles and contaminated drugs) to 82 of the 89 cities in the Russian Federation5. In this part of the recitation, the letter x will always represent the number of years since 1990. 4 This excerpt is quoted directly from: Specter, M. 1997. At a western outpost of Russia, AIDS spreads like a forest fire. The New York Times, November 4, 1997. 5 Source: Stephenson, J. 2000. HIV/AIDS surging in Eastern Europe. Journal of the American Medical Association, 284: 3113-3114.
A young toddler is examined for signs of HIV/
AIDS at a clinic near Moscow. The child’s
mother was HIV-positive and there is a sig-
nificant chance that the infant may also be
infected.
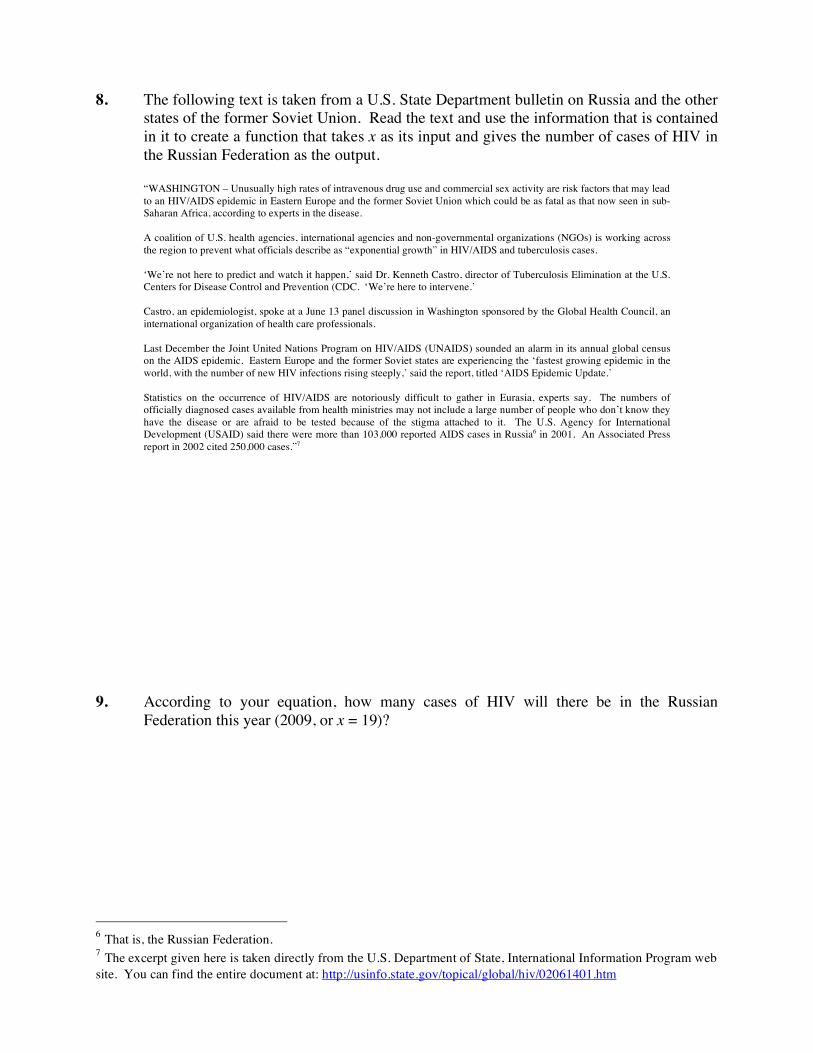
8. The following text is taken from a U.S. State Department bulletin on Russia and the other
states of the former Soviet Union. Read the text and use the information that is contained in it to create a function that takes x as its input and gives the number of cases of HIV in the Russian Federation as the output.
“WASHINGTON – Unusually high rates of intravenous drug use and commercial sex activity are risk factors that may lead to an HIV/AIDS epidemic in Eastern Europe and the former Soviet Union which could be as fatal as that now seen in sub-Saharan Africa, according to experts in the disease. A coalition of U.S. health agencies, international agencies and non-governmental organizations (NGOs) is working across the region to prevent what officials describe as “exponential growth” in HIV/AIDS and tuberculosis cases. ‘We’re not here to predict and watch it happen,’ said Dr. Kenneth Castro, director of Tuberculosis Elimination at the U.S. Centers for Disease Control and Prevention (CDC. ‘We’re here to intervene.’ Castro, an epidemiologist, spoke at a June 13 panel discussion in Washington sponsored by the Global Health Council, an international organization of health care professionals. Last December the Joint United Nations Program on HIV/AIDS (UNAIDS) sounded an alarm in its annual global census on the AIDS epidemic. Eastern Europe and the former Soviet states are experiencing the ‘fastest growing epidemic in the world, with the number of new HIV infections rising steeply,’ said the report, titled ‘AIDS Epidemic Update.’ Statistics on the occurrence of HIV/AIDS are notoriously difficult to gather in Eurasia, experts say. The numbers of officially diagnosed cases available from health ministries may not include a large number of people who don’t know they have the disease or are afraid to be tested because of the stigma attached to it. The U.S. Agency for International Development (USAID) said there were more than 103,000 reported AIDS cases in Russia6 in 2001. An Associated Press report in 2002 cited 250,000 cases.”7
9. According to your equation, how many cases of HIV will there be in the Russian
Federation this year (2009, or x = 19)?
6 That is, the Russian Federation. 7 The excerpt given here is taken directly from the U.S. Department of State, International Information Program web site. You can find the entire document at: http://usinfo.state.gov/topical/global/hiv/02061401.htm
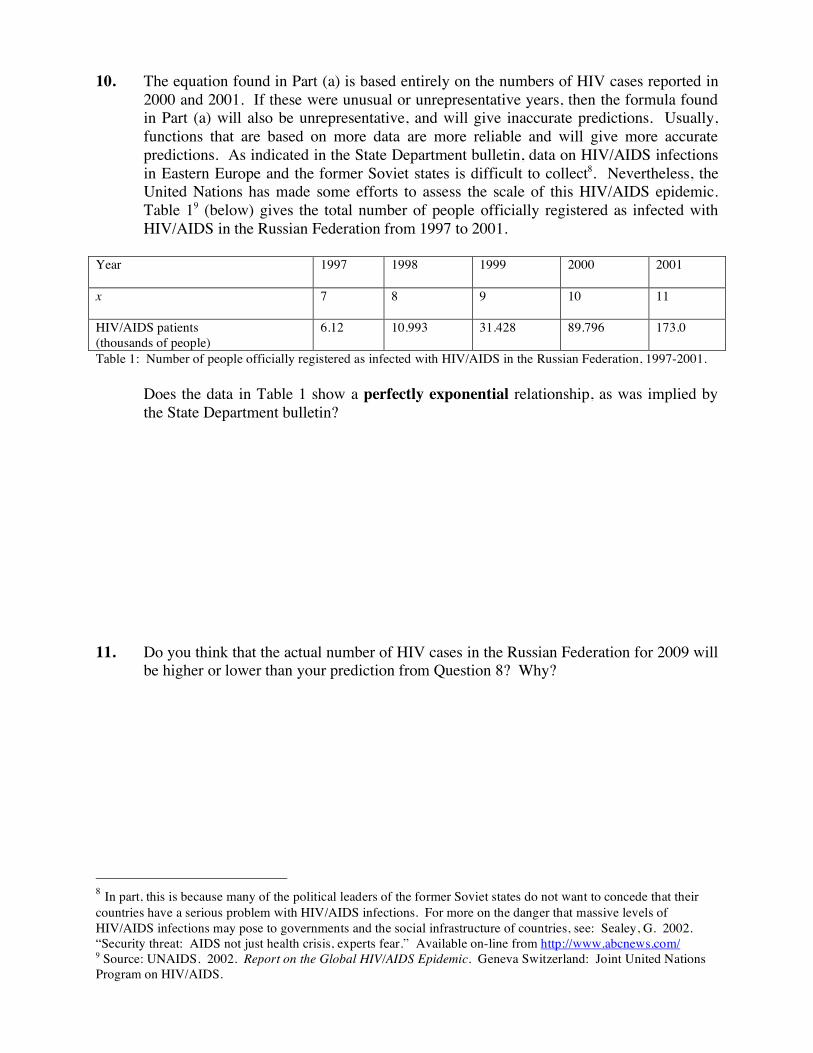
10. The equation found in Part (a) is based entirely on the numbers of HIV cases reported in 2000 and 2001. If these were unusual or unrepresentative years, then the formula found in Part (a) will also be unrepresentative, and will give inaccurate predictions. Usually, functions that are based on more data are more reliable and will give more accurate predictions. As indicated in the State Department bulletin, data on HIV/AIDS infections in Eastern Europe and the former Soviet states is difficult to collect8. Nevertheless, the United Nations has made some efforts to assess the scale of this HIV/AIDS epidemic. Table 19 (below) gives the total number of people officially registered as infected with HIV/AIDS in the Russian Federation from 1997 to 2001.
Year 1997
1998 1999 2000 2001
x 7
8 9 10 11
HIV/AIDS patients (thousands of people)
6.12 10.993 31.428 89.796 173.0
Table 1: Number of people officially registered as infected with HIV/AIDS in the Russian Federation, 1997-2001. Does the data in Table 1 show a perfectly exponential relationship, as was implied by
the State Department bulletin? 11. Do you think that the actual number of HIV cases in the Russian Federation for 2009 will
be higher or lower than your prediction from Question 8? Why?
8 In part, this is because many of the political leaders of the former Soviet states do not want to concede that their countries have a serious problem with HIV/AIDS infections. For more on the danger that massive levels of HIV/AIDS infections may pose to governments and the social infrastructure of countries, see: Sealey, G. 2002. “Security threat: AIDS not just health crisis, experts fear.” Available on-line from http://www.abcnews.com/ 9 Source: UNAIDS. 2002. Report on the Global HIV/AIDS Epidemic. Geneva Switzerland: Joint United Nations Program on HIV/AIDS.