Maternity: pregnancy, births and post-pregnancy -...
21
Maternity: pregnancy, births and post-pregnancy 1 Summary There were 15,238 births in Hampshire in 2011. Over the last decade Hampshire’s birth rate has gone up 13% from 13,320 in 2000, but childbearing among under 18 year olds is declining. Among the local authorities in Hampshire in 2011, Rushmoor had the highest birth rate (15.5 births per 1,000 women) and New Forest the lowest birth rate (9.1 births per 1,000 women). This reflects the younger age structure in Rushmoor and the older age structure in New Forest. There were an estimated 243,900 women of childbearing age (15-44 years) residing in Hampshire in 2011. Basingstoke and Deane (34,000), the New Forest (28,000) and Eastleigh (24,000) have the highest numbers of women of childbearing age. The total fertility rates (TFR) for 2011 give an average number of 1.99 children per woman in Hampshire, which is a decrease from 2.06 children per woman in 2010 but remains higher than the England value of 1.93. In all local authority areas the TFR is higher than the England value except in Fareham, Hart, the New Forest and Winchester. The General Fertility Rate (GFR) for Hampshire was 62.8 live births per thousand women aged 15–44, a decrease compared with 63.8 in 2010. Basingstoke and Deane had the highest GFR at 69.9 live births per thousand women aged 15-44, followed by Rushmoor (69.2) and Gosport (65.4). These three local authorities had GFRs higher than the England value. Babies born in Hampshire in 2011 were most likely to have a mother aged 25–34, with nearly two thirds of mothers (57%) in this age group. A further 22% of babies were each born to mothers aged under 25 and to mothers aged 35 and over. The birth rate among mothers aged 30–34 was the highest at 124.3 births per 1,000 women and was higher than the England rate of 112.2 births per 1,000 women. In 2011, 14.7% of births in Hampshire were to foreign born women, with 689 to women born in Asia and the Middle East and 852 to women born in EU 1 countries. Geographical variations show that Rushmoor, at 25.9%, had the highest proportion of births to foreign born women, slightly higher than the national rate (25.5%), followed by Basingstoke and Deane (18.9%) and Hart (17.1%), with Havant at 7.8% having the lowest proportion of births to foreign born women. Only 2.9% of all women giving birth in Hampshire gave birth at home. Nationally the homebirth rate was 2.5%. The highest rates of home births were in Test Valley (6.8%) and Winchester (4.9%). Havant reported the lowest home birth rate at 2.1%. The latest ONS Interim 2011-based birth projections (2013 to 2021) for Hampshire suggest that the previous rise in births may be starting to level off. The projections follow the general trend for England and the South East. Population projections of the numbers of childbearing women (15-44) across Hampshire’s local authorities suggest that in general they will remain fairly stable. General fertility rate (GFR) projections for Hampshire show an ongoing increase till about 2015, followed by a decline. Rushmoor and Gosport will continue to experience high GFRs and Havant may have a sustained increase over a longer period. More women in Hampshire accessed maternity services early in their pregnancy in 2011, enabling better outcomes reaching 99.6% by the end of that year. Although there are no data on the Hampshire prevalence of maternal obesity, the South Central Strategic Health Authority (SHA) at 5.66% had the second highest overall rate of women with a BMI ≥35 at any point during pregnancy. This incurs increasing risk for both mother and baby. 1 EU country of birth groupings represent the European Union as constituted in 2009. It includes the New EU countries - Estonia, Latvia, Lithuania, Czech Republic, Hungary, Poland, Romania, Slovakia, Malta, Bulgaria, Cyprus (EU), Cyprus (not otherwise stated), Slovenia, Czechoslovakia not otherwise stated
Transcript of Maternity: pregnancy, births and post-pregnancy -...

Maternity: pregnancy, births and post-pregnancy
1
Summary
There were 15,238 births in Hampshire in 2011. Over the last decade Hampshire’s birth rate has gone up 13% from 13,320 in 2000, but childbearing among under 18 year olds is declining.
Among the local authorities in Hampshire in 2011, Rushmoor had the highest birth rate (15.5 births per 1,000 women) and New Forest the lowest birth rate (9.1 births per 1,000 women). This reflects the younger age structure in Rushmoor and the older age structure in New Forest.
There were an estimated 243,900 women of childbearing age (15-44 years) residing in Hampshire in 2011. Basingstoke and Deane (34,000), the New Forest (28,000) and Eastleigh (24,000) have the highest numbers of women of childbearing age.
The total fertility rates (TFR) for 2011 give an average number of 1.99 children per woman in Hampshire, which is a decrease from 2.06 children per woman in 2010 but remains higher than the England value of 1.93. In all local authority areas the TFR is higher than the England value except in Fareham, Hart, the New Forest and Winchester. The General Fertility Rate (GFR) for Hampshire was 62.8 live births per thousand women aged 15–44, a decrease compared with 63.8 in 2010. Basingstoke and Deane had the highest GFR at 69.9 live births per thousand women aged 15-44, followed by Rushmoor (69.2) and Gosport (65.4). These three local authorities had GFRs higher than the England value.
Babies born in Hampshire in 2011 were most likely to have a mother aged 25–34, with nearly two thirds of mothers (57%) in this age group. A further 22% of babies were each born to mothers aged under 25 and to mothers aged 35 and over. The birth rate among mothers aged 30–34 was the highest at 124.3 births per 1,000 women and was higher than the England rate of 112.2 births per 1,000 women.
In 2011, 14.7% of births in Hampshire were to foreign born women, with 689 to women born in Asia and the Middle East and 852 to women born in EU1 countries. Geographical variations show that Rushmoor, at 25.9%, had the highest proportion of births to foreign born women, slightly higher than the national rate (25.5%), followed by Basingstoke and Deane (18.9%) and Hart (17.1%), with Havant at 7.8% having the lowest proportion of births to foreign born women.
Only 2.9% of all women giving birth in Hampshire gave birth at home. Nationally the homebirth rate was 2.5%. The highest rates of home births were in Test Valley (6.8%) and Winchester (4.9%). Havant reported the lowest home birth rate at 2.1%.
The latest ONS Interim 2011-based birth projections (2013 to 2021) for Hampshire suggest that the previous rise in births may be starting to level off. The projections follow the general trend for England and the South East.
Population projections of the numbers of childbearing women (15-44) across Hampshire’s local authorities suggest that in general they will remain fairly stable.
General fertility rate (GFR) projections for Hampshire show an ongoing increase till about 2015, followed by a decline. Rushmoor and Gosport will continue to experience high GFRs and Havant may have a sustained increase over a longer period.
More women in Hampshire accessed maternity services early in their pregnancy in 2011, enabling better outcomes reaching 99.6% by the end of that year.
Although there are no data on the Hampshire prevalence of maternal obesity, the South Central Strategic Health Authority (SHA) at 5.66% had the second highest overall rate of women with a BMI ≥35 at any point during pregnancy. This incurs increasing risk for both mother and baby.
1EU country of birth groupings represent the European Union as constituted in 2009. It includes the
New EU countries - Estonia, Latvia, Lithuania, Czech Republic, Hungary, Poland, Romania, Slovakia, Malta, Bulgaria, Cyprus (EU), Cyprus (not otherwise stated), Slovenia, Czechoslovakia not otherwise stated
Maternity: pregnancy, births and post-pregnancy
2
In 2011/12 caesarean sections accounted for 23.2% of all deliveries in Hampshire, of which 9.7% were planned procedures. The national caesarean section rate was 25.0%. Using 2009/10 – 2011/12 pooled data, the directly standardised caesarean section rate was 125/100,000 for planned procedures, and 199/100,000 for emergency procedures in Hampshire. For planned procedures the rate was the highest in Winchester, East Hampshire, Hart and Havant, and for emergency procedures, Havant, Gosport and Eastleigh. Havant had a high rate both for planned and emergency procedures. This is not reflective of the population need or in the best interests of women and their babies.
Recommendations
Focus on promoting the birth pathway through the ‘Normalising Birth programme’ using national resources such as the NHS Institute toolkit to help maternity services review and assess their current practice in promoting normal birth and reducing Caesarean section rates.
Further develop the integration of maternity services with pre-conceptual, health visiting and school nursing services, as well as primary care, specialist services and the voluntary sector, to improve outcomes across the life course.
Emphasise the contribution of both antenatal and postnatal care to long term health, as well as the actual birth event. This includes improving perinatal mental health pathways and services.
Ensure appropriate support for and focus on reducing, the increase in high risk pregnancies.
Address the low home birth rate in Hampshire.
Address and highlight the ten key recommendations in response to the findings in the Centre for Maternal and Child Enquiries (CMACE) report Maternal obesity in the UK: Findings from a national project.
Improve the intelligence to comprehensively describe demography, trends and maternity outcomes in Hampshire. Maternity data recording of country of origin needs to be available to inform commissioners.

Maternity: pregnancy, births and post-pregnancy
3
1. Introduction This chapter focuses on maternities in Hampshire and provides an overview of need at county and district level. 2. Level of need in the population 2.1 Number of maternities and births In 2011 in Hampshire there were 15,029 maternities, including 61 still births. This led to 15,238 live births which is the highest annual number of births over the past decade (an increase of 13%) (table 1). Table 1: Number of Hampshire births 2000 to 2011
No. of births
2000 2001 2002 2003 2004 2005 2006 2007 2008 2009 2010 2011
13,320 12,900 12,780 13,258 13,692 13,537 14,195 14,468 14,677 14,641 14,972 15,238
Source: Office for National Statistics (ONS)
The number of births varies considerably across the county with higher numbers in Basingstoke and Deane, the New Forest and Eastleigh, relative to other local authority areas in Hampshire. In Basingstoke and Deane there were 2,367 births in 2011, over 50% higher than the number of births in Hart (1,023), demonstrating how number of births reflects both the absolute size of a local population and it’s age structure. For example, Basingstoke and Deane (population 165,120) where the most births are seen, has a relatively young population, whilst Hart (population 91,189), has a much older population (table 2). 2.2 Stillbirths The 2009/11 still birth rate across Hampshire is presented in table 3 and figure 1. Fareham has a stillbirth rate that is higher than the national rate. Hart also has a relatively high rate which is just below the England figure.

Maternity: pregnancy, births and post-pregnancy
4
Table 2: Maternities and live births in Hampshire, 2011
Area of usual residence Maternities Maternity rate
Live births Crude live birth rate
Basingstoke and Deane 2,333 68.9 2,367 14.0
East Hampshire 1,162 58.9 1,180 10.2
Eastleigh 1,524 62.5 1,547 12.3
Fareham 1,099 56.7 1,109 9.9
Gosport 1,022 64.5 1,036 12.5
Hart 1,005 60.6 1,023 11.2
Havant 1,330 63.1 1,344 11.1
New Forest 1,581 56.8 1,604 9.1
Rushmoor 1,450 68.7 1,462 15.5
Test Valley 1,287 62.2 1,310 11.2
Winchester 1,236 56.0 1,256 10.8
Hampshire 15,029 61.9 15,238 11.5
England 680,565 63.5 688,120 13.0 Source: Office for National Statistics (ONS)
Rushmoor had the highest birth rate (15.5 births per 1,000 women) whilst the New Forest had the lowest birth rate (9.1 births per 1,000 women). This reflects the younger age structure of Rushmoor and the older age structure of the New Forest Table 3: Stillbirths, crude rate per 1,000 births, 2009-11
Local Authority Rate per 1,000 total births
95% Confidence interval Rate LL Rate UL
Basingstoke and Deane 4.2 2.3 6.9 East Hampshire 3.7 1.5 7.6 Eastleigh 4.0 1.9 7.4 Fareham 7.7 4.1 13.0 Gosport 2.5 0.7 6.2 Hart 5.0 2.2 9.7 Havant 4.0 1.8 7.7 New Forest 4.3 2.1 7.6 Rushmoor 4.0 1.8 7.5 Test Valley 2.6 0.9 5.9 Winchester 1.9 0.5 5.0 HAMPSHIRE 4.0 3.2 4.9 ENGLAND 5.2 5.0 5.3 Sources: ONS Annual Birth Extract and ONS LSOA mid-year population estimates. National Data: ONS Vital Statistics and ONS national mid-year population estimate
Maternity: pregnancy, births and post-pregnancy
5
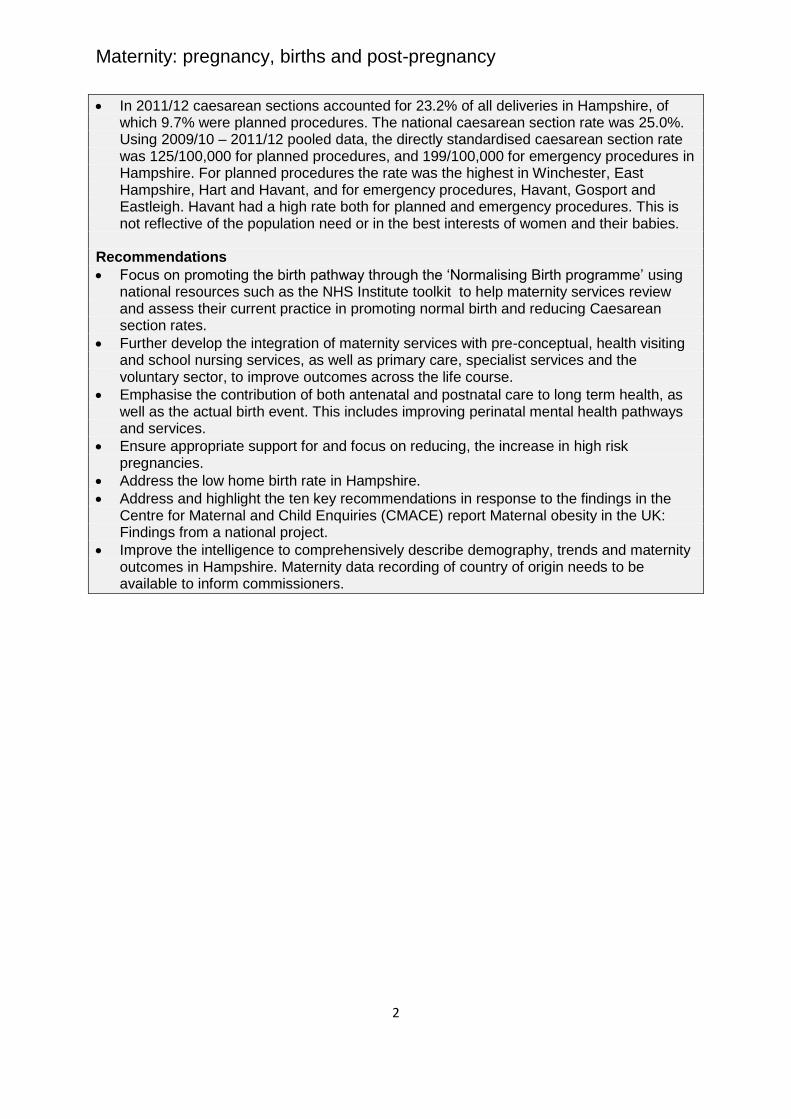
Figure 1: Still births in Hampshire by district, 2009-11
2.3 Population of childbearing women Table 4 shows the distribution of women of childbearing age across Hampshire. Basingstoke and Deane (34,000), the New Forest (28,000) and Eastleigh (24,000) have the highest numbers of women of childbearing age (15 to 44). Table 4: Proportion of childbearing women by Hampshire local authority area
Source: ONS 2008-based Subnational Population Projections
2.4 Age of childbearing
Having a child at either extreme of childbearing age presents a greater risk for the mother and their babies. Older mothers have a greater chance of co-morbidities such as diabetes, high blood pressure or other chronic diseases and increased likelihood of stillbirths and multiple births. Younger mothers tend to have risky health behaviours and late access to maternity care. Babies born in Hampshire in 2011 were most likely to have a mother aged 25–34, with about two thirds of mothers
District 2009 2010 2011
N (000s) % N (000s) % N (000s) %
Basingstoke and Deane 33 13.9 33 13.9 34 14.0
East Hampshire 19 8.0 18 7.6 20 8.1
Eastleigh 24 10.1 24 10.1 24 10.1
Fareham 19 8.0 19 8.0 19 8.0
Gosport 16 6.7 16 6.7 16 6.5
Hart 17 7.1 17 7.2 17 6.8
Havant 20 8.4 20 8.4 21 8.7
New Forest 28 11.8 28 11.8 28 11.5
Rushmoor 21 8.8 20 8.4 21 8.7
Test Valley 21 8.8 20 8.4 21 8.5
Winchester 21 8.8 21 8.9 22 9.1
Hampshire 237.8 100.
0
237.2 100.
0
242.7 100.0
SOUTH EAST 1,656 1,655 1,680
ENGLAND 10,530 10,521 10,725

Maternity: pregnancy, births and post-pregnancy
6
(57%) in this age group. A further 20% of babies were born to mothers aged under 25 and 22% to mothers aged 35 and over. The birth rate among mothers aged 30–34 was the highest at 124.3 births per 1,000 women, higher than the England rate of 112.2 births per 1,000 women. The age at which women have their children has been increasing for some time and many women now have children in their late 30s and early 40s. Hart had the highest birth rate for women aged 40-44 (15.8 births per 1,000 women), followed by East Hampshire (15.1 births per 1,000 women). Rushmoor and Eastleigh have the highest birth rates for women aged over 45 (1.1 and 1.0 births per 1,000 women) respectively. Childbearing among under 18 year olds is declining in Hampshire. New Forest and Winchester districts had the lowest birth rate for women aged under 18 (2.7 births per 1,000 women), while Gosport at 12.4 births per 1,000 women had the highest rate (tables 5 and 6). Information on teenage conceptions and maternities is covered in the chapter on Sexual health. 2.5 Fertility Fertility rates, along with the size and age structure of the female population affect the number of births. Total Fertility Rate (TFR): is the average number of live children a group of women would have, if they experienced the age-specific fertility rates of the year in question throughout their childbearing years. It provides an up-to-date measure of the current intensity of childbearing. Changes in timing of births may influence the TFR; for example if women are delaying childbearing to older ages the TFR may underestimate average family size. Increases in the numbers of foreign born women with high fertility rates may also influence the TFR. Fertility remains relatively stable in Hampshire compared to national figures (table 7). The fertility rate for 2011 give an average of 1.99 children per woman in Hampshire which is a decrease from 2.06 in 2010. Across Hampshire the TFR varies. In all local authority areas the TFR is higher than the England value (1.93) except in Fareham, Hart, the New Forest and Winchester. General Fertility Rate (GFR): is the number of live births per thousand women aged 15–44. This age range is considered to be a woman’s child-bearing years. The General Fertility Rate (GFR) for Hampshire in 2011 was 62.8 live births per thousand women aged 15–44, a slight decrease from 63.8 in 2010. Basingstoke and Deane had the highest GFR at 69.9 live births per thousand women aged 15-44, followed by Rushmoor (69.2) and Gosport (65.4). These three local authorities had GFRs higher than the England value.

Maternity: pregnancy, births and post-pregnancy
7
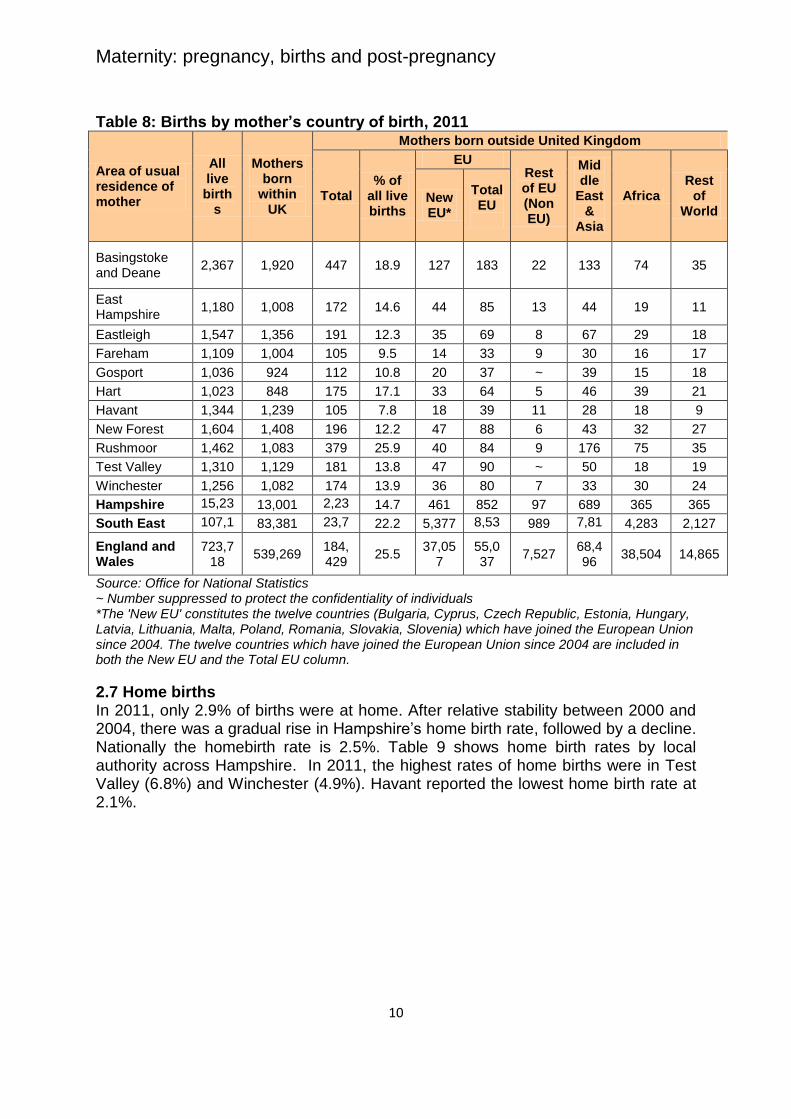
2.6 Births by mother’s country of birth The childbearing picture for 2011 among women resident in Hampshire based on their country of birth is presented in table 8 with 14.7% of births to foreign born women. The number of births to women born in Asia and the Middle East was 689. Women born in EU2 countries, however, made a greater contribution to the total number of Hampshire births in 2011 (852 births). Table 5: Maternal age at birth in Hampshire, numbers, 2011
Area of usual residence
Age of mother at birth
Under 18
Under 20
20-24 25-29 30-34 35-39 40-44 45+ All ages
Basingstoke and Deane
27 101 344 612 779 453 73 5 2,367
East Hampshire 19 46 157 272 400 232 69 * 1,180
Eastleigh 21 65 245 415 484 267 66 5 1,547
Fareham 10 36 163 286 364 207 50 * 1,109
Gosport 19 75 244 308 255 126 28 - 1,036
Hart 13 25 102 202 387 245 59 * 1,023
Havant 23 86 303 411 322 166 * * 1,344
New Forest 8 57 269 413 482 291 89 * 1,604
Rushmoor 15 54 292 448 417 199 48 * 1,462
Test Valley 12 58 210 336 403 252 * * 1,310
Winchester 6 36 151 268 428 312 * * 1,256
Hampshire 173 639 2,480 3,971 4,721 2,750 645 32 15,238
England 8,946 34,025 126,842 190,244 197,987 110,791 26,456 1,775 688,120
Source: Office for National Statistics (ONS) * Denotes disclosure controlled to protect the confidentiality of individuals - Denotes nil
2EU country of birth groupings represent the European Union as constituted in 2009. It includes the
New EU countries - Estonia, Latvia, Lithuania, Czech Republic, Hungary, Poland, Romania, Slovakia, Malta, Bulgaria, Cyprus (EU), Cyprus (not otherwise stated), Slovenia, Czechoslovakia not otherwise stated
Maternity: pregnancy, births and post-pregnancy
8
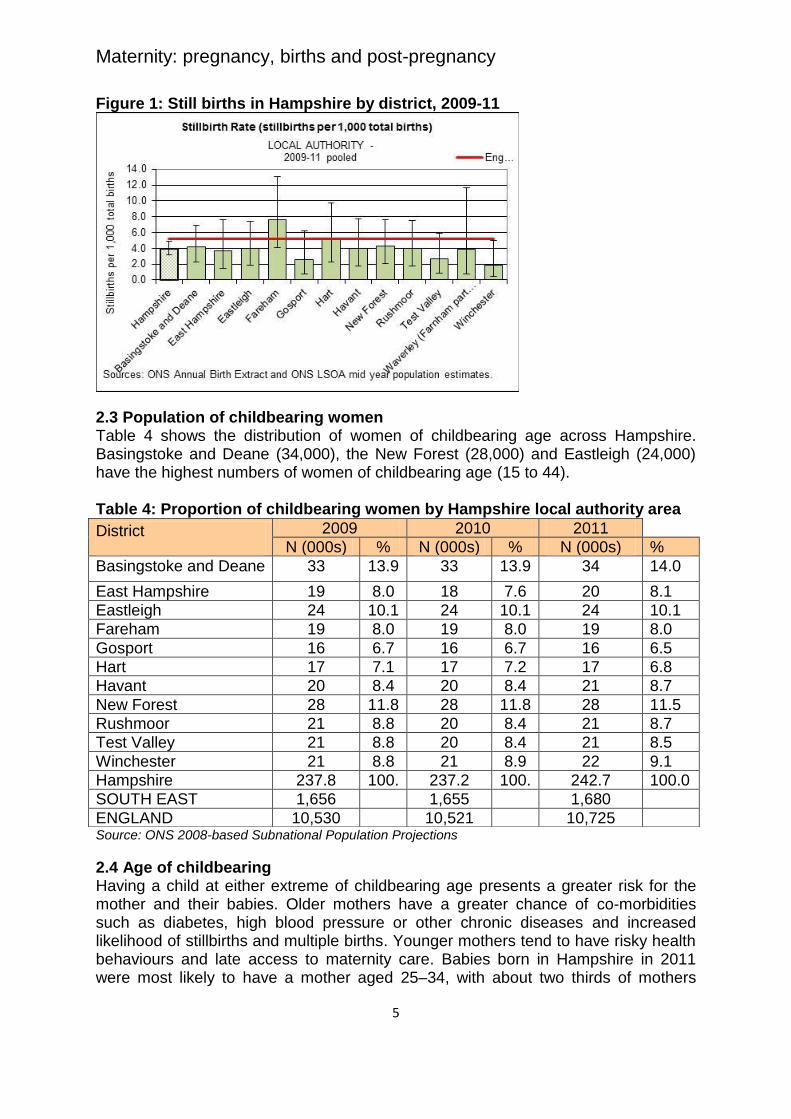
Table 6: Maternal age at birth in Hampshire - rates/1000 women, 2011
Area of usual residence
Age of mother at birth
Under 18
Under 20
20-24
25-29
30-34
35-39
40-44
45+ All ages
Basingstoke and Deane 9.0 21.3 78.0 106.1 133.3 72.5 10.7 0.7 69.9
East Hampshire 8.1 12.7 61.0 111.4 136.8 64.5 15.1 0.8 59.8
Eastleigh 9.0 17.6 67.1 112.0 117.3 59.9 13.9 1.0 63.4
Fareham 5.0 11.0 61.6 104.5 133.8 58.0 11.2 0.6 57.2
Gosport 12.4 29.9 99.8 116.5 103.6 45.8 9.2 - 65.4
Hart 8.0 10.0 52.4 92.4 141.7 70.0 15.8 0.8 61.6
Havant 10.1 23.2 89.8 128.4 108.1 48.9 * * 63.7
New Forest 2.7 11.8 67.7 107.5 119.2 57.1 14.7 0.4 57.6
Rushmoor 8.3 18.3 91.2 121.5 110.6 52.9 12.8 1.1 69.2
Test Valley 5.3 16.5 76.2 123.6 128.3 63.0 * * 63.3
Winchester 2.7 9.2 37.0 94.6 131.8 82.0 * * 56.9
Hampshire 7.1 16.3 70.8 111.0 124.3 62.2 12.8 0.6 62.8
England 9.4 21.0 71.2 103.9 112.2 62.7 13.5 0.9 64.2
Source: Office for National Statistics (ONS) * Denotes disclosure controlled to protect the confidentiality of individuals - Denotes nil
Rushmoor had the highest proportion of births to foreign born women (25.9%), against a national rate of 25.5%. This was followed by Basingstoke and Deane (18.9%) and Hart (17.1%); with Havant at 7.8% having the lowest proportion of births to foreign born women. Rushmoor is the only local authority in Hampshire where births born to mothers born in Asia and the Middle East exceeded those to mothers whose country of origin was in the EU, possibly reflecting the 2009 Home Office arrangements on Gurkha3 settlement in the UK. The increasing number of births to women born in the EU does not necessarily imply that they have higher fertility than UK born women; it may be that there are more of these women living in Hampshire/ UK than previously. A common misconception is that areas with high proportions of births to foreign born mothers tend to have the
3 Gurkhas are Nepalese soldiers in the British Army

Maternity: pregnancy, births and post-pregnancy
9
highest fertility rates. However, there is no clear cut relationship between the proportion of births to foreign born mothers and the level of fertility in an area. We do not currently have robust routine data to be able to ascertain whether there are differences in the fertility levels of UK born and foreign born women at local authority level. Table 7: Fertility rates in Hampshire, 2011
Area of usual residence GFR4 TFR5
Basingstoke and Deane 69.9 2.11
East Hampshire 59.8 2.01
Eastleigh 63.4 1.94
Fareham 57.2 1.90
Gosport 65.4 2.02
Hart 61.6 1.92
Havant 63.7 2.05
New Forest 57.6 1.89
Rushmoor 69.2 2.04
Test Valley 63.3 2.09
Winchester 56.9 1.85
Hampshire 62.8 1.99
England 64.2 1.93 Source: Office for National Statistics (ONS)
4 The General Fertility Rate (GFR) is the number of live births per 1,000 women aged 15–44. The
GFRs have been calculated using mid-2011 population estimates based on the 2011 Census. 5 The Total Fertility Rate (TFR) is the average number of live children that a group of women would
bear if they experienced the age-specific fertility rates of the calendar year in question throughout their childbearing lifespan.
Maternity: pregnancy, births and post-pregnancy
10
Table 8: Births by mother’s country of birth, 2011
Area of usual residence of mother
All live birth
s
Mothers born
within UK
Mothers born outside United Kingdom
Total % of
all live births
EU Rest of EU (Non EU)
Middle
East &
Asia
Africa Rest
of World
New EU*
Total EU
Basingstoke and Deane
2,367 1,920 447 18.9 127 183 22 133 74 35
East Hampshire
1,180 1,008 172 14.6 44 85 13 44 19 11
Eastleigh 1,547 1,356 191 12.3 35 69 8 67 29 18
Fareham 1,109 1,004 105 9.5 14 33 9 30 16 17
Gosport 1,036 924 112 10.8 20 37 ~ 39 15 18
Hart 1,023 848 175 17.1 33 64 5 46 39 21
Havant 1,344 1,239 105 7.8 18 39 11 28 18 9
New Forest 1,604 1,408 196 12.2 47 88 6 43 32 27
Rushmoor 1,462 1,083 379 25.9 40 84 9 176 75 35
Test Valley 1,310 1,129 181 13.8 47 90 ~ 50 18 19
Winchester 1,256 1,082 174 13.9 36 80 7 33 30 24
Hampshire 15,238
13,001 2,237
14.7 461 852 97 689 365 365
South East 107,132
83,381 23,749
22.2 5,377 8,535
989 7,815
4,283 2,127
England and Wales
723,718
539,269 184,429
25.5 37,05
7 55,037
7,527 68,496
38,504 14,865
Source: Office for National Statistics ~ Number suppressed to protect the confidentiality of individuals *The 'New EU' constitutes the twelve countries (Bulgaria, Cyprus, Czech Republic, Estonia, Hungary, Latvia, Lithuania, Malta, Poland, Romania, Slovakia, Slovenia) which have joined the European Union since 2004. The twelve countries which have joined the European Union since 2004 are included in both the New EU and the Total EU column.
2.7 Home births
In 2011, only 2.9% of births were at home. After relative stability between 2000 and 2004, there was a gradual rise in Hampshire’s home birth rate, followed by a decline. Nationally the homebirth rate is 2.5%. Table 9 shows home birth rates by local authority across Hampshire. In 2011, the highest rates of home births were in Test Valley (6.8%) and Winchester (4.9%). Havant reported the lowest home birth rate at 2.1%.

Maternity: pregnancy, births and post-pregnancy
11
Table 9: Percentage of home births by local authority area
District
Year
2000 2001 2002 2003 2004 2005 2006 2007 2008 2009 2010 2011
Basingstoke and Deane 1.8 1.6 2.2 2.1 2.4 2.6 3.9 2.7 2.9 3.3 3.1 2.5
East Hampshire 3.2 2.9 1.5 2.6 2.3 3.9 5.3 4.2 3.7 3.3 2.3 2.4
Eastleigh 3.3 4.7 3.9 4.1 5.2 5.9 5.0 4.5 5.8 4.7 3.5 3.1
Fareham 1.9 2.1 1.9 1.9 1.3 2.7 4.5 3.5 2.8 2.3 2.2 2.2
Gosport 2.3 1.7 2.4 2.5 1.7 3.1 2.0 2.2 2.8 1.9 1.8 2.3
Hart 3.4 3.0 3.2 2.3 3.3 3.6 2.9 3.4 3.5 4.2 2.7 3.4
Havant 2.7 2.9 2.3 1.8 2.6 3.4 5.2 4.4 3.8 2.9 2.5 2.1
New Forest 2.6 2.1 3.1 2.7 3.3 3.3 3.4 4.4 3.8 3.8 3.3 2.2
Rushmoor 2.3 2.2 2.3 2.6 2.1 2.3 2.2 3.2 3.2 3.2 3.6 3.0
Test Valley 2.2 1.4 2.6 2.8 2.3 3.1 2.5 3.6 4.4 4.6 5.1 6.8
Winchester 3.5 3.8 4.2 6.3 4.7 7.4 6.1 6.4 5.8 6.1 4.9 4.9
Hampshire 2.7 2.7 2.8 2.9 2.9 3.6 3.9 3.8 3.8 3.4 2.9 2.9
ENGLAND 2.1 2.0 2.1 2.2 2.2 2.5 2.7 2.8 2.8 2.7 2.4 2.5
Source: BirthChoiceUK
2.8 Maternal mortality A maternal death is defined as ‘the death of a woman while pregnant or within 42 days of termination of pregnancy, from any cause related to or aggravated by the pregnancy or its management, but not from accidental or incidental causes”. They are very rare and were documented at a UK level on a triennial basis by the CMACE6, replaced by Mothers and Babies - Reducing Risk through Audits and Confidential Enquiries across the UK (MBRRACE-UK) since January 2013. The findings of the 2006-08 triennium report showed the dramatic reduction in maternal mortality in the UK over the past 60 years. The current 3-year rolling average UK maternal mortality rate is 11.39/100,000 pregnancies. The women who died over this period tended to be older and more obese, had lifestyles which put them at risk of poorer health and were more socially disadvantaged when compared with the general pregnant population. There appeared to be a growing proportion of mothers with more medically complex pregnancies. In Hampshire there were less than five maternal deaths between 2007 and 2009, so no valid statistical conclusion can be drawn from these small numbers. Maternal deaths are investigated thoroughly at a local level and recommendations made to ensure safe clinical practice and improved organisation of services following the learning that comes from these incidents.
6 Centre for Maternal and Child Enquiries (CMACE) Confidential Enquiries into Maternal Deaths in
the United Kingdom -Saving Mothers’ Lives

Maternity: pregnancy, births and post-pregnancy
12
3. Projected service use and outcome in 3-5 years and 5-10 years 3.1 Birth projections for Hampshire Knowing how the number of births is likely to change in the future helps to plan health service access, supported by appropriate access to education. The ONS Interim 2011-based birth projections (2013 to 2021) for Hampshire suggest that the previous rise in births may be starting to level off. It is hard to predict what future birth numbers will be due to changing fertility rates and the size and age structure of the female population. Although the projections account for some of the new housing developments, these can only be estimates. Birth projections in Hampshire follow the general trend for England and the South East but suggest greater fluctuation due to the smaller numbers. Figure 2 illustrates birth projections for Hampshire alongside those for England and the South East of England. Figure 2: Birth projections for Hampshire from 2013 to 2021
Source: ONS Interim 2011-based Subnational Population Projections
3.2 Birth projections by local authority At a district level there is even greater uncertainty in any birth projections due to the smaller geographical areas and populations. However projections suggest that the number of births in most local authority areas will remain fairly stable in the coming years (figure 3).

Maternity: pregnancy, births and post-pregnancy
13
Figure 3 – Predicted number of births to Hampshire mothers, 2012 to 2021
Source: ONS Interim 2011-based Subnational Population Projections
3.3 General Fertility Rate (GFR) projections
General fertility rate projections for Hampshire (figure 4) show an increase until about 2015, followed by a decline. Rushmoor and Gosport appear to continue to experience high GFRs, whereas the increasing GFR appears to be sustained over a relatively longer period in Havant. Figure 4: Predicted general fertility rates by local authority area, 2012 to 2021
50.0
55.0
60.0
65.0
70.0
75.0
80.0
85.0
90.0
rate
per
1000 f
em
ale
po
pu
lati
on
ag
ed
15
-44
Year
Birth rate projections by Hampshire Local Authority District
England South East Hampshire Basingstoke and Deane East Hampshire Eastleigh Fareham
Gosport Hart Havant New Forest Rushmoor Test Valley Winchester
Source: ONS Interim 2011-based Subnational Population Projections

Maternity: pregnancy, births and post-pregnancy
14
Changing birth rates are also influenced by migration. A recent HPA report7 on the health needs of migrants in the south east of England, highlights the important role migration plays in birth projections and challenges facing maternity and child health services. 85% of migrants are between 15-44 years. In Hampshire this may be attributed to the inward migration of foreign born women of reproductive age from EU countries and recent changes to immigration rights of Nepali Gurkhas. Women born outside the UK tend to have a higher TFR than UK born women. In 2011 the estimated TFR for foreign born women was 2.28 children per woman, compared with 1.89 for UK born women8. Looking to the future, the contribution of foreign born women to the numbers of births in Hampshire is not straightforward to assess, since assumptions need to be made about future levels of in-migration, out-migration and fertility. The impact of the economic environment on future fertility represents a further ‘unknown’. Theories on the direct impacts of economic recession on fertility are inconsistent. For example, some people may choose to delay childbearing or limit family size due to financial uncertainty. Conversely, others may choose to start or expand a family if they are unable to gain satisfactory employment. These impacts may vary by age and other characteristics9. 3.4 Population projections of childbearing women Population projections of the numbers of childbearing women (15-44) in Hampshire’s local authority areas suggest that in general they will remain fairly stable (figure 5).
7 Health Protection Agency, Department of Health. Understanding the health needs of migrants in the
South East region: A Report by the South East Migrant Health Study Group on behalf of the Department of Health. Health Protection Agency, 2010 8 Source: Office for National Statistics, Birth registrations and Annual Population Survey, 2011 cited in
http://www.ons.gov.uk/ons/dcp171766_283876.pdf 9 www.ons.gov.uk ons rel vsob parents... fa -births-and-fertility.pdf

Maternity: pregnancy, births and post-pregnancy
15
Figure 5: Population projections of childbearing women in Hampshire, 2011 – 2021
Source: ONS Interim 2011-based Subnational Population Projections 4. Current services in relation to need
4.1 Maternity services Maternity services are provided by acute hospitals to care for women from when they become pregnant to around 10 days after the birth when the midwife hands care over to the health visitor. It is important to note maternity services differ from many other healthcare services in England as their aim is to keep healthy women well and prevent avoidable problems to mother and fetus/baby. The components of maternity services are typically divided into the three stages of pregnancy: antenatal, intrapartum (birth) and post natal care. In addition, neonatal care can be seen as an extension of maternity care as the baby has not yet been discharged home (figure 6). 4.2 Maternity assessment In England, women should be able to access maternity services for a full health and social care assessment of needs, risks and choices by 12 completed weeks of their pregnancy. The assessment informs a personalised approach to maternity care to optimise the outcome of the pregnancy. Decreasing the proportion of women accessing maternity services late reduces health inequalities faced by vulnerable and socially excluded groups of women. Data for the percentage (over 97%) of pregnant women in Hampshire accessing maternity services within 12 weeks (table 9) compares well with the national figure of 70.5% (340,767). Migrants tend to feature as late presentations for 12-week bookings in maternity services (HPA Migrant Health Report).

Maternity: pregnancy, births and post-pregnancy
16
Figure 6: The maternity pathway in England
Source: Shaping the Future - A Sustainable Maternity Workforce for South Central. August 2010
Table 9: Access to Midwifery, 2011/12
Number (%) of women who have been seen by a
midwife or maternity health professional for health and social care assessment of
needs, risks and choices by 12 weeks and 6 days of
pregnancy
Number of women who have seen a midwife or a
maternity healthcare professional, for health and social care assessment of
needs, risks and choices at any time during pregnancy
Q1 - 2011/12 3506/ 3,596 (97.5%) 4065 Q2 - 2011/12 3532/ 3,821 (92.4%) 4114 Q3 - 2011/12 3372/ 3,760 (89.7%) 3932 Q4 - 2011/12 3651/ 3,664 (99.6%) 4171 Source: Department of Health: Unify2 data collection - IPMR
Older mothers, increasing numbers of obese women becoming pregnant, assisted conception leading to higher rates of multiple births and impacts on neonatal services, women with complex conditions needing extra care during pregnancy and childbirth, and increasing ethnic diversity, leading to communication and other social and clinical challenges all impact on maternity service delivery. 4.3 Smoking during pregnancy and at delivery Smoking while pregnant has significant detrimental health effects on both mother and baby. Adverse outcomes include increased risk of miscarriage, fetal growth restriction and perinatal death. The chapter on Lifestyles deals specifically with the issue of Smoking during pregnancy and at delivery.

Maternity: pregnancy, births and post-pregnancy
17
4.4 Maternal obesity Obesity at any time of life is a significant health risk; during pregnancy it carries significant additional risks for both mother and baby. There are no local data on the prevalence of maternal obesity in Hampshire. However, a Centre for Maternal and Child Enquiries (CMACE) study10 considered maternal obesity (BMI ≥35). The UK prevalence rate of women with a BMI ≥35 at any time during pregnancy is 4.99% - 1 in 20 pregnancies. The South Central Strategic Health Authority (SHA) at 5.66% had the second highest overall rate of women with a BMI ≥35 at any point during pregnancy. Key findings from the recent Centre for Maternal and Child Enquiries (CMACE) Maternal obesity in the UK review include:
Babies of women with a pregnancy BMI ≥35 have an increased risk of perinatal mortality compared with those of the general maternity population in the UK. Obese women are approximately twice as likely to have a stillborn baby as women with a healthy BMI.
Approximately 20% of the singleton babies were large for their gestational age (LGA), defined by weight ≥90th percentile for gestation, which is twice as high as expected in the general population of births. LGA babies were more common among each increasing BMI group, with one third of women with a BMI ≥50 having a LGA baby, compared to 16% born to women with a BMI 35-39.9.
While the effects of low birth weight are well known, the literature on the effects of high birth weight is sparse. With increasing obesity rates, high birth weight has become a potential concern and has been associated in the medical literature with an increased likelihood of becoming an overweight child, adolescent, and subsequently an obese adult.
Neonatal unit admissions (within 48 hours of birth) correlated directly with maternal BMI. Among babies born at term (37-42 weeks’ gestation), the neonatal unit admission rate was 4.2%, 5.9% and 9.9% for those born to mothers with a BMI 35-39.9, BMI 40-49.9 and BMI ≥50, respectively.
4.5 Perinatal mental health Postnatal depression (PND) is often unrecognised but at least one in ten new mothers experiences PND11. PND is usually assessed by health visitors, using the Edinburgh Postnatal Depression Scale questionnaire within the first two months after the birth. Prevalence of PND is difficult to assess. However, using the NICE benchmarking tool12 and 2011 births data, table 10 estimates number of women affected in Hampshire. Table 10: estimated number of women in Hampshire affected by postnatal depression and other birth-related mental disorders in 2011
Numbers of births 2011 15,238
Suffering depression in the postnatal period (10%) 1,524
Mental disorder requiring referral for psychological therapies (80 per 1,000 deliveries)
1,220
10
Centre for Maternal and Child Enquiries (CMACE). Maternal obesity in the UK: Findings from a national project. London: CMACE, 2010 11
Mind website - http://www.mind.org.uk/help/diagnoses_and_conditions/post-natal_depression 12
National Institute of Clinical Excellence Commissioning Guide for Antenatal and Postnatal Mental Health (2008)

Maternity: pregnancy, births and post-pregnancy
18
Mental disorder requiring referral to a specialist perinatal mental health service (40 per 1,000 deliveries)
610
Psychotic episode requiring in-patient admission (0.2%) 30
Non-psychotic depression requiring in-patient admission (0.2%) 30
Pre-existing serious mental illness complicating and affecting birth (0.2%) 30
4.6 Caesarean section rates In Hampshire the directly standardised caesarean section rate was 125/100,000 for planned procedures, and 199/100,000 for emergency procedures. For planned procedures the rate was the highest in Winchester, East Hampshire, Hart and Havant and for emergency procedures, Havant, Gosport and Eastleigh, had the highest rates (see figures 7 and 8). Figure 7: elective caesareans in Hampshire by district, 2009/10 to 2011/12
The caesarean section rate as a percentage of all deliveries for Hampshire is 23.2%, of which 9.7% were elective caesarean sections. The national caesarean section rate was higher at 25.0% in 2011/12. There is no agreed optimum rate. About 40% of caesarean sections are elective and planned and 60% are carried out as an emergency.

Maternity: pregnancy, births and post-pregnancy
19
Figure 8: emergency caesareans in Hampshire by district, 2009/10 to 2011/12
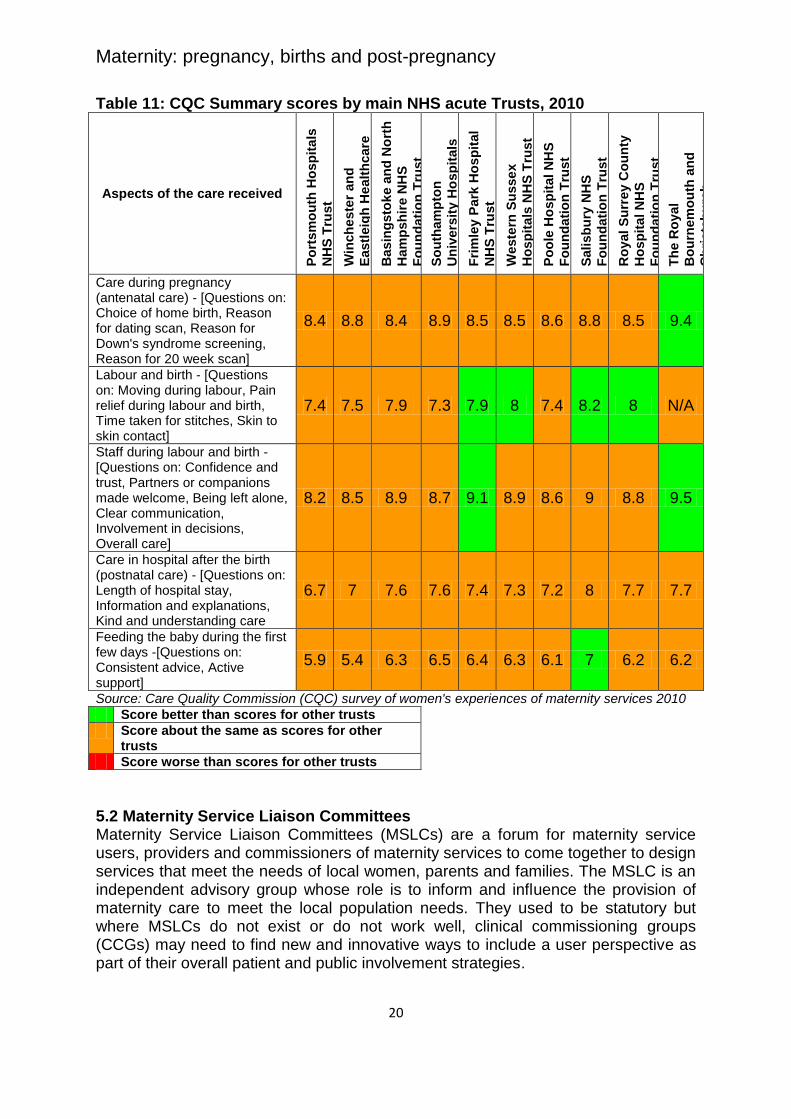
5. User and provider views 5.1 Women’s experiences of maternity care in England: Key findings from the 2010 NHS trust survey The 2010 Care Quality Commission (CQC) survey was conducted between April and August 2010, based on responses of women who gave birth in February 2010 and had recently used maternity services. It relates directly to care provided by the acute hospital trust. The survey covered different aspects of the care they received during their pregnancy, labour and birth and in the weeks following the birth. Each NHS acute trust received scores out of 10. A higher score is better. Results of each NHS acute trust from which Hampshire women access maternity services are detailed in table 11. Overall, women reported improvements in their care since the 2007 survey. However, the survey highlights the need for changes in postnatal care in particular support for breast feeding and the early detection of significant emotional or psychological changes experienced during the postnatal period.
Maternity: pregnancy, births and post-pregnancy
20
Table 11: CQC Summary scores by main NHS acute Trusts, 2010
Aspects of the care received
Po
rtsm
ou
th H
osp
ita
ls
NH
S T
rust
Win
ch
este
r an
d
Eastl
eig
h H
ealt
hcare
NH
S T
rust
Basin
gsto
ke a
nd
No
rth
Ham
psh
ire N
HS
Fo
un
dati
on
Tru
st
So
uth
am
pto
n
Un
ivers
ity H
osp
itals
NH
S T
rust
Fri
mle
y P
ark
Ho
sp
ital
NH
S T
rust
Weste
rn S
usse
x
Ho
sp
itals
NH
S T
rust
Po
ole
Ho
sp
ital N
HS
Fo
un
dati
on
Tru
st
Sali
sb
ury
NH
S
Fo
un
dati
on
Tru
st
Ro
yal
Su
rrey C
ou
nty
Ho
sp
ital N
HS
Fo
un
dati
on
Tru
st
Th
e R
oyal
Bo
urn
em
ou
th a
nd
Ch
ristc
hu
rch
Ho
sp
itals
NH
S
Fo
un
dati
on
Tru
st
Care during pregnancy (antenatal care) - [Questions on: Choice of home birth, Reason for dating scan, Reason for Down's syndrome screening, Reason for 20 week scan]
8.4 8.8 8.4 8.9 8.5 8.5 8.6 8.8 8.5 9.4
Labour and birth - [Questions on: Moving during labour, Pain relief during labour and birth, Time taken for stitches, Skin to skin contact]
7.4 7.5 7.9 7.3 7.9 8 7.4 8.2 8 N/A
Staff during labour and birth - [Questions on: Confidence and trust, Partners or companions made welcome, Being left alone, Clear communication, Involvement in decisions, Overall care]
8.2 8.5 8.9 8.7 9.1 8.9 8.6 9 8.8 9.5
Care in hospital after the birth (postnatal care) - [Questions on: Length of hospital stay, Information and explanations, Kind and understanding care
6.7 7 7.6 7.6 7.4 7.3 7.2 8 7.7 7.7
Feeding the baby during the first few days -[Questions on: Consistent advice, Active support]
5.9 5.4 6.3 6.5 6.4 6.3 6.1 7 6.2 6.2
Source: Care Quality Commission (CQC) survey of women's experiences of maternity services 2010
Score better than scores for other trusts
Score about the same as scores for other trusts
Score worse than scores for other trusts
5.2 Maternity Service Liaison Committees Maternity Service Liaison Committees (MSLCs) are a forum for maternity service users, providers and commissioners of maternity services to come together to design services that meet the needs of local women, parents and families. The MSLC is an independent advisory group whose role is to inform and influence the provision of maternity care to meet the local population needs. They used to be statutory but where MSLCs do not exist or do not work well, clinical commissioning groups (CCGs) may need to find new and innovative ways to include a user perspective as part of their overall patient and public involvement strategies.

Maternity: pregnancy, births and post-pregnancy
21
In Hampshire there are three local committees:
North Hampshire MSLC
West Hampshire MSLC
Portsmouth and South East Hampshire MSLC They also work together as a core Hampshire MSLC which meets three times a year. 6. Evidence of what works
National Institute for Health Research Service Delivery and Organisation (NIHR SDO) programme - ‘Birthplace in England’ research programme, 2011, 2012
NICE public health guidance 3 - Prevention of sexually transmitted infections and under 18 conceptions, 2007
NICE public health guidance 11 - Maternal and child nutrition, 2008
NICE public health guidance 26 - Quitting smoking in pregnancy and following childbirth, 2010
NICE guidance - Smoking cessation - acute, maternity and mental health services, in progress
NICE public health guidance 27 - Weight management before, during and after pregnancy, 2010
NICE clinical guideline 45 - Antenatal and postnatal mental health, 2007
NICE clinical guideline 62 - Antenatal care, 2008
NICE clinical guideline 110 - Pregnancy and complex social factors: A model for service provision for pregnant women with complex social factors, 2010
NICE quality standards 22 - Antenatal care, 2012
NICE guidance - Antenatal and postnatal mental health: clinical management and service, in progress
7. Recommendations
Focus on promoting the birth pathway through the ‘Normalising Birth programme’ using national resources such as the NHS Institute toolkit to help maternity services review and assess their current practice in promoting normal birth and reducing Caesarean section rates.
Further develop the integration of maternity services with pre-conceptual, health visiting and school nursing services, as well as primary care, specialist services and the voluntary sector, to improve outcomes across the life course.
Emphasise the contribution of both antenatal and postnatal care to long term health, as well as the actual birth event. This includes improving perinatal mental health pathways and services.
Ensure appropriate support for and focus on reducing, the increase in high risk pregnancies.
Address the low home birth rate in Hampshire.
Address and highlight the ten key recommendations in response to the findings in the Centre for Maternal and Child Enquiries (CMACE) report Maternal obesity in the UK: Findings from a national project.
Improve the intelligence to comprehensively describe demography, trends and maternity outcomes in Hampshire. Maternity data recording of country of origin needs to be available to inform future service commissioning.