Maternal Western diet during gestation and lactation ...
55
HAL Id: hal-01834088 https://hal-univ-rennes1.archives-ouvertes.fr/hal-01834088 Submitted on 3 Sep 2018 HAL is a multi-disciplinary open access archive for the deposit and dissemination of sci- entific research documents, whether they are pub- lished or not. The documents may come from teaching and research institutions in France or abroad, or from public or private research centers. L’archive ouverte pluridisciplinaire HAL, est destinée au dépôt et à la diffusion de documents scientifiques de niveau recherche, publiés ou non, émanant des établissements d’enseignement et de recherche français ou étrangers, des laboratoires publics ou privés. Maternal Western diet during gestation and lactation modifies adult offspring’s cognitive and hedonic brain processes, behavior, and metabolism in Yucatan minipigs Yentl Gautier, Isabelle Luneau, Nicolas Coquery, Paul Meurice, Charles-Henri Malbert, Sylvie Guerin, Bas Kemp, J Elizabeth Bolhuis, Caroline Clouard, Isabelle Le Huërou-Luron, et al. To cite this version: Yentl Gautier, Isabelle Luneau, Nicolas Coquery, Paul Meurice, Charles-Henri Malbert, et al.. Mater- nal Western diet during gestation and lactation modifies adult offspring’s cognitive and hedonic brain processes, behavior, and metabolism in Yucatan minipigs. FASEB Journal, Federation of American Society of Experimental Biology, 2018, 32 (12), pp.6478-6494. 10.1096/fj.201701541. hal-01834088
Transcript of Maternal Western diet during gestation and lactation ...
HAL Id: hal-01834088https://hal-univ-rennes1.archives-ouvertes.fr/hal-01834088
Submitted on 3 Sep 2018
HAL is a multi-disciplinary open accessarchive for the deposit and dissemination of sci-entific research documents, whether they are pub-lished or not. The documents may come fromteaching and research institutions in France orabroad, or from public or private research centers.
L’archive ouverte pluridisciplinaire HAL, estdestinée au dépôt et à la diffusion de documentsscientifiques de niveau recherche, publiés ou non,émanant des établissements d’enseignement et derecherche français ou étrangers, des laboratoirespublics ou privés.
Maternal Western diet during gestation and lactationmodifies adult offspring’s cognitive and hedonic brain
processes, behavior, and metabolism in Yucatan minipigsYentl Gautier, Isabelle Luneau, Nicolas Coquery, Paul Meurice, Charles-Henri
Malbert, Sylvie Guerin, Bas Kemp, J Elizabeth Bolhuis, Caroline Clouard,Isabelle Le Huërou-Luron, et al.
To cite this version:Yentl Gautier, Isabelle Luneau, Nicolas Coquery, Paul Meurice, Charles-Henri Malbert, et al.. Mater-nal Western diet during gestation and lactation modifies adult offspring’s cognitive and hedonic brainprocesses, behavior, and metabolism in Yucatan minipigs. FASEB Journal, Federation of AmericanSociety of Experimental Biology, 2018, 32 (12), pp.6478-6494. �10.1096/fj.201701541�. �hal-01834088�
1
A maternal Western diet during gestation and lactation modifies adult offspring’s 1cognitive and hedonic brain processes, behavior and metabolism in Yucatan minipigs 2 3Yentl Gautier1, Isabelle Luneau1, Nicolas Coquery1, Paul Meurice1, Charles-Henri 4Malbert2, Sylvie Guerin1, Bas Kemp3, J. Elizabeth Bolhuis3, Caroline Clouard3, Isabelle 5Le Huërou-Luron1, Sophie Blat1, David Val-Laillet1* 6 71 INRA, INSERM, Univ Rennes, Nutrition Metabolisms and Cancer, NuMeCan, Rennes 8Saint-Gilles, France 92 INRA, US1395 AniScan, Saint-Gilles, France 103 Wageningen University & Research, Department of Animal Sciences, Adaptation 11Physiology Group, Wageningen, The Netherlands 12 13 14*Correspondence: David Val-Laillet, INRA UMR1341 NuMeCan, 35590 Saint-Gilles, France [email protected] 16 17 18 19
20 21 22
2
Abbreviations list 23 24AIRi: Incremental Acute Insulin Response 25APFC: Anterior Prefrontal Cortex 26AUC: Area Under Curve 27AUCG: Incremental AUC of Glucose 28AUCG0-30: AUCG from 0 to 30 minutes after IV glucose injection 29AUCI: Incremental AUC of Insulin 30AUCI0-30: AUCI from 0 to 30 minutes after IV glucose injection 31BDNFα: Brain Derived Neurotropic Factor 32CAU: Caudate nucleus 33Chol: Cholesterol 34CNS: Central Nervous System 35DA: Dopamine 36DAT: Dopamine Transporter 37DID'IT: Metaprogramme "Diet Impact and Determinants: interaction and Transition" 38DOHaD: Developmental Origins of Health and Diseases 39DA: Dopamine 40EtCO2: End Tildal CO2 (maximal CO2 concentration at the exhalation end, measured by 41capnometry) 42FDG: Fluro-Deoxy-Glucose (18FDG: 18Fluor radioelement binding to glucose) 43FDR: False Discovery Rate 44FFA: Free Fatty Acid 45FOV: Field Of View 46FWE: Family Wise Error 47FWHM: Full With a Half Maximum (Kernel FWHM) 48Gb: Basal (fasting) glucose level 49GLP1: Glucagon-like peptide 1 50Hapto: Haptoglobin 51HFF: High-Fat high-Fructose 52HFS: High-Fat high-Sucrose 53Ib: basal (fasting) insulin level 54I-Ioflupane: Iode-Ioflupane (123I: Iode 123 radioelement) 55IVGTT: Intravenous Glucose Tolerance Test 56

3
KeV: Kilo-ElectronVolt 57KG: Glucose disappearance constant (%/min), glucose tolerance index 58LDL: Low Density Lipoprotein 59BW: Body Weight 60NAc: Nucleus accumbens 61P2: Insulin action parameter 62PFC: Prefrontal Cortex 63PR: Progressive Ratio 64PUT: Putamen 65PYY: Peptide YY 66QUICKY: Quantitative Insulin sensitivity Check Index 67RIA: Radioimmuno Assay 68RM: Reference Memory 69ROIs: Regions of Interest 70S2: Calculated index of insulin sensitivity 71SBFT: Subcutaneous BackFat Thickness 72SCFA: Short-Chain Fatty Acid 73SD: Animals born of sows fed with STD chow 74SG: Glucose Effectiveness, derived from the Minimal Model 75SI: Insulin Sensitivity, derived from the Minimal Model 76SPECT: Single Photon Emission Computed Tomography 77SPM: Statistical Parametric Mapping 78SVC: Small Volume Correction 79TG: Triglycerides 80Vd: Volume of distribution 81WM: Working Memory 82 83 84 85 86 87 88 89 90
4
Abstract 91
This study explores the long-term effects of exposure to a maternal Western diet (WD 92
vs. standard diet SD), in the Yucatan minipig, on the adult progeny at lean status (N=32), then 93
at overweight status. We investigated eating behavior, cognitive abilities, brain basal glucose 94
metabolism and dopamine transporter availability, microbiota activity, blood lipids and 95
glucose tolerance. Although both groups showed similar cognitive abilities in a holeboard 96
test, WD expressed a higher stress level than SD (immobility, P<0.05) and a lower 97
performance in an alley maze (P=0.06). WD showed lower dopamine transporter binding 98
potential in the hippocampus and parahippocampal cortex (P<0.05 for both), as well as a 99
trend in putamen (P=0.07), associated with lower basal brain activity in the prefrontal cortex 100
and nucleus accumbens (P<0.05) compared to lean SD. Lean WD displayed a lower glucose 101
tolerance than SD animals (higher glucose peak, P<0.05 and tendency to a higher AUCI0-30, 102
P<0.1). Both groups developed glucose intolerance with overweight, but WD animals were 103
less impacted than SD animals. These results demonstrate that maternal diet shaped 104
offspring’s brain functions and cognitive responses on the long term, even after being fed a 105
balanced diet from weaning, but behavioral effects were only revealed in WD under 106
anxiogenic situation. The WD animals seemed however to better cope with the obesogenic 107
diet from a metabolic standpoint. 108
109
Key words: perinatal programming, nutrition, neuro-ethology, physiology, pig 110
111
5
1. Introduction 112
The quality of early nutrition has long-term impacts on the offspring’s phenotype, a 113
phenomenon first described by Barker et al. (1989) as “fetal programming” (1,2). The 114
nutritional environment during critical developmental stages can thus modulate the later 115
individual susceptibility to diseases, with particular sensitivity of the nervous system in both 116
human and animal models (3). The maternal diet can therefore have long-term effects on the 117
offspring’s development (4), including metabolism (5), brain functions and behavior of 118
children. A maternal high-fat diet can result in altered metabolic and eating behavior 119
regulation due to higher proliferation of orexigenic neurons in rats (6). The same behavioral 120
and metabolic aspects are observed in children born from either obese or diabetic pregnant 121
women, revealing a developmental programming of obesity (7). As a matter of fact, a 122
maternal high-fat diet and / or post-natal over-nutrition can induce impairment of homeostatic 123
control via hypothalamic functions in rodent (6,8–10) and non-human primates (11). 124
Some studies reported a deleterious impact of a maternal high-fat diet on the brain, with 125
direct consequences on behavior and the onset of neurodevelopmental cognitive, affective and 126
eating disorders (12). However, recent studies showed contradictory results: on one hand, a 127
Western diet offered during late gestation and lactation to non-obese sows seemed to improve 128
the memory functions in the progeny after weaning (13,14), although an increased motivation 129
for the sweet and fatty food rewards during the cognitive tests could not be completely ruled 130
out. Histological analysis, however, revealed a smaller hippocampal granular cell layer and 131
decreased neurogenesis in WD piglets. On the other hand, numerous studies showed that 132
maternal high-fat diet-induced obesity can impair cognition in rodent (15–18) and that obese 133
and post-obese people (people who have experience a weight loss after obesity) have an 134
altered posterior hippocampal function, linked to altered prefrontal activity (19). 135
6
Long-term consequences of an early hypercaloric diet on dopamine transporter (DAT) 136
availability and dopamine (DA)-mediated behaviors (food choice and motivation) have also 137
been described. South and Huang (20) demonstrated that a high-fat diet exposure decreased 138
DAT density in the caudate-putamen. Interestingly, another study exploring a maternal high-139
fat diet effect on DA response to amphetamine (AMP) in the offspring showed altered 140
regulation of DA transport in NAc (21,22). It was also shown that obese people presented 141
lower density of DA receptor in striatum (23), associated with lower brain activity in 142
prefrontal regions known to be involved in the inhibitory control of food intake, in humans 143
and animal models (24,25). 144
As described before, most studies focused on maternal obesity and/or long-term 145
exposure to Western diet on the offspring. The originality of the current study lies in the fact 146
that neither sows nor progeny were obese (until the obesogenic challenge at the adult age), 147
and the offspring was exposed to a balanced standard diet from weaning to the testing period 148
at the adult age. Moreover, several studies assessed the effect of a high-fat diet, but not a 149
high-fat and high-fructose/sucrose diet, that better represents human life conditions. Fructose 150
is well known to present deleterious effect on health with an addictive potential (26–28). The 151
pig model was chosen because of its potential to fill the gap between preclinical studies with 152
rodents and clinical trials in humans. As a matter of fact, pigs are monogastric omnivorous, 153
and their digestive characteristics are closer to those of humans than those of rodent and non-154
human primate models (29), including at early stages of life. In addition, they possess, like 155
humans, a large gyrencephalic brain (vs. lissencephalic brain in rodent), which facilitates 156
investigation via cerebral imaging. Furthermore, pigs show brain development closer to 157
humans than rats or monkeys: brain develops perinatally in pigs and humans, while it 158
develops post-natally in rats and prenatally in guinea-pigs and monkeys (30,31). Many other 159
reasons for the choice of the pig as a model exist and are fully described in literature 160
7
(31,34,35). We hypothesized that a maternal high-fat and high-fructose diet during gestation 161
and lactation would alter cognitive abilities in relation to functional abnormalities in brain 162
areas involved in learning, reward and motivation, such as the hippocampus (33–35), 163
prefrontal cortex (24,36), and striatum (37,38). In consequence, we also hypothesized that 164
WD animals would have a higher motivation for sweet, accompanied by metabolic disorders 165
and modification of the gut microbiota activity, assessing here by quantification of SCFA 166
(39–41). 167
168
2. Materials and Methods 169
Experiments were conducted at the INRA St Gilles, France (January to April 2015), in 170
accordance with the current ethical standards of the European Community (Directive 171
2010/63/EU), Agreement No. C35-275-32and Authorization No. 35-88. The Regional Ethics 172
Committee in Animal Experiment of Brittany has validated and approved the entire procedure 173
described in this paper (project N°01299.01). 174
The present study is part of a longitudinal experiment where the progeny of sows fed a 175
standard (SD) or Western (high-fat high-fructose, WD) diet during gestation and lactation 176
were tested at 3 time periods during their life: 1) during the post-weaning stage, from 177
postnatal day (PND) 25 to 3-month-old piglets (14), 2) at the adult age on non-obese animals, 178
3) and after a 6-week obesogenic challenge with a high-fat and high-sucrose diet (Figure 1A). 179
180
Breeding conditions 181
Diets. Pregnant sows (N=17) were fed during the last eleven weeks of gestation and the 182
whole lactation (28 days) either a standard (N=8) or a Western diet (high-fat high-fructose 183
HFF N=9) (Val-Laillet et al., 2017). A standard balanced diet ration was provided to their 184
offspring from weaning to adulthood (10-14 months) (Tables 1a & b). The isocaloric ration 185
8
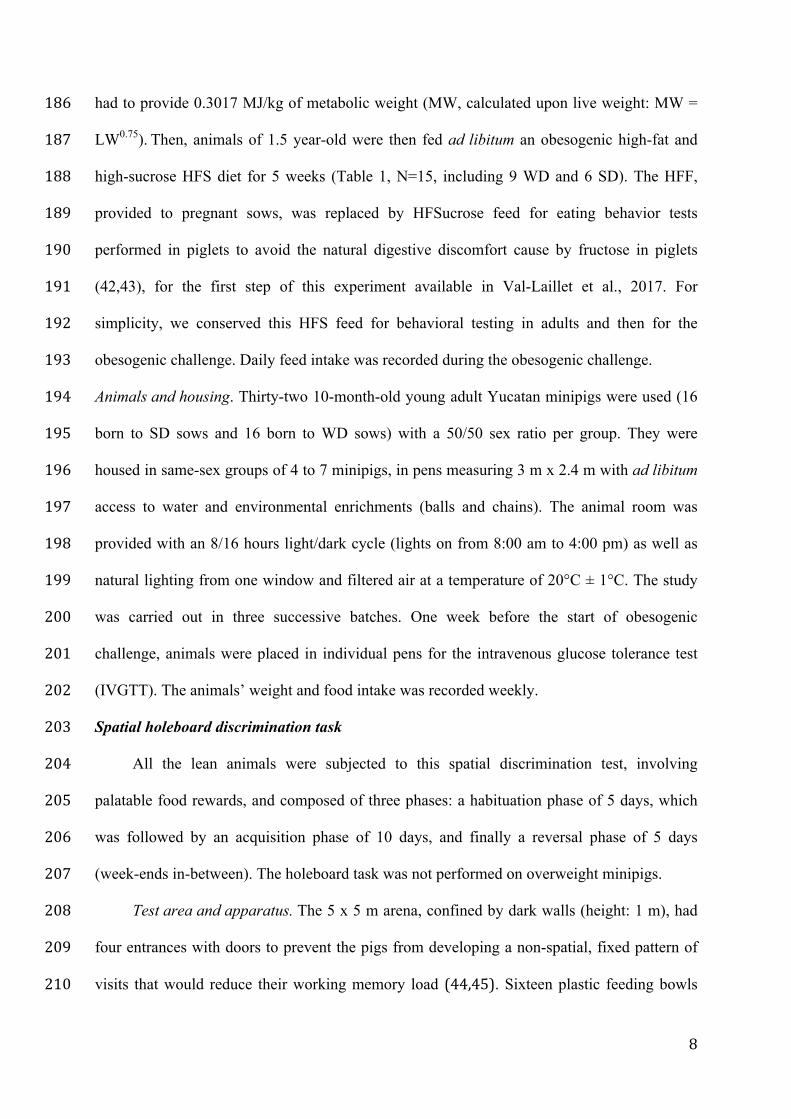
had to provide 0.3017 MJ/kg of metabolic weight (MW, calculated upon live weight: MW = 186
LW0.75). Then, animals of 1.5 year-old were then fed ad libitum an obesogenic high-fat and 187
high-sucrose HFS diet for 5 weeks (Table 1, N=15, including 9 WD and 6 SD). The HFF, 188
provided to pregnant sows, was replaced by HFSucrose feed for eating behavior tests 189
performed in piglets to avoid the natural digestive discomfort cause by fructose in piglets 190
(42,43), for the first step of this experiment available in Val-Laillet et al., 2017. For 191
simplicity, we conserved this HFS feed for behavioral testing in adults and then for the 192
obesogenic challenge. Daily feed intake was recorded during the obesogenic challenge. 193
Animals and housing. Thirty-two 10-month-old young adult Yucatan minipigs were used (16 194
born to SD sows and 16 born to WD sows) with a 50/50 sex ratio per group. They were 195
housed in same-sex groups of 4 to 7 minipigs, in pens measuring 3 m x 2.4 m with ad libitum 196
access to water and environmental enrichments (balls and chains). The animal room was 197
provided with an 8/16 hours light/dark cycle (lights on from 8:00 am to 4:00 pm) as well as 198
natural lighting from one window and filtered air at a temperature of 20°C ± 1°C. The study 199
was carried out in three successive batches. One week before the start of obesogenic 200
challenge, animals were placed in individual pens for the intravenous glucose tolerance test 201
(IVGTT). The animals’ weight and food intake was recorded weekly. 202
Spatial holeboard discrimination task 203
All the lean animals were subjected to this spatial discrimination test, involving 204
palatable food rewards, and composed of three phases: a habituation phase of 5 days, which 205
was followed by an acquisition phase of 10 days, and finally a reversal phase of 5 days 206
(week-ends in-between). The holeboard task was not performed on overweight minipigs. 207
Test area and apparatus. The 5 x 5 m arena, confined by dark walls (height: 1 m), had 208
four entrances with doors to prevent the pigs from developing a non-spatial, fixed pattern of 209
visits that would reduce their working memory load (44,45). Sixteen plastic feeding bowls 210
9
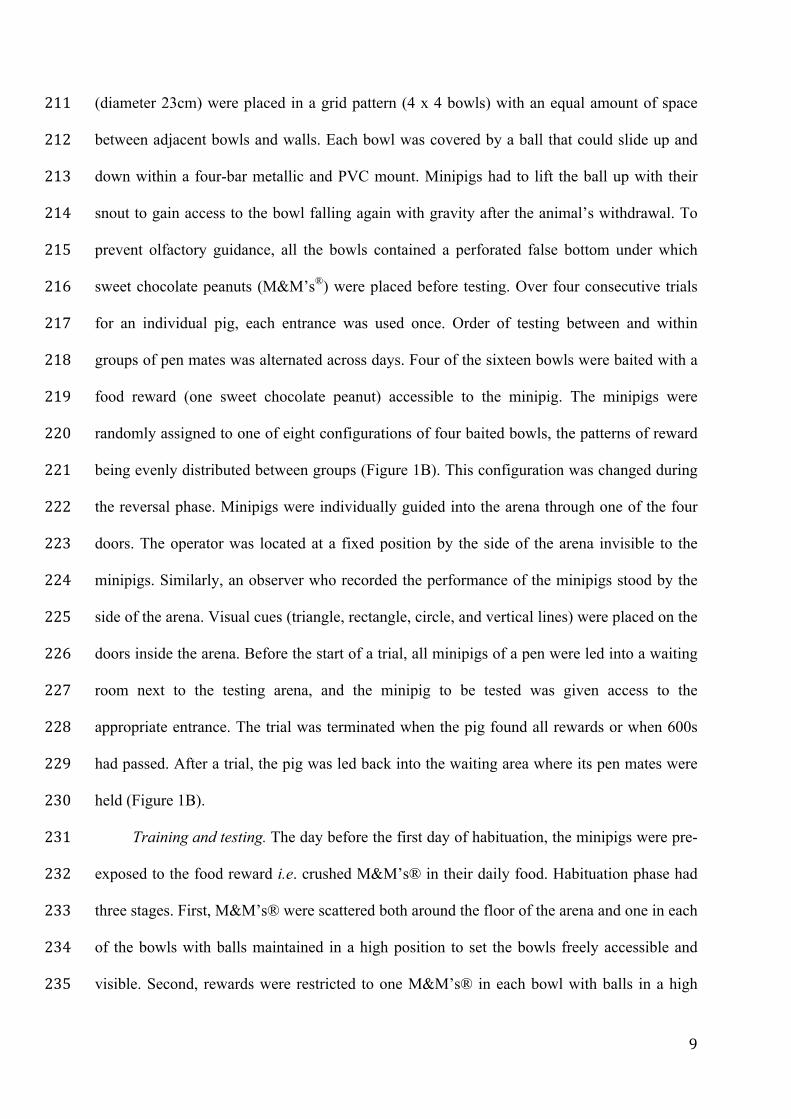
(diameter 23cm) were placed in a grid pattern (4 x 4 bowls) with an equal amount of space 211
between adjacent bowls and walls. Each bowl was covered by a ball that could slide up and 212
down within a four-bar metallic and PVC mount. Minipigs had to lift the ball up with their 213
snout to gain access to the bowl falling again with gravity after the animal’s withdrawal. To 214
prevent olfactory guidance, all the bowls contained a perforated false bottom under which 215
sweet chocolate peanuts (M&M’s®) were placed before testing. Over four consecutive trials 216
for an individual pig, each entrance was used once. Order of testing between and within 217
groups of pen mates was alternated across days. Four of the sixteen bowls were baited with a 218
food reward (one sweet chocolate peanut) accessible to the minipig. The minipigs were 219
randomly assigned to one of eight configurations of four baited bowls, the patterns of reward 220
being evenly distributed between groups (Figure 1B). This configuration was changed during 221
the reversal phase. Minipigs were individually guided into the arena through one of the four 222
doors. The operator was located at a fixed position by the side of the arena invisible to the 223
minipigs. Similarly, an observer who recorded the performance of the minipigs stood by the 224
side of the arena. Visual cues (triangle, rectangle, circle, and vertical lines) were placed on the 225
doors inside the arena. Before the start of a trial, all minipigs of a pen were led into a waiting 226
room next to the testing arena, and the minipig to be tested was given access to the 227
appropriate entrance. The trial was terminated when the pig found all rewards or when 600s 228
had passed. After a trial, the pig was led back into the waiting area where its pen mates were 229
held (Figure 1B). 230
Training and testing. The day before the first day of habituation, the minipigs were pre-231
exposed to the food reward i.e. crushed M&M’s® in their daily food. Habituation phase had 232
three stages. First, M&M’s® were scattered both around the floor of the arena and one in each 233
of the bowls with balls maintained in a high position to set the bowls freely accessible and 234
visible. Second, rewards were restricted to one M&M’s® in each bowl with balls in a high 235
10
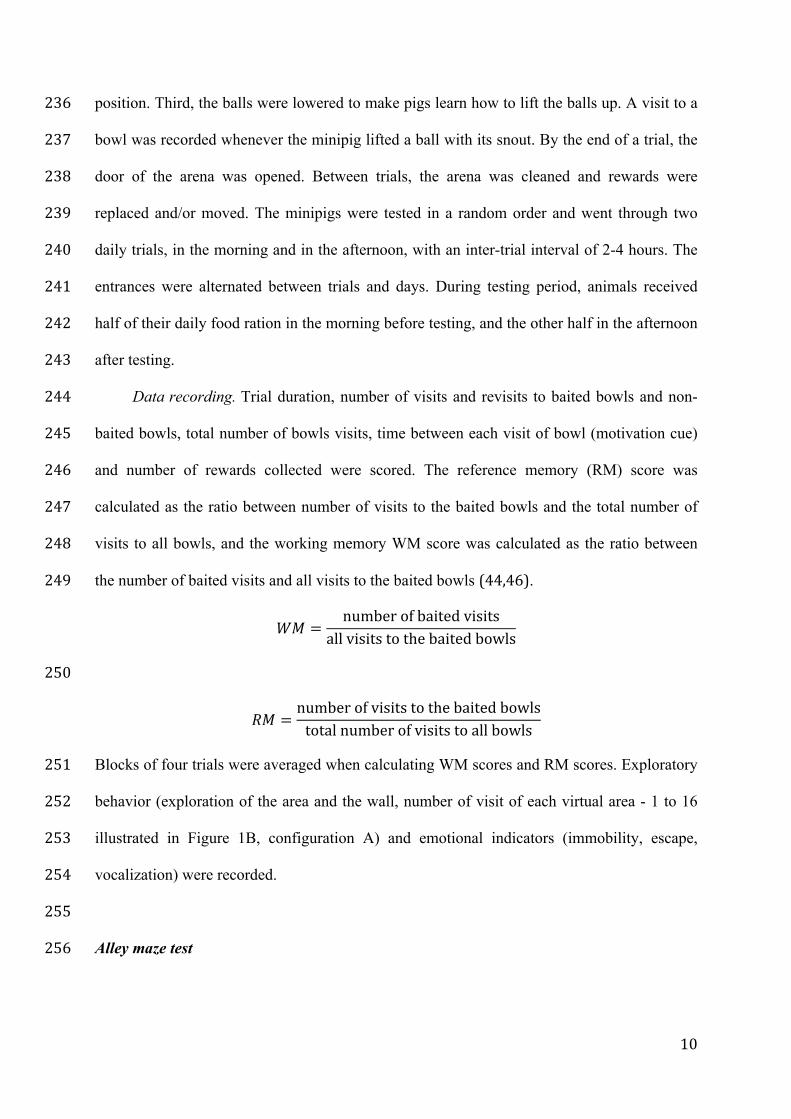
position. Third, the balls were lowered to make pigs learn how to lift the balls up. A visit to a 236
bowl was recorded whenever the minipig lifted a ball with its snout. By the end of a trial, the 237
door of the arena was opened. Between trials, the arena was cleaned and rewards were 238
replaced and/or moved. The minipigs were tested in a random order and went through two 239
daily trials, in the morning and in the afternoon, with an inter-trial interval of 2-4 hours. The 240
entrances were alternated between trials and days. During testing period, animals received 241
half of their daily food ration in the morning before testing, and the other half in the afternoon 242
after testing. 243
Data recording. Trial duration, number of visits and revisits to baited bowls and non-244
baited bowls, total number of bowls visits, time between each visit of bowl (motivation cue) 245
and number of rewards collected were scored. The reference memory (RM) score was 246
calculated as the ratio between number of visits to the baited bowls and the total number of 247
visits to all bowls, and the working memory WM score was calculated as the ratio between 248
the number of baited visits and all visits to the baited bowls (44,46). 249
!" = number of baited visitsall visits to the baited bowls
250
!" = number of visits to the baited bowlstotal number of visits to all bowls
Blocks of four trials were averaged when calculating WM scores and RM scores. Exploratory 251
behavior (exploration of the area and the wall, number of visit of each virtual area - 1 to 16 252
illustrated in Figure 1B, configuration A) and emotional indicators (immobility, escape, 253
vocalization) were recorded. 254
255
Alley maze test 256
11
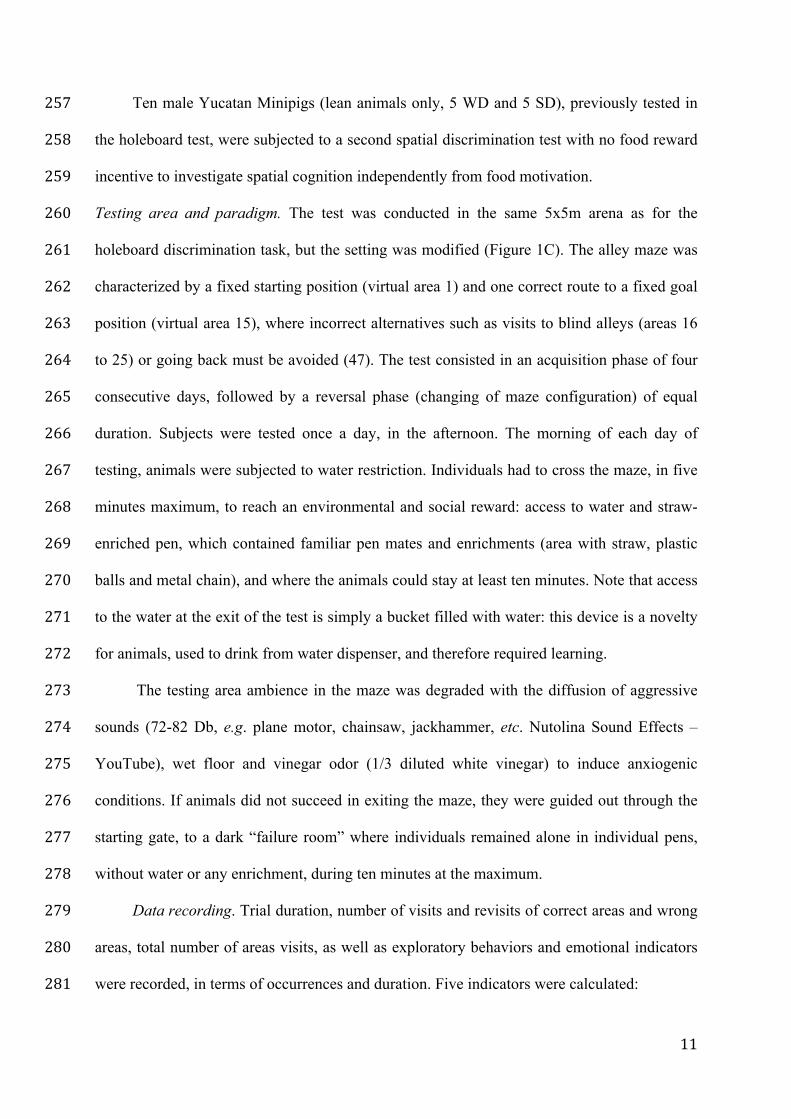
Ten male Yucatan Minipigs (lean animals only, 5 WD and 5 SD), previously tested in 257
the holeboard test, were subjected to a second spatial discrimination test with no food reward 258
incentive to investigate spatial cognition independently from food motivation. 259
Testing area and paradigm. The test was conducted in the same 5x5m arena as for the 260
holeboard discrimination task, but the setting was modified (Figure 1C). The alley maze was 261
characterized by a fixed starting position (virtual area 1) and one correct route to a fixed goal 262
position (virtual area 15), where incorrect alternatives such as visits to blind alleys (areas 16 263
to 25) or going back must be avoided (47). The test consisted in an acquisition phase of four 264
consecutive days, followed by a reversal phase (changing of maze configuration) of equal 265
duration. Subjects were tested once a day, in the afternoon. The morning of each day of 266
testing, animals were subjected to water restriction. Individuals had to cross the maze, in five 267
minutes maximum, to reach an environmental and social reward: access to water and straw-268
enriched pen, which contained familiar pen mates and enrichments (area with straw, plastic 269
balls and metal chain), and where the animals could stay at least ten minutes. Note that access 270
to the water at the exit of the test is simply a bucket filled with water: this device is a novelty 271
for animals, used to drink from water dispenser, and therefore required learning. 272
The testing area ambience in the maze was degraded with the diffusion of aggressive 273
sounds (72-82 Db, e.g. plane motor, chainsaw, jackhammer, etc. Nutolina Sound Effects – 274
YouTube), wet floor and vinegar odor (1/3 diluted white vinegar) to induce anxiogenic 275
conditions. If animals did not succeed in exiting the maze, they were guided out through the 276
starting gate, to a dark “failure room” where individuals remained alone in individual pens, 277
without water or any enrichment, during ten minutes at the maximum. 278
Data recording. Trial duration, number of visits and revisits of correct areas and wrong 279
areas, total number of areas visits, as well as exploratory behaviors and emotional indicators 280
were recorded, in terms of occurrences and duration. Five indicators were calculated: 281
12
!"!"# = Number of correct areas visited once− number of wrong areas visited onceNumber of all visits of all areas
% !"#$%&'()%* = Number of area visited once25
% !"##$%% = Number of animals that succeeded in reaching the goal area (exit)Total number of animal tested ! 100
!"#$%&' !"!#$% = Number of areas visited onceNumber of total visits ! 100
!"#"$"%&" !"!#$% = Number of correct areas visited onceNumber of total visits
Two-choice food test 282
These tests were carried out on 28 animals in individual cages with ab libitum water, a 283
chain as environmental enrichment, and two automatic troughs with computer-controlled 284
access (lean animals only, 14 WD and 14 SD, sex ratio=50/50). 285
Training and testing. After four days of habituation to the cage, the minipigs were 286
subjected to a two-choice food test to assess their preferences between standard and high-fat 287
high-fructose feeds. The two different feeds were presented in two different troughs 288
containing 1 kg of feed each. They were presented at 09:00 a.m. to the animals during 60 289
minutes. Refusals were then weighed. Feed distribution in the troughs was interchanged over 290
days and animals to avoid any laterality bias. The same two-choice food test was repeated for 291
four days. 292
Operant conditioning with progressive ratio 293
Training and testing. The same twenty-eight lean minipigs having done the two-choice 294
tests were subjected to operant conditioning with progressive ratio (PR) feeding tests in an 295
individual cage. The rewarded feed was either standard or high-fat high-fructose. Minipigs 296
were initially trained to press a button on a fixed ratio (FR) reinforcement whereby a single 297
button press elicited the delivery of 10 g of standard feed in the trough. Each FR training 298
session lasted 120 minutes, and was repeated once every day during four days. Then, all 299
13
minipigs were tested once every day during four days on the PR task. Each daily test session 300
lasted 200 min and began by opening the trough door and releasing the press button. The 301
individuals were tested using a PR 1 + 2 schedule every two rewards. Initially, one button 302
press of any duration resulted in a reward delivery. The second reward necessitated one 303
button press also but the two following 3, and the 2 next ones 5, and so on. Total number of 304
rewards, total number of button presses, breakpoint (number of button presses to get the last 305
reward) and Km (time where half of total obtained rewards was reached) were recorded. 306
307
Brain glucose metabolism imaging (TEP) 308
Brain glucose metabolism was investigated with Positron Emission Tomography (PET) 309
after the IV administration of 18-fluoro-deoxy-glucose (18FDG), on 20 animals (lean animals 310
only, 10 SD and 10 WD, sex ratio 50/50). 311
Animal anesthesia and radiolabel administration. Pre-anesthesia was performed with an 312
intramuscular injection of ketamine (5mg/kg – Imalgene 1000, Merial, Lyon, France) in 313
overnight-fasted animals. Isoflurane inhalation (Aerane 100 ml, Baxter SAS, France) was 314
used to suppress the pharyngotracheal reflex and then establish a surgical level of anesthesia, 315
3-5% v/v and 2-3% v/v respectively. Respiratory frequency was adjusted at 15 316
breathing/minute, tidal volume between 420-470ml to maintain EtCO2 maintained between 317
3.8 and 4.5%. A venous catheter was inserted into the left ear of the animal in order to inject 318
the radiolabeled molecule compound. Surgical tape and cotton wool were used to conceal the 319
animal’s eyes and ears, respectively, and the animal was covered with a warming blanket 320
(38°C), to limit sensory stimulation and thermoregulatory reaction. The radiolabel was 321
injected at 250 MBq activity, when animal’s anesthesia concentration was stabilized at 2.0. 322
Minimum Alveolar Concentration (MAC). 323
324
14
Image Acquisition. PET imaging was performed with a Siemens HR+ (Siemens Ecat, 325
962, HR+) in 3D mode. Subjects rested in prone position (ventral decubitus). The PET 326
procedure included a Scout scan 30 minutes after injection to control animal position, then, 327
image acquisition was performed 45 minutes after radiolabel injection for 30 minutes, using a 328
FOV (field of view) of 15.52 cm. A transmission scan using three 68Ge rod rotating sources 329
was performed to correct for tissue attenuation. Images were reconstructed with a filtered 330
backprojection using a Ramp filter (Kernel FWHM, 6mm) to obtain a 3D image with a 0.64-331
mm spatial resolution per voxel, on x and y axis, and 2.42 mm on z direction. This image was 332
corrected for attenuation, scatter and uniformity. 333
Image processing. SPM12 software (Welcome Trust Center of Neuroimaging, London, 334
UK) implemented in MATLAB 7.1 (The Mathworks Inc., Natick MA, USA) was used for 335
spatial pre-processing and statistical analysis. First, images were manually segmented to 336
remove extracerebral matter on OsiriX 6.1 software (48). SPM12 software was adapted to the 337
characteristics of the pig’s brain. Template images were based on 16 female pigs used as 338
reference images, called template (24,49). Second, images were manually reoriented to 339
center reference coordinates on a reference point set at the posterior commissura (CP) 340
according to the stereotaxic reference defined by Saikali et al. (50). A first masking step was 341
performed by thresholding the proportional normalized images from this study. Spatial 342
normalization was restricted to linear 12-parameters affine transformation, and then, images 343
were smoothed using a 5-mm Gaussian kernel. 344
345
DAT Imaging 346
Dopamine transporter imaging was carried out to assess brain dopaminergic function 347
with single-photon emission computed tomography (SPECT) (lean animals only, N=16: 8 WS 348
15
and 8 SD, sex ratio: 50/50). 123I-FP-CIT SPECT allowed for the determination of the pre-349
synaptic dopamine transporter (DAT) density in central neurons. 350
Animal anesthesia and radiolabel administration. Animals were anesthetized similarly 351
to the procedure used for PET imaging. A venous catheter was inserted into the left ear of the 352
animal in order to inject the radiolabel compound. The radioactive molecule was injected at a 353
185 MBq in toto irrespective of the body weight. 354
Image Acquisition. DAT imaging was performed with a double head gamma camera 355
(VG Millenium, GE) fitted with low energy-high resolution collimators. Imaging procedure 356
included two consecutive 3D image acquisitions of 45 min each (3.5° Step and Shoot 357
acquisition with 45 sec duration for each projection). The first image data set was used to 358
register the acquisition with the pig 3D brain atlas (50). The last image data set was the Dat 359
imaging per se (4h30 after injection). Images data set were reconstructed from the sinogram 360
with a filtered backprojection with Hann filter at 0.5 Hz (eNTEGRA , GE). Images were also 361
corrected for attenuation with a Chang correction of order 0 (Entegra, GE). 362
During brain imaging investigation, animals were housed at the AniScan imaging 363
platform (US 1395, AniScan, INRA, Saint-Gilles, FRANCE) from the morning of the first 364
acquisition, and stayed for 9 days in individual pens on the platform (animals did not return in 365
their daily collective pens between both PET and DAT scan, but stayed on the platform). The 366
imaging was performed exactly at the same time for all animals to avoid any bias due to the 367
nycthemeral cycle of DAT density. After imaging, animals did not go back to collective pens 368
but were housed in individual pens, with ad libitum water access, to perform biological 369
sampling as describe above. 370
371
Ancillary measurements and biological sampling 372
16
Food intake, weight and adiposity. The animals were weighed weekly without having 373
eaten. The HFS diet intake was measured weekly. The adiposity was measured once after all 374
behavioral testing and brain imaging, via the assessment of subcutaneous backfat thickness 375
(SBFT) by ultrasonography (51). To assess the overweight/obese status after the obesogenic 376
challenge, we defined a threshold according to human classification of obesity based on BMI, 377
meaning that obesity was defined by a weight gain over 49% of normal body weight. 378
Overweight was defined as a weight gain comprised between 26% and 49%. 379
Lipid profile and glucose tolerance test (IVGTT). Blood sampling was assessed with a 380
long catheter inserted (Vygon, ref 1219.13 leadercath) into the jugular vein, under light 381
anesthesia (intramuscular injection of ketamine (5mg/kg)) the day before the IVGTT. For 382
IVGTT (at lean status: 8 females WD and 8 females SD; at overweight status: 6 WD -3 383
females and 3 males - and 4 SD - 1 female and 3 males), overnight fasted animals received 384
0.3 g glucose per kilogram of body weight by intravenous injection, before proceeding to 385
serial blood sampling, from 30 minutes before injection to 75 minutes after injection (52). 386
The end of the injection time corresponded to T0. Lipid profile (free fatty acids (FFA), 387
triglycerides (TG), cholesterol, Chol), inflammation status (haptoglobin, Hapto), QUICKY 388
index (1/[log(basal insulin)+log(basal glucose)]) Chol/TG ratio (as indicator of Low Density 389
Lipoprotein, LDL, level), FFA/Chol ratio (hepatic dysfunction) were evaluated at the basal 390
state before glucose injection. After glucose injection, incremental total (over 75 min) and 0-391
30 min (over the first 30 min after IV glucose injection) Area Under Curve (AUC) for 392
Glucose (AUCG and AUCG0-30 respectively), and Insulin (AUCI and AUCI0-30 respectively), 393
glucose peak, incremental Acute Insulin Response (AIR), the constant of glucose 394
disappearance (KG), and insulin sensitivity (S2, S2= ((30 x KG)/ AUC0-30min ) × Vd. It is 395
expressed in mL/min/(IU/mL)/kg) (53) were calculated and the glucose effectiveness (SG) 396
and the insulin sensitivity (SI) indexes were derived from the minimal model (54). 397
17
Insulin concentration was measured by RIA (INSULIN-CT, CisbioBioassays, France). The 398
intra- and inter-essay CV were 15 and 11% respectively at 35µUI/mL. Plasma glucose, 399
triglycerides, FFA, total cholesterol and haptoglobin were measured using automated 400
spectrophotometric method. The intra-essay CV was <5%. 401
Microbiota activity. Feces were sampled to assess microbiota fermentation activity via 402
the quantitative analysis of short-chain fatty acids (SCFA). The collection was made directly 403
on the animals, and stabilized with 0.5% ortho-phosphoric acid at a rate of 1 mL of acid per 404
gram of feces. After 4000 rpm centrifugation for 15 min at 4°C, 1 mL supernatant by sample 405
was stored at -20°C until SCFA assay by gas chromatography (lean status: N=14, 8 WD and 6 406
SD; overweight status: N=15, 9 WD and 6 SD). Collection was made once before obesogenic 407
challenge, and twice during obesogenic diet, after 2 and 4 weeks. 408
409
410
Statistical analysis. 411
Data were analyzed with the R 3.1 software (University of Aalborg, Denmark). 412
Holeboard discrimination task and alley-maze. Differences between SD and WD groups in 413
working memory, reference memory, each visit of bowl and trial duration, within and 414
between phases were assessed with a non-parametric Mann-Whitney test because of general 415
non Gaussian distribution of data. Batch effect was controlled and sex effects were tested by 416
sex-separate non-parametric analysis. The labyrinth results were analyzed by descriptive 417
statistics, using PCA, to assess maternal diet effect. Friedman test was used to test trials effect 418
within maternal diet. Maternal diet effect was analyzed using Mann-Whitney test. 419
Eating behavior. The food consumption data are not Gaussian and were analyzed using 420
a non-parametric Friedman test to assess the time effect (successive trials) and Mann-Whitney 421
test to assess the group effect. 422
18
PET imaging. Statistical analysis was performed with SPM 12. Statistical analysis was 423
based on a General Linear Model (GLM) using a t-test (« Two-Sample t-test »). Both groups, 424
WD and SD PET brain images, were compared together using a two-sample t-test, applying 425
Whole Brain Method with FWE (Family Wise Error) then FDR (False Discovery Rate) 426
corrections. This approach was followed by an a priori analysis, by SVC (Small Volume 427
Correction) on ROIs: hippocampus, striatum (including nucleus accumbens – Nac, caudate 428
nucleus – CAU, and putamen – PUT) and prefrontal cortex (PFC). A minimum cluster size 429
was fixed at 20 voxels (1 mm), with a significance threshold set at P<0.005. 430
Identification of brain regions. The statistical analysis with SPM produced a listing of clusters 431
of which the activation differed between treatments or according to covariates. Each voxel 432
was associated with a set of coordinates (x, y, z) corresponding to its peak location in the 433
commissura anterior-commissura posterior line with the origin set at commissura posterior. 434
The brain regions of differential activity were identified with a three-dimensional digital pig 435
brain atlas developed in our laboratory (50). Sex-separate t-test analysis was performed to 436
assess maternal diet effect in males in one hand, and in females in another hand. 437
DAT imaging. The amounts of radioactivity in the volumes of interest (VOI) were 438
compared between the SD and WD groups using type I ANOVA after normality checking 439
with the R 3.1 software (University of Aalborg, Denmark). The calculation registration matrix 440
and its further use on the late DAT image was done using Pmod 3.506 software (PMOD 441
Technologies, Zurich) adapted to our pig brain atlas. DAT binding potential was calculated in 442
ROIS related to the amount of radioactivity in a low density DAT region (55), i.e. the 443
occipital cortex (56): 444
BPND=(BPROI-BPOccipital)/BPOccipital 445
First, exclusive DAT region without SERT contribution to non-specific radioactivity uptake 446
were investigated, i.e. the striatum. Second, non-specific ROIs were investigated, i.e. DAT 447
19
and SERT regions: hippocampus, parahippocampal cortex (PHC) and orbitofrontal cortex 448
(OFC). 449
Lipid profile and glucose tolerance test (IVGTT). Analysis was performed using type III 450
two-was Anova to test the effects of maternal dietary treatment (WD vs. SD), status effect 451
(Lean vs. Overweight) and interaction. Normality of data and associated residuals were 452
checked, and non-Gaussian data were transformed by the logarithmic approach. 453
Feces sampling. SCFA concentrations were analyzed using type III ANOVA to test the 454
perinatal diet × time interaction. Pair comparisons of the perinatal diet effect were performed 455
with type I ANOVA. 456
Other measures. Weight gain, dorsal fat and ingestion were analyzed using ANOVA for 457
repeated measures, followed by post-hoc Tukey tests. 458
Data and figures are presented as mean ± SEM, with *: P < 0.05; **: P < 0.01; ***: P < 0.001 459
and # : 0.5 ≤ P < 0.1. 460
461
3. Results 462
Holeboard discrimination task. No difference was found in cognitive performance 463
between SD and WD animals for both working and reference memories during the holeboard 464
discrimination task (W=131 & W=142 respectively, P>0.05, Figure 2A). Overall, there was 465
no effect of the perinatal nutritional environment neither for the other parameters recorded 466
during the holeboard test. Interestingly, a separate sex analysis revealed that WD females 467
tended to visit more bowls (31.8 ± 2.0) during the habituation phase compared to SD females 468
(27.4 ± 2.1, W=50, P=0.065). During the acquisition phase, WD males tended to visit fewer 469
baited bowls than SD males (number of baited bowl visited once/number of baited bowl 470
available = 3.97 ± 0.02 vs. 4.0 ± 0.04 respectively, W=20, P=0.076). 471
20
Alley-maze test. During the acquisition phase, SD pigs improved their working memory 472
(Friedman chi-squared=9.963, df=3, P=0.019), reduced test duration (Friedman chi-473
squared=8.4783, df=3, P=0.037) compared to WD pigs that did not. In acquisition phase, SD 474
pigs showed a trend for higher exploration behavior (number of total visited areas: W=21.5, 475
P=0.094), and this tendency was confirmed during the reversal phase (number of areas visited 476
once: W=21.5, P=0.095). During reversal, a trend for immobility was found in WD group 477
compare to SD (immobility duration/ test duration: W=5, P=0.072). Multivariate PCA 478
analysis revealed a higher variability in WD group compared to SD, in both phases of test, 479
where WD showed higher test duration, immobility and exploration of the wall, whereas SD 480
group had a trend for better WM, RM, index and higher exploration rate (exploration 481
duration/test duration) (Figure 2B, 2C). 482
Eating behavior. Both WD and SD animals preferred the standard feed compared to the 483
HFS feed (W=18, P<0.001) during the two-choice tests (Figures 2A, 2B). SD animals 484
significantly increased their HFS feed consumption whereas WD animals did not (Friedman 485
chi-sq=11.9, df=3, P<0.01, Figure 2B). During the operant conditioning test with progressive 486
ratio, no difference arose between the two groups for HFS feed. However, during the second 487
test with standard feed, WD animals tended to eat more than SD animals in terms of: energy 488
ingested (W=112, P=0.067) (Figure 2C), numbers of button presses (W=112, P=0.068) 489
(Figure 2D), break point (85.6 ± 4.1 vs.74.4 ± 3.3, W=110, P=0.086), and number of obtained 490
rewards (86.2 ± 4.0 vs. 74.8 ± 3.4, W=111, P=0.077). No difference arose between sexes. 491
Brain glucose metabolism. The first-level analysis without a priori revealed a 492
significantly lower basal brain activity in WD compared to SD group in the NAc and APFC 493
of the left hemisphere (Table 2, Figure 4A). The second-level analysis with a priori on 494
regions of interest highlighted the same deactivations in WD compared to SD group in the 495
NAc and the APFC, and showed a deactivation in the right putamen (Table 3). Yet, no 496

21
difference appeared between the two groups in memory-related structures such as the 497
hippocampus or cingulate cortex, neither in other ROIs. Interestingly, separate sex analysis 498
showed that within the WD group, females contributed more than males to the deactivation in 499
the NAc, whereas males contributed more than females to the prefrontal cortex deactivation 500
(Table 4). 501
DAT brain Imaging. DAT-scan imaging revealed a trend for higher binding potential of 502
DA in the SD group compared to the WD group in the putamen (F1,13=3.977, P=0.07), but no 503
significant difference in the caudate (F1,13=2.593, P=0.1) (Figure 4B). SD showed a higher 504
binding potential in hippocampus (F1,13=4.989, P=0.0437) and parahippocampal cortex 505
(F1,13=7.468, P=0.0171). 506
Obesogenic challenge: Food intake, weight and adiposity. Food intake (kg/day) was 507
significantly higher in SD compared to WD pigs (F4,65=5.433, P=0.037, Figure 5A), 508
particularly after 5 weeks of obesogenic diet. Relative food intake over the 5 weeks of the 509
obesogenic diet decreased in both groups (F1,65=4.56, P<0.01), with a significant difference 510
between groups at W5 (F1,13=8.318, P=0.0125, Figure 5B). Obesogenic challenge induced 511
significant weight gain in both SD and WD animals (F1,28=240.027, P<0.001) and there was a 512
significant maternal diet × time interaction (F1,28=8.836, P < 0.001, Figure 5C) highlighting 513
that SD animals tended to gain more weight that WD animals (P= 0.09 at week 5 of 514
obesogenic diet). Subcutaneous backfat thickness (mm) increased in both SD and WD groups 515
after 5 weeks of obesogenic diet (F1,26=47.158, P < 0.001), without any difference between 516
dietary groups (Figure 5D). 517
Lipid profile and glucose tolerance. When lean, WD animals displayed a significant 518
higher glucose peak than SD during the IVGTT (F1,14=10.39, P=0.0061), Figure6A), but no 519
difference arose between both groups according to SI (F1,14=0.701, P=0.42, Table 5). Five 520
weeks of an obesogenic (high-fat high-sucrose) diet significantly impaired glucose tolerance 521
22
in both overweight SD and WD groups, significantly increasing glucose AUCG0-30 522
(F1,24=5.2873, P=0.03135) (Figure 6A), and significantly decreasing KG (F1,24=6.0125, 523
P=0.023) compared to lean animals. This was concomitant with a significant increase in AIR 524
(F1,24=8.5432, P=0.00788), AUCI (F1,24=7.3942, P=0.01253) and AUCI0-30 (F1,24=9.844, 525
P=0.004786, Figure 6B), highlighting a significant decrease in glucose effectiveness (SG, 526
F1,24=7.3097, P=0.01506,) and in insulin sensitivity (S2: F1,24=12.5817, P=0.0014) in 527
overweight SD and WD pigs compared to lean SD and WD pigs. Interestingly, AUCG0-30 and 528
glucose peak increased more in overweight SD than in overweight WD as illustrated by a 529
significant maternal diet × status interaction (F1,222=4.5938, P=0.043 and F1,22=4.3280, 530
P=0.049 respectively) (Figure 6A). At the overweight status, WD pigs displayed a higher KG 531
(F1,8=2.3591, P=0.046) demonstrating that overweight WD animals were less glucose 532
intolerant than overweight SD animals. 533
About lipid profile, lean WD showed higher Chol/TG ratio than lean SD animals (F1,14=5.93, 534
P=0.029, Figure 6C). The obesogenic challenge also significantly degraded lipid profiles, 535
significantly increasing basal FFA levels in both overweight SD and WD animals 536
(F1,24=6.2938, P=0.02) compared to lean animals, as well as a trend to increased 537
FFA/cholesterol ratio (F1,24=3.4334, P=0.077, Figure 6D). Regarding inflammation, WD 538
overweight animals had a higher haptoglobin concentration than SD overweight animals 539
(F1,8=5.96, P=0.041). All physiological data are summarized in Table 5. 540
Microbiota activity: Fecal SCFA concentrations were not globally different in lean WD and 541
SD pigs (Figure 6E). Total SCFA concentration increased transitorily during the second week 542
of obesogenic diet in SD compared to WD pigs (F1,13=8.723, P = 0.01, Figure 4B). This 543
increase was due to a significant increase in acetate (19.8±3.9 vs. 43.4±9.4 nmol/kg in WD 544
and SD respectively, F1,13=7.512, P = 0.018), propionate (6.3±1.4 vs. 30.6±11.04 nmol/kg in 545
23
WD and SD respectively, F1,13=8.798, P = 0.012) and isobutyrate (0.9±0.2 vs. 2.4±0.7 546
nmol/kg in WD and SD respectively, F1,13=7.471, P = 0.018). 547
548
4. Discussion 549
At the adult age, there was no difference between WD and SD animals in terms of 550
memory scores during the holeboard cognitive task, and it is noticeable that the animals 551
obtained very poor scores of reference memory. This poor performance could be indicative of 552
an inappropriate device and/or task. In the young age the animals always entered by the same 553
door into the holeboard arena, whereas at the adult age four doors were used and 554
systematically alternated: this change of process might have been more difficult to integrate 555
for animals. Other studies demonstrated a significant improvement in working and reference 556
memories on the same type of test, along sessions, but also involved only a single entry (44) , 557
or more trials, between 30 to 60 according to studies (46,57,58) while we used 20 acquisition 558
trials only. 559
The maze test was designed to assess cognitive functions without any motivation bias 560
related to the use of food rewards. In this context, SD animals were more efficient than WD in 561
terms of working memory and exploration during the acquisition phase. This test also has its 562
limitations, mainly related to the anxiogenic testing environment. Indeed, the failures 563
observed were mainly related to an exploration deficit of some WD animals, which travelled 564
back and forth in the first section of the labyrinth near the gateway. WD animals thus either 565
showed lower cognitive abilities or a higher susceptibility to stress, associated with higher 566
variability in response to stress in WD group. No clear link between sugar consumption and 567
behavior has been demonstrated yet (59,60), but there is evidence of fat exposure impact on 568
mood and anxiety-like behaviors (61) in humans and non-human primates. Solutions to make 569
the environment less anxiogenic while maintaining its aversive potential might be considered 570
24
to increase the motivation of animals to escape from the maze, such as deteriorating olfactory 571
and/or thermal conditions. Since the maze test involved only five males in each group, it will 572
be necessary to repeat the experiment on a larger cohort including both males and females to 573
confirm these results. 574
It is possible that differences in the level of stress between the maze test and the 575
holeboard task triggered different behavioral and cognitive outcomes. Accordingly, Joëls et 576
al. (62) suggested that the nature of stress and its context of perception could modulate 577
memory abilities of animals. A moderate stressor might help optimizing memory, whereas 578
intense stress might reduce retention capacities. The impact of stress on cognitive 579
performance might explain why differences between WD and SD animals in terms of 580
cognitive responses were observed in the maze task and not in the holeboard task, which was 581
much less stressful and even positively associated with the food rewards. Alternatively, 582
differences of performance between the two tasks might be explained by differences in the 583
nature of the rewards, the holeboard task being an appetitively-motivated task, whereas the 584
maze test is not. 585
The behavioral differences could be linked to altered brain glucose metabolism, that 586
was lower in WD compared to SD animals in the APFC and NAc, with a similar tendency in 587
the putamen, but no difference in the hippocampus. Furthermore, a decreased neurogenesis 588
was observed in the hippocampus in the young WD animals compared to the SD animals 589
(14). Immunohistochemical studies are necessary to confirm whether this decreased 590
neurogenesis persisted at the adult age in WD animals. Nevertheless, the absence of 591
difference in hippocampal metabolism in adult animals suggests that the observed behavioral 592
results, especially in the maze test, might not be explained by a direct alteration of 593
hippocampus-related cognitive abilities in the WD piglets, but more probably by the alteration 594
of ancillary functions indirectly shaping the learning and memory processes, such as goal-595
25
oriented motivation, hedonism (according to the holeboard test), and emotional state 596
(according to the maze test). The striatum (63), is involved in the regulation of motivated 597
behaviors (64,65), and especially in the processing of information relative to the emotional 598
dimension associated with reward signals (66). The NAc is strongly connected with the 599
amygdala, the prefrontal cortex and hippocampus, and receives inhibitory inputs from the 600
APFC (67). Consequently, deactivation of the prefrontal cortex and the NAc, like those 601
observed in the WD animals, could be associated with altered reward sensitivity and cognitive 602
control of eating behavior. In humans, it is also known that a reduction of glucose metabolism 603
in the prefrontal cortex is associated with depressive disorder (68–70). Thus, a hypo-activated 604
prefrontal cortex might predispose the subjects to react more intensely to stress, which might 605
explain the putative emotional status of WD compared to SD animals in the maze test. The 606
effect of perinatal exposure to a WD diet on the susceptibility of offspring to anxiety, 607
depression and attention disorders has been supported (71). Interestingly, the same 608
deactivations were observed in obese minipigs exposed to a Western diet at the adult age (24) 609
and in obese humans (72,73), usually in combination with an alteration of the dopaminergic 610
system. 611
The higher amount of radioactivity signal detected by DAT-Scan in SD putamen can be 612
explained in two ways: 1) DAT was denser in these regions of interest in SD, as described in 613
a study involving obese rats exposed to high-fat diet and showing a lower reuptake of DA 614
compared to control group in striatum (74), or 2) DAT affinity was reduced in WD groups. 615
Such phenomenon has been observed in rats exposed to high-fat-diet-induced obesity, which 616
showed a lower striatal density of D2 receptor, and a lower DAT expression and function 617
(75). Ioflupane exhibits significantly more non-specific DAT/SERT binding in the pig 618
compared to others mammals (76). As a consequence, the hypotheses formulated above have 619
to be verified by immunohistological analyses carried out on brain sections of WD and SD 620

26
individuals, and by molecular biology analyses to quantify DAT expression. In both cases, it 621
implicates a lower synaptic DA reuptake in the WD group, which is consistent with literature 622
data, in obese-resistant mice presenting a lower density of DAT (20,77), or in rats where 623
high-fat diet fed individuals presented a loss of reuptake of DAT with increased extracellular 624
DA (75,78). Accordingly in humans, body mass index is negatively correlated with DAT 625
density in the striatum (79), and SERT deficiency impairs insulin action on peripheral tissues, 626
associated with a lower leptin secretion (80). A SERT deficiency could explain the higher 627
insulin concentration in WD animal at lean and overweight status. Our results suggest that 628
exposure to a high-fat high-sucrose diet during the perinatal period, even without further 629
overweight or obesity development, could alter the dopaminergic system even in lean adults, 630
with expected consequences on the reward system and food preferences. The WD showed 631
lower binding potential in hippocampus and parahippocampal cortex (PHC) than SD group. 632
Hippocampus and PHC are involved in learning, memory, and more specifically in learning 633
special configuration (81) and visuospatial memory (PHC) (82). Functional impairment in 634
these two regions should implicate poor performance in holeboard discrimination task in WD 635
group, but no difference was observed. A supplementary test without food reward is required 636
to confirm that spatial cognition was impaired by WD diet. 637
However, food preferences between WD and SD groups were similar: animals from both 638
groups preferred the standard known feed, and WD animals did not consume more high-fat 639
high-sucrose feed than SD animals. As a consequence, a high-fat high-sucrose maternal diet 640
during pregnancy and lactation did not modify, in our experimental paradigm, the preferences 641
for fat and sweetness in the offspring, neither at three months of age (14) nor in the adult age. 642
The intake of a new feed can trigger neophobia (83), a phenomenon frequently observed in 643
pigs, and probably expressed by the animals for the high-fat high-sucrose feed, and reinforced 644
by a change of environment (e.g. isolation in an individual cage). It is important to note that 645
27
average 36±7.1% of animals still avoided HFF food during the last test (from 29% to 57% ate 646
less than 10g HFF food), which explains the high variability observed in HFF food 647
consumption in both SD and WD groups. As a consequence, the fact that SD animal increased 648
their HFF food differently to WD animals during tests (Figure A) could indicate a lesser level 649
of neophobia in SD compared to WD, which is consistent with the assumption that WD 650
perinatal diet could be linked with higher stress/anxiety level; but a simple food preference 651
difference cannot be ruled out. Nevertheless, 10% of all the individuals never pressed the 652
button to get feed, and 20% of all the individuals did not do so at the end of the habituation 653
phase, revealing poor learning of the task. Lean WD animals tended to consume more feed 654
than SD individuals during the test involving standard feed. 655
Consistently, plasma analyses showed that WD animals were therefore less tolerant 656
to glucose, with a higher glucose peak, a trend for an increase in AUCI0-30, and an increase 657
in the chol / TG ratio indicating an increase in the LDL fraction at lean status. Paradoxically, 658
SD animals ate more during the obesogenic diet challenge and gained more weight than WD 659
animals. If both SD and WD animals displayed glucose intolerance and decreased insulin 660
sensitivity after 6 weeks of obesogenic diet, WD animals appeared to cope better with the 661
obesogenic diet than SD animals as they displayed higher plasmatic glucose disappearance 662
rate after an IV glucose challenge than SD, and their glucose AUC increased less than SD 663
animals (significant interaction of maternal diet*obesogenic diet). These results are consistent 664
with the adaptive hypothesis stipulating that one is better adapted to the environment it has 665
experienced in early life (84). Studies have shown that maternal undernutrition was associated 666
with the development of metabolic syndrome in the progeny confronted with an over-667
energetic nutritional environment (2,85), which matches the idea of a compensation 668
phenomenon of the organism when facing a possible scarcity. In the opposite situation, i.e. in 669
the case of maternal over-nutrition associated with obesity, the development of metabolic 670
28
syndrome and obesity was also observed in the offspring (86). However, the absence of 671
obesity in the mothers and offspring in the first part of our study might explain the 672
discrepancy between our results and those previously published. It is also possible that a 673
caloric intake surfeit during the perinatal period, in the absence of pathological condition such 674
as obesity, might have conferred an adaptive advantage to the progeny in the context of a 675
transition towards a high-energy diet. Similar results were found in offspring of rats exposed 676
to high-fat diet without obesity development: high-fat diet pups showed a lower weight gain 677
than control rats, despite altered hypothalamic leptin signaling (87). Maternal high-fat diet can 678
also protect progeny against obesity (88), or endothelial dysfunction (89). In the same way, it 679
was demonstrated that maternal obesity is necessary to program the effects of a high-fat diet 680
on the offspring’s health (90), even in offspring exposed to a diet-induced obesity at the adult 681
age. It is important to note that animals did not become really obese but overweight during the 682
obesogenic challenge, showing an average 37.2 % weight gain, corresponding in the human 683
to an overweight status according to the BMI classification. These studies suggest a higher 684
energy expenditure programmed by high-fat diet in non-obese mothers. This high energy 685
expenditure should be linked to the lower microbiota activity in WD 2 weeks after the start of 686
obesogenic diet, involving a lower absorption of SCFA, contrary to results observed in mice 687
ob-ob compared to lean (91). Of course, our obesogenic challenge was applied for only six 688
weeks, and our results do not augur what would happen in these animals after a longer 689
obesogenic-diet exposure. Further studies with a longer-term challenge are necessary to assess 690
whether this apparent adaptive advantage would persist over time. 691
Conclusion 692
In normal-weight adults, a maternal Western diet did not appear to alter cognitive 693
processes per se, but probably had an effect on other functions, i.e. affective (stress) and 694
motivational, that could modulate learning performances of minipigs. WD females were more 695
29
motivated for the food rewards than SD females in the holeboard task, and this was confirmed 696
in progressive ratio tests. SD males seemed to be more efficient than WD males in reward 697
search in a non-aversive, stress-free holeboard task, whereas WD animals expressed a high 698
stress level in the anxiogenic alley-maze test, with a lower success compared to SD animals. 699
Brain imaging provided interesting data contributing to the interpretation of the behavioral 700
results. Lower basal activity in WD compared to SD animals was observed in the nucleus 701
accumbens, anterior prefrontal cortex and putamen, as well as a tendency for lower DAT 702
density in WD compared to SD animals in the putamen. These findings suggest altered 703
reward and cognitive control processes in WD animals, with different effects between females 704
and males. In overweight adults, surprisingly, SD animals showed higher feed intake, weight 705
gain and glucose intolerance than WD animals, suggesting that perinatal exposure to a 706
maternal Western diet in the absence of maternal obesity might help the offspring to better 707
cope with a diet enriched in calories, fat and sugar at the adult age, in terms of weight and 708
metabolism management. SCFA analysis suggested a role of microbiota in the differential 709
adaptation of overweight SD and WD minipigs to a Western diet. 710
711
712
Acknowledgments 713
This study was funded by the INRA DID’IT (Diet Impact and Determinants: 714
Interactions and Transitions) Metaprogramme in the context of the SweetLip-Kid project 715
coordinated by Sophie Nicklaus. Yentl GAUTIER received a PhD grant from INRA and 716
Région Bretagne, France. We thank Walter Gerrits from the Animal Nutrition Group of 717
Wageningen University & Research, as well as Franz Josef van der Staay from the 718
Department of Farm Animal Health of Utrecht University for their insight on methodological 719
questions. The authors gratefully acknowledge the efforts and cooperation of the technical 720
30
staff at INRA St Gilles, and especially Isabelle Nogret, Véronique Romé, Thibaud Le Mouël, 721
Eric Bobillier, Armel Delalande, Mickaël Génissel, Julien Georges, Régis Janvier, Alain 722
Chauvin, Francis Le Gouevec and Vincent Piedvache for participating in laboratory analyses 723
or taking care of the animals. 724
725
Author contributions 726
David Val-Laillet, Sophie Blat, Isabelle Le Huërou-Luron, Bas Kemp, J. Elizabeth Bolhuis 727
and Caroline Clouard designed research; Yentl Gautier, Isabelle Luneau, Nicolas Coquery, 728
and Sylvie Guérin performed research; Yentl Gautier, Isabelle Luneau, Nicolas Coquery, Paul 729
Meurice, Sophie Blat, Charles-Henri Malbert and David Val-Laillet analyzed data; Charles-730
Henri Malbert developed new brain imaging procedure and analytic tools; Yentl Gautier and 731
David Val-Laillet wrote the paper; all co-authors red and revised the paper. 732
733 734References 7351. ArmitageJA,TaylorPD,PostonL.Experimentalmodelsofdevelopmental736
programming:consequencesofexposuretoanenergyrichdietduring737development:Developmentalprogrammingbyexposuretoenergyrichdiets.J738Physiol.2005May;565(1):3–8.739
2. BarkerDJ.,OsmondC,WinterP.,MargettsB,SimmondsS.WEIGHTININFANCY740ANDDEATHFROMISCHAEMICHEARTDISEASE.TheLancet.1989741Sep;334(8663):577–80.742
3. RiceD,BaroneS.CriticalPeriodsofVulnerabilityfortheDevelopingNervous743System:EvidencefromHumansandAnimalModels.EnvironHealthPerspect.2000744Jun1;108(s3):511–33.745
4. BentonD,ILSIEuropea.i.s.b.l.Theinfluenceofchildren’sdietontheircognition746andbehavior.EurJNutr.2008Aug;47(S3):25–37.747
5. KereliukS,BrawermanG,DolinskyV.MaternalMacronutrientConsumptionand748theDevelopmentalOriginsofMetabolicDiseaseintheOffspring.IntJMolSci.2017749Jul6;18(7):1451.750
31
6. ChangG-Q,GaysinskayaV,KaratayevO,LeibowitzSF.MaternalHigh-FatDietand751FetalProgramming:IncreasedProliferationofHypothalamicPeptide-Producing752NeuronsThatIncreaseRiskforOvereatingandObesity.JNeurosci.2008Nov75312;28(46):12107–19.754
7. TaylorPD,PostonL.Developmentalprogrammingofobesityinmammals.Exp755Physiol.2007Mar1;92(2):287–98.756
8. HowieGJ,SlobodaDM,KamalT,VickersMH.Maternalnutritionalhistorypredicts757obesityinadultoffspringindependentofpostnataldiet:Maternalhighfatnutrition758andobesityinoffspring.JPhysiol.2009Feb15;587(4):905–15.759
9. MorrisMJ,ChenH.Establishedmaternalobesityintheratreprograms760hypothalamicappetiteregulatorsandleptinsignalingatbirth.IntJObes.2009761Jan;33(1):115–22.762
10. WalkerC-D,NaefL,d’AstiE,LongH,XuZ,MoreauA,etal.PerinatalMaternalFat763IntakeAffectsMetabolismandHippocampalFunctionintheOffspring.AnnNY764AcadSci.2008Nov;1144(1):189–202.765
11. GraysonBE,LevasseurPR,WilliamsSM,SmithMS,MarksDL,GroveKL.Changesin766MelanocortinExpressionandInflammatoryPathwaysinFetalOffspringof767NonhumanPrimatesFedaHigh-FatDiet.Endocrinology.2010Apr;151(4):1622–76832.769
12. BaleTL,BaramTZ,BrownAS,GoldsteinJM,InselTR,McCarthyMM,etal.EarlyLife770ProgrammingandNeurodevelopmentalDisorders.BiolPsychiatry.2010771Aug;68(4):314–9.772
13. ClouardC,KempB,Val-LailletD,GerritsWJJ,BartelsAC,BolhuisJE.Prenatal,but773notearlypostnatal,exposuretoaWesterndietimprovesspatialmemoryofpigs774laterinlifeandispairedwithchangesinmaternalprepartumbloodlipidlevels.775FASEBJ[Internet].2016Mar16[cited2016May19];Availablefrom:776http://www.fasebj.org/cgi/doi/10.1096/fj.201500208R777
14. Val-LailletD,BessonM,GuérinS,CoqueryN,RanduineauG,KanzariA,etal.A778maternalWesterndietduringgestationandlactationmodifiesoffspring’s779microbiotaactivity,bloodlipidlevels,cognitiveresponses,andhippocampal780neurogenesisinYucatanpigs.FASEBJ.2017Feb6;fj.201601015R.781
15. BilboSD,TsangV.Enduringconsequencesofmaternalobesityforbrain782inflammationandbehaviorofoffspring.FASEBJ.2010Jun1;24(6):2104–15.783
16. LuJ,WuD,ZhengY,HuB,ChengW,ZhangZ,etal.Ursolicacidimproveshighfat784diet-inducedcognitiveimpairmentsbyblockingendoplasmicreticulumstressand785IκBkinaseβ/nuclearfactor-κB-mediatedinflammatorypathwaysinmice.Brain786BehavImmun.2011Nov;25(8):1658–67.787
17. SullivanEL,NousenEK,ChamlouKA.Maternalhighfatdietconsumptionduringthe788perinatalperiodprogramsoffspringbehavior.PhysiolBehav.2014Jan;123:236–78942.790
32
18. TozukaY,KumonM,WadaE,OnoderaM,MochizukiH,WadaK.Maternalobesity791impairshippocampalBDNFproductionandspatiallearningperformanceinyoung792mouseoffspring.NeurochemInt.2010Oct;57(3):235–47.793
19. WangG-J,VolkowND,ThanosPK,FowlerJS.ImagingofBrainDopaminePathways:794ImplicationsforUnderstandingObesity.JAddictMed.2009Mar;3(1):8–18.795
20. SouthT,HuangX-F.High-FatDietExposureIncreasesDopamineD2Receptorand796DecreasesDopamineTransporterReceptorBindingDensityintheNucleus797AccumbensandCaudatePutamenofMice.NeurochemRes.2008Mar;33(3):598–798605.799
21. NaefL,MoquinL,DalBoG,GirosB,GrattonA,WalkerC-D.Maternalhigh-fatintake800alterspresynapticregulationofdopamineinthenucleusaccumbensandincreases801motivationforfatrewardsintheoffspring.Neuroscience.2011Mar;176:225–36.802
22. NaefL,SrivastavaL,GrattonA,HendricksonH,OwensSM,WalkerC-D.Maternal803highfatdietduringtheperinatalperiodaltersmesocorticolimbicdopamineinthe804adultratoffspring:reductioninthebehavioralresponsestorepeatedamphetamine805administration.Psychopharmacology(Berl).2008Mar;197(1):83–94.806
23. WangG-J,VolkowND,LoganJ,PappasNR,WongCT,ZhuW,etal.Braindopamine807andobesity.TheLancet.2001Feb;357(9253):354–7.808
24. Val-LailletD,LayecS,GuérinS,MeuriceP,MalbertC-H.ChangesinBrainActivity809AfteraDiet-InducedObesity.Obesity.2011Apr;19(4):749–56.810
25. VolkowND,WangG-J,TelangF,FowlerJS,ThanosPK,LoganJ,etal.Lowdopamine811striatalD2receptorsareassociatedwithprefrontalmetabolisminobesesubjects:812Possiblecontributingfactors.NeuroImage.2008Oct;42(4):1537–43.813
26. IflandJR,PreussHG,MarcusMT,RourkeKM,TaylorWC,BurauK,etal.Refined814foodaddiction:Aclassicsubstanceusedisorder.MedHypotheses.2009815May;72(5):518–26.816
27. LustigRH.Fructose:Metabolic,Hedonic,andSocietalParallelswithEthanol.JAm817DietAssoc.2010Sep;110(9):1307–21.818
28. GearhardtAN,DavisC,KuschnerR,BrownellKD.Theaddictionpotentialof819hyperpalatablefoods.CurrDrugAbuseRev.2011Sep;4(3):140–5.820
29. MillerER,UllreyDE.ThePigasaModelforHumanNutrition.AnnuRevNutr.1987821Jul;7(1):361–82.822
30. DobbingJ,SandsJ.Quantitativegrowthanddevelopmentofhumanbrain.ArchDis823Child.1973Oct1;48(10):757–67.824
31. DobbingJ,SandsJ.Comparativeaspectsofthebraingrowthspurt.EarlyHumDev.8251979Mar;3(1):79–83.826

33
32. HouptKA,HouptTR,PondWG.Thepigasamodelforthestudyofobesityandof827controloffoodintake:areview.YaleJBiolMed.1979Jun;52(3):307–29.828
33. BeckerJT,WalkerJA,OltonDS.Neuroanatomicalbasesofspatialmemory.Brain829Res.1980Nov;200(2):307–20.830
34. Bruce-KellerAJ,KellerJN,MorrisonCD.ObesityandvulnerabilityoftheCNS.831BiochimBiophysActaBBA-MolBasisDis.2009May;1792(5):395–400.832
35. KanoskiSE,DavidsonTL.Westerndietconsumptionandcognitiveimpairment:833Linkstohippocampaldysfunctionandobesity.PhysiolBehav.2011Apr;103(1):59–83468.835
36. FrancisH,StevensonR.Thelonger-termimpactsofWesterndietonhuman836cognitionandthebrain.Appetite.2013Apr;63:119–28.837
37. IsaacsEB,GadianDG,SabatiniS,ChongWK,QuinnBT,FischlBR,etal.TheEffectof838EarlyHumanDietonCaudateVolumesandIQ.PediatrRes.2008Mar;63(3):308–83914.840
38. SalamoneJ,CorreaM,MingoteS,WeberS.Beyondtherewardhypothesis:841alternativefunctionsofnucleusaccumbensdopamine.CurrOpinPharmacol.2005842Feb;5(1):34–41.843
39. MidtvedtAC,MidtvedtT.Productionofshortchainfattyacidsbytheintestinal844microfloraduringthefirst2yearsofhumanlife.JPediatrGastroenterolNutr.1992845Nov;15(4):395–403.846
40. RouraE,KoopmansS-J,LallèsJ-P,LeHuerou-LuronI,deJagerN,SchuurmanT,et847al.Criticalreviewevaluatingthepigasamodelforhumannutritionalphysiology.848NutrResRev.2016May13;1–31.849
41. LeBourgotC,LeNormandL,FormalM,RespondekF,BlatS,ApperE,etal.850Maternalshort-chainfructo-oligosaccharidesupplementationincreasesintestinal851cytokinesecretion,gobletcellnumber,butyrateconcentrationandLawsonia852intracellularishumoralvaccineresponseinweanedpigs.BrJNutr.2017853Jan;117(01):83–92.854
42. GibsonPR,NewnhamE,BarrettJS,ShepherdSJ,MuirJG.Reviewarticle:fructose855malabsorptionandthebiggerpicture:REVIEW:FRUCTOSEMALABSORPTIONAND856THEBIGGERPICTURE.AlimentPharmacolTher.2006Nov3;25(4):349–63.857
43. OchoaM,MalbertC-H,LallèsJ-P,BobillierE,Val-LailletD.Effectsofchronicintake858ofstarch-,glucose-andfructose-containingdietsoneatingbehaviourinadult859minipigs.ApplAnimBehavSci.2014Aug;157:61–71.860
44. ArtsJWM,vanderStaayFJ,EkkelED.Workingandreferencememoryofpigsinthe861spatialholeboarddiscriminationtask.BehavBrainRes.2009Dec;205(1):303–6.862
45. KornumBR,KnudsenGM.Cognitivetestingofpigs(Susscrofa)intranslational863biobehavioralresearch.NeurosciBiobehavRev.2011Jan;35(3):437–51.864
34
46. ElizabethBolhuisJ,OostindjerM,HoeksCWF,deHaasEN,BartelsAC,OomsM,et865al.Workingandreferencememoryofpigs(Susscrofadomesticus)inaholeboard866spatialdiscriminationtask:theinfluenceofenvironmentalenrichment.AnimCogn.8672013Sep;16(5):845–50.868
47. GielingET,NordquistRE,vanderStaayFJ.Assessinglearningandmemoryinpigs.869AnimCogn.2011Mar;14(2):151–73.870
48. RossetA,SpadolaL,RatibO.OsiriX:AnOpen-SourceSoftwareforNavigatingin871MultidimensionalDICOMImages.JDigitImaging.2004Sep1;17(3):205–16.872
49. ClouardC,Meunier-SalaünM-C,MeuriceP,MalbertC-H,Val-LailletD.Combined873comparedtodissociatedoralandintestinalsucrosestimuliinducedifferentbrain874hedonicprocesses.FrontPsychol[Internet].2014Aug7[cited2017Apr27];5.875Availablefrom:876http://journal.frontiersin.org/article/10.3389/fpsyg.2014.00861/abstract877
50. SaikaliS,MeuriceP,SauleauP,EliatP-A,BellaudP,RanduineauG,etal.Athree-878dimensionaldigitalsegmentedanddeformablebrainatlasofthedomesticpig.J879NeurosciMethods.2010Sep;192(1):102–9.880
51. Val-LailletD,BlatS,LouveauI,MalbertCH.Acomputedtomographyscan881applicationtoevaluateadiposityinaminipigmodelofhumanobesity.BrJNutr.8822010Dec;104(11):1719–28.883
52. BlatS,VincentS,LefeuvreL,Lemoine-MorelS,MalbertC-H,PichonL,etal.Dietary884α-lactalbuminsupplementationalleviatesnormocaloricwesterndiet-induced885glucoseintoleranceinGöttingenminipigs:NormocaloricWesternDietand886Metabolism.Obesity.2015Feb;23(2):415–21.887
53. ChristoffersenB,RibelU,RaunK,GolozoubovaV,PaciniG.Evaluationofdifferent888methodsforassessmentofinsulinsensitivityinGöttingenminipigs:introductionof889anew,simplermethod.AmJPhysiol-RegulIntegrCompPhysiol.2009Oct8901;297(4):R1195–201.891
54. BergmanRN,PhillipsLS,CobelliC.Physiologicevaluationoffactorscontrolling892glucosetoleranceinman:measurementofinsulinsensitivityandbeta-cellglucose893sensitivityfromtheresponsetointravenousglucose.JClinInvest.1981Dec8941;68(6):1456–67.895
55. InnisRB,CunninghamVJ,DelforgeJ,FujitaM,GjeddeA,GunnRN,etal.Consensus896NomenclatureforinvivoImagingofReversiblyBindingRadioligands.JCerebBlood897FlowMetab.2007Sep;27(9):1533–9.898
56. MinuzziL,OlsenAK,BenderD,ArnfredS,GrantR,DanielsenEH,etal.Quantitative899autoradiographyofligandsfordopaminereceptorsandtransportersinbrainof900Göttingenminipig:Comparisonwithresultsinvivo.Synapse.2006Mar90115;59(4):211–9.902
35
57. Grimberg-HenriciCGE,VermaakP,ElizabethBolhuisJ,NordquistRE,vanderStaay903FJ.Effectsofenvironmentalenrichmentoncognitiveperformanceofpigsina904spatialholeboarddiscriminationtask.AnimCogn.2016Mar;19(2):271–83.905
58. RoelofsS,NordquistRE,vanderStaayFJ.Femaleandmalepigs’performanceina906spatialholeboardandjudgmentbiastask.ApplAnimBehavSci.2017Jun;191:5–16.907
59. BellisleF.Effectsofdietonbehaviourandcognitioninchildren.BrJNutr.2004908Oct;92(S2):S227.909
60. WolraichML,LindgrenSD,StumboPJ,SteginkLD,AppelbaumMI,KiritsyMC.910EffectsofDietsHighinSucroseorAspartameonTheBehaviorandCognitive911PerformanceofChildren.NEnglJMed.1994Feb3;330(5):301–7.912
61. SullivanEL,GraysonB,TakahashiD,RobertsonN,MaierA,BetheaCL,etal.Chronic913ConsumptionofaHigh-FatDietduringPregnancyCausesPerturbationsinthe914SerotonergicSystemandIncreasedAnxiety-LikeBehaviorinNonhumanPrimate915Offspring.JNeurosci.2010Mar10;30(10):3826–30.916
62. JoëlsM,PuZ,WiegertO,OitzlMS,KrugersHJ.Learningunderstress:howdoesit917work?TrendsCognSci.2006Apr;10(4):152–8.918
63. HaberSN,McFARLANDNR.TheConceptoftheVentralStriatuminNonhuman919Primates.AnnNYAcadSci.1999Jun;877(1ADVANCINGFRO):33–48.920
64. BaldoBA,KelleyAE.Discreteneurochemicalcodingofdistinguishablemotivational921processes:insightsfromnucleusaccumbenscontroloffeeding.922Psychopharmacology(Berl).2007Mar2;191(3):439–59.923
65. IkemotoS,PankseppJ.Dissociationsbetweenappetitiveandconsummatory924responsesbypharmacologicalmanipulationsofreward-relevantbrainregions.925BehavNeurosci.1996;110(2):331–45.926
66. BerendseHW,GroenewegenHJ,LohmanAH.Compartmentaldistributionofventral927striatalneuronsprojectingtothemesencephalonintherat.JNeurosciOffJSoc928Neurosci.1992Jun;12(6):2079–103.929
67. AsherA,LodgeDJ.Distinctprefrontalcorticalregionsnegativelyregulateevoked930activityinnucleusaccumbenssubregions.IntJNeuropsychopharmacol.2012931Oct;15(09):1287–94.932
68. BaxterLR.ReductionofPrefrontalCortexGlucoseMetabolismCommontoThree933TypesofDepression.ArchGenPsychiatry.1989Mar1;46(3):243.934
69. MartinotJL,HardyP,FelineA,HuretJD,MazoyerB,Attar-LevyD,etal.Left935prefrontalglucosehypometabolisminthedepressedstate:aconfirmation.AmJ936Psychiatry.1990Oct;147(10):1313–7.937
70. VidebechP.PETmeasurementsofbrainglucosemetabolismandbloodflowin938majordepressivedisorder:acriticalreview.ActaPsychiatrScand.2000939Jan;101(1):11–20.940
36
71. SullivanEL,SmithMS,GroveKL.PerinatalExposuretoHigh-FatDietPrograms941EnergyBalance,MetabolismandBehaviorinAdulthood.Neuroendocrinology.9422011;93(1):1–8.943
72. LeDSN,PannacciulliN,ChenK,SalbeAD,DelParigiA,HillJO,etal.Lessactivation944intheleftdorsolateralprefrontalcortexinthereanalysisoftheresponsetoameal945inobesethaninleanwomenanditsassociationwithsuccessfulweightloss.AmJ946ClinNutr.2007Sep;86(3):573–9.947
73. SticeE,SpoorS,BohonC,VeldhuizenMG,SmallDM.Relationofrewardfromfood948intakeandanticipatedfoodintaketoobesity:Afunctionalmagneticresonance949imagingstudy.JAbnormPsychol.2008;117(4):924–35.950
74. ConeJJ,ChartoffEH,PotterDN,EbnerSR,RoitmanMF.ProlongedHighFatDiet951ReducesDopamineReuptakewithoutAlteringDATGeneExpression.SimonSA,952editor.PLoSONE.2013Mar13;8(3):e58251.953
75. NarayanaswamiV,ThompsonA,CassisL,BardoM,DwoskinL.Diet-induced954obesity:dopaminetransporterfunction,impulsivityandmotivation.IntJObes9552005[Internet].2013Aug[cited2017Sep5];37(8).Availablefrom:956http://www.ncbi.nlm.nih.gov/pmc/articles/PMC3856583/957
76. MinuzziL,OlsenAK,BenderD,ArnfredS,GrantR,DanielsenEH,etal.Quantitative958autoradiographyofligandsfordopaminereceptorsandtransportersinbrainof959Göttingenminipig:Comparisonwithresultsinvivo.Synapse.2006Mar96015;59(4):211–9.961
77. HuangX-F,ZavitsanouK,HuangX,YuY,WangH,ChenF,etal.Dopamine962transporterandD2receptorbindingdensitiesinmiceproneorresistanttochronic963highfatdiet-inducedobesity.BehavBrainRes.2006Dec15;175(2):415–9.964
78. ConeJJ,ChartoffEH,PotterDN,EbnerSR,RoitmanMF.ProlongedHighFatDiet965ReducesDopamineReuptakewithoutAlteringDATGeneExpression.PLOSONE.9662013Mar13;8(3):e58251.967
79. ChenPS,YangYK,YehTL,LeeI-H,YaoWJ,ChiuNT,etal.Correlationbetweenbody968massindexandstriataldopaminetransporteravailabilityinhealthyvolunteers—A969SPECTstudy.NeuroImage.2008Mar1;40(1):275–9.970
80. ChenX,MargolisKJ,GershonMD,SchwartzGJ,SzeJY.ReducedSerotoninReuptake971Transporter(SERT)FunctionCausesInsulinResistanceandHepaticSteatosis972IndependentofFoodIntake.SestiG,editor.PLoSONE.2012Mar8;7(3):e32511.973
81. BohbotVD,AllenJJB,DagherA,DumoulinSO,EvansAC,PetridesM,etal.Roleof974theparahippocampalcortexinmemoryfortheconfigurationbutnottheidentityof975objects:convergingevidencefrompatientswithselectivethermallesionsandfMRI.976FrontHumNeurosci[Internet].2015Aug3[cited2017Dec13];9.Availablefrom:977http://journal.frontiersin.org/Article/10.3389/fnhum.2015.00431/abstract978
82. AminoffEM,KveragaK,BarM.Theroleoftheparahippocampalcortexincognition.979TrendsCognSci.2013Aug;17(8):379–90.980
37
83. ClouardC,ChataignierM,Meunier-SalaünM-C,Val-LailletD.Flavourpreference981acquiredviaabeverage-inducedconditioninganditstranspositiontosolidfood:982Sucrosebutnotmaltodextrinorsaccharininducedsignificantflavourpreferences983inpigs.ApplAnimBehavSci.2012Jan;136(1):26–36.984
84. BatesonP,GluckmanP,HansonM.Thebiologyofdevelopmentalplasticityandthe985PredictiveAdaptiveResponsehypothesis:DevelopmentalplasticityandthePAR986response.JPhysiol.2014Jun1;592(11):2357–68.987
85. PetryCJ,OzanneSE,HalesCN.Programmingofintermediarymetabolism.MolCell988Endocrinol.2001Dec;185(1–2):81–91.989
86. AlfaradhiMZ,OzanneSE.DevelopmentalProgramminginResponsetoMaternal990Overnutrition.FrontGenet[Internet].2011[cited2017Apr27];2.Availablefrom:991http://journal.frontiersin.org/article/10.3389/fgene.2011.00027/abstract992
87. Ferezou-VialaJ,RoyA-F,SerougneC,GripoisD,ParquetM,BailleuxV,etal.Long-993termconsequencesofmaternalhigh-fatfeedingonhypothalamicleptinsensitivity994anddiet-inducedobesityintheoffspring.AJPRegulIntegrCompPhysiol.2007Jun99520;293(3):R1056–62.996
88. CouvreurO,FerezouJ,GripoisD,SerougneC,CrépinD,AubourgA,etal.997UnexpectedLong-TermProtectionofAdultOffspringBorntoHigh-FatFedDams998againstObesityInducedbyaSucrose-RichDiet.KoB,editor.PLoSONE.2011Mar99925;6(3):e18043.1000
89. KhanI.PredictiveAdaptiveResponsestoMaternalHigh-FatDietPrevent1001EndothelialDysfunctionbutNotHypertensioninAdultRatOffspring.Circulation.10022004Aug23;110(9):1097–102.1003
90. WhiteCL,PurperaMN,MorrisonCD.Maternalobesityisnecessaryfor1004programmingeffectofhigh-fatdietonoffspring.AJPRegulIntegrCompPhysiol.10052009May1;296(5):R1464–72.1006
91. TurnbaughPJ,LeyRE,MahowaldMA,MagriniV,MardisER,GordonJI.Anobesity-1007associatedgutmicrobiomewithincreasedcapacityforenergyharvest.Nature.10082006Dec21;444(7122):1027–131.1009
92. FélixB,LégerM-E,Albe-FessardD,MarcillouxJ-C,RampinO,LaplaceJ-P,etal.1010Stereotaxicatlasofthepigbrain.BrainResBull.1999May1;49(1):1–137.1011
1012 1013
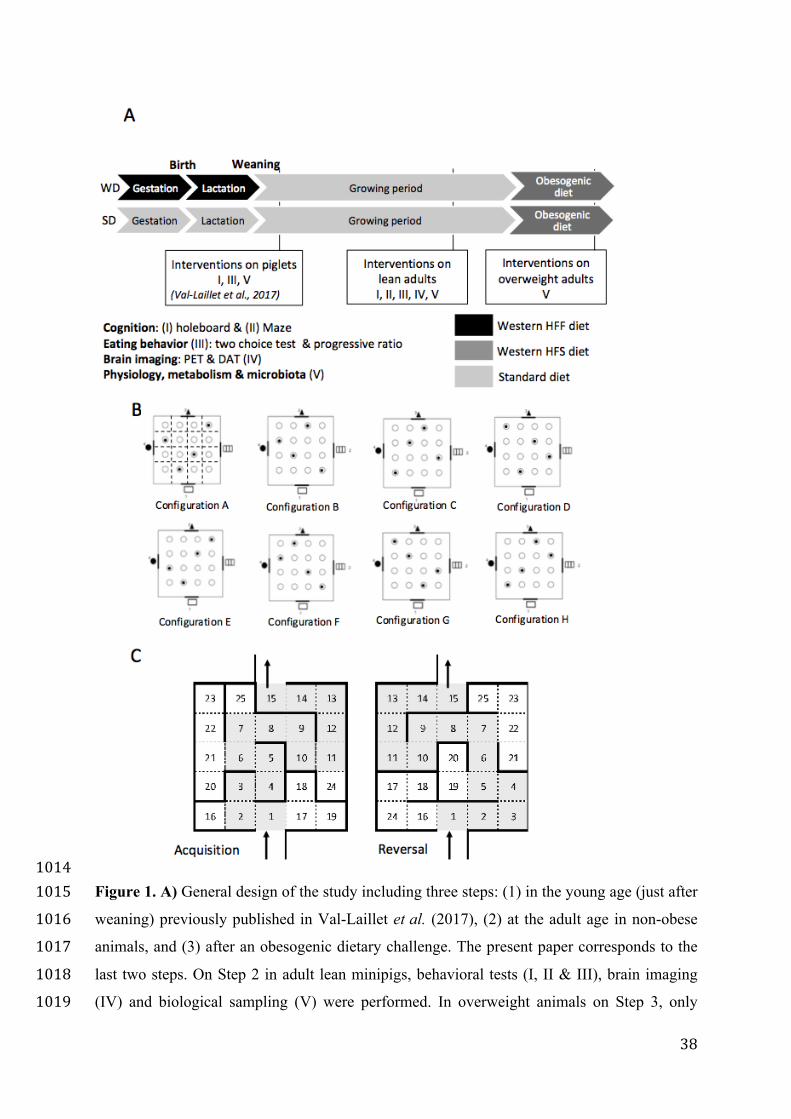
38
1014Figure 1. A) General design of the study including three steps: (1) in the young age (just after 1015weaning) previously published in Val-Laillet et al. (2017), (2) at the adult age in non-obese 1016animals, and (3) after an obesogenic dietary challenge. The present paper corresponds to the 1017last two steps. On Step 2 in adult lean minipigs, behavioral tests (I, II & III), brain imaging 1018(IV) and biological sampling (V) were performed. In overweight animals on Step 3, only 1019

39
biological sampling was performed (V). B) Holeboard design: 2D plans of the holeboard 1020apparatus indicating the different reward configurations C) Design of the alley-maze 1021apparatus with the respective configuration for the acquisition phase (left) and reversal phase 1022(right). The optimum path is indicated in grey, detours or wrong paths being indicated in 1023white. Virtual delimitations are represented with dashed lines; real walls are represented with 1024bold continuous lines. The starting zone was the number 1, the last zone the number 15. 1025Number of virtual zones crossed was used to calculate a performance score (15 being the 1026perfect score and minimum number of zones to cross before leaving the apparatus). 1027 1028
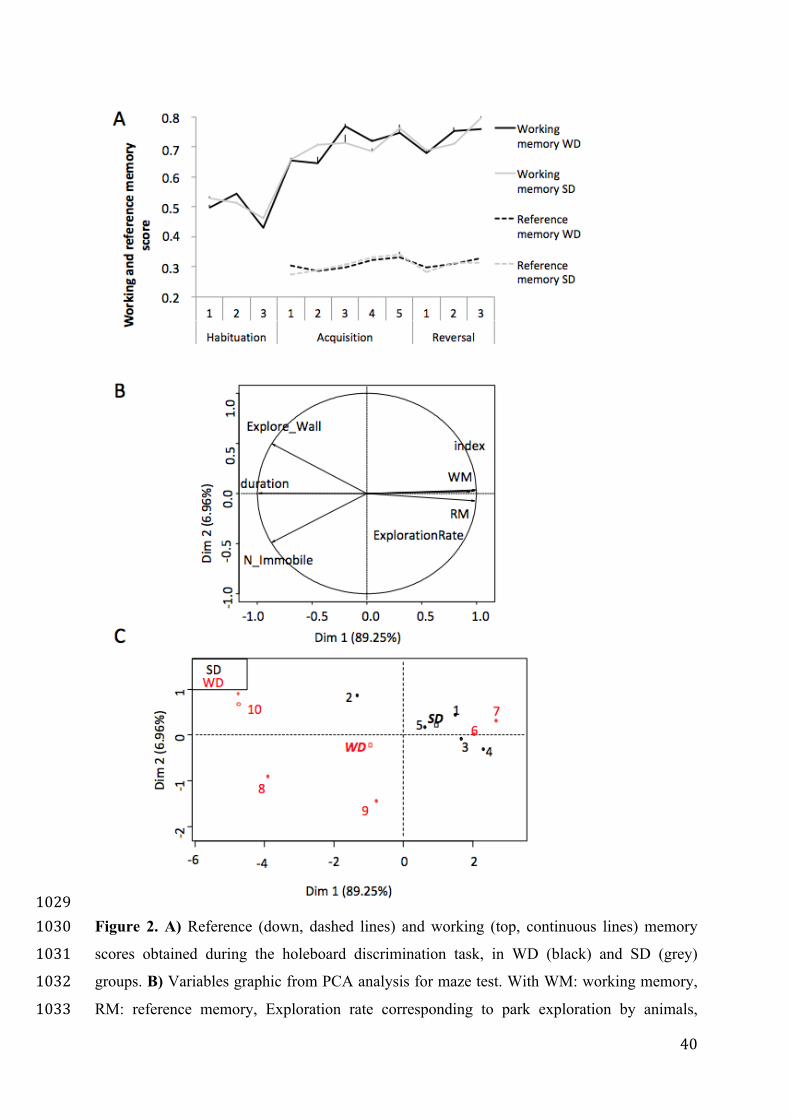
40
1029Figure 2. A) Reference (down, dashed lines) and working (top, continuous lines) memory 1030scores obtained during the holeboard discrimination task, in WD (black) and SD (grey) 1031groups. B) Variables graphic from PCA analysis for maze test. With WM: working memory, 1032RM: reference memory, Exploration rate corresponding to park exploration by animals, 1033

41
N_Immobile as occurrences of immobility, duration as test duration, Explore_Wall 1034representing the time of wall exploration by animals, and Index as index of performance of 1035the maze. C) Individuals graphic from PCA analysis for maze test. With 5 WD individuals 1036(red) and 5 SD individuals (black) 1037 1038
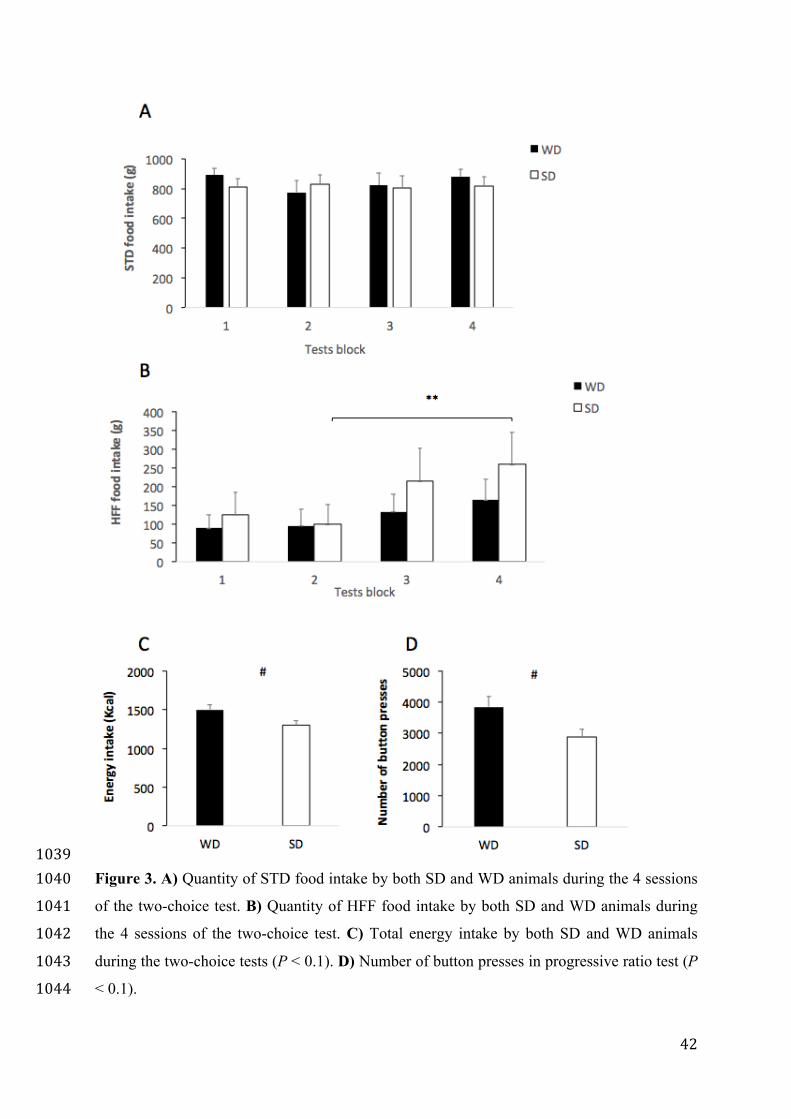
42
1039Figure 3. A) Quantity of STD food intake by both SD and WD animals during the 4 sessions 1040of the two-choice test. B) Quantity of HFF food intake by both SD and WD animals during 1041the 4 sessions of the two-choice test. C) Total energy intake by both SD and WD animals 1042during the two-choice tests (P < 0.1). D) Number of button presses in progressive ratio test (P 1043< 0.1). 1044

43
1045
1046Figure 4. A) Differences in metabolic activity from TEP imaging, in WD compared to SD 1047groups: SD > WD. Left panel: Three-dimensional representation (3D) of brain areas with 1048significant differences in metabolism between the WD and SD groups revealed by the first-1049level of analysis (P = 0.005, pFDR = 0.01, T = 2.87), Put, Putamen; NAc, Nucleus 1050accumbens; APFC, anterior prefrontal cortex. Right panel: Two-dimensional representations 1051in sagittal section (S1,S2) and coronal section (C1, C2) of the right putamen and bilateral 1052nucleus accumbens (S1, C1), and of the left anterior prefrontal cortex (S2, C2) differential 1053

44
activations. B) Binding potential (mean ± SEM) of DAT in VOIs in WD (black) and SD 1054(white) animals. *, P < 0.05. #, P < 0.1. 1055 1056
C.1C.2

45
1057Figure 5. A) Raw food intake (kg/day) during the obesogenic dietary challenge. B) Relative 1058daily food intake (g/day/kg live weight) per week of obesogenic dietary challenge. *, P < 10590.05. **, P < 0.01. #, P < 0.1. C) Weight gain (kg) during the obesogenic dietary challenge 1060(from week 1 to week 6). Free Fatty Acids concentration (FFA, mmol/L) in lean (full) and 1061

46
overweight animals (hatched) animals. D) Dorsal backfat thickness evolution between lean 1062and overweight status in SD (grey) and WD (black) animals.1063 1064
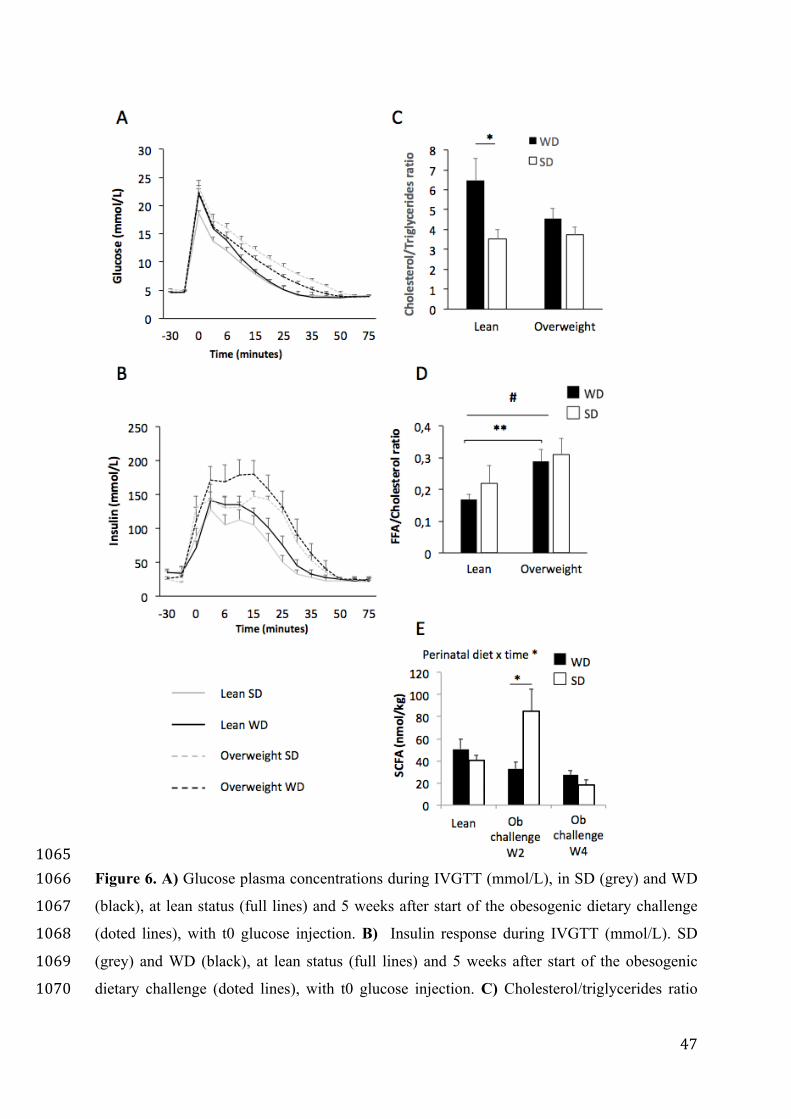
47
1065Figure 6. A) Glucose plasma concentrations during IVGTT (mmol/L), in SD (grey) and WD 1066(black), at lean status (full lines) and 5 weeks after start of the obesogenic dietary challenge 1067(doted lines), with t0 glucose injection. B) Insulin response during IVGTT (mmol/L). SD 1068(grey) and WD (black), at lean status (full lines) and 5 weeks after start of the obesogenic 1069dietary challenge (doted lines), with t0 glucose injection. C) Cholesterol/triglycerides ratio 1070
48
(Chol/TG) in lean SD (white) and WD (black) minipigs. D) Free Fatty Acid / Cholesterol 1071ratio (FFA/Chol) in lean (full) and overweight animals (hatched). E) Total SCFA 1072concentration (nmol/kg) in lean status, then after 2 weeks and 4 weeks of obesogenic diet, in 1073WD (black) and SD (white) groups. Two-way ANOVA, effect of time × diet: P=0.14, effect 1074of diet: P=0.002, effect of time: P=0.002. 1075
1076 1077 1078 1079
1080 1081 1082
1083 1084 1085 1086 1087 1088 1089 1090 1091 1092 1093 1094 1095 1096 1097 1098
1099 1100
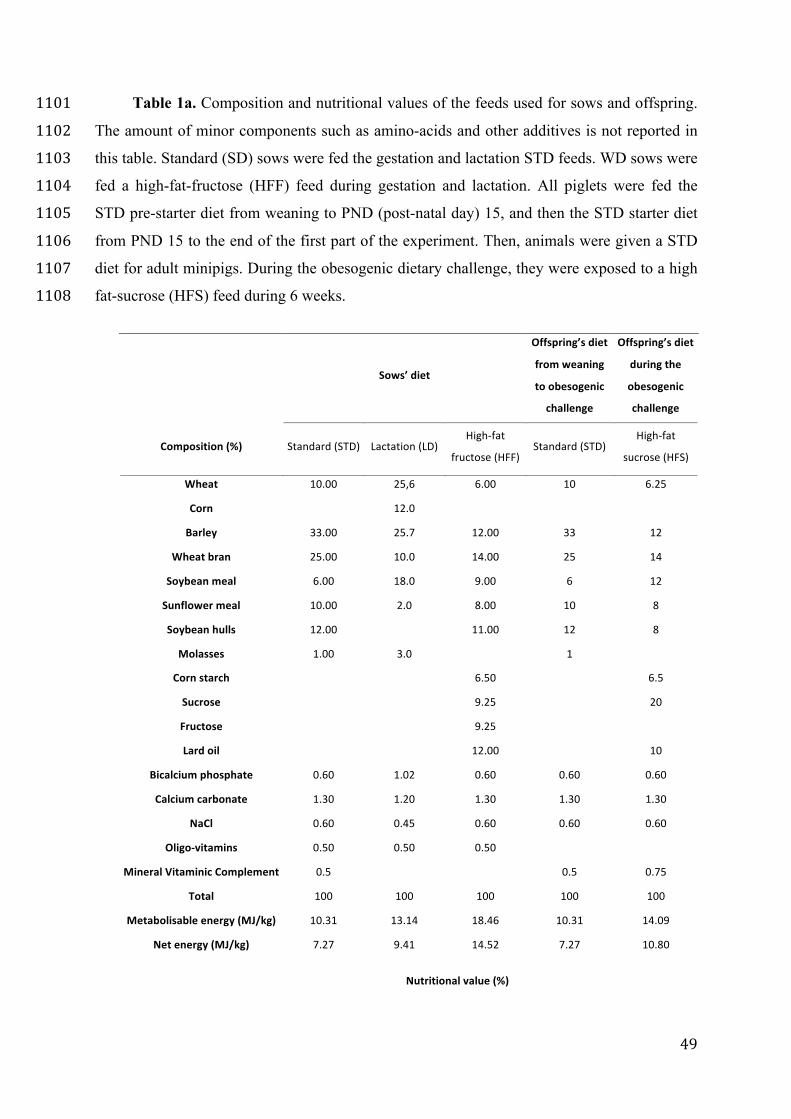
49
Table 1a. Composition and nutritional values of the feeds used for sows and offspring. 1101The amount of minor components such as amino-acids and other additives is not reported in 1102this table. Standard (SD) sows were fed the gestation and lactation STD feeds. WD sows were 1103fed a high-fat-fructose (HFF) feed during gestation and lactation. All piglets were fed the 1104STD pre-starter diet from weaning to PND (post-natal day) 15, and then the STD starter diet 1105from PND 15 to the end of the first part of the experiment. Then, animals were given a STD 1106diet for adult minipigs. During the obesogenic dietary challenge, they were exposed to a high 1107fat-sucrose (HFS) feed during 6 weeks. 1108
Sows’diet
Offspring’sdiet
fromweaning
toobesogenic
challenge
Offspring’sdiet
duringthe
obesogenic
challenge
Composition(%) Standard(STD) Lactation(LD)High-fat
fructose(HFF)Standard(STD)
High-fat
sucrose(HFS)
Wheat 10.00 25,6 6.00 10 6.25
Corn
12.0
Barley 33.00 25.7 12.00 33 12
Wheatbran 25.00 10.0 14.00 25 14
Soybeanmeal 6.00 18.0 9.00 6 12
Sunflowermeal 10.00 2.0 8.00 10 8
Soybeanhulls 12.00 11.00 12 8
Molasses 1.00 3.0
1
Cornstarch
6.50
6.5
Sucrose
9.25
20
Fructose 9.25
Lardoil
12.00
10
Bicalciumphosphate 0.60 1.02 0.60 0.60 0.60
Calciumcarbonate 1.30 1.20 1.30 1.30 1.30
NaCl 0.60 0.45 0.60 0.60 0.60
Oligo-vitamins 0.50 0.50 0.50
MineralVitaminicComplement 0.5
0.5 0.75
Total 100 100 100 100 100
Metabolisableenergy(MJ/kg) 10.31 13.14 18.46 10.31 14.09
Netenergy(MJ/kg) 7.27 9.41 14.52 7.27 10.80
Nutritionalvalue(%)
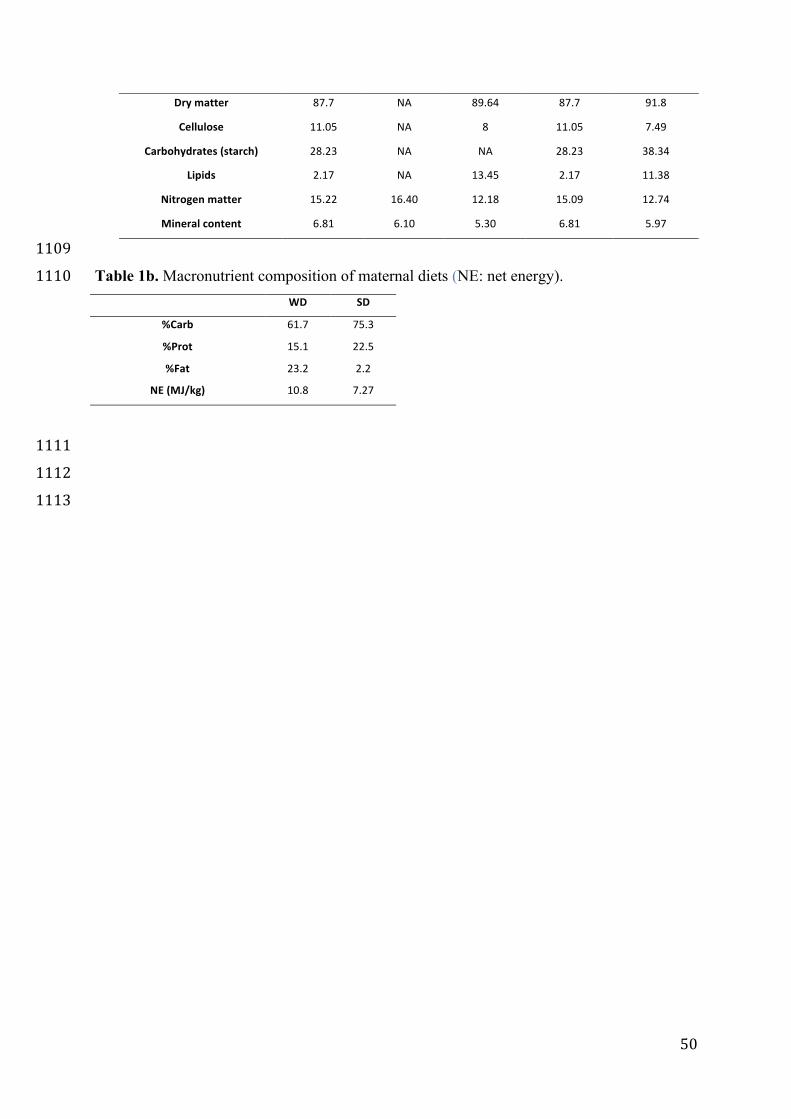
50
1109Table 1b. Macronutrient composition of maternal diets (NE: net energy). 1110
WD SD
%Carb 61.7 75.3
%Prot 15.1 22.5
%Fat 23.2 2.2
NE(MJ/kg) 10.8 7.27
1111
1112 1113
Drymatter 87.7 NA 89.64 87.7 91.8
Cellulose 11.05 NA 8 11.05 7.49
Carbohydrates(starch) 28.23 NA NA 28.23 38.34
Lipids 2.17 NA 13.45 2.17 11.38
Nitrogenmatter 15.22 16.40 12.18 15.09 12.74
Mineralcontent 6.81 6.10 5.30 6.81 5.97

51
Table 2. Brain regions with differential activation between WD and SD groups; using 1114level-1 SPM analysis, without a priori, Whole Brain method, FDR (False Discovery Rate) 1115correction (R, right; L, left). Stereotaxic coordinates (x,y,z) of the voxel with the highest t-1116value are indicated for each brain region. They were referenced to the commissura anterior-1117commissura posterior plane with the origin set at commissura posterior according to the 1118stereotactic reference selected by (92), (50), for the pig brain stereotactic atlas. 1119
Hemisphere Number
of voxels Coordinates t-value
Voxel P
(uncorrected)
PFWE
(corrected)
PFDR
(corrected)
ROIs H=WD<SD
x y z
Nucleus accumbens L 151 -1 20 -4 5.26 0.0001 NA 0.047
Anterior prefrontal cortex L 42 -4 32 1 5.16 0.0001 NA 0.047
Height threshold: T = 2.88, p = 0.005. Extent threshold: k = 20 voxels, pFDR = 0.01.
1120 1121 1122
1123
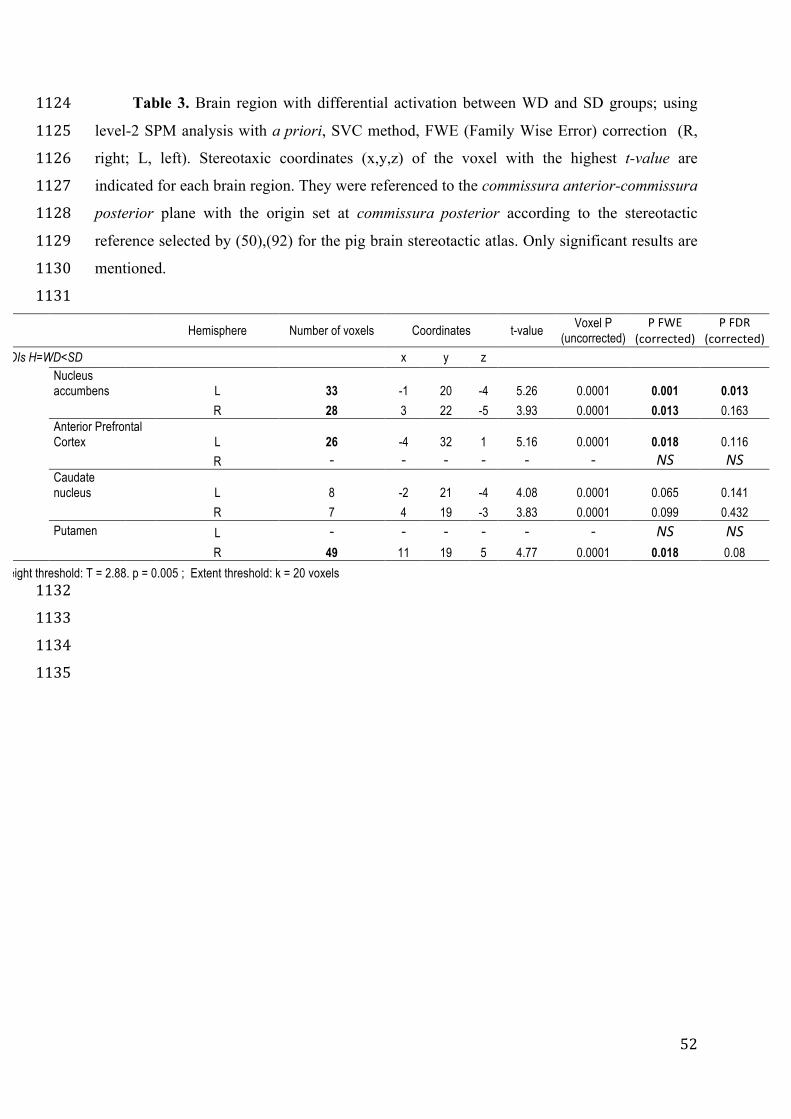
52
Table 3. Brain region with differential activation between WD and SD groups; using 1124level-2 SPM analysis with a priori, SVC method, FWE (Family Wise Error) correction (R, 1125right; L, left). Stereotaxic coordinates (x,y,z) of the voxel with the highest t-value are 1126indicated for each brain region. They were referenced to the commissura anterior-commissura 1127posterior plane with the origin set at commissura posterior according to the stereotactic 1128reference selected by (50),(92) for the pig brain stereotactic atlas. Only significant results are 1129mentioned. 1130
1131
Hemisphere Number of voxels Coordinates t-value Voxel P (uncorrected)
PFWE(corrected)
PFDR(corrected)
ROIs H=WD<SD x y z
Nucleus accumbens L 33 -1 20 -4 5.26 0.0001 0.001 0.013
R 28 3 22 -5 3.93 0.0001 0.013 0.163
Anterior Prefrontal Cortex L 26 -4 32 1 5.16 0.0001 0.018 0.116
R - - - - - - NS NS
Caudate nucleus L 8 -2 21 -4 4.08 0.0001 0.065 0.141
R 7 4 19 -3 3.83 0.0001 0.099 0.432
Putamen
L - - - - - - NS NS
R 49 11 19 5 4.77 0.0001 0.018 0.08
Height threshold: T = 2.88. p = 0.005 ; Extent threshold: k = 20 voxels 1132 1133 1134
1135

53
Table 4. Brain region with differential activation between WD and SD groups in 1136separate sex analysis with F for females and M for males; using level 1 SPM analysis, without 1137a priori, using Whole Brain method, FWE approach (R, right; L, left). Stereotaxic coordinates 1138(x,y,z) of the voxel with the highest t-value are indicated for each brain region. They were 1139referenced to the commissura anterior-commissura posterior plane with the origin set at 1140
commissura posterior according to the stereotactic reference selected by (50)(92) for the pig 1141brain stereotactic atlas. Only significant results are mentioned. 1142
1143 1144
Sex Hemisphere Number of voxels Coordinates t-value Voxel P (uncorrected)
PFWE(corrected)
ROIs H=WD<SD x y z
Nucleus accumbens
F L 1 -1 22 6 3.86 0.001 0.006
R 5 2 22 -6 3.79 0.001 0.006
M
L - - - - - NS NS
R - - - - - NS NS
Anterior prefrontal cortex
F L - - - - - NS NS
R - - - - - NS NS
M L 37 -7 41 -2 6.78 0.0001 0.017
R - - - - - NS NS
Height threshold: T = 2.88, p = 0.005. Extent threshold: k = 20 voxels 1145 1146 1147 1148 1149 1150 1151 1152 1153 1154 1155 1156 1157
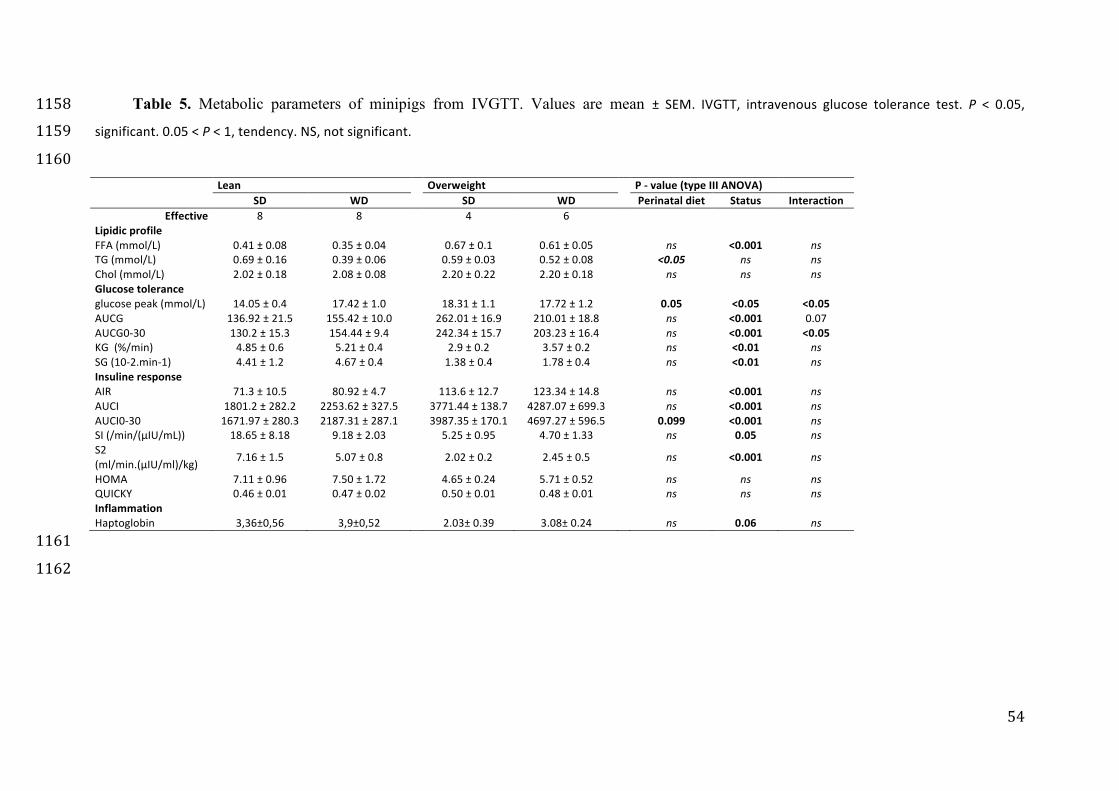
54
Table 5. Metabolic parameters of minipigs from IVGTT. Values are mean ± SEM. IVGTT, intravenous glucose tolerance test. P < 0.05,1158significant.0.05<P<1,tendency.NS,notsignificant. 1159
1160 Lean Overweight P-value(typeIIIANOVA)
SD WD SD WD Perinataldiet Status InteractionEffective 8 8 4 6 Lipidicprofile FFA(mmol/L) 0.41±0.08 0.35±0.04
0.67±0.1 0.61±0.05
ns <0.001 ns
TG(mmol/L) 0.69±0.16 0.39±0.06
0.59±0.03 0.52±0.08
<0.05 ns nsChol(mmol/L) 2.02±0.18 2.08±0.08
2.20±0.22 2.20±0.18
ns ns ns
Glucosetolerance glucosepeak(mmol/L) 14.05±0.4 17.42±1.0
18.31±1.1 17.72±1.2
0.05 <0.05 <0.05AUCG 136.92±21.5 155.42±10.0
262.01±16.9 210.01±18.8
ns <0.001 0.07
AUCG0-30 130.2±15.3 154.44±9.4
242.34±15.7 203.23±16.4
ns <0.001 <0.05KG(%/min) 4.85±0.6 5.21±0.4
2.9±0.2 3.57±0.2
ns <0.01 ns
SG(10-2.min-1) 4.41±1.2 4.67±0.4
1.38±0.4 1.78±0.4
ns <0.01 nsInsulineresponse AIR 71.3±10.5 80.92±4.7
113.6±12.7 123.34±14.8
ns <0.001 ns
AUCI 1801.2±282.2 2253.62±327.5
3771.44±138.7 4287.07±699.3
ns <0.001 nsAUCI0-30 1671.97±280.3 2187.31±287.1 3987.35±170.1 4697.27±596.5 0.099 <0.001 nsSI(/min/(µIU/mL)) 18.65±8.18 9.18±2.03 5.25±0.95 4.70±1.33
ns 0.05 ns
S2(ml/min.(µIU/ml)/kg) 7.16±1.5 5.07±0.8
2.02±0.2 2.45±0.5
ns <0.001 ns
HOMA 7.11±0.96 7.50±1.72 4.65±0.24 5.71±0.52
ns ns nsQUICKY 0.46±0.01 0.47±0.02 0.50±0.01 0.48±0.01
ns ns ns
Inflammation Haptoglobin 3,36±0,56 3,9±0,52 2.03±0.39 3.08±0.24 ns 0.06 ns
1161 1162