Maternal and Newborn Health - UNICEF · PDF filereduced with better maternal screening and ......
52
EXECUTIVE SUMMARY THE STATE OF THE WORLD’S CHILDREN 2009 EXECUTIVE SUMMARY Maternal and Newborn Health
Transcript of Maternal and Newborn Health - UNICEF · PDF filereduced with better maternal screening and ......

EXECUTIVE SUMMARY
THE STATE OF THEWORLD’S CHILDREN 2009
EXECUTIVE SUMMARY
Maternal and Newborn Health

To access a copy of the full report and any updates subsequent toprinting, please visit our website at <www.unicef.org/publications>.

CONTENTS
Chapter 1: Maternal and newborn health: Where we stand .................... 2
Chapter 2: Creating a supportive environment for maternal and newborn health ................................................................ 7
Chapter 3: The continuum of care across time and location: Risks and opportunities.......................................................... 10
Chapter 4: Strengthening health systems to improve maternal and newborn health .............................................................. 17
Chapter 5: Working together for maternal and newborn health .......... 23
Summary Indicators
Sub-Saharan Africa .............................................................................. 26
Eastern and Southern Africa .............................................................. 28
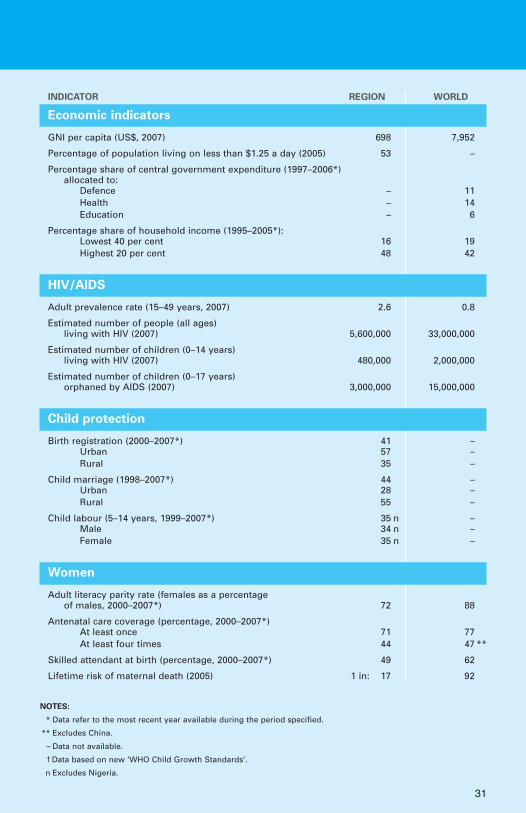
West and Central Africa ...................................................................... 30
Middle East and North Africa ............................................................ 32
South Asia ............................................................................................ 34
East Asia and Pacific ............................................................................ 36
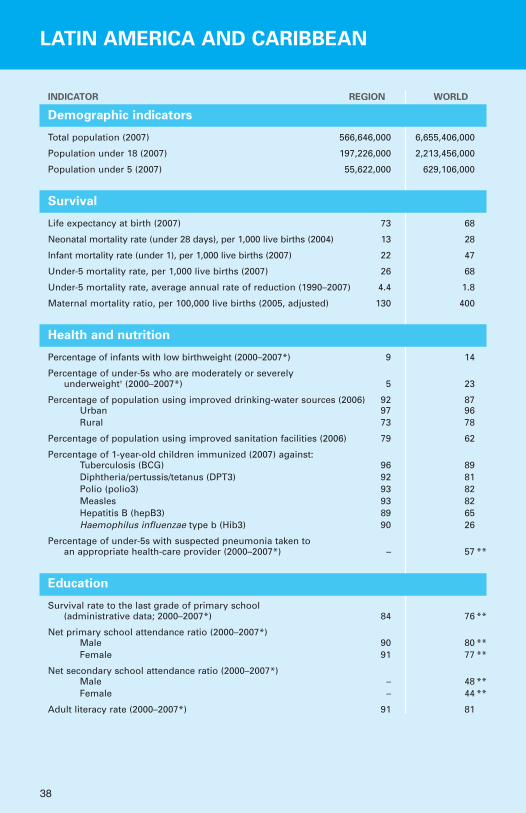
Latin America and Caribbean .............................................................. 38
Central and Eastern Europe/Commonwealthof Independent States.......................................................................... 40
Industrialized countries ...................................................................... 42
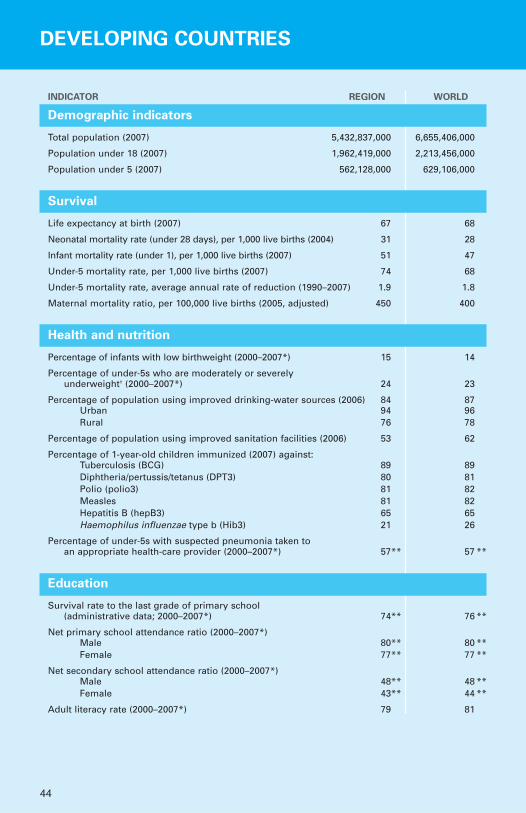
Developing countries .......................................................................... 44
Least developed countries .................................................................. 46

2
Maternal and newborn health:Where we stand
Pregnancy and childbirth are generally times of joy for parents and families.But in many countries and communities, they are also periods of great riskto the health and survival of women and newborns. Every day, around 1,500women die from complications related to pregnancy and childbirth. Since1990, the estimated annual number of maternal deaths worldwide hasexceeded 500,000 – amounting to almost 10 million maternal deaths duringthe past 19 years.
The divide between the industrialized countries and developing regions, par-ticularly the least developed countries, is perhaps greater on maternal mortali-ty than on almost any other issue. This claim is borne out by the numbers:Based on 2005 data, the average lifetime risk of a woman in a least developedcountry dying from complications related to pregnancy or childbirth is morethan 300 times greater than for a woman living in an industrialized country.No other mortality rate is so unequal. Furthermore, millions of women whosurvive childbirth suffer from pregnancy-related injuries, infections, diseasesand disabilities, often with lifelong consequences.
1© UNICEF/HQ06-2706/Shehzad Noorani

3
The earliest days of life are the most vulnerable for a child. Almost 40 percent of under-five deaths – numbering 3.7 million in 2004, the latest year forwhich firm estimates are available – take place during the first 28 days, theneonatal period. Three quarters of these neonatal deaths take place duringthe first 7 days, the early neonatal period. The risk of mortality is greatestduring the first day after birth, when it is estimated that between 25 per centand 45 per cent of neonatal deaths occur. The health divide in neonatal mor-tality is also marked; a child born in a least developed country is almost 14times more likely to die during the first 28 days of life than a child born inan industrialized country.
As with child mortality, the burden of death for mothers and newborns is dis-proportionately heavy in the continents of Africa and Asia, which togetheraccount for 95 per cent of maternal deaths and around 90 per cent of new-born deaths. Disparities across social groups within countries also remainhigh, especially in relation to poverty. Demographic and Health Surveys con-ducted between 1995 and 2002 show that within regions, neonatal mortalityis 20–50 per cent higher for the poorest 20 per cent of households than forthe richest quintile. Similar inequities exist for maternal mortality.
The timing and causes of maternal and newborn deaths are well understood.Obstetric complications – including post-partum haemorrhage, infections,eclampsia, and prolonged or obstructed labour – and complications of abor-tion account for most maternal deaths. Anaemia, exacerbated by malaria,
Maternal deaths, 2005
Eastern/Southern Africa103,000 (19%)Middle East/
North Africa21,000 (4%)
South Asia187,000 (35%)
East Asia/Pacific45,000 (8%)
Latin America/Caribbean15,000 (3%)
West/Central Africa162,000 (30%)
Industrialized countries 830 (<1%)
CEE/CIS, 2,600 (<1%)
Regional distribution of maternal deaths*
Figure 1.1
* Percentages may not total 100% because of rounding.
Source: World Health Organization, United Nations Children’s Fund, United Nations PopulationFund and the World Bank, Maternal Mortality in 2005: Estimates developed by WHO, UNICEF,UNFPA and the World Bank, WHO, Geneva, 2007, p. 35.

Trends, levels and lifetime risk of maternal mortality
Figure 1.2
Source: World Health Organization, United Nations Children’s Fund, United Nations Population Fundand the World Bank, Maternal Mortality in 2005: Estimates developed by WHO, UNICEF, UNFPA andthe World Bank, WHO, Geneva, 2007, p. 35.
Lifetime risk of maternal death, 2005
West/Central Africa
Sub-Saharan Africa*
Eastern/Southern Africa
South Asia
Middle East/North Africa
East Asia/Pacific
Latin America/Caribbean
CEE/CIS
Industrialized countries
0 1 2 3 4 5 6 7
World
Least developed countries
Developing countries
5.9
3.4
1.7
0.7
0.3
0.4
0.1
0.01
1.1
4.5
1.3
4.2
Probability that a woman will die from causes related to pregnancy cumulative across her reproductive years (%)
*Sub-Saharan Africa comprises the regions of Eastern/Southern Africa and West/Central Africa.
West/Central Africa
World
Sub-Saharan Africa*
Developing countries
Least developed countries
Eastern/Southern Africa
South Asia
Middle East/North Africa
East Asia/Pacific
Latin America/Caribbean
CEE/CIS
Industrialized countries
Maternal mortality ratios, 1990 and 2005
1,1001,100
1990
2005
0 200 400 600 800 1,000 1,200
790760
650500
270210
220150
180130
6346
88
430400
940920
480450
900870
Maternal deaths per 100,000 live births
4

HIV and other conditions, heightens the risk of maternal death from haem-orrhage. For newborns, the greatest health risks are posed by severe infec-tions (including sepsis/pneumonia, tetanus and diarrhoea), asphyxia and pre-term births; taken together, these three main causes account for 86 per centof newborn deaths.
Most of these conditions are preventable or treatable with such essentialmeasures as quality reproductive health services, antenatal care, skilledhealth workers assisting at birth, access to emergency obstetric and newborncare when necessary, adequate nutrition, post-natal care for mothers andnewborns, and education to foster healthy practices for women and new-borns. Research has shown that around 80 per cent of maternal deaths couldbe averted if women had access to essential maternity and basic health-careservices. Infections, which cause 36 per cent of neonatal deaths, could bereduced with better maternal screening and immunization, and hygienicdelivery and umbilical cord care practices.
In addition to the direct causes of maternal and newborn mortality andmorbidity, there are a number of underlying factors at the household,
West/Central Africa
South Asia
Sub-Saharan Africa*
Eastern/Southern Africa
Middle East/North Africa
East Asia/Pacific
CEE/CIS
Latin America/Caribbean
Industrialized countries
World
Least developed countries
Developing countries
0 5 10 15 20 25 30 35 40 45 50
44
36
41
34
18
15
13
3
29
41
40
31
Neonatal deaths (0–28 days) per 1,000 live births, 2004
Regional rates of neonatal mortality
Figure 1.3
Source: World Health Organization, using vital registration systems and household surveys.
*Sub-Saharan Africa comprises the regions of Eastern/Southern Africa and West/Central Africa.
5

6
community and district levels that also undermine the health and survival of mothers and newborns. These include: lack of education and knowledgefor girls and young women, who are still more likely than boys to be out ofschool; insufficient access to nutritious food and essential micronutrients;poor environmental health facilities; and inadequate and limited access tobasic health-care services. There are also basic factors, such as poverty,social exclusion, gender discrimination and political insecurity, that serve to entrench the direct and underlying causes of maternal and newborn mortality and morbidity.
The factors jeopardizing maternal and newborn survival and health acrossthe developing world reinforce the benefits of a continuum of care, whichunderlines the imperative of delivering essential services for mothers andchildren at critical points in time (adolescence, pre-pregnancy, pregnancy,birth, post-natal and neonatal periods, infancy and childhood), and at keylocations where they can be readily accessed by women and children (house-hold and community, outreach and outpatient, and health facilities).
The continuum of care emphasizes that a woman’s capacity to sustain herown health and life, and that of her child, during pregnancy and childbirthbegins with skills, care and protection received from early adolescence.Healthy women who receive adequate nutrition, quality reproductive healthand maternity services and basic health care before, during and after theirpregnancies are more likely to give birth to strong babies who survive.Similarly, nurtured, healthy babies are more likely to survive into infancyand early childhood and beyond.
Improving maternal and newborn health does not rest solely in the provisionof health services. To be truly effective and sustainable, the scaling up ofessential interventions must take place within a framework that strives tostrengthen and integrate programmes with health systems and promotes anenvironment supportive of women’s rights. Without actions to address gen-der discrimination and inequities that are perpetuated against women andgirls, actions to support enhanced primary health care risk being much lesseffective, sustainable, or even possible.

7
Creating a supportive environmentfor maternal and newborn health
Creating a supportive environment for maternal and newborn health requireschallenging the social, economic and cultural barriers that perpetuate genderinequality and discrimination. This involves several key actions: educatingwomen and girls and reducing the poverty they experience; protecting themfrom abuse, exploitation, discrimination and violence; fostering their partici-pation and their involvement in household decision-making and economicand political life; and empowering them to demand their rights and essentialservices for themselves and their children. Greater involvement of men inmaternal and newborn health care and in addressing gender discriminationand inequalities is also critical to establishing a supportive environment.
The empowerment of girls and women has a direct impact on maternal andchild health. Education, in particular, can lower the exposure of girls andwomen to maternity risks. Research shows that educated adolescents aremore likely to wait until after their teenage years to start families. This delayis often critical: Complications from pregnancy and childbirth are an impor-tant cause of mortality for girls aged 15–19 worldwide, accounting for
2© UNICEF /HQ05-2185/Giacomo Pirozzi

70,000 deaths annually. In addition to delaying pregnancy, studies show thateducated mothers are more likely to immunize their children, be betterinformed about nutrition, and use improved birth spacing practices. Theirchildren tend to have higher survival rates and better nutrition.
Child marriage, a violation of rights according to international conventionsand many national laws, can rob girls of their opportunities for schoolingand lead to pregnancies at younger ages. The younger a girl is when shebecomes pregnant, the greater the health risks for herself and her baby. Girlswho give birth before the age of 15 are five times more likely to die in child-birth than women in their twenties. Moreover, if a mother is younger than18, her infant’s risk of dying before reaching age one is 60 per cent greaterthan that of an infant born to a mother older than 19. Even if the child sur-vives, he or she has a greater likelihood of suffering from low birthweight,undernutrition, and late physical and cognitive development.
Although child marriage is becoming less common overall, the pace of changeis slow. Challenging prevailing attitudes towards child marriage will requireaction by governments and other parties, including religious and communityleaders, and the promotion of education, particularly at the secondary level.
0 10 20 30 40 50 60
49
44
36
19
18
11
40
36
49
N/A
West/Central Africa
Eastern/Southern Africa
South Asia
Middle East/North Africa
East Asia/Pacific*
Latin America/Caribbean
CEE/CIS
Sub-Saharan Africa**
Developing countries*
Least developed countries
Percentage of women aged 20–24 years who were married or in union before they were 18 years old, 1998–2007
* Excludes China. ** Sub-Saharan Africa comprises the regions of Eastern/Southern Africa andWest/Central Africa.
Source: Demographic and Health Surveys, Multiple Indicator Cluster Surveys and other national surveys.
Figure 2.1
Child marriage is highly prevalent in South Asia and
sub-Saharan Africa
8
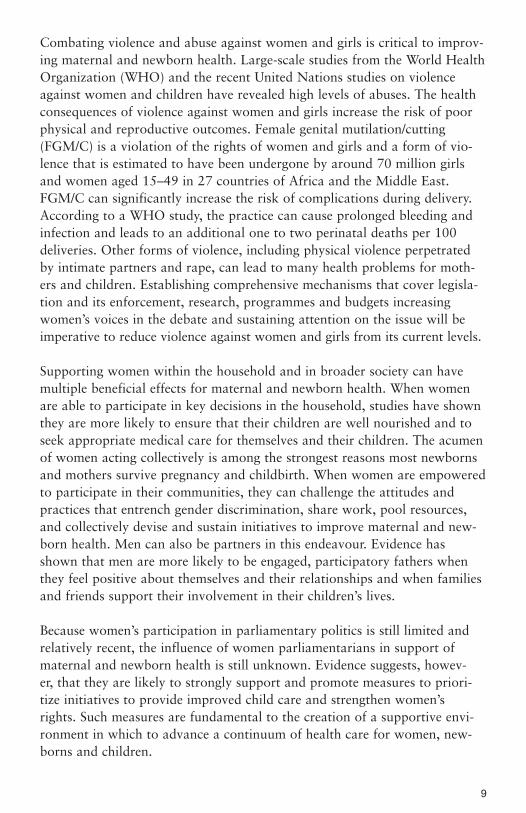
Combating violence and abuse against women and girls is critical to improv-ing maternal and newborn health. Large-scale studies from the World HealthOrganization (WHO) and the recent United Nations studies on violenceagainst women and children have revealed high levels of abuses. The healthconsequences of violence against women and girls increase the risk of poorphysical and reproductive outcomes. Female genital mutilation/cutting(FGM/C) is a violation of the rights of women and girls and a form of vio-lence that is estimated to have been undergone by around 70 million girlsand women aged 15–49 in 27 countries of Africa and the Middle East.FGM/C can significantly increase the risk of complications during delivery.According to a WHO study, the practice can cause prolonged bleeding andinfection and leads to an additional one to two perinatal deaths per 100deliveries. Other forms of violence, including physical violence perpetratedby intimate partners and rape, can lead to many health problems for moth-ers and children. Establishing comprehensive mechanisms that cover legisla-tion and its enforcement, research, programmes and budgets increasingwomen’s voices in the debate and sustaining attention on the issue will beimperative to reduce violence against women and girls from its current levels.
Supporting women within the household and in broader society can havemultiple beneficial effects for maternal and newborn health. When womenare able to participate in key decisions in the household, studies have shownthey are more likely to ensure that their children are well nourished and toseek appropriate medical care for themselves and their children. The acumenof women acting collectively is among the strongest reasons most newbornsand mothers survive pregnancy and childbirth. When women are empoweredto participate in their communities, they can challenge the attitudes andpractices that entrench gender discrimination, share work, pool resources,and collectively devise and sustain initiatives to improve maternal and new-born health. Men can also be partners in this endeavour. Evidence hasshown that men are more likely to be engaged, participatory fathers whenthey feel positive about themselves and their relationships and when familiesand friends support their involvement in their children’s lives.
Because women’s participation in parliamentary politics is still limited andrelatively recent, the influence of women parliamentarians in support ofmaternal and newborn health is still unknown. Evidence suggests, howev-er, that they are likely to strongly support and promote measures to priori-tize initiatives to provide improved child care and strengthen women’srights. Such measures are fundamental to the creation of a supportive envi-ronment in which to advance a continuum of health care for women, new-borns and children.
9
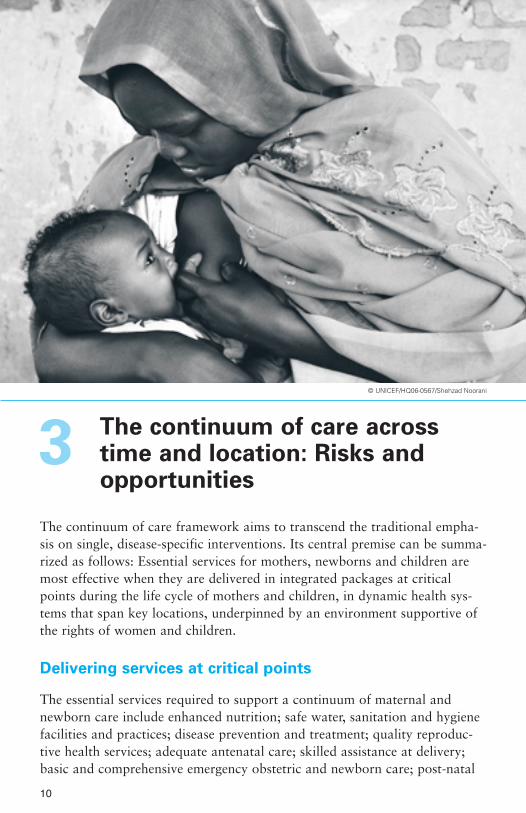
The continuum of care acrosstime and location: Risks andopportunities
The continuum of care framework aims to transcend the traditional empha-sis on single, disease-specific interventions. Its central premise can be summa-rized as follows: Essential services for mothers, newborns and children aremost effective when they are delivered in integrated packages at criticalpoints during the life cycle of mothers and children, in dynamic health sys-tems that span key locations, underpinned by an environment supportive ofthe rights of women and children.
Delivering services at critical points
The essential services required to support a continuum of maternal andnewborn care include enhanced nutrition; safe water, sanitation and hygienefacilities and practices; disease prevention and treatment; quality reproduc-tive health services; adequate antenatal care; skilled assistance at delivery;basic and comprehensive emergency obstetric and newborn care; post-natal
3© UNICEF/HQ06-0567/Shehzad Noorani
10
11
care; neonatal care; and Integrated Management of Neonatal andChildhood Illnesses.
Quality reproductive health services: A growing consensus is emerging onthe importance of improving reproductive health services for young peoplein particular, and curbing the growing incidence of HIV and other sexuallytransmitted diseases among them. Building reproductive health capacity atthe national level will necessitate identifying problems, setting priorities and formulating strategies with the participation of all stakeholders.
Enhanced nutrition: Adequate nutrition for adolescent girls and pregnantwomen is critical for the health and survival prospects of both mothers andnewborns. The undernutrition of young women, which is particularly preva-lent in South Asia from an early age, increases the health risks for both themand their babies. Programmes targeted towards improving maternal healthare increasingly focused on enhancing the nutrition of girls and women.Increased food intake and supplementation with folic acid and iron are beingencouraged during pre-pregnancy and pregnancy. Dietary diversification, the use of iodized salt and deworming also support the health of pregnantwomen and mothers. Vitamin A supplementation is recommended for post-partum women. Improved feeding practices for newborns, especially earlyand exclusive breastfeeding, helps protect them against disease.
Safe water, sanitation, and hygiene facilities and practices: Clean deliverypractices are vital to safeguard the health of mothers and newborns frominfections. Severe infections, which are often associated with unhygienicdelivery practices and unsafe water and poor sanitation, accounted for 36 per cent of neonatal deaths in 2000. Promoting hygienic delivery prac-tices and immunization has contributed to a significant reduction in the incidence of maternal and neonatal tetanus since 1980.
Disease prevention and treatment: Interventions to prevent and treat infec-tious diseases in pregnant women are essential complements to maternityservices. Two key areas of prevention and treatment relate to HIV andmalaria, particularly in sub-Saharan Africa. The fight against HIV showssigns of progress: Prevalence rates among women aged 15–24 attendingantenatal clinics have declined in 14 of 17 countries with sufficient datasince 2000/2001 and antiretroviral therapy to prevent mother-to-child trans-mission of HIV worldwide has increased from 10 per cent in 2004 to 33 per cent in 2007. Distribution of insecticide-treated mosquito nets to preg-nant women and intermittent preventive treatment of malaria – which con-sists of a single dose of antimalarial drugs at least twice during pregnancywhether the pregnant woman has malaria or not – are two measures that are

Least developed countries
Developing countries
Sub-Saharan Africa*
World
CEE/CIS
Latin America/Caribbean
East Asia/Pacific
Middle East/North Africa
South Asia
Eastern/Southern Africa
West/Central Africa
0 10 20 30 40 50 60 70 80 90 100
7144
7240
6834
72
8966**
9483
90
N/A
N/A
4777
4272
46**77
3264
Antenatal visits from skilled health personnel during pregnancy:
At least four timesAt least once
Percentage of women aged 15–49 receiving antenatal care during pregnancy, 2000–2007
Antenatal care coverage
Figure 3.1
* Sub-Saharan Africa comprises the regions of Eastern/Southern Africa and West/Central Africa. ** Excludes China.
Source: Demographic and Health Surveys, Multiple Indicator Cluster Surveys and other national household surveys.
Institutionaldeliveries**
Skilled attendantat birth***
0 20 40 60 80 100
Least developed countries
Developing countries
Sub-Saharan Africa*
World
CEE/CIS
Latin America/Caribbean
East Asia/Pacific
Middle East/North Africa
South Asia
Eastern/Southern Africa
West/Central Africa 4649
3340
3541
7181
7387
8685
8994
5462
4045
5461
3239
Percentage, 2000–2007
Delivery care coverage
Figure 3.2
* Sub-Saharan Africa comprises the regions of Eastern/Southern Africa and West/Central Africa.
** Institutional deliveries refers to the proportion of women aged 15–49 years who gave birth in the two years preced-ing the survey and delivered in a health facility.
*** Skilled attendant at birth refers to the percentage of births attended by skilled health personnel (doctors, nursesand midwives).
Source: Demographic and Health Surveys, Multiple Indicator Cluster Surveys, World Health Organization and UNICEF.
12
helping to contain malaria. Although efforts to prevent and treat HIV andmalaria have achieved some successes in recent years, much more needs to bedone to address the toll of these diseases.
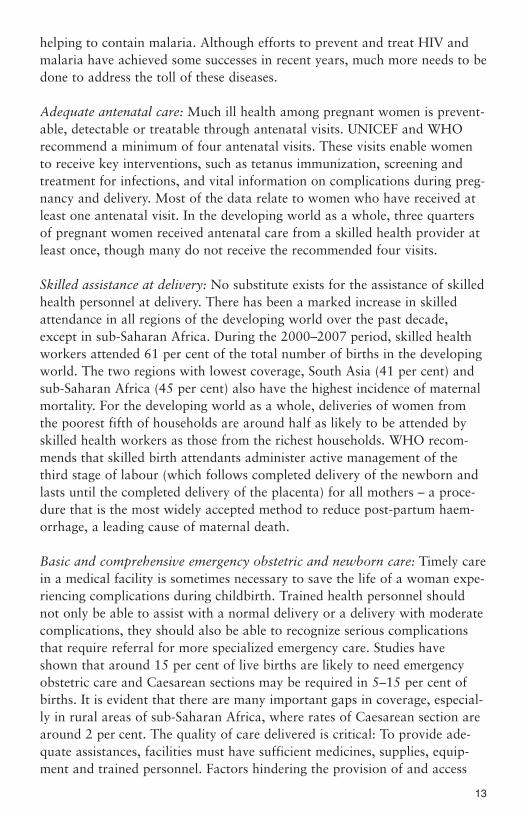
Adequate antenatal care: Much ill health among pregnant women is prevent-able, detectable or treatable through antenatal visits. UNICEF and WHOrecommend a minimum of four antenatal visits. These visits enable womento receive key interventions, such as tetanus immunization, screening andtreatment for infections, and vital information on complications during preg-nancy and delivery. Most of the data relate to women who have received atleast one antenatal visit. In the developing world as a whole, three quartersof pregnant women received antenatal care from a skilled health provider atleast once, though many do not receive the recommended four visits.
Skilled assistance at delivery: No substitute exists for the assistance of skilledhealth personnel at delivery. There has been a marked increase in skilledattendance in all regions of the developing world over the past decade,except in sub-Saharan Africa. During the 2000–2007 period, skilled healthworkers attended 61 per cent of the total number of births in the developingworld. The two regions with lowest coverage, South Asia (41 per cent) andsub-Saharan Africa (45 per cent) also have the highest incidence of maternalmortality. For the developing world as a whole, deliveries of women fromthe poorest fifth of households are around half as likely to be attended byskilled health workers as those from the richest households. WHO recom-mends that skilled birth attendants administer active management of thethird stage of labour (which follows completed delivery of the newborn andlasts until the completed delivery of the placenta) for all mothers – a proce-dure that is the most widely accepted method to reduce post-partum haem-orrhage, a leading cause of maternal death.
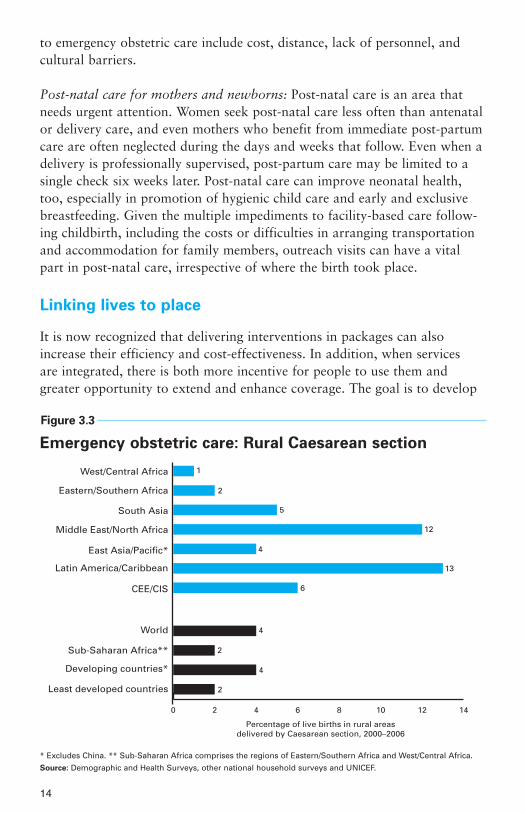
Basic and comprehensive emergency obstetric and newborn care: Timely carein a medical facility is sometimes necessary to save the life of a woman expe-riencing complications during childbirth. Trained health personnel shouldnot only be able to assist with a normal delivery or a delivery with moderatecomplications, they should also be able to recognize serious complicationsthat require referral for more specialized emergency care. Studies haveshown that around 15 per cent of live births are likely to need emergencyobstetric care and Caesarean sections may be required in 5–15 per cent ofbirths. It is evident that there are many important gaps in coverage, especial-ly in rural areas of sub-Saharan Africa, where rates of Caesarean section arearound 2 per cent. The quality of care delivered is critical: To provide ade-quate assistances, facilities must have sufficient medicines, supplies, equip-ment and trained personnel. Factors hindering the provision of and access
13
to emergency obstetric care include cost, distance, lack of personnel, and cultural barriers.
Post-natal care for mothers and newborns: Post-natal care is an area thatneeds urgent attention. Women seek post-natal care less often than antenatalor delivery care, and even mothers who benefit from immediate post-partumcare are often neglected during the days and weeks that follow. Even when adelivery is professionally supervised, post-partum care may be limited to asingle check six weeks later. Post-natal care can improve neonatal health,too, especially in promotion of hygienic child care and early and exclusivebreastfeeding. Given the multiple impediments to facility-based care follow-ing childbirth, including the costs or difficulties in arranging transportationand accommodation for family members, outreach visits can have a vitalpart in post-natal care, irrespective of where the birth took place.
Linking lives to place
It is now recognized that delivering interventions in packages can alsoincrease their efficiency and cost-effectiveness. In addition, when servicesare integrated, there is both more incentive for people to use them andgreater opportunity to extend and enhance coverage. The goal is to develop
* Excludes China. ** Sub-Saharan Africa comprises the regions of Eastern/Southern Africa and West/Central Africa.
Source: Demographic and Health Surveys, other national household surveys and UNICEF.
0 2 4 6 8 10 12 14
1
2
5
12
4
13
6
4
2
4
2Least developed countries
Developing countries*
Sub-Saharan Africa**
World
CEE/CIS
Latin America/Caribbean
East Asia/Pacific*
Middle East/North Africa
South Asia
Eastern/Southern Africa
West/Central Africa
Percentage of live births in rural areasdelivered by Caesarean section, 2000–2006
Emergency obstetric care: Rural Caesarean section
Figure 3.3
14

a comprehensive primary-health-care system that provides women and chil-dren with essential services and strengthens links between households andhealth facilities.
Health in the home: In the developing world as a whole, 54 per cent ofbirths take place in clinics or hospitals, but in South Asia and sub-SaharanAfrica – the regions bearing the brunt of maternal and neonatal mortality –more than 60 per cent of women give birth at home. Direct user charges,travel and accommodation costs, together with other indirect costs such asthe income foregone by accompanying family members, may prove prohibi-tive to seeking medical care in facilities. The main burden of post-partumand neonatal care often falls on the family of the mother and newborn.
Better health can begin at home. Nutrition and hygiene practices in thehousehold are prime determinants of the health risks faced by mothers andnewborns. Inadequate nutrition, inattention to basic hygiene practices, suchas hand washing with soap or ashes after using latrines and before preparingand eating meals, and indoor air pollution can accentuate the spread ofinfections and diarrhoeal diseases. Exclusive breastfeeding of infants up tosix months has considerable potential to improve child health and well-being. Improving household knowledge of elementary health, nutrition andenvironmental health interventions, along with increased empowerment ofwomen to make decisions about their own and their child’s health, couldhave a strong positive impact on health outcomes for both newborns andnew and expectant mothers.
Community partnerships: Communities have a vital role in health care, notmerely in the absence of more expensive alternatives but as a path to greaterempowerment and human rights. Community partnerships in health ofteninvolve training people as community health workers who make home visitsor staff established health centres. Exclusive breastfeeding, hand washing withsoap and the use of insecticide-treated mosquito nets for malaria preventionare three of the most common interventions advocated by community healthworkers. In addition, many community partnerships in health include work-ers who are able to advise on measures to prevent mother-to-child transmis-sion of HIV and contribute to the management of childhood illnesses such asmalaria, pneumonia and neonatal sepsis. In rural Nepal, for example, trainedcommunity health workers have collaborated with skilled health personnel tohelp reduce neonatal mortality by 30 per cent.
Outreach/outpatient services: Just as community partnerships in health canhelp expand coverage of essential services while inspiring greater inclusionwithin health systems, outreach and outpatient services can create bridges
15

between home and community care and facility-based care. They are vitalmechanisms for delivering antenatal and post-natal care, as well as sexualand reproductive health programmes. Antenatal and post-natal check-ups forboth newborns and mothers can effectively be conducted as outreach or out-patient services. Key services include recognizing and checking the dangersigns for mothers and newborns, guidance on feeding – particularly earlyand exclusive breastfeeding – and caring for the newborn, referral for treat-ment of mother or baby if appropriate, and support and counselling onhealthy practices.
Facility-based care: Health facilities generally provide the broadest range ofpreventive and curative treatments for maternal and newborn care andpotentially the most skilled pool of health-care workers. Medical facilitiesfall into two main categories: clinics and hospitals. Staff in the clinic, thefacility closest to the community, can often cope with uncomplicated birthsand some of the key complications – for example, manual removal of theplacenta or neonatal resuscitation. Given the potential risks associated withlabour and childbirth, staff in clinics, as well as those engaged in outreach,need the knowledge to recognize delivery complications or neonatal condi-tions that are beyond their competence and require referral to a higher level.That next level is likely to be a district hospital where doctors can offer med-ical diagnosis, treatment, care, counselling and rehabilitation services. Insome health systems there may be a referral hospital providing complex clin-ical care, but in most developing countries the facility-based health needs ofmothers and infants are met by clinics or the district hospital, if at all.
16

17
Strengthening health systems to improve maternal and newborn health
Establishing effective continua of care will involve taking practical steps to strengthen health systems. Given the particular challenges, risksand opportunities associated with pregnancy and childbirth, certain areasrequire more focused attention. These include deepening the evidence base,expanding and enhancing the health workforce, upgrading and broadeninginfrastructure and logistics, providing equitable financing solutions, stimu-lating the demand for care through social mobilization, ensuring the quality of care, and fostering political commitment and leadership through collaboration.
Step 1: Enhancing data collection and analysis
No single indicator can adequately describe the complex nature of eithermaternal or newborn health, but a variety of tools – including censuses,questionnaires, household and community surveys, and facility-based data –
4© UNICEF/HQ05-1797/Giacomo Pirozzi
can be used to capture data on a wide array of indicators. Vital informa-tion for policies and programmes includes demographics, nutritional status,socio-economic status, health-care provision, care-seeking practices and theapplication of improved health, hygiene and nutrition practices. Many part-ners, such as WHO, UNICEF and the Health Metrics Network, are devis-ing guidelines and other aids to help governments and agencies collecthealth data.
Step 2: Expanding the primary and maternal/newborn
health-care workforce
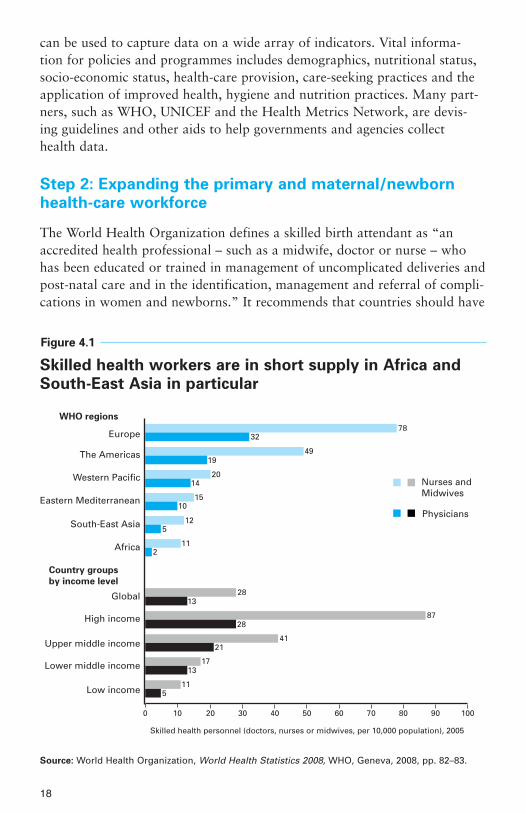
The World Health Organization defines a skilled birth attendant as “anaccredited health professional – such as a midwife, doctor or nurse – whohas been educated or trained in management of uncomplicated deliveries andpost-natal care and in the identification, management and referral of compli-cations in women and newborns.” It recommends that countries should have
18
Skilled health workers are in short supply in Africa and
South-East Asia in particular
Figure 4.1
7832
4919
2014
1510
125
112
2813
8728
4121
1713
115
Nurses and Midwives
Physicians
Europe
The Americas
Western Pacific
Eastern Mediterranean
South-East Asia
Africa
Global
High income
Upper middle income
Lower middle income
Low income
0 10 20 30 40 50 60 70 80 90 100
Country groups
by income level
WHO regions
Skilled health personnel (doctors, nurses or midwives, per 10,000 population), 2005
Source: World Health Organization, World Health Statistics 2008, WHO, Geneva, 2008, pp. 82–83.

an average of 2.28 health-care professionals per 1,000 population to achieveadequate coverage of skilled health personnel at delivery. Of the 57 countriesthat fall below this threshold, 36 are in sub-Saharan Africa. The greatestshortage of health workers in absolute terms is in Asia, especially Bangladesh,India and Indonesia, but the largest relative need is in sub-Saharan Africa,where the number of health workers must increase by 140 per cent to reachthe requisite density.
With AIDS, poverty and political insecurity fostering the migration ofhealth workers worldwide, particularly in sub-Saharan Africa, developingcountries face the challenge of devising sustainable initiatives for enhanc-ing recruitment, training and retention of skilled health personnel.Midwives or other mid-level providers who have been trained for shorterperiods and require lower entry education qualifications can form onecadre within a spectrum of health workers who can undertake differentroles, distribute workloads, and build a referral system for women and
19
Europe
The Americas
Western Pacific
Eastern Mediterranean
South East Asia
Africa
Global
High income
Upper middle income
Lower middle income
Low income
0 10 20 30 40 50 60 70
63
24
33
14
9
30
59
42
23
10
N/A
WHO regions
Country groups
by income level
Hospital beds per 10,000 population, 2005
Source: World Health Organization, World Health Statistics 2008, WHO, Geneva, 2008, pp. 82–83.
Low-income countries have only 10 hospital beds
per 10,000 people
Figure 4.2

newborns. In Mozambique, for example, midwives and nurse midwiveshave helped obstetricians provide cost-effective quality emergency obstetriccare functions in under-serviced areas, while in Peru, community healthworkers pay monthly visits to high-risk households that include childrenunder one year old, pregnant women and women of childbearing age.Several countries, such as Mali and Pakistan, have begun to broaden retention strategies, including such material incentives as accommodation,equipment and transportation in exchange for service in rural areas, andsuch non-financial benefits as short-term rotations and psychosocial support groups.
Step 3: Mobilizing societies
Supply-side measures for improving maternal and newborn health will onlybe partly successful unless complemented by stronger demand for qualityhealth care from households and communities. Social inclusion should be a priority in health-systems development, with an emphasis on includingindividual families, women and communities as partners in health-care provision.
One of the most important interventions to improve maternal and neonatalhealth is the recognition of preventable risks. Entrenched cultural attitudesand beliefs often surround pregnancy and childbirth, and women may beblamed for their own ill health and disease, as well as the mortality andmorbidity of newborns. Where stillbirths and newborn deaths are common,they may not be seen as preventable. Communities can become partners inthe promotion of their own health and well-being and that of their mothersand children. Health systems can enlist communities through inclusionrather than coercion. Policymakers in Ecuador have taken such an approachby legally integrating intercultural approaches in reproductive and sexualhealth, with the aim of encouraging greater participation of indigenouswomen in sustainable health development.
Just as health education is central to fostering better practices and behav-iours and greater knowledge for care seeking, partnerships that directlyinvolve key stakeholders in health provision are also important. In Burundi,for example, traditional birth attendants have been included in institutionaldeliveries as assistants to formal health-care workers and new mothers, whoshare food and other gifts rather than paying the attendants money.Fostering greater unity requires engaging all family members. In many soci-eties where extended kin live in close proximity, in-laws and other older rela-tives have influence in health-care decision-making. Male partners, too, haveimportant roles to play in improving maternal and newborn health.
20

Step 4: Establishing practical, equitable and sustainable
financing
Financing quality health care is a global challenge for industrialized anddeveloping countries alike. Although there are no internationally agreedthresholds on minimum spending, the Countdown to 2015 initiative has esti-mated that per capita spending of less than US$45 is insufficient to providequality basic health-care services. Among the 68 priority countries for mater-nal, newborn and child health identified by the initiative, 21 have spendingof less than US$45 per capita.
No blanket policy is likely to address the needs of each country. Carefulanalysis of the country-specific situation, alternative financing options, anddelivery strategies and barriers to access is required to support decisions onthe most appropriate course of action. Many governments, even in low-resource areas, are exploring different strategies for helping families managethe costs of routine and emergency health care.
Removing direct user charges has the potential to markedly improve access tohealth services, especially for the poor. Several countries, from Burundi toGhana to selected districts of Nepal, have already abolished or are in theprocess of eliminating some or all direct charges. The experiences of SouthAfrica and Uganda suggest that fee removal needs to be part of a broader pack-age of reforms that includes increasing budgets to offset lost revenue, maintain-ing quality and responding to increased demand. National health insuranceschemes such as Bolivia’s social insurance for maternal and child health-careservices can increase access for the poorest women but may be hard to expandin low-resource countries. Cash transfers have also provided incentives forpoorer pregnant women in such countries as Honduras, India and Mexico, butcontinued monitoring and evaluation of these innovations are needed.
The private sector has become an important health-care provider, particular-ly in Asia, but the evidence base to measure its effectiveness is still limited.The private sector is heterogeneous in nature and encompasses a variety ofproviders, including traditional healers and birth attendants, church-basedhospitals and corporate global entities. In many low-income countries, pri-vate providers work in environments where formal regulatory controls areweak. Attention to the emerging public-private mix in health systems isurgently required because inequitable financing profiles and the unregulatednature of the private sector can affect government commitments to healthcare, public confidence and socio-economic disparities. Governments face thechallenge of improving the regulation of private health-care providers, usinginternational guidelines to develop national policies that mandate minimumstandards of care.
21

Step 5: Investing in infrastructure, logistics, facilities and
management capacity
Strengthening health systems to support maternal and newborn care requiresinvesting in sectors that support essential maternity and basic health-careservices. In addition to enhancing information systems, it is also imperativeto expand human resources, foster social mobilization and establish equi-table financing, and develop infrastructure, supplies, logistics, transportationand the referral process. Greater investment in expanding and upgradinghealth-care facilities is urgently needed, particularly in low-income countries:The latest WHO estimates indicate there are just 10 hospital beds per10,000 population in low-income countries, compared with almost six timesthat number for higher-income countries. Many developing countries alsoface the challenge of improving referral systems that assess population needsand health-system capabilities, encourage active collaboration between refer-ral levels and across sectors, ensure accountability for provider performanceand develop indicators to monitor effectiveness.
Step 6: Enhancing the quality of maternal, newborn and
child care
Quality maternity care provides a minimum level of essential interventions toall pregnant and intrapartum women and neonates, while maintaining thecapacity to attend to those requiring emergency or more specialized services.Such care should strive to obtain the best possible medical outcome; satisfyproviders, patients and families; maintain sound managerial and financialperformance; and develop existing services in order to raise the standards ofcare provided to all women. While existing health systems in industrializedand middle-income countries may require reform to improve access andquality, emerging health systems can incorporate quality-of-care mechanismsinto new programmes. In Côte d’Ivoire, for example, a national programmeto integrate prevention of mother-to-child transmission of HIV into existingmaternal health services has been shown to improve the quality of care,including active management of the third stage of labour.
22

23
Working together for maternaland newborn health
For the six preceding steps to succeed, they need to be complemented by theseventh: the concerted support and commitment of health administrators andthe national leaders and international partners involved in improving mater-nal and newborn health.
Encouraging recent advances in collaboration, aid effectiveness andresources for maternal and newborn health offer the hope of strongerimprovement during the coming years. International assistance for maternal,newborn and child health increased by 64 per cent between 2003 and 2006;the work of the global health partnerships is becoming increasingly collabo-rative through such mechanisms as the Health Eight forum; and there is agrowing consensus on the frameworks for action. Recent developments –such as the Accra Agenda for Action on aid effectiveness, and the joint dec-laration by WHO, UNICEF, the United Nations Population Fund and theWorld Bank of their intent to intensify and harmonize efforts towardsachieving MDG 5 – reflect a renewed urgency towards improving maternaland newborn health.
5© UNICEF/HQ07-1151/Shehzad Noorani

Political commitment to maternal and newborn health is also growing at thehighest levels. At the 2008 G8 summit meeting, the issue of maternal mortal-ity was discussed, and the Partnership for Maternal, Newborn & ChildHealth asked leaders to increase their spending on maternal and child healthand family planning by US$10.2 billion a year. Collaborative efforts acrossthe world are resulting in stronger commitments by regional forums such asthe African Union, greater public-private cooperation, and increased align-ment and harmonization of resources, competencies and actions.
The challenge is to sustain and deepen this commitment to mothers andnewborns. A focus on evidence and results must drive efforts. There is noneed to wait for a scientific breakthrough or a new paradigm to illuminatethe best way forward. The knowledge that can save millions of newborn andmaternal lives is available; data and analysis are improving rapidly; theframework for action – the Millennium Development Goals – is set.Concrete advances have been achieved in reducing the number of deaths of
Official development assistance for maternal and neonatal health
Official development assistance for child health
0
500
1,000
1,500
2,000
2,500
3,000
3,500
4,000
2003 2004 2005 2006
US
$ (c
on
stan
t 20
05),
mill
ion
s
704
1,4151,509
2,035
2,309
548
901
1,173
Total:
2,119Total:
2,057
Total:
2,935
Total:
3,482
Official development assistance for maternal and
neonatal health has risen rapidly since 2004
Figure 5.1
Source: Greco, Giulia, et al., 'Countdown to 2015: Assessment of donor assistance to maternal,newborn, and child health between 2003 and 2006', The Lancet, vol. 371, 12 April 2008, p. 1269.
24

children during the post-neonatal period (between 29 days and five years ofage) in many developing countries. Mothers and newborns require the sameattention. Efforts now must focus on ensuring that the human and financialresources, the political will, and the commitment and collaboration increas-ingly evident nationally and internationally all remain dedicated to the taskof improving the health and survival of mothers and newborns.
25

26
SUB-SAHARAN AFRICA
INDICATOR REGION WORLD
Demographic indicators
Total population (2007) 767,218,000 6,655,406,000
Population under 18 (2007) 383,988,000 2,213,456,000
Population under 5 (2007) 127,624,000 629,106,000
Survival
Life expectancy at birth (2007) 50 68
Neonatal mortality rate (under 28 days), per 1,000 live births (2004) 41 28
Infant mortality rate (under 1), per 1,000 live births (2007) 89 47
Under-5 mortality rate, per 1,000 live births (2007) 148 68
Under-5 mortality rate, average annual rate of reduction (1990–2007) 1.3 1.8
Maternal mortality ratio, per 100,000 live births (2005, adjusted) 920 400
Health and nutrition
Percentage of infants with low birthweight (2000–2007*) 15 14
Percentage of under-5s who are moderately or severelyunderweight† (2000–2007*) 24 23
Percentage of population using improved drinking-water sources (2006) 58 87 Urban 81 96 Rural 45 78
Percentage of population using improved sanitation facilities (2006) 30 62
Percentage of 1-year-old children immunized (2007) against:Tuberculosis (BCG) 83 89Diphtheria/pertussis/tetanus (DPT3) 73 81 Polio (polio3) 74 82 Measles 73 82 Hepatitis B (hepB3) 67 65 Haemophilus influenzae type b (Hib3) 34 26
Percentage of under-5s with suspected pneumonia taken to an appropriate health-care provider (2000–2007*) 40 57 **
Education
Survival rate to the last grade of primary school (administrative data; 2000–2007*) 61 76 **
Net primary school attendance ratio (2000–2007*)Male 64 80 ** Female 61 77 **
Net secondary school attendance ratio (2000–2007*)Male 26 48 ** Female 22 44 **
Adult literacy rate (2000–2007*) 62 81

27
INDICATOR REGION WORLD
Economic indicators
GNI per capita (US$, 2007) 965 7,952
Percentage of population living on less than $1.25 a day (2005) 51 –
Percentage share of central government expenditure (1997–2006*)allocated to:
Defence – 11 Health – 14 Education – 6
Percentage share of household income (1995–2005*):Lowest 40 per cent 13 19 Highest 20 per cent 54 42
HIV/AIDS
Adult prevalence rate (15–49 years, 2007) 5.0 0.8
Estimated number of people (all ages) living with HIV (2007) 22,000,000 33,000,000
Estimated number of children (0–14 years) living with HIV (2007) 1,800,000 2,000,000
Estimated number of children (0–17 years) orphaned by AIDS (2007) 11,600,000 15,000,000
Child protection
Birth registration (2000–2007*) 37 –Urban 52 –Rural 30 –
Child marriage (1998–2007*) 40 –Urban 25 –Rural 48 –
Child labour (5–14 years, 1999–2007*) 35 n –Male 36 n –Female 34 n –
Women
Adult literacy parity rate (females as a percentage of males, 2000–2007*) 75 88
Antenatal care coverage (percentage, 2000–2007*)At least once 72 77At least four times 42 47 **
Skilled attendant at birth (percentage, 2000–2007*) 45 62
Lifetime risk of maternal death (2005) 1 in: 22 92
NOTES:
* Data refer to the most recent year available during the period specified.
** Excludes China.
– Data not available.
† Data based on new ‘WHO Child Growth Standards’.
n Excludes Nigeria.
28
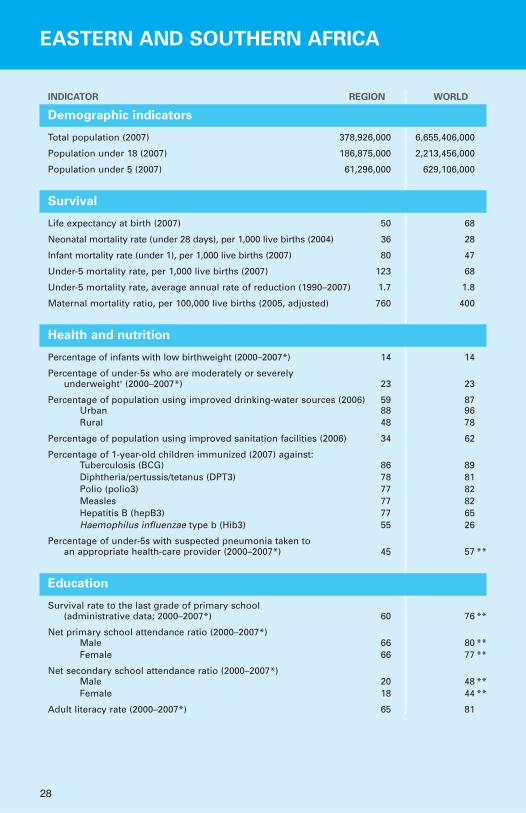
EASTERN AND SOUTHERN AFRICA
INDICATOR REGION WORLD
Demographic indicators
Total population (2007) 378,926,000 6,655,406,000
Population under 18 (2007) 186,875,000 2,213,456,000
Population under 5 (2007) 61,296,000 629,106,000
Survival
Life expectancy at birth (2007) 50 68
Neonatal mortality rate (under 28 days), per 1,000 live births (2004) 36 28
Infant mortality rate (under 1), per 1,000 live births (2007) 80 47
Under-5 mortality rate, per 1,000 live births (2007) 123 68
Under-5 mortality rate, average annual rate of reduction (1990–2007) 1.7 1.8
Maternal mortality ratio, per 100,000 live births (2005, adjusted) 760 400
Health and nutrition
Percentage of infants with low birthweight (2000–2007*) 14 14
Percentage of under-5s who are moderately or severelyunderweight† (2000–2007*) 23 23
Percentage of population using improved drinking-water sources (2006) 59 87 Urban 88 96 Rural 48 78
Percentage of population using improved sanitation facilities (2006) 34 62
Percentage of 1-year-old children immunized (2007) against:Tuberculosis (BCG) 86 89Diphtheria/pertussis/tetanus (DPT3) 78 81 Polio (polio3) 77 82 Measles 77 82 Hepatitis B (hepB3) 77 65 Haemophilus influenzae type b (Hib3) 55 26
Percentage of under-5s with suspected pneumonia taken to an appropriate health-care provider (2000–2007*) 45 57 **
Education
Survival rate to the last grade of primary school (administrative data; 2000–2007*) 60 76 **
Net primary school attendance ratio (2000–2007*)Male 66 80 ** Female 66 77 **
Net secondary school attendance ratio (2000–2007*)Male 20 48 ** Female 18 44 **
Adult literacy rate (2000–2007*) 65 81

29
INDICATOR REGION WORLD
Economic indicators
GNI per capita (US$, 2007) 1,245 7,952
Percentage of population living on less than $1.25 a day (2005) 49 –
Percentage share of central government expenditure (1997–2006*)allocated to:
Defence – 11 Health – 14 Education – 6
Percentage share of household income (1995–2005*):Lowest 40 per cent 12 19 Highest 20 per cent 58 42
HIV/AIDS
Adult prevalence rate (15–49 years, 2007) 7.8 0.8
Estimated number of people (all ages) living with HIV (2007) 16,400,000 33,000,000
Estimated number of children (0–14 years) living with HIV (2007) 1,300,000 2,000,000
Estimated number of children (0–17 years) orphaned by AIDS (2007) 8,700,000 15,000,000
Child protection
Birth registration (2000–2007*) 32 –Urban 41 –Rural 24 –
Child marriage (1998–2007*) 36 –Urban 20 –Rural 43 –
Child labour (5–14 years, 1999–2007*) 36 –Male 38 –Female 33 –
Women
Adult literacy parity rate (females as a percentage of males, 2000–2007*) 79 88
Antenatal care coverage (percentage, 2000–2007*)At least once 72 77At least four times 40 47 **
Skilled attendant at birth (percentage, 2000–2007*) 40 62
Lifetime risk of maternal death (2005) 1 in: 29 92
NOTES:
* Data refer to the most recent year available during the period specified.
** Excludes China.
– Data not available.
† Data based on new ‘WHO Child Growth Standards’.

30
WEST AND CENTRAL AFRICA
INDICATOR REGION WORLD
Demographic indicators
Total population (2007) 388,292,000 6,655,406,000
Population under 18 (2007) 197,113,000 2,213,456,000
Population under 5 (2007) 66,328,000 629,106,000
Survival
Life expectancy at birth (2007) 50 68
Neonatal mortality rate (under 28 days), per 1,000 live births (2004) 45 28
Infant mortality rate (under 1), per 1,000 live births (2007) 97 47
Under-5 mortality rate, per 1,000 live births (2007) 169 68
Under-5 mortality rate, average annual rate of reduction (1990–2007) 1.2 1.8
Maternal mortality ratio, per 100,000 live births (2005, adjusted) 1,100 400
Health and nutrition
Percentage of infants with low birthweight (2000–2007*) 15 14
Percentage of under-5s who are moderately or severelyunderweight† (2000–2007*) 24 23
Percentage of population using improved drinking-water sources (2006) 56 87 Urban 77 96 Rural 41 78
Percentage of population using improved sanitation facilities (2006) 27 62
Percentage of 1-year-old children immunized (2007) against:Tuberculosis (BCG) 80 89Diphtheria/pertussis/tetanus (DPT3) 69 81 Polio (polio3) 71 82 Measles 69 82 Hepatitis B (hepB3) 58 65 Haemophilus influenzae type b (Hib3) 16 26
Percentage of under-5s with suspected pneumonia taken to an appropriate health-care provider (2000–2007*) 37 57 **
Education
Survival rate to the last grade of primary school (administrative data; 2000–2007*) 62 76 **
Net primary school attendance ratio (2000–2007*)Male 63 80 ** Female 56 77 **
Net secondary school attendance ratio (2000–2007*)Male 31 48 ** Female 26 44 **
Adult literacy rate (2000–2007*) 60 81
31
INDICATOR REGION WORLD
Economic indicators
GNI per capita (US$, 2007) 698 7,952
Percentage of population living on less than $1.25 a day (2005) 53 –
Percentage share of central government expenditure (1997–2006*)allocated to:
Defence – 11 Health – 14 Education – 6
Percentage share of household income (1995–2005*):Lowest 40 per cent 16 19 Highest 20 per cent 48 42
HIV/AIDS
Adult prevalence rate (15–49 years, 2007) 2.6 0.8
Estimated number of people (all ages) living with HIV (2007) 5,600,000 33,000,000
Estimated number of children (0–14 years) living with HIV (2007) 480,000 2,000,000
Estimated number of children (0–17 years) orphaned by AIDS (2007) 3,000,000 15,000,000
Child protection
Birth registration (2000–2007*) 41 –Urban 57 –Rural 35 –
Child marriage (1998–2007*) 44 –Urban 28 –Rural 55 –
Child labour (5–14 years, 1999–2007*) 35 n –Male 34 n –Female 35 n –
Women
Adult literacy parity rate (females as a percentage of males, 2000–2007*) 72 88
Antenatal care coverage (percentage, 2000–2007*)At least once 71 77At least four times 44 47 **
Skilled attendant at birth (percentage, 2000–2007*) 49 62
Lifetime risk of maternal death (2005) 1 in: 17 92
NOTES:
* Data refer to the most recent year available during the period specified.
** Excludes China.
– Data not available.
† Data based on new ‘WHO Child Growth Standards’.
n Excludes Nigeria.

32
MIDDLE EAST AND NORTH AFRICA
INDICATOR REGION WORLD
Demographic indicators
Total population (2007) 389,176,000 6,655,406,000
Population under 18 (2007) 153,178,000 2,213,456,000
Population under 5 (2007) 44,789,000 629,106,000
Survival
Life expectancy at birth (2007) 69 68
Neonatal mortality rate (under 28 days), per 1,000 live births (2004) 25 28
Infant mortality rate (under 1), per 1,000 live births (2007) 36 47
Under-5 mortality rate, per 1,000 live births (2007) 46 68
Under-5 mortality rate, average annual rate of reduction (1990–2007) 3.2 1.8
Maternal mortality ratio, per 100,000 live births (2005, adjusted) 210 400
Health and nutrition
Percentage of infants with low birthweight (2000–2007*) 12 14
Percentage of under-5s who are moderately or severelyunderweight† (2000–2007*) 11 23
Percentage of population using improved drinking-water sources (2006) 87 87 Urban 94 96 Rural 78 78
Percentage of population using improved sanitation facilities (2006) 73 62
Percentage of 1-year-old children immunized (2007) against:Tuberculosis (BCG) 92 89Diphtheria/pertussis/tetanus (DPT3) 91 81 Polio (polio3) 92 82 Measles 89 82 Hepatitis B (hepB3) 89 65 Haemophilus influenzae type b (Hib3) 32 26
Percentage of under-5s with suspected pneumonia taken to an appropriate health-care provider (2000–2007*) 68 57 **
Education
Survival rate to the last grade of primary school (administrative data; 2000–2007*) 83 76 **
Net primary school attendance ratio (2000–2007*)Male 88 80 ** Female 85 77 **
Net secondary school attendance ratio (2000–2007*)Male 54 48 ** Female 52 44 **
Adult literacy rate (2000–2007*) 75 81

33
INDICATOR REGION WORLD
Economic indicators
GNI per capita (US$, 2007) 3,666 7,952
Percentage of population living on less than $1.25 a day (2005) 4 –
Percentage share of central government expenditure (1997–2006*)allocated to:
Defence 15 11 Health 5 14 Education 14 6
Percentage share of household income (1995–2005*):Lowest 40 per cent 18 19 Highest 20 per cent 45 42
HIV/AIDS
Adult prevalence rate (15–49 years, 2007) 0.3 0.8
Estimated number of people (all ages) living with HIV (2007) 480,000 33,000,000
Estimated number of children (0–14 years) living with HIV (2007) 28,000 2,000,000
Estimated number of children (0–17 years) orphaned by AIDS (2007) – 15,000,000
Child protection
Birth registration (2000–2007*) 75 –Urban 86 –Rural 67 –
Child marriage (1998–2007*) 18 –Urban 12 –Rural 23 –
Child labour (5–14 years, 1999–2007*) 9 –Male 10 –Female 8 –
Women
Adult literacy parity rate (females as a percentage of males, 2000–2007*) 78 88
Antenatal care coverage (percentage, 2000–2007*)At least once 72 77At least four times – 47 **
Skilled attendant at birth (percentage, 2000–2007*) 81 62
Lifetime risk of maternal death (2005) 1 in: 140 92
NOTES:
* Data refer to the most recent year available during the period specified.
** Excludes China.
– Data not available.
† Data based on new ‘WHO Child Growth Standards’.

34
SOUTH ASIA
INDICATOR REGION WORLD
Demographic indicators
Total population (2007) 1,567,187,000 6,655,406,000
Population under 18 (2007) 614,747,000 2,213,456,000
Population under 5 (2007) 175,250,000 629,106,000
Survival
Life expectancy at birth (2007) 64 68
Neonatal mortality rate (under 28 days), per 1,000 live births (2004) 41 28
Infant mortality rate (under 1), per 1,000 live births (2007) 59 47
Under-5 mortality rate, per 1,000 live births (2007) 78 68
Under-5 mortality rate, average annual rate of reduction (1990–2007) 2.8 1.8
Maternal mortality ratio, per 100,000 live births (2005, adjusted) 500 400
Health and nutrition
Percentage of infants with low birthweight (2000–2007*) 27 14
Percentage of under-5s who are moderately or severelyunderweight† (2000–2007*) 41 23
Percentage of population using improved drinking-water sources (2006) 87 87 Urban 94 96 Rural 84 78
Percentage of population using improved sanitation facilities (2006) 33 62
Percentage of 1-year-old children immunized (2007) against:Tuberculosis (BCG) 87 89Diphtheria/pertussis/tetanus (DPT3) 69 81 Polio (polio3) 69 82 Measles 71 82 Hepatitis B (hepB3) 29 65 Haemophilus influenzae type b (Hib3) – 26
Percentage of under-5s with suspected pneumonia taken to an appropriate health-care provider (2000–2007*) 63 57 **
Education
Survival rate to the last grade of primary school (administrative data; 2000–2007*) 72 76 **
Net primary school attendance ratio (2000–2007*)Male 81 80 ** Female 77 77 **
Net secondary school attendance ratio (2000–2007*)Male 51 48 ** Female 43 44 **
Adult literacy rate (2000–2007*) 63 81

35
INDICATOR REGION WORLD
Economic indicators
GNI per capita (US$, 2007) 889 7,952
Percentage of population living on less than $1.25 a day (2005) 40 –
Percentage share of central government expenditure (1997–2006*)allocated to:
Defence 14 11 Health 2 14 Education 5 6
Percentage share of household income (1995–2005*):Lowest 40 per cent 19 19 Highest 20 per cent 46 42
HIV/AIDS
Adult prevalence rate (15–49 years, 2007) 0.3 0.8
Estimated number of people (all ages) living with HIV (2007) 2,600,000 33,000,000
Estimated number of children (0–14 years) living with HIV (2007) 110,000 2,000,000
Estimated number of children (0–17 years) orphaned by AIDS (2007) – 15,000,000
Child protection
Birth registration (2000–2007*) 36 –Urban 52 –Rural 30 –
Child marriage (1998–2007*) 49 –Urban 32 –Rural 58 –
Child labour (5–14 years, 1999–2007*) 13 –Male 13 –Female 12 –
Women
Adult literacy parity rate (females as a percentage of males, 2000–2007*) 71 88
Antenatal care coverage (percentage, 2000–2007*)At least once 68 77At least four times 34 47 **
Skilled attendant at birth (percentage, 2000–2007*) 41 62
Lifetime risk of maternal death (2005) 1 in: 59 92
NOTES:
* Data refer to the most recent year available during the period specified.
** Excludes China.
– Data not available.
† Data based on new ‘WHO Child Growth Standards’.

36
EAST ASIA AND PACIFIC
INDICATOR REGION WORLD
Demographic indicators
Total population (2007) 1,984,273,000 6,655,406,000
Population under 18 (2007) 559,872,000 2,213,456,000
Population under 5 (2007) 144,441,000 629,106,000
Survival
Life expectancy at birth (2007) 72 68
Neonatal mortality rate (under 28 days), per 1,000 live births (2004) 18 28
Infant mortality rate (under 1), per 1,000 live births (2007) 22 47
Under-5 mortality rate, per 1,000 live births (2007) 27 68
Under-5 mortality rate, average annual rate of reduction (1990–2007) 4.3 1.8
Maternal mortality ratio, per 100,000 live births (2005, adjusted) 150 400
Health and nutrition
Percentage of infants with low birthweight (2000–2007*) 6 14
Percentage of under-5s who are moderately or severelyunderweight† (2000–2007*) 11 23
Percentage of population using improved drinking-water sources (2006) 88 87 Urban 96 96 Rural 81 78
Percentage of population using improved sanitation facilities (2006) 66 62
Percentage of 1-year-old children immunized (2007) against:Tuberculosis (BCG) 93 89Diphtheria/pertussis/tetanus (DPT3) 89 81 Polio (polio3) 91 82 Measles 90 82 Hepatitis B (hepB3) 87 65 Haemophilus influenzae type b (Hib3) 2 26
Percentage of under-5s with suspected pneumonia taken to an appropriate health-care provider (2000–2007*) 65** 57 **
Education
Survival rate to the last grade of primary school (administrative data; 2000–2007*) 80** 76 **
Net primary school attendance ratio (2000–2007*)Male 92** 80 ** Female 92** 77 **
Net secondary school attendance ratio (2000–2007*)Male 60** 48 ** Female 63** 44 **
Adult literacy rate (2000–2007*) 93 81

37
INDICATOR REGION WORLD
Economic indicators
GNI per capita (US$, 2007) 2,742 7,952
Percentage of population living on less than $1.25 a day (2005) 17 –
Percentage share of central government expenditure (1997–2006*)allocated to:
Defence 11 11 Health 1 14 Education 7 6
Percentage share of household income (1995–2005*):Lowest 40 per cent 16 19 Highest 20 per cent 46 42
HIV/AIDS
Adult prevalence rate (15–49 years, 2007) 0.2 0.8
Estimated number of people (all ages) living with HIV (2007) 2,400,000 33,000,000
Estimated number of children (0–14 years) living with HIV (2007) 41,000 2,000,000
Estimated number of children (0–17 years) orphaned by AIDS (2007) – 15,000,000
Child protection
Birth registration (2000–2007*) 72** –Urban 81** –Rural 67** –
Child marriage (1998–2007*) 19** –Urban 12** –Rural 25** –
Child labour (5–14 years, 1999–2007*) 10** –Male 11** –Female 10** –
Women
Adult literacy parity rate (females as a percentage of males, 2000–2007*) 93 88
Antenatal care coverage (percentage, 2000–2007*)At least once 89 77At least four times 66** 47 **
Skilled attendant at birth (percentage, 2000–2007*) 87 62
Lifetime risk of maternal death (2005) 1 in: 350 92
NOTES:
* Data refer to the most recent year available during the period specified.
** Excludes China.
– Data not available.
† Data based on new ‘WHO Child Growth Standards’.
LATIN AMERICA AND CARIBBEAN
38
INDICATOR REGION WORLD
Demographic indicators
Total population (2007) 566,646,000 6,655,406,000
Population under 18 (2007) 197,226,000 2,213,456,000
Population under 5 (2007) 55,622,000 629,106,000
Survival
Life expectancy at birth (2007) 73 68
Neonatal mortality rate (under 28 days), per 1,000 live births (2004) 13 28
Infant mortality rate (under 1), per 1,000 live births (2007) 22 47
Under-5 mortality rate, per 1,000 live births (2007) 26 68
Under-5 mortality rate, average annual rate of reduction (1990–2007) 4.4 1.8
Maternal mortality ratio, per 100,000 live births (2005, adjusted) 130 400
Health and nutrition
Percentage of infants with low birthweight (2000–2007*) 9 14
Percentage of under-5s who are moderately or severelyunderweight† (2000–2007*) 5 23
Percentage of population using improved drinking-water sources (2006) 92 87 Urban 97 96 Rural 73 78
Percentage of population using improved sanitation facilities (2006) 79 62
Percentage of 1-year-old children immunized (2007) against:Tuberculosis (BCG) 96 89Diphtheria/pertussis/tetanus (DPT3) 92 81 Polio (polio3) 93 82 Measles 93 82 Hepatitis B (hepB3) 89 65 Haemophilus influenzae type b (Hib3) 90 26
Percentage of under-5s with suspected pneumonia taken to an appropriate health-care provider (2000–2007*) – 57 **
Education
Survival rate to the last grade of primary school (administrative data; 2000–2007*) 84 76 **
Net primary school attendance ratio (2000–2007*)Male 90 80 ** Female 91 77 **
Net secondary school attendance ratio (2000–2007*)Male – 48 ** Female – 44 **
Adult literacy rate (2000–2007*) 91 81

39
INDICATOR REGION WORLD
Economic indicators
GNI per capita (US$, 2007) 5,628 7,952
Percentage of population living on less than $1.25 a day (2005) 8 –
Percentage share of central government expenditure (1997–2006*)allocated to:
Defence 4 11 Health 7 14 Education 14 6
Percentage share of household income (1995–2005*):Lowest 40 per cent 11 19 Highest 20 per cent 56 42
HIV/AIDS
Adult prevalence rate (15–49 years, 2007) 0.6 0.8
Estimated number of people (all ages) living with HIV (2007) 1,900,000 33,000,000
Estimated number of children (0–14 years) living with HIV (2007) 55,000 2,000,000
Estimated number of children (0–17 years) orphaned by AIDS (2007) – 15,000,000
Child protection
Birth registration (2000–2007*) 89 –Urban 92 –Rural 82 –
Child marriage (1998–2007*) – –Urban – –Rural – –
Child labour (5–14 years, 1999–2007*) 11 –Male 11 –Female 10 –
Women
Adult literacy parity rate (females as a percentage of males, 2000–2007*) 99 88
Antenatal care coverage (percentage, 2000–2007*)At least once 94 77At least four times 83 47 **
Skilled attendant at birth (percentage, 2000–2007*) 85 62
Lifetime risk of maternal death (2005) 1 in: 280 92
NOTES:
* Data refer to the most recent year available during the period specified.
** Excludes China.
– Data not available.
† Data based on new ‘WHO Child Growth Standards’.

40
CENTRAL AND EASTERN EUROPE/COMMONWEALTH OF INDEPENDENT STATES
INDICATOR REGION WORLD
Demographic indicators
Total population (2007) 405,992,000 6,655,406,000
Population under 18 (2007) 100,110,000 2,213,456,000
Population under 5 (2007) 26,458,000 629,106,000
Survival
Life expectancy at birth (2007) 68 68
Neonatal mortality rate (under 28 days), per 1,000 live births (2004) 16 28
Infant mortality rate (under 1), per 1,000 live births (2007) 22 47
Under-5 mortality rate, per 1,000 live births (2007) 25 68
Under-5 mortality rate, average annual rate of reduction (1990–2007) 4.4 1.8
Maternal mortality ratio, per 100,000 live births (2005, adjusted) 46 400
Health and nutrition
Percentage of infants with low birthweight (2000–2007*) 6 14
Percentage of under-5s who are moderately or severelyunderweight† (2000–2007*) – 23
Percentage of population using improved drinking-water sources (2006) 94 87 Urban 99 96 Rural 86 78
Percentage of population using improved sanitation facilities (2006) 89 62
Percentage of 1-year-old children immunized (2007) against:Tuberculosis (BCG) 96 89Diphtheria/pertussis/tetanus (DPT3) 96 81 Polio (polio3) 97 82 Measles 97 82 Hepatitis B (hepB3) 96 65 Haemophilus influenzae type b (Hib3) 23 26
Percentage of under-5s with suspected pneumonia taken to an appropriate health-care provider (2000–2007*) 57 57 **
Education
Survival rate to the last grade of primary school (administrative data; 2000–2007*) 96 76 **
Net primary school attendance ratio (2000–2007*)Male 93 80 ** Female 91 77 **
Net secondary school attendance ratio (2000–2007*)Male 79 48 ** Female 76 44 **
Adult literacy rate (2000–2007*) 97 81

41
INDICATOR REGION WORLD
Economic indicators
GNI per capita (US$, 2007) 5,686 7,952
Percentage of population living on less than $1.25 a day (2005) 4 –
Percentage share of central government expenditure (1997–2006*)allocated to:
Defence 9 11 Health 7 14 Education 6 6
Percentage share of household income (1995–2005*):Lowest 40 per cent 20 19 Highest 20 per cent 42 42
HIV/AIDS
Adult prevalence rate (15–49 years, 2007) 0.8 0.8
Estimated number of people (all ages) living with HIV (2007) 1,500,000 33,000,000
Estimated number of children (0–14 years) living with HIV (2007) 11,000 2,000,000
Estimated number of children (0–17 years) orphaned by AIDS (2007) – 15,000,000
Child protection
Birth registration (2000–2007*) 92 –Urban 93 –Rural 92 –
Child marriage (1998–2007*) 11 –Urban 11 –Rural 13 –
Child labour (5–14 years, 1999–2007*) 5 –Male 5 –Female 5 –
Women
Adult literacy parity rate (females as a percentage of males, 2000–2007*) 97 88
Antenatal care coverage (percentage, 2000–2007*)At least once 90 77At least four times – 47 **
Skilled attendant at birth (percentage, 2000–2007*) 94 62
Lifetime risk of maternal death (2005) 1 in: 1,300 92
NOTES:
* Data refer to the most recent year available during the period specified.
** Excludes China.
– Data not available.
† Data based on new ‘WHO Child Growth Standards’.

42
INDUSTRIALIZED COUNTRIES
INDICATOR REGION WORLD
Demographic indicators
Total population (2007) 974,913,000 6,655,406,000
Population under 18 (2007) 204,334,000 2,213,456,000
Population under 5 (2007) 54,922,000 629,106,000
Survival
Life expectancy at birth (2007) 79 68
Neonatal mortality rate (under 28 days), per 1,000 live births (2004) 3 28
Infant mortality rate (under 1), per 1,000 live births (2007) 5 47
Under-5 mortality rate, per 1,000 live births (2007) 6 68
Under-5 mortality rate, average annual rate of reduction (1990–2007) 3.0 1.8
Maternal mortality ratio, per 100,000 live births (2005, adjusted) 8 400
Health and nutrition
Percentage of infants with low birthweight (2000–2007*) 7 14
Percentage of under-5s who are moderately or severelyunderweight† (2000–2007*) – 23
Percentage of population using improved drinking-water sources (2006) 100 87 Urban 100 96 Rural 98 78
Percentage of population using improved sanitation facilities (2006) 100 62
Percentage of 1-year-old children immunized (2007) against:Tuberculosis (BCG) – 89Diphtheria/pertussis/tetanus (DPT3) 96 81 Polio (polio3) 94 82 Measles 93 82 Hepatitis B (hepB3) 65 65 Haemophilus influenzae type b (Hib3) 84 26
Percentage of under-5s with suspected pneumonia taken to an appropriate health-care provider (2000–2007*) – 57 **
Education
Survival rate to the last grade of primary school (administrative data; 2000–2007*) 97 76 **
Net primary school attendance ratio (2000–2007*)Male – 80 ** Female – 77 **
Net secondary school attendance ratio (2000–2007*)Male – 48 ** Female – 44 **
Adult literacy rate (2000–2007*) – 81

43
INDICATOR REGION WORLD
Economic indicators
GNI per capita (US$, 2007) 38,579 7,952
Percentage of population living on less than $1.25 a day (2005) – –
Percentage share of central government expenditure (1997–2006*)allocated to:
Defence 12 11 Health 18 14 Education 4 6
Percentage share of household income (1995–2005*):Lowest 40 per cent 20 19 Highest 20 per cent 40 42
HIV/AIDS
Adult prevalence rate (15–49 years, 2007) 0.3 0.8
Estimated number of people (all ages) living with HIV (2007) 2,000,000 33,000,000
Estimated number of children (0–14 years) living with HIV (2007) 5,800 2,000,000
Estimated number of children (0–17 years) orphaned by AIDS (2007) – 15,000,000
Child protection
Birth registration (2000–2007*) – –Urban – –Rural – –
Child marriage (1998–2007*) – –Urban – –Rural – –
Child labour (5–14 years, 1999–2007*) – –Male – –Female – –
Women
Adult literacy parity rate (females as a percentage of males, 2000–2007*) – 88
Antenatal care coverage (percentage, 2000–2007*)At least once – 77At least four times – 47 **
Skilled attendant at birth (percentage, 2000–2007*) – 62
Lifetime risk of maternal death (2005) 1 in: 8,000 92
NOTES:
* Data refer to the most recent year available during the period specified.
** Excludes China.
– Data not available.
† Data based on new ‘WHO Child Growth Standards’.
44
DEVELOPING COUNTRIES
INDICATOR REGION WORLD
Demographic indicators
Total population (2007) 5,432,837,000 6,655,406,000
Population under 18 (2007) 1,962,419,000 2,213,456,000
Population under 5 (2007) 562,128,000 629,106,000
Survival
Life expectancy at birth (2007) 67 68
Neonatal mortality rate (under 28 days), per 1,000 live births (2004) 31 28
Infant mortality rate (under 1), per 1,000 live births (2007) 51 47
Under-5 mortality rate, per 1,000 live births (2007) 74 68
Under-5 mortality rate, average annual rate of reduction (1990–2007) 1.9 1.8
Maternal mortality ratio, per 100,000 live births (2005, adjusted) 450 400
Health and nutrition
Percentage of infants with low birthweight (2000–2007*) 15 14
Percentage of under-5s who are moderately or severelyunderweight† (2000–2007*) 24 23
Percentage of population using improved drinking-water sources (2006) 84 87 Urban 94 96 Rural 76 78
Percentage of population using improved sanitation facilities (2006) 53 62
Percentage of 1-year-old children immunized (2007) against:Tuberculosis (BCG) 89 89Diphtheria/pertussis/tetanus (DPT3) 80 81 Polio (polio3) 81 82 Measles 81 82 Hepatitis B (hepB3) 65 65 Haemophilus influenzae type b (Hib3) 21 26
Percentage of under-5s with suspected pneumonia taken to an appropriate health-care provider (2000–2007*) 57** 57 **
Education
Survival rate to the last grade of primary school (administrative data; 2000–2007*) 74** 76 **
Net primary school attendance ratio (2000–2007*)Male 80** 80 ** Female 77** 77 **
Net secondary school attendance ratio (2000–2007*)Male 48** 48 ** Female 43** 44 **
Adult literacy rate (2000–2007*) 79 81

45
INDICATOR REGION WORLD
Economic indicators
GNI per capita (US$, 2007) 2,405 7,952
Percentage of population living on less than $1.25 a day (2005) 25 –
Percentage share of central government expenditure (1997–2006*)allocated to:
Defence 10 11 Health 3 14 Education 9 6
Percentage share of household income (1995–2005*):Lowest 40 per cent 15 19 Highest 20 per cent 50 42
HIV/AIDS
Adult prevalence rate (15–49 years, 2007) 0.9 0.8
Estimated number of people (all ages) living with HIV (2007) 29,500,000 33,000,000
Estimated number of children (0–14 years) living with HIV (2007) 2,000,000 2,000,000
Estimated number of children (0–17 years) orphaned by AIDS (2007) – 15,000,000
Child protection
Birth registration (2000–2007*) 50** –Urban 65** –Rural 39** –
Child marriage (1998–2007*) 36** –Urban 22** –Rural 46** –
Child labour (5–14 years, 1999–2007*) 16*** –Male 17*** –Female 15*** –
Women
Adult literacy parity rate (females as a percentage of males, 2000–2007*) 86 88
Antenatal care coverage (percentage, 2000–2007*)At least once 77 77At least four times 46** 47 **
Skilled attendant at birth (percentage, 2000–2007*) 61 62
Lifetime risk of maternal death (2005) 1 in: 76 92
NOTES:
* Data refer to the most recent year available during the period specified.
** Excludes China.
*** Excludes China and Nigeria.
– Data not available.
† Data based on new ‘WHO Child Growth Standards’.
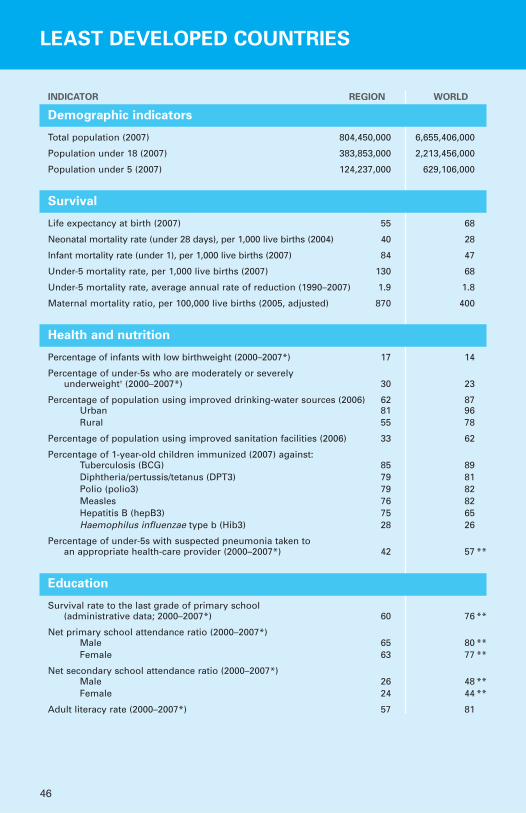
46
LEAST DEVELOPED COUNTRIES
INDICATOR REGION WORLD
Demographic indicators
Total population (2007) 804,450,000 6,655,406,000
Population under 18 (2007) 383,853,000 2,213,456,000
Population under 5 (2007) 124,237,000 629,106,000
Survival
Life expectancy at birth (2007) 55 68
Neonatal mortality rate (under 28 days), per 1,000 live births (2004) 40 28
Infant mortality rate (under 1), per 1,000 live births (2007) 84 47
Under-5 mortality rate, per 1,000 live births (2007) 130 68
Under-5 mortality rate, average annual rate of reduction (1990–2007) 1.9 1.8
Maternal mortality ratio, per 100,000 live births (2005, adjusted) 870 400
Health and nutrition
Percentage of infants with low birthweight (2000–2007*) 17 14
Percentage of under-5s who are moderately or severelyunderweight† (2000–2007*) 30 23
Percentage of population using improved drinking-water sources (2006) 62 87 Urban 81 96 Rural 55 78
Percentage of population using improved sanitation facilities (2006) 33 62
Percentage of 1-year-old children immunized (2007) against:Tuberculosis (BCG) 85 89Diphtheria/pertussis/tetanus (DPT3) 79 81 Polio (polio3) 79 82 Measles 76 82 Hepatitis B (hepB3) 75 65 Haemophilus influenzae type b (Hib3) 28 26
Percentage of under-5s with suspected pneumonia taken to an appropriate health-care provider (2000–2007*) 42 57 **
Education
Survival rate to the last grade of primary school (administrative data; 2000–2007*) 60 76 **
Net primary school attendance ratio (2000–2007*)Male 65 80 ** Female 63 77 **
Net secondary school attendance ratio (2000–2007*)Male 26 48 ** Female 24 44 **
Adult literacy rate (2000–2007*) 57 81

47
INDICATOR REGION WORLD
Economic indicators
GNI per capita (US$, 2007) 491 7,952
Percentage of population living on less than $1.25 a day (2005) 54 –
Percentage share of central government expenditure (1997–2006*)allocated to:
Defence 14 11 Health 5 14 Education 14 6
Percentage share of household income (1995–2005*):Lowest 40 per cent 15 19 Highest 20 per cent 50 42
HIV/AIDS
Adult prevalence rate (15–49 years, 2007) 2.2 0.8
Estimated number of people (all ages) living with HIV (2007) 10,000,000 33,000,000
Estimated number of children (0–14 years) living with HIV (2007) 900,000 2,000,000
Estimated number of children (0–17 years) orphaned by AIDS (2007) – 15,000,000
Child protection
Birth registration (2000–2007*) 29 –Urban 42 –Rural 25 –
Child marriage (1998–2007*) 49 –Urban 37 –Rural 55 –
Child labour (5–14 years, 1999–2007*) 30 –Male 31 –Female 28 –
Women
Adult literacy parity rate (females as a percentage of males, 2000–2007*) 72 88
Antenatal care coverage (percentage, 2000–2007*)At least once 64 77At least four times 32 47 **
Skilled attendant at birth (percentage, 2000–2007*) 39 62
Lifetime risk of maternal death (2005) 1 in: 24 92
NOTES:
* Data refer to the most recent year available during the period specified.
** Excludes China.
– Data not available.
† Data based on new ‘WHO Child Growth Standards’.

Notes


United Nations Children’s Fund
3 UN Plaza, New York, NY 10017, [email protected]
Design and prepress production: Prographics, Inc.
ISBN: 978-92-806-4321-3
© United Nations Children’s Fund (UNICEF)
December 2008
The State of the World’s Children 2009 examines criticalissues in maternal and newborn health, underscoring the need to establish comprehensive continua of care formothers, newborns and children. The report outlines key paradigms in health programming and policies formothers and newborns, and examines partnerships andcollaborative initiatives aimed at improving maternaland neonatal health. Africa and Asia are a key focus forthis report, which complements the previous year’s issueon child survival.