
MATERIALS LABORATORY · ELECTRICAL SYSTEMS DIAGNOSTIC STUDY ... Frederick W. Jones Donald C....
122
I TECHNICAL REPORT NO. 10717 ELECTRICAL SYSTEMS DIAGNOSTIC STUDY FOR WHEELED VEHICLES M151, M44, M37, M715 M705, M651, and M39 IA Final Report • • September 1, 1969 Af Contract No. DAAE07-67-C-1563!P006 I4 Frederick W. Jones Donald C. Ramsburg , ,, ,,m -.-- m m--,- - .,• •€Charlie A. Sheppard Westinghouse Electric Corporation Product Support Equipment Department VEHICULAR COMPONENTS & MATERIALS LABORATORY :• S~Distribution of this document is unlimited. ------ --
Transcript of MATERIALS LABORATORY · ELECTRICAL SYSTEMS DIAGNOSTIC STUDY ... Frederick W. Jones Donald C....
I
TECHNICAL REPORT NO. 10717
ELECTRICAL SYSTEMS DIAGNOSTIC STUDY
FOR WHEELED VEHICLES M151, M44, M37, M715
M705, M651, and M39
IA
Final Report • •
September 1, 1969 Af
Contract No. DAAE07-67-C-1563!P006
I4
Frederick W. JonesDonald C. Ramsburg
, ,, ,,m -.-- m m--,- - .,• •€Charlie A. Sheppard
Westinghouse Electric Corporation
Product Support Equipment Department
VEHICULAR COMPONENTS & MATERIALS LABORATORY :•
S~Distribution of this document is unlimited.
------ --
The findings in this report are not to be
construed as an official Department of the
Army position, unless so designated by
other authorized documents.
The citation of commercial productsin this report does not constitute an
official indorsement or approval of
such products.
Distribution of this document isunlimited.
Destroy this report when it is no longer needed.Do not return it to the originator.

ELECTRICAL SYSTEMS DIAGNOSTIC STUDY FOR
WHEELED VEHICLES
M151, M44, M37, M715, M705, M651, M39
Frederick W. Jones, Donald C. Ramsburg and Charlie A. SheppardProduct Support Equipment Department,
Westinghouse Electric Corporation
Final Technical ReportContract No. DAAE 07- 67-C- 1563/P006
Vehicular Components and Materials LaboratoryU. S. Army Tank Automotive Command
Warren, Michigan
Distribution of this document is unlimited.
ABSTRACT
The final report describes the results of a study undertaken by Westinghouse for
USATACOM on the organizational maintenance of US Army wheeled vehicles. Spe-
cifically, the study was addressed to automatic test equipment fault-isolation pro-
cedures for the vehicle electrical system; engine malfunctions were not diagnosed.
Valid diagnostic techniques developed in this study program will eliminate clas-
sical troubleshooting by unskilled personnel and assist operator judgment in pin-
pointing faulty components in the field.

FOREWORD
The study was conducted from January 1969 to July 1969 under the auspices of
USATACOM and was funded under contract number DAAE07-67-C-1563/P006.
The authors wish to acknowledge the aid and assistance of Messrs. F. S. Restivo,
Fellow Engineer and W. L Hrybyk, Senior Engineer, of Westinghouse PSED, without
whom this Final Report would have been a much more difficult task.
li
TABLE OF CONTENTS
Section Page
ABSTRACT ........................................ i
FOREWORD ....................................... ii
I INTRODUCTION .................................... 1
I OBJECTIVE ....................................... • 2
III APPROACH TO PROBLEM ............................. 3
A. THE PROBLEMS ................................ 3
B. THE APPROACH ................................ 3
C. POSITION SUMMARY ............................. 4
IV METHODS OF SOLUTION .............................. 7
A. PHASE 1- FAMILIARIZATION ...................... 7
B. PHASE 2- TEST PROCEDURES ......................... 8
C. PHASE 3 - FINAL REPORT ......................... 9
V TECHNICAL DISCUSSION .............................. 10
A. TEST APPROACH ............................... 10
B. OPTIMAL TEST PROCEDURES ...................... 14
1. Battery Subsystem ........................... 14
2. Starter Subsystem ........................... 21
3. Electric Fuel Pump Subsystem ................... 25
4. Ignition Subsystem ............................ 30
5. Generator-Regulator Subsystem .................. 46
C. TEST EQUIPMENT .. ............................ 49
1. Battery Subsystem ........................... 50
2. Starter Subsystem ........................... 50
3. Electric Fuel Pump Subsystem ................... 50
iii

TABLE OF CONTENTS (Continued)
Section Page
4. Ignition Subsystem ............................ 52
5. Generator-Regulator Subsystem ................... 62
VI CONCLUSIONS AND RECOMMENDATIONS .................... 64
A. FEASIBILITY OF AUTOMATIC TEST EQUIPMENT ............ 64
B. FUTURE AUTOMATIC TEST EQUIPMENT DEVELOPMENT .... 64
C. FUTURE BUILT-IN TEST POINTS ..................... 65
D. SECONDARY SUBSYSTEMS .......................... 66
E. TEST PROCEDURES IMPLEMENTATION ................ 66
APPENDIX A. SUBSYSTEM SCHEMATIC DIAGRAMS ................ 70
APPENDIX B. TEST POINT ANALYSIS ......................... 76
APPENDIX C. FAATE CHARTS .............................. 81
APPENDIX D. COMPUTER-PROGRAMMED FAATE CHARTS ............. 105
APPENDIX E. SAMPLES OF FAULT ISOLATION ................... 116
APPENDIX F. COMPONENT ISOLATION LEVEL AND HOOKUP REQUIRED. 123
APPENDIX G. SELECTED BIBLIOGRAPHY ...................... 126
DISTRIBUTION LIST ....................................... 135
LIST OF ILLUSTRATIONS
Number Title Page
2-1. Optimum Test Sequence Block Diagram ..................... 5/6
4-1. Test Operation Block Diagram ........................... 12/13
4-2. Battery Subsystem Test Sequence ......................... 15
4-3. Battery Subsystem Sequential Flow Logic Diagram .............. 17/18
4-4. Starter Subsystem Test Sequence ......................... 22
4-5. Starter Subsystem Sequential Flow Logic Diagram ................. 24
4-6. Electric Fuel Pump Subsystem Test Sequence ................. 26
iv

'LIST OF ILLUSTRATIONS (Continued)
Number Title Page
4-7. Electric Fuel Pump Subsystem Sequential Flow Logic Diagram ..... 28
4-8. Ignition Subsystem Test Sequence ......................... 32/33
4-9. Ignition Subsystem Sequential Flow Logic .................... 35/36
4-9A. Ignition Subsystem Sequential Flow Logic Diagram .............. 37/38
4-10. Generator-Regulator Subsystem Test Sequence ................... 47
4-11. Generator-Regulator Subsystem Sequential Flow Logic Diagram ..... 48
4-12. Battery Test Clamp .................................. 51
4-13. Terminal Probe ..................................... 52
4-14. Breaker Point Interface ................................ 52
4-15. Tachometer/Dwellmeter ............................... 55
4-16. DC Measurement Interface ............................. 56
4-17. Capacitance Measurement .............................. 57/58
4-18. Peak-Reading Kilovoltmeter ............................. 60
4-19. Firing Order Verifier ................................. 61
4-20. Generator Test Adapter ................................ 62
4-21. Regulator Test Adapter ................................ 63
5-1. Vehicle Diagnostics Automatic Test Equipment Block Diagram ...... 68/69
A-1. Battery Subsystem M151 Vehicle ......................... 71
A-2. Starter Subsystem M151 Vehicle . ......................... 72
A-3. Electric Fuel Pump Subsystem M151 Vehicle .................... 73
A-4. Ignition Subsystem M151 Vehicle .......................... 74
A-5. Generator-Regulator Subsystem M151 Vehicle .................... 75
C-i. Battery and Starter Subsystem FAATE Chart .................... 82
C-2. Ignition Subsystem FAATE Chart ......................... 88
C-3. Generator-Regulator Subsystems FAATE Chart .................. 97
E-1. Fault Isolation Test Flow Diagram of Generator-Regulator Subsystem,Sam ple 1 ......................................... 118
E-2. Sequential Flow Logic Diagram of Ignition System, Sample 2 ...... 119/120
v/vi

I. INTRODUCTION
Organizational or user maintenance of Army wheeled vehicles is presently being
performed by relatively unskilled mechanics. Troubleshooting of malfunctioning
vehicles is done by parts replacement. Over 50 percent of the components removed
from the vehicle are not defective. This high turnover of nondefective parts has made
it desirable to investigate fault isolation test procedures which could be used with auto-
matic test equipment.
Westinghouse PSED's experience in development, design, and manufacture of
complex electronic test equipment including computer-controlled test systems pro-
vided the necessary background for undertaking this study. Together with techniques
developed under Westinghouse Project FAATE (Fault Analyzing Automatic Test
Equipment), this background was utilized in a three-phase approach to the study:
Phase 1 - Familiarization, Phase 2 - Test Procedures, and Phase 3 - Final Report.
This final report consists of six sections plus appendixes. Summaries of the
study approach, the test results and the conclusions and recommendations are con-
tained in Section 2. The greatest significance emerging from this study is that the
diagnostic routines used with automatic test equipment are ideally suited to Army
wheeled vehicles.
1

II. OBJECTIVE
The objective of this study was to determine optimum fault isolation test proce-
dures for wheeled vehicle spark ignition electrical systems and recommend imple-
mentation into automatic test equipment. The procedures were to be based on existing
and proven automotive test techniques and were to be organized for minimum operator/
mechanic interaction and decision making.
2
HI. APPROACH TO PROBLEM
A. THE PROBLEMS
The problems to which Westinghouse PSED addressed itself were:
1. How to apply techniques to pinpoint faulty components in a vehicle's elec-
trical system;
2. How to assist or reinforce operator judgement;
3. How to perform valid diagnostic techniques which will eliminate classical
troubleshooting by unskilled personnel;
4. How to do all these with a minimum number of vehicle connections and
sensors.
These problems were isolated to the electrical system of a wheeled vehicle and
did not include engine malfunctions per se. With these parameters in mind and the
solutions to these problems as our goals, we began the study.
B. THE APPROACH
A three-phase approach was undertaken: 1) familiarize - PSED with Army
wheeled vehicles and existing test techniques, 2) generate optimum test procedures,
and 3) organize study information for presentation in this final report.
Two major problems in determining the optimum test procedures were: 1) inter-
facing with the vehicles sealed electrical system and 2) using test measurements which
would not require operator interpretation. These problems were approached by first
performing a test point analysis on the vehicle using the present vehicle configuration
to determine what information was available. From the test point analysis data, tests
were then devised using our FAATE technique for fault isolation. Finally, tradeoffs

were made to incorporate automatic test equipment techniques. The final test proce-
dures are therefore compatible with both the existing vehicle configuration and existing
automatic test equipment.
In determining the optimum test sequence, vehicle operating conditions for sub-
system tests, subsystem test priority (i. e., what subsystem operational functions
should be checked before other subsystems) and interface requirements were summa-
rized. The result is shown in figure 2-1, Optimum Test Sequence Block Diagram.
C. POSITION SUMMARY
These procedures have been designed for direct implementation into automatic
test equipment; automatic test equipment is feasible for wheeled vehicle diagnostic
testing.
Areas recommended for further study and development for automatic test equip-
ment are:
"* battery testing,
"* ignition primary and secondary waveform analysis, and
"* test measurement limits.
To aid in testing and in vehicle/test equipment interface, built-in diagnostic
harnesses, more-accessible starter switch terminals, and an ignition secondary test
point are recommended. Also, vehicle main lighting, direction signals, instruments
and horn should be tested utilizing visual, aural or circuit check techniques. Specific
test procedures have not been designed for these subsystems.
4

IV. METHODS OF SOLUTION
The study required three phases to provide adequate coverage of the diagnostics
problem and of the generation of fault isolation procedures: Phase 1 - Familiarization,
Phase 2 - Test Procedures, and Phase 3 - Final Report.
A. PHASE 1 - FAMILIARIZATION
The first step undertaken in this study was to familiarize ourselves with the
Army's Dash 20 manual (Organizational Maintenance) for the M151 Vehicle. Test
procedures, component locations, replacement level, repair level and maintenance
for the electrical system described in the Dash 20 manual were reviewed and analyzed
in detail.
Simplified subsystem schematic diagrams were generated for use in our functional
analysis of each subsystem. These schematic diagrams are presented separately in
Appendix A. All those components replaceable at organization level were then sub-
jected to a functional parameter analysis.
A functional parameter analysis approach was used in lieu of a failure mode an-
alysis to take advantage of the fault isolation technique developed under Westinghouse
Project FAATE. This approach is to analyze a system for the presence of functional
parameters within limits and then track erroneous outputs back to the malfunctioning
component. Failure mode analysis was utilized only when output measurements had to
be analyzed (in lieu of checking for presence of output within certain limits) in dis-
crete steps. The failure of a spark plug was such a case. A fouled plug was analyzed
as to firing voltage and voltage variation under different stages of fouling.
The existing electrical system test points were then analyzed for output informa-
tion available, accessibility, interface required and usefulness. A summary of this
7

analysis, plus a similar analysis summary for desirable test points, is contained in
Appendix B.
During Phase 1 and throughout the study, Automotive Diagnostic Centers were
visited and testing techniques discussed with the operators. These visits in combina-
tion with texts on automotive operation and repair, and contact with manufacturers and
users in the automotive industry, rounded out our familiarization phase. References
are contained in Appendix G, Selected Bibliography.
B. PHASE 2 - TEST PROCEDURES
Upon completion of Phase 1, we began generation of optimal fault isolation FAATE
charts. The first generation was based on the premises that all necessary test points
and test equipments were available. Succeeding generations contained tradeoffs to
make the procedures compatible with the existing vehicle configuration and available
test equipment. The final generation of FAATE charts is contained in Appendix C.
The FAATE chart for the Starter and Battery Subsystems was programmed for
use on a time-shared computer terminal. This program demonstrates the fault isola-
tion capabilities of the procedures, and also how a test system (not recommended for
Army organizational maintenance) could be implemented for operator direction. The
program and samples of fault isolation make up Appendix D.
During generation of the FAATE charts, compatibility tradeoffs were continually
being made. Many of these tradeoffs directly resulted from analysis of existing test
methods and equipment. To ensure that our techniques could be used with present day
(classical) testing techniques these procedures were verified for compatibility.
To complete Phase 2 and prepare for written descriptions of our procedures,
sequential flow logic diagrams were produced by tabulating FAATE charts and mapping
the test flow. These logic diagrams utilize logical AND and OR gates in conjunction
with decision diamonds and instruction rectangles. Automatic test equipment can be
directly designed from the diagrams. The test procedures and sequential flow logic
diagrams for each subsystem are presented in Section V.
8
C. PHASE 3 - FINAL REPORT
In Phase 3, information and procedures were correlated for presentation in the
final report. Subsystem tests were coordinated and descriptions of all test procedures
were written. The optimum test sequence diagram (TACOM) was updated and modified
to reflect our effort and a test operation diagram was created to show system coordi-
nation with operator actions.
All necessary special test equipment recommended and/or designed is presented
in C, Test Equipment, in Section V. Existing adapters used by the Army were in-
cluded for reference.
To complete Phase 3, all notes and reports were reviewed for material to be in-
cluded in Section V. Recommendations were correlated into areas for future develop-
ment, future vehicle test points and additional testing of the electrical subsystems.
The organization of this Final Report was discussed with TACOM to ensure in-
clusion of all applicable material and to ensure presentation in the most useful manner.
Since no Army standards for technical reporting were prescribed, this report was
prepared in accordance with good commercial standards and in-house practices.
9
V. TECHNICAL DISCUSSION
The test approach, test procedures, and test equipment for performing fault iso-
lating diagnostics are contained in this section. These are the direct results of
Westinghouse efforts in determining optimum fault isolating diagnostic test procedures
for automatic test equipment using existing, proven test techniques.
The test approach defines final recommendations by Westinghouse for flow of
tests, operator action, and levels of test equipment interface. In the test procedures,
each subsystem is separately described to maintain continuity of approach for the
respective subsystems. Any special or developed test equipment required is described
under C Test Equipment.
A. TEST APPROACH
To provide test procedures which would not discourage a potential user by re-
quiring many interconnections, the following test approach was taken. A minimum
number of connections are used for an operational "GO" test. This test verifies sub-
system functional operation. With this hookup, partial fault isolation is possible.
If a subsystem fails the operational "GO" test, the procedures dictate operator
actions, additional hookups, and disassembly only as required. Whenever disassem-
bly takes place, this disassembly would be required to replace the defective compo-
nent. By continuing with automatic tests after additional hookup and disassembly,
operator decisions for test steps to follow or determining defective components are
held to a minimum.
With the initial test hookup, several tests that would normally fall under dia-
gnostics are performed. This is done because test time is negligible once hookups
have been made. These additional tests are done only utilizing hookup required for
the operational "GO" test.
10

The test procedure flow is: 1) pretest inspection, 2) initial hookup, 3) operational
"GO" test, and 4) diagnostics. During pretest inspection, obviously defective compo-
nents are detected and test prerequisites checked (e. g., defective battery case, cor-
rect oil level, and leaking fuel lines).
The initial hookup is the interface required for operational "GO" test. As de-
scribed before, the operational "GO" test verifies subsystem functional operation.
Finally, for subsystems (failing) the "GO" test, diagnostics are performed to fault
isolate to a defective component. If a subsystem has a "GO" condition, diagnostics
will not be performed on that subsystem.
Figure 4-1 shows the steps necessary and operator actions required to perform
the test procedures. First, the operator performs a pretest inspection on the vehicle.
Second, upon completion of the inspection, the operator hooks up the automatic test
equipment interface cables.
The third step consists of six operator actions directed by the test set: 1) ignition
switch off, crank engine; 2) ignition switch on; 3) crank engine (ignition switch on); 4)
run engine (450 rpm); 5) run engine (1500 rpm); and 6) run engine (1100 rpm).
During the test sequence, diagnostics will be performed on any system not meet-
ing established "GO" criteria. Operator action or disassembly plus additional interface
hookup may be necessary depending upon the malfunctioning subsystem.
Automatic test equipment output will include subsystem "GO" indications and fault-
isolated indications as well as directing operator action. A "Retest" and "Proceed"
feature shall be included to repeat a system test once a failure is isolated, and then to
complete any remaining tests.
All subsystems were included in this diagram (figure 4-1) to present an overall
system description. Each subsystem is further summarized in the subsystem test
sequence diagrams included in this section. These diagrams show test input require-
ments, additional operator actions including disassembly and additional hookup, and
levels of testing at which component fault isolation takes place.
11

B. OPTIMAL TEST PROCEDURES
Separate optimal test procedures have been written for each subsystem. The de-
scriptions include a test summary, pretest inspection, description of initial hookup
requirements, operational test procedures, diagnostic test procedures, and test
limitations and recommendations. Test sequence block diagrams summarizing the
test procedures and sequential flow logic diagrams showing detailed test procedures
are included for each subsystem.
1. Battery Subsystem
The operational test for the battery subsystem is performed by cranking the
engine for 15 seconds to remove surface charge and then measuring the battery crank-
ing voltage. Engine cranking places the heaviest load on the battery subsystem; if
battery reserve voltage is high enough after an extended cranking period, the battery
will provide enough current and voltage for reliable vehicle operation.
Diagnostic testing of the battery subsystem includes a hydrometer test, clamp
and cable voltage drop test, and the 421 battery test. Fault isolation is to all compo-
nents in the system and battery isolation includes indication of a bad or a discharged
battery.
Figure 4-2 shows the operator actions required, levels at which components
are isolated, and when additional hookup is required. Inputs to the hookup blocks in-
dicate interface requirements.
During operational testing, only two connections are needed: 1) more positive
battery positive terminal and clamp, and 2) vehicle chassis ground. These connections
are necessary for other subsystem (except generator-regulator) tests. Three addi-
tional connections are made for diagnostic testings, the three remaining battery
terminals and clamps.
a. Pretest Inspection
Examine the batteries for damaged cases, damaged posts, and leaks. If
no leaks are visible and the electrolyte level is low, refill battery cells to properlevel.
If a battery is significantly damaged, replace it.
14

PRETEST 1 DEFECTIVE BATTERY CASE
INSPECTION LOW ELECTROLYTE LEVEL
MORE POSITIVE BATTERY INITIALPOSITIVE TERMINAL HOOKUP
REQUIREMENTSVEHICLE CHASSIS GROUND I
OPERATIONAL K 0 GOCRANK ENGINE DEFECTIVE CLAMP/CONNECTION
IGNITION OFF
DIAGNOSTICS
I HYDROMETER TEST BAD BATTERY
MORE POSITIVE BATTERYNEGATIVE TERMINAL
("POSITIVE ADDITIONAL
MORE NEGATIVE) TERMINAL HOOKUP
BATTERY N NEGATIVETERMINAL
C E EDEFECTIVE CLAMP/CONNECTIONI CRANK ENGINEIGNITION OFF • DEFECTIVE BATTERY
INTERCONNECTING CABLE__ DEFECTIVE BATTERY GROUND
CABLE
f 421 BATTERY 1 BAD BATTERY
TEST DISCHARGED BATTERY
ROOOI-LB- 26
Figure 4-2. Battery Subsystem Test Sequence
15
b. Interface Requirements
The more positive battery positive terminal with associated clamp and
chassis ground are the required interface connections for the operational "GO" test of
the battery subsystem.
During diagnostics, the three remaining battery terminals with respective
associated clamps are also interfaced.
When both the battery terminal voltage and its associated clamp voltage
are available, a bad connection can be detected - differentiating from a low battery
voltage.
c. Operational Test
Figure 4-3 shows the flow of test procedures and test condition combina-
tions (logic) for fault isolation.
The battery subsystem operational "GO" test is performed by cranking
the engine for 15 seconds and then measuring the batteries cranking voltage. If this
voltage is low, diagnostics are to be performed. A nominal or greater voltage indi-
cates the battery subsystem has sufficient reserve and charge to meet the require-
ments of the electrical system.
d. Diagnostics
In the first step in diagnostics, the operator manually performs a hydr-
ometer test on each battery. If cell variances on a battery are high, the battery
should be replaced.
Make additional hookup at each battery terminal and clamp. The crank-
ing voltage between each battery terminal and its clamp should be checked to be less
than 0. 05 volt. A voltage higher than 0. 05 volt indicates a bad connection, defective
terminal, or defective clamp at that terminal. The voltage drop across the battery-
to-battery cable should not exceed 0. 05 volt while cranking; if it does, the battery-to-
battery cable is bad and needs to be replaced.
16

If the connections and the cables are good, the battery is tested by the
421 test. The test is performed on one battery at a time. If a battery voltage is less
than 8 volts, the battery would be indicated bad. A battery with its voltage greater
than 8 volts is discharged at the rate of 50 amps for 15 seconds; then its open circuit
voltage is measured after a 5 second interval. If the voltage is greater than or equal
to 11. 05 volts, the battery is discharged for an additional 45 seconds at the rate of 50
amps. After a 5-second wait the voltage is measured and stored for comparison to the
open circuit voltage after the battery has been charged for 45 seconds at 14 volts 15
amps limited, and the voltage is measured after a 15-second wait. The two voltages
are compared using the limit equations below. For example, if the first voltage, V1.
is between 11.2 and 13.0 volts, the second voltage, V2 , must be greater than 0.78
times the first voltage, V1 , plus 2. 9 volts and less than 2. 5 times the first voltage,
V1, minus 15.5 volts.
For: V1 V2 must fall within -
l1. 2<V = 13 0.78xV1 +2.9 <V2 <2.5xV -15.5
10.3<V = 11.2 0.78xV1 +2.9 <V2 <V1 +1.3
10.1<V < 10.3 10.9 <V2 <V1 +1.3
8 <V I= 10.1 10.9 <V2 <11.4
If the second voltage, V2 does not fall within the limits created by the
first voltage, V1 , the battery is bad and should be replaced. If V2 falls within the
limits, the battery should be charged for a designated number of hours:
11.9 !5 V2 < 12.1 charge for 8 hours
12.1 <= V2 < 12.3 charge for 7 hours
12.3 <V2 <12.5 charge for 6 hours
12.5 <-V < 12.7 charge for 5 hours2= 2
12.7 < V2 < 12.9 charge for 4 hours
12.9 :5V 2< 13. 0 charge for 3 hours
The above comparison action is indicated by the "compare" diamond of
the battery system sequential flow logic diagram.
19

The flow is set up so both batteries will be tested. If the first battery
tested is "bad" and the second "good", a "stop" condition will exist to complete the
test. Whenever a discharged or bad battery indication is found, the Generator-
Regulator Subsystem should be tested to verify charging capabilities.
e. Test Limitations
1) The 421 battery test is approximately 75 percent accurate. By using
this test versus a more exhaustive and accurate test technique, ease of
automatability is gained and considerable test time is saved. Additional
information is contained in item 5).
2) Only one battery can be tested at a time using the 421 test.
3) The battery cables must be making good contact with the clamp or a
faulty cable indication will result. The connection of the cable to the
clamp is not tested; it is assumed that good contact is made.
4) Battery terminal to clamp connections must be repaired (if a faulty
indication was made) or else a faulty battery indication will result.
5) The 421 battery test, performed in conjunction with a hydrometer
test, is approximately 90 percent accurate. Inaccuracies of the test will
result in a bad battery not being detected instead of a good battery being
isolated as defective. Many companies utilizing lead acid battery testing
were contacted (names included in Appendix G) and a summary of opinions
and comments is included below.
Of the companies contacted, 13 were familiar with the 421 battery
test; one company said the test was inferior; three had no comments. For
a comparison basis, seven felt the test was as good as or better than any
other test available when used in conjunction with a hydrometer test to
pick up cell differences, and two companies thought that the 421 test
(again in conjunction with a hydrometer test) was superior to any other
test available and they used it exclusively.
20

Some of the comments made were: "The 421 test was designed to
check a wide range of ampere hour ratings, but it will detect a defective
cell, sulphated cell, open cell, and shorted cell.."; "The hydrometer
should be used along with the test to obtain the best efficiency.. "; "The
421 does what it was designed for and that is to check batteries fast and
accurately.."; "The 421 has its hangups and, that is, it passes faulty
batteries with a surface charge.."; "The test was developed from an
experimental basis rather than a theoretical basis. The results of the
test is an experimental curve that covers all the ranges of the battery..";
"The best tester is the battery load test. ."; "All the testers on the mar-
ket have shortcomings, but the 421 is among the ones with the least... ";
"The only real test is to load the battery measuring output current, and
then recharge the battery measuring charging current..." "The best
test is the hydrometer test. There are few faults the hydrometer test
will not pick up...".
2. Starter Subsystem
The Starter Subsystem is operationally tested by comparing starter interface
cranking voltage drop, engine cranking rpm's, and starter cranking current draw. All
test measurements are made while cranking or attempting to crank the engine. During
the operational test, fault isolation will be carried out to the starter without further
operator interaction or additional hookup or disassembly.
All cables and the starter switch are checked during diagnostics and the
starter switch has to be removed from the vehicle.
Test sequence for the starter subsystem is summarized in figure 4-4. Note
that incorrect oil viscosity is to be detected in the pretest inspection. If too heavy an
oil is in the vehicle, engine rpm's will be reduced and may give an erroneous indica-
tion of a malfunctioning starter.
21

PRETEST LOOSE STARTER
INSPECTION INCORRECT OIL VISCOSITY
VEHICLE CHASSIS GROUNDINITIAL
IGNITOR BREAKER POINTS
STARTER CABLE(CURRENT. HOOKUPPROBE)
STARTER TERMINALREQUIREMENTS
MORE POSITIVE BATTERY
POSITIVE TERMINAL
OPERATIONAL TEST I GO
CRANK ENGINEIGNITION OFF DEFECTIVE STARTER
DIAGNOSTICS
REMOVESTARTER SWITCH STARTER
STARTER SWITCH - SWITCH,ADDITIONAL
HOOKUP
CRANK b DEFECTIVE SWITCH
ENGINE N DEFECTIVE CABLE- SW. TO STARTERIGNITION
OFF IT DEFECTIVE CABLE- SW. TO BATTERY
Figure 4-4. Starter Subsystem Test Sequence
22

If a Starter Subsystem test is performed without first checking the Battery
Subsystem, low battery voltage can result in an erroneous indication of starter failure
by reducing cranking rpm.
a. Pretest Inspection
1) Check for correct engine oil viscosity and for correct engine oil
level. Viscosity is checked only by referring to vehicle log book for
correct oil usage during last maintenance interval.
2) Check for secure starter mounting (hand pressure only).
3) Check for unusual starter noise while cranking. If unusually noisy,
replace starter.
b. Initial Hookup Requirements
Five test points are used to interface with the vehicle during diagnostic
testing: 1) more positive battery positive terminal, 2) chassis ground, 3) starter
terminal, 4) starter cable (current probe, clamp-on), and 5) breaker points. Connec-
tions 1), 2), and 5) are used in conjunction with other subsystem tests.
c. Operational Test
Figure 4-5 shows the flow of test procedures and the test condition com-
binations (logic) for operational testing and fault isolation diagnostics.
To obtain a "GO" result from operational testing, the cranking voltage
drop from the more positive battery positive terminal to the starter terminal is
checked. If this drop is too high, the interface circuit is diagnosed for fault isolation.
Engine cranking rpm are then checked. Too low an rpm indicates a faulty starter.
Cranking current draw of the starter is the last operational test step. If the current
draw is too high, a faulty starter is indicated.
d. Diagnostics
If the voltage drop from the starter terminal to the more positive battery
positive terminal was too high, diagnostics are to be performed on this interface.
23

WI 0 V
o ~cr0
00
0 i
c0 0
n~.cr. ~X" Z~r ZJ ý- 0=)~~ 9 w 0r - c ~
o i
0 ooc0
>0
0
0c
00
00
00m
0 Cor wF
- 0
24j

First the starter switch must be removed from the vehicle and connec-
tions made to each terminal. The voltage drops across the starter switch, starter
switch to starter, and starter switch to more positive battery positive terminal are
then checked. The fault will be isolated to the starter switch, switch-to-starter cable,
or switch-to-battery cable, respectively, according to a high voltage drop.
e. Test Limitations and Justification
1) A starter is diagnosed as bad when it will not crank the engine,
cranks the engine too slowly, or draws an excessive amount of current.
A bad or discharged battery may cause any of these indications.
2) Missing flywheel teeth may cause a faulty starter indication if the
starter is noisy or if the starter fails to crank the engine.
3) A mechanically tight engine causing slow starter cranking speed will
result in a faulty starter indication.
4) Excessively heavy engine oil which causes slow starter cranking
speed will result in a faulty starter indication.
3. Electric Fuel Pump Subsystem
The electric fuel pump and associated wiring, such as used in the M151 ve-
hicle, may be tested by monitoring the input voltage at the fuel pump and the fuel pump
output pressure under three different conditions as outlined in the operational test. If
a fault in the wiring or switch is indicated, an additional hookup must be made to fault
isolate to the defective component or circuit.
The Electric Fuel Pump Subsystem test is summarized in figure 4-6. Note
that the fuel pump itself may be fault-isolated with the original hookup in the opera-
tional test.
a. Pretest Inspection
Before hookup of the test equipment, the Electric Fuel Pump Subsystem
must be visually inspected for damaged wires or loose connections and to verify that
the fuel line at the fuel pump and carburetor is intact and is not leaking.
25

T LEAKING FUEL LINE CONNECTIONSINSPECTION
VEHICLE CHASSIS GROUNDINITIAL
MORE POSITIVE BATT. POS, TERM.----HOOKUP
FUEL PUMP OUTPUT TRANSDUCERREQUIREMENTS
FUEL PUMP CIRCUIT 77 -
"----- WGO
OPERATIONAL TEST
I CRANK ENGINE ------- FUEL PUMP
IGNITION OFF 1OIL PRESSURE SWITCH
2 IGNITION ON
3 CRANK ENGINE
IGNITION ON
S DIAGNOSTICS
FUEL PUMP CKT. 77B- IGNITION OFF
ADDITIONALFUEL PUMP CKT. 77A HOOKUP
CRANK ENGINE " 0FUEL PUMP CKT. 77A
I IGNITION OFF I OFUEL PUMP CKT. 77B
2 IGNITION ON3 NOIL PRESSURE SWITCH3 CRANK ENGINE
IGNITION ON " FUEL PUMP CKT. 77
R001-LC-7
Figure 4-6. Electric Fuel Pump Subsystem Test Sequence
26

b. Initial Hookup Requirements
The test points required for frame ground and for the positive terminal
of the more positive battery will be the same as those used for the other subsystem
tests. No disassembly is necessary for their hookup.
The input lead at the fuel pump must be disconnected in order to insert
an adapter providing a test point right at the fuel pump. The rubber fuel line must be
disconnected at the fuel pump in order to insert an adapter, containing a pressure
transducer, into the fuel line.
c. Operational Test
Figure 4-7 shows the flow of test procedures and test condition combina-
tions (logic) for fault isolation.
The Electric Fuel Pump Subsystem test begins by cranking the engine
with the ignition switch off. The voltage at the fuel pump test point is compared with
the battery voltage for an "EQUAL TO" or "LESS THAN" decision. The voltages
should be equal at this time if the circuit is correct thru the starter switch and oil
pressure safety switch. The fuel pump should be functioning at this time and the fuel
line pressure should rise and stabilize at 3 to 5 psi (according to TM9-2320-218-20).
The next measurement is made with the ignition switch on and without
cranking the engine. The voltage at the fuel pump test point should be zero at this
time, unless there is a residual oil pressure from cranking the engine. A "NO-GO"
at this point will direct the operator to observe the oil pressure gauge to determine if
this is the cause of failure.
The engine is then cranked with the ignition switch on. The voltage at
the fuel pump test point is compared with the battery voltage and these should be equal
whether the engine starts or not. The fuel line pressure is not measured at this point
because the previous measurement is deemed adequate.
27

CRANK ENIEIGNITION CRANK ENGINE
|IGNTON,,_2 OFF SWITCH ON IGNITION ON
CK , 77TRVLAE10 -A OZEO YSO
FULPM I
PRESSURE GOOOLC 8E R E
Figur 4-.EetiNul OmpSbytmSqetalFo oi iga
AND8

d. Diagnostics
If the voltage at circuit 77 terminal is less than battery voltage when
cranking engine with ignition switch off or when the engine is running, turn off ignition
switch and make additional hookup and measurements:
1) Disconnect cable from oil pressure safety switch and connect to
mating test lead cable.
2) Connect circuit 77B to circuit 77 and crank engine with ignition
switch off. Compare voltage at circuit 77 terminal with battery voltage.
3) Connect circuit 77A to circuit 77 and start engine by cranking with
ignition switch on. Compare voltage at circuit 77 terminal with battery
voltage.
4) If voltage at circuit 77 terminal is less than battery voltage when
circuit 77B is connected to circuit 77 but not when circuit 77A is con-
nected to circuit 77, the fault lies in harness circuit 77B.
5) If voltage at circuit 77 terminal is less than battery voltage when
circuit 77A is connected to circuit 77 but not when circuit 77B is con-
nected to circuit 77, the fault lies in harness circuit 77A.
6) If voltage at circuit 77 terminal is less than battery voltage when
circuit 77B is connected to circuit 77 and also when circuit 77A is con-
nected to circuit 77, the fault lies in harness circuit 77.
7) If the voltage at circuit 77 terminal is equal to the battery voltage
when circuit 77B is connected to circuit 77 and also when circuit 77A is
connected to circuit 77, the fault lies in the oil pressure safety switch.
If the fuel pump pressure is low but the voltage at circuit 77 terminal is equal
to battery voltage when cranking engine with ignition switch off, the fault lies in the
fuel pump.
If the voltage at circuit 77 terminal is not zero when ignition switch is on
and without cranking engine (engine not running), check oil pressure
29

gauge for residual oil pressure. If no oil pressure exists, the fault lies in the
oil pressure safety switch.
e. Test Limitations and Justification
No current measurement is used in the fuel pump diagnostics which means
if the fuel pump input was shorted to ground, thereby dropping all the battery voltage
across the wiring and oil pressure safety switch, the indication may be a fault in cir-
cuit 77. The excessive current drawn in this case, however, would cause obvious
damage to the wiring harness or would trip the circuit breaker.
If the residual oil pressure, with engine not running, is over 3 and 1/2
psi but is not sufficient to produce a deflection on the oil pressure gauge (or if the oil
pressure gauge or sending unit is defective), the indication will be a faulty oil pressure
safety switch. This can be checked by allowing time for the residual oil pressure to
bleed off and then retesting.
If the diagnosis indicates a fault in circuit 77A, the fault could be in the
harness or in the circuit breaker. The circuit breaker must be verified as ON in this
case by the operator.
If the carburetor float needle fails to seat or if there are any bad leaks in
the fuel line, this will reduce the fuel line pressure and the indication will be a faulty
fuel pump.
4. Ignition Subsystem
The Ignition Subsystem and associated wiring in the M151 or a similar
gasoline engine vehicle may be automatically tested by initial hookup of five test
points. Two of these points are from ground and the positive terminal of the more
positive battery, both of which are used for other subsystems.
The breaker point capacitor is measured before starting the engine by crank-
ing the engine with the ignition switch off and measuring the breaker point test point
when the breaker points are open (as ascertained by the breaker point interface circuit
described under C, Test Equipment). The distributor input current and voltage are
30
then measured while cranking the engine with the ignition switch on. At the same time,
the breaker points are measured for voltage drop and cam dwell and the peak voltage
at number one spark plug is measured. If the engine starts, the individual cylinders
are disabled one at a time by shorting out the breaker points at the appropriate time or
by shorting out the spark plug for number one cylinder, and comparing the rpm drop
for a cylinder balance test. This information in addition to the timing advance check
which is made by the operator, can produce a "GO" result, or may be automatically
analyzed to produce a directive to the operator as to the faulty component or for addi-
tional instructions to begin a fault isolation sequence.
The operator must perform additional disassembly and/or hookup in order to
proceed with automatic fault isolation and diagnosis by the equipment. Diagnosis of
faults in the high voltage circuit at the distributor cap, rotor, spark plug cables and
spark plugs, depends heavily on visual inspection by the operator for damaged insula-
tion, burned contacts, or improper gap. The operator is further directed to visually
inspect for frayed wires or loose connections which may give an indication of a faulty
component.
Figure 4-8, summarizes the test procedures. Interface requirements are
shown as inputs to the initial hookup requirements block. Fault isolations are shown
as outputs at the earliest level of testing which determines faulty components.
a. Pretest Inspection
Before hookup of the test equipment, the Ignition Subsystem must be
visually examined for obvious maladies such as loose or missing parts, damaged
wires or spark plug cables, or moisture in the distributor. The ignition switch must
be OFF before beginning disassembly or hookup. The DC voltages measured in the
ignition system are referenced to frame ground and to the positive terminal lug of the
most positive battery instead of at the starter switch where circuit 11 begins. Circuit
6, which connects circuit 11 to the battery, should be ascertained as satisfactory be-
fore beginning the Ignition Subsystem test.
31

b. Initial Hookup Requirements
The test points required for frame ground and for the positive terminal
lug of the positive battery will be the same as those used for the other subsystem tests.
No disassembly is necessary for their hookup.
The connector at the distributor input must be disconnected for insertion
of an adapter containing an ammeter shunt and with two leads to interface with the test
equipment.
The plug in the top of the distributor must be removed in order to insert
adapter 4910-356-7492 as the breaker point test point.
The cable must be disconnected from number one spark plug in order to
insert adapter 4910-356-7504 in the HV circuit. This allows connection of the peak
reading kilovoltmeter and the timing light.
c. Operational Test
Figure 4-9 shows the flow of test procedures and test condition combina-
tions (logic) for fault isolation.
The Ignition Subsystem test begins when cranking the engine with the
ignition switch off. At this time, the breaker point capacitor is measured and a de-
cision of "'HIGH"r, 'ILOW"? or "'GOOD" is stored for later use. This measurement may
be performed simultaneously with another subsystem test but not at the same time
that a tachometer or dwellmeter measurement is required. Note that tachometer and
dwellmeter measurements may be made with the ignition switch either on or off by
using the breaker points for a current sink.
The next series of measurements begins when the engine is cranked with
the ignition switch on. Regardless of whether the engine starts or not, the following
measurements are made:
1) Dwell angle is measured for "HIGH"t, "LOW" or "GOOD" decision.
34

2) When breaker points are open:
(a) DC voltage at breaker points is compared with the battery volt-
age for "EQUAL TO" or "LESS THAN' decision. The stipulations
for an "EQUAL TO" decision in this case must include a tolerance to
allow for noise plus the accuracy of the measuring equipment.
(b) DC voltage at distributor input is compared with the battery
voltage for "EQUAL TO" or "LESS THAN" decision. The stipula-
tions for an "EQUAL TO" decision are the same as mentioned in the
preceding measurement.
(c) The ignition input current is measured for a "ZERO" or
"HIGH" decision. The stipulation for a "HIGH" decision in this case
must actually be greater than the normal leakage current plus the
smallest increment within the accuracy of the measuring equipment.
3) When breaker points are closed:
(a) The voltage drop across the breaker points is measured for a
"GOOD" or "HIGH" decision. The limit for this measurement would
be 0. 2 VDC (per TM9-2320-218-20).
(b) DC voltage at distributor input is compared with the battery
voltage for "EQUAL TO" or "LESS THAN" decision. The stipula-
tions for an "EQUAL TO" decision in this case must include a
tolerance to allow for normal line voltage drop plus the accuracy of
the measuring equipment.
(c) Ignition input current is measured for a "HIGH"', "LOW" or
"GOOD" decision. The stipulation for a "GOOD" decision in this
case would be the nominal current range scaled to match the battery
voltage at the time of measurement.
39

4) The peak high voltage at the number one spark plug is measured for
a "HIGH", "LOW" or "GOOD" decision. The stipulation for a "GOOD"
decision in this case would be a peak voltage indicating the presence of
high voltage sufficient to fire the spark plug but not so high that the
spark plug is obviously bad.
If the engine starts, the following measurements are made:
(1) With engine running at idle:
"* Initial timing advance must be verified using a timing
light.
"* Each individual cylinder must be disabled by applying a
ground at the breaker points at the appropriate time and
the rpm change is measured and stored for a cylinder
balance test.
(2) With engine running at 1500 rpm:
"* Total timing advance must be measured using a timing
light and a variable delay to be manually adjusted by the
operator.
"* The consistency of the dwell angle is measured for a
"GOOD" or "HIGH" decision. The stipulation for a "HIGH"
decision in this case would be a variation of 3 degrees or
more (per TM9-2320-218-20).
If the engine doesn't start, it is necessary to insert an adapter
(4910-356-7504) at every spark plug. The firing voltage of
each spark plug may then be measured in lieu of the cylinder
balance test previously mentioned. The operator must also
check the initial timing advance with the timing light while
cranking the engine to verify that this is somewhere within
reason and not the cause of the engine not starting. The re-
sults of these measurements are sufficient to produce a "GO"
40
result for the Ignition Subsystem. Any measurements pro-
ducing an unsatisfactory decision will lead to further disassem-
bly and/or hookup by the operator followed by automatic
diagnostics.
d. Diagnostics
If the distributor input voltage and input current are both low:
1) Turn ignition switch to OFF.
2) Remove ignition switch from the dashboard with wires still
connected.
3) Connect test lead clip to ckt. 12 terminal on ignition switch.
4) Connect test lead clip to ckt. 11 terminal on ignition switch.
5) Turn ignition switch to ON.
6) Jumper breaker points to ground. (Automatic)
7) Compare DC voltage at ckt. 12 terminal on ignition switch with volt-
age at distributor input. If voltages are different, fault lies in ckt. 12.
8) Compare DC voltage at ckt. 11 terminal on ignition switch with
voltage at ckt. 12 terminal on ignition switch. If voltages are different,
fault lies in the ignition switch.
9) Compare DC voltage at ckt. 11 terminal on ignition switch, with
voltage at battery terminal. If voltages are different, the fault lies in
ckt. 11.
The distributor cap must be removed for inspection and/or additional
hookup for any of the following indications:
1) Distributor input voltage is correct but the input current is
incorrect.
2) The high voltage measurement at the spark plugs are all low.
41
3) The high voltage measurement at one or more but not all spark plugs
is low and the spark plug cable is good.
4) The voltage drop across the breaker points is high.
5) The dwell angle variation is high.
6) The dwell angle is incorrect.
7) The distributor input current is high.
If the distributor input voltage is correct but the input current is
incorrect.
1) Connect a test lead clip to the breaker point side of the ignition coil.
2) Connect a test lead clip to the input side of the ignition coil.
3) Turn igntion switch ON.
4) Jumper breaker points to ground.
5) Measure the voltage at the ignition coil input.
"* If the voltage at the ignition coil input is low and the distributor
input current was high or if the voltage at the ignition coil input
is high and the distributor input current was low, the indication
is a faulty ignition coil.
"* If the voltage at the ignition coil input is low and the distributor
input current was low, or if the voltage at the ignition input is
high and the distributor input current was high, or if the volt-
age at the ignition coil input is zero and the distributor input
current was zero, the indication is a faulty ballast resistor.
"* If the voltage at the ignition coil input is zero and the distribu-
tor input current was high, the indication is a faulty feed-thru
capacitor.
If the high voltage measurements at the spark plugs are all low:
1) Visually inspect the distributor rotor and cap for damaged insulation
and burned contacts.
42

2) If the distributor rotor and cap are in satisfactory condition, the
dwell angle is correct, the voltage drop across the breaker points is
correct, the distributor input voltage and the distributor input current
are correct, the indication is a faulty ignition coil.
If the capacitance measured at the breaker points is low, or if the
capacitance measured at the breaker points is high and the dwe]l angle is low or good,
the indication is a faulty breaker point capacitor.
If the capacitance measured at the breaker points is high, the dwell angle
is high, and the distributor input current is correct, the operator must measure the
breaker point gap. If the breaker point gap is correct, the indication is a faulty
breaker point capacitor.
If the voltage drop across the breaker points is high:
1) Inspect the connections of the lead from the ignition coil to the
breaker points for frayed or loose wires.
2) Inspect the breaker points for contamination from oil or grease and
for proper grounding.
3) Inspect the breaker point contacts for pitting or overheating and re-
place if necessary.
For a high dwell variation:
1) If the dwell variation is high from cylinder to cylinder but the dwell
is constant for each individual cylinder, the distributor cam is worn un-
evenly or the shaft is offset or bent.
2) If the dwell variation is high from cylinder to cylinder and also for
each individual cylinder, the points may be binding on the pivot, the
shaft bushing may be excessively worn, or the breaker point spring
tension may be low.
If the dwell angle is incorrect, adjust the breaker point gap to specifica-
tions. If the dwell angle is incorrect and the breaker point gap is correct, the dis-
tributor cam is excessively worn.
43
If the initial timing is incorrect, adjust distributor to bring it within
specifications.
If the total timing advance is incorrect, the indication is a faulty distribu-
tor advance mechanism.
If the firing order is incorrect, inspect the distributor for reversed
spark plug cables.
If the engine starts during the operational test, but the cylinder balance
test shows a faulty cylinder, that is, one which does not contribute to the engine speed
proportionally, an adapter (4910-356-7504) must be inserted at that spark plug and the
high voltage measured for a "HIGH", "LOW" or "GOOD" decision. The stipulation
for a "GOOD" decision in this case would be a peak voltage indicating the presence of
high voltage sufficient to fire the spark plug but not so high that the spark plug is ob-
viously bad. If the decision is "GOOD" for the spark plug test but the engine has failed
the cylinder balance test, the indication is a malfunction other than in the Ignition Sub-
system such as fuel or compression or a partially fouled spark plug.
If the high voltage at one or more spark plugs is low, but not at all spare
plugs:
1) Remove spark plug cables from suspected spark plugs and test in-
dividually for leakage and continuity.
2) Inspect distributor cap for burnt or corroded contact or damaged
insulation.
3) If distributor cap and spark plug cables are in satisfactory condition,
the indication is a faulty spark plug.
If the high voltage at any spark plug is too high, remove the plug to check
the gap. If the gap is correct, the indication is a faulty spark plug.
e. Test Limitations and Justification
The cylinder balance test, which is used in conjunction with a high volt-
age measurement to evaluate the high voltage circuit, is an accepted procedure and
44
may be found in Motor's Auto Repair Manual and Glenn's Auto Repair Manual. The
advantage of this technique, as applied to automatic test, is that the spark plugs,
cables and distributor contacts for each individual cylinder may be evaluated for a
"GO" result by only hooking up to the number one spark plug and the breaker point test
point. If the high voltage at number one spark plug falls within the normal limits and
all cylinders contribute proportionally to the engine rpm, then the high voltage circuit
for all cylinders must be satisfactory. This technique may not be used if the engine
will not start, since the test requires a series of tachometer measurements, but the
high voltage at each spark plug may be measured instead.
The breaker point capacitor is to be measured with a capacitance bridge
circuit having an interrogating voltage at about 15 kHz. This technique is used in
many commercial capacitance meters for testing capacitors out of the circuit. The
breaker point capacitor may be measured in circuit with this technique at 15 kHz or
above, so that the impedance of the ignition coil primary is large enough to provide
isolation from the feed-thru capacitor at the distributor input. Any leakage in the
capacitor, which is large enough to effect the engine performance, will produce a
phase shift and be detected by the capacitance bridge as a high capacitance.
The lack of a test point between the feed-thru capacitor and ballast
resistor means that similar malfunctions in either component must be diagnosed as
the most probable case. A short to ground in either component will be diagnosed as a
faulty feed-thru capacitor and an open circuit will be diagnosed as a faulty ballast
resistor.
Any dampness or breakdown in the distributor cap insulation sufficient to
produce cross firing on multiple firing of the spark plugs will be diagnosed as re-
versed spark plug cables.
All fault isolation inside the distributor assembly requires the operator's
verification of satisfactory leads and connections. For example, if the lead from the
ballast resistor to the ignition coil primary has a bad connection, the indication will
be a faulty ballast resistor.
45
The initial timing advance is performed by the operator in the normal
fashion with a timing light in lieu of mechanical interface with the vehicle to permit
automatic measurement with a magnetic pickup or similar device. The total timing
advance is measured using a similar technique with the initial timing as a reference.
The operator must observe the timing mark with the timing light and adjust a control
knob unitl the timing mark and pointer are aligned. The setting of the control knob is
then analyzed automatically to produce a go or no-go result.
5. Generator-Regulator Subsystem
The Generator-Regulator Subsystem is operationally tested by verifying
adequate generator output and verifying regulator voltage regulation and reverse cur-
rent cutout. All tests on the system are performed at 1100 rpm - engine speed at
which maximum generator output becomes available.
Full load regulator output voltage is checked to verify voltage regulation; then
maximum generator output capability is checked to be adequate by shorting the field
to the output. Finally, reverse current cutout is checked by opening the generator field
and checking for current flow thru the regulator.
Fault isolation in this subsystem is to the regulator or generator only - no
cables are checked. A regulator needing adjustment will be indicated as bad and
should be replaced. No regulator adjustments are performed at the organizational
level.
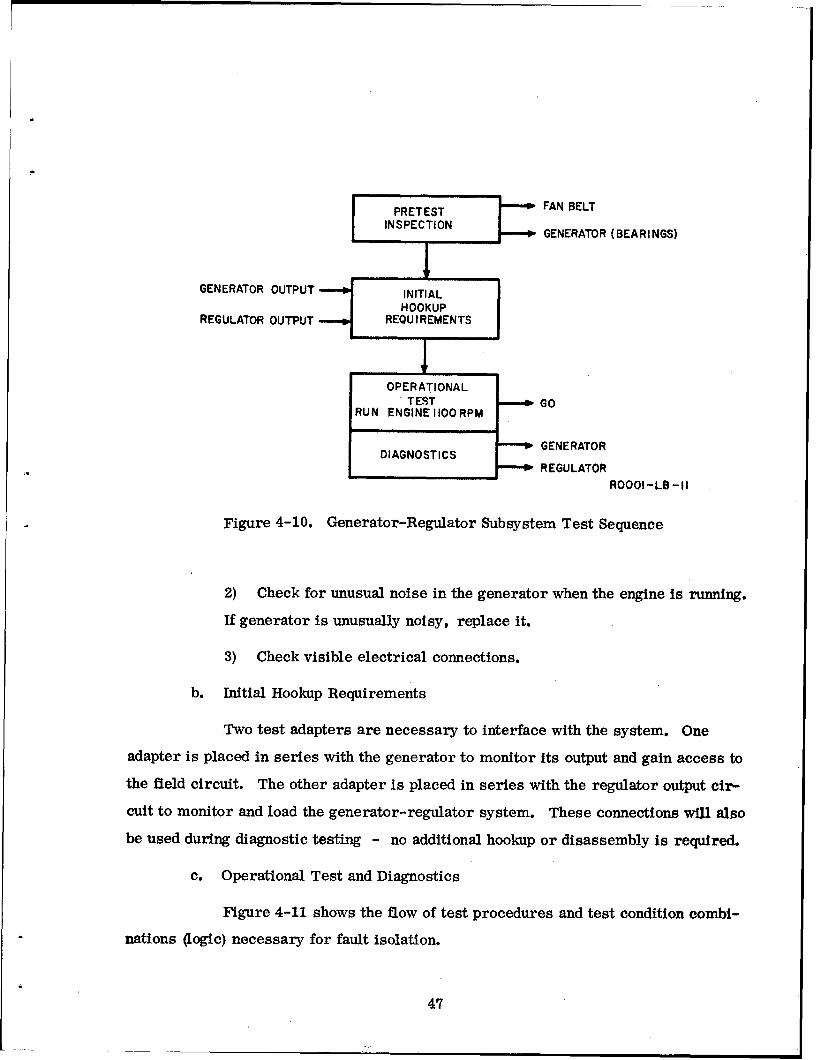
The Generator-Regulator Subsystem test procedure is summarized in figure
4-10. Diagnostics are shown as part of the operational test because no additional hook-
up, disassembly, or operator interaction is required for operational testing and fault
isolation.
a. Pretest Inspection
1) Inspect the fan belts for flaws and tightness. If the belts are flawless
and loose, tighten them. If the belts are worn or defective, replace
them.
46
E PRETEST h FAN BELT
INSPECTION GENERATOR (BEARINGS)
GENERATOR OUTPUT INITIALHOOKUP
REGULATOR OUTPUT REQUIREMENTS
OPERATIONALTEST GO
RUN ENGINEIIOORPM
O GENERATORAGNOSTICSULATOR
ROOOI-LB -II
Figure 4-10. Generator-Regulator Subsystem Test Sequence
2) Check for unusual noise in the generator when the engine is running.
If generator is unusually noisy, replace it.
3) Check visible electrical connections.
b. Initial Hookup Requirements
Two test adapters are necessary to interface with the system. One
adapter is placed in series with the generator to monitor its output and gain access to
the field circuit. The other adapter is placed in series with the regulator output cir-
cuit to monitor and load the generator-regulator system. These connections will also
be used during diagnostic testing - no additional hookup or disassembly Is required.
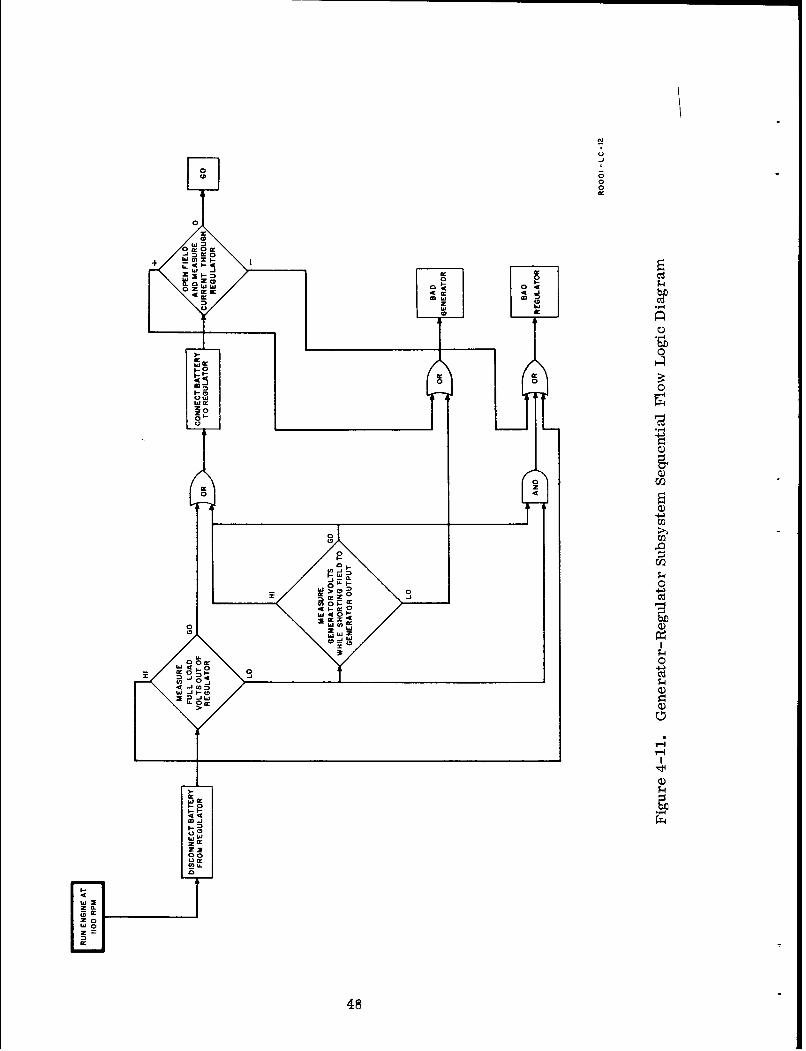
c. Operational Test and Diagnostics
Figure 4-11 shows the flow of test procedures and test condition combi-
nations (logic) necessary for fault isolation.
47
0U
00
00
cc 0 0
0
'a w oz0
0
1 0
C))
,0
-4j
'-___________________________
oI

Disconnect the regulator output from the electrical system (open circuit
at output adapter). Place a full load (25 amps minimum for the M151) on the regulator
output. The voltage output should be between 27.0 and 27. 5 volts. If the output is high,
the regulator needs adjustment and should be replaced. If the output is low, the gen-
erator field is disconnected from the regulator and connected to the generator output.
The generator output voltage should be 30 volts or greater. If it is 30 volts or greater,
the regulator is malfunctioning and should be replaced. If the generator output voltage
is low, the generator is defective and should be replaced. If the generator and regu-
lator are good, disconnect the load, reconnect the battery, and open the generator field
winding. The current through the regulator should drop to -0- amps. If the current is
positive the generator has a malfunction; if the current is negative, the regulator has a
malfunction.
d. Test Limitations and Justification
1) The regulator output is reflected back to the generator, thus elimi-
nating the need to directly load the generator. If a faulty regulator pre-
vents loading, this will be indicated by the voltage measurements.
2) A bad or high resistance regulator connection will indicate a faulty
regulator.
3) A broken generator to regulator cable or broken or high resistance
generator to regulator cable connector will result in a faulty regulator
indication.
4) Low engine rpm during the generator test may cause low generator
output which would indicate a faulty generator.
5) Slipping fan belts may cause a faulty generator indication.
C. TEST EQUIPMENT
This section contains detailed descriptions and schematic drawings of interface
connectors and transducing circuitry needed for automatic test equipment interface and
signal conditioning. Equipment pertinent to each subsystem is described under the
49

subsystem heading. Some interface equipment has been described in the Test Proce-
dures under initial hookup requirements.
1. Battery Subsystem
a) For battery interface, four battery clamp/terminal clamps as shown in
figure 4-12 are needed. The main body clamp portion makes contact with the
battery terminal clamp while the terminal probe makes contact with the bat-
tery terminal. The terminal probe is shown in figure 4-13.
b) A ground clamp for connection to either the battery ground cable chassis
lug or to the exhaust manifold is needed. This clamp is a large alligator-type
clip.
2. Starter Subsystem
a) A connection to the starter terminal will be made utilizing a large
alligator-type clip with good insulation to prevent accidental grounding.
b) The current probe for interfacing with the starter cable will be the
FRE-21976-DC Current Transducer developed at Frankford Arsenal.
3. Electric Fuel Pump Subsystem
a) An adaptor must be made to fit between the fuel pump input and the con-
nector on wire 77. This consists of a short piece of wire spliced to a test
lead in the middle and with a male connector on one end and a female connec-
tor on the other end to mate with the quick disconnect terminals used through-
out the vehicle.
b) An adaptor must be made to fit between the fuel pump and carburetor con-
taining a pressure transducer. This consists of a short piece of steel tubing
the same diameter as that used at the ends of the fuel line, with a tee connec-
tion in the middle to accommodate the pressure transducer and with a small
piece of flexible line at one end to allow interconnection.
50

TWO-CONDUCTOR CABLE: HI CURRENT-CLAMP
LO CURRENT-PROBE
IX
V /CLAMP
TERMINAL PROBE
(SEE FIG. 4-13)
ROOO1-LB-13
Figure 4-12. Battery Test Clamp
51

INPUT NON-CONDUCTIVELEADCONNECTION
LOADING SPRING
SPRING-LOADED PROBE(CONDUCTIVE)
ROOOI-LB-14Figure 4-13. Terminal Probe
c) A test lead for diagnostics must be made with a connector to mate with
the cable to the oil pressure safety switch. This will be a three-wire cable
terminated with two relays which may be energized by the automatic control
circuitry.
4. Ignition Subsystem
a) An adaptor must be made to fit between the distributor input and the con-
nector on wire 12. The adaptor will contain an ammeter shunt and provide
access to each end of the shunt resistor.
b) Color-coded test leads terminated with alligator clips are used to inter-
face with the ignition coil primary terminals for diagnostics with the dis-
tributor cap removed.
c) Color-coded test leads terminated with alligator clips are used to inter-
face with the ignition switch terminals for diagnostics with the switch removed
52

from the dashboard. The quick-disconnect terminals on the ignition switch
are pulled out of the insulated carriers and reconnected only far enough to
make good contact. This leaves enough bare contact to allow connection of a
minigator clip for test lead hookup. An alternative to this would be to make
a special adaptor to be placed between the wires and the ignition switch itself.
This would allow test lead hookup.
d) The breaker points are monitored for open and closed conditions to pro-
vide a basis for dwell measurement and timing and for other functions which
depend on breaker point position. This is accomplished with a simple diode
transistor logic nand gate as shown in figure 4-14. This circuit is unique
only in that the diodes must be at least 400 pry and the input current small
enough to not significantly affect the voltage drop across the breaker points.
The input parameters for this circuit are approximately 1. 0 volt or less for a
logic zero and 2. 0 volts or more for logic one.
TO DIGITAL
IC LOGIC
, -DIGITAL+I4 ______COMMON+ 24V0 croC0MM0N
REG, REG. L L•C. P. CLARE
Z12K IN914 PRB- 1003IP B_ TO TACH./DWELL
S94CIRCUITI1N647 IN647 IN647
0/ 2N697
BREAKERPOINTS
ANALOG COMMON ROOOI - LB-15
Figure 4-14. Breaker Point Interface
53
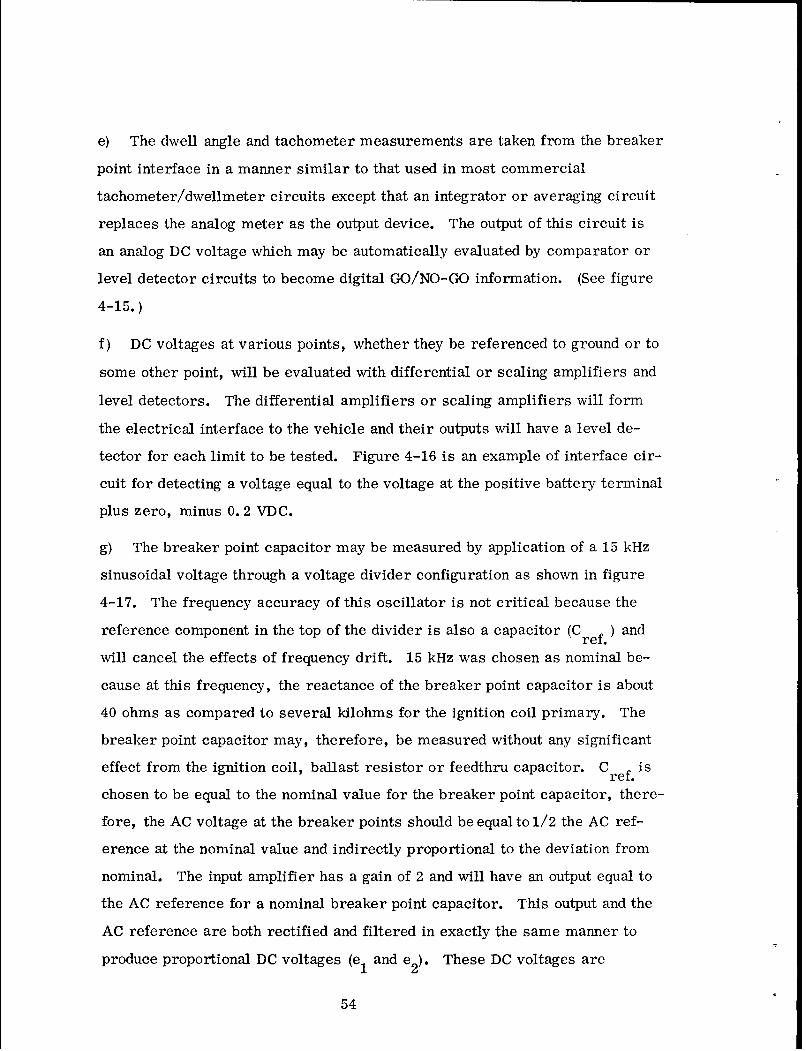
e) The dwell angle and tachometer measurements are taken from the breaker
point interface in a manner similar to that used in most commercial
tachometer/dwellmeter circuits except that an integrator or averaging circuit
replaces the analog meter as the output device. The output of this circuit is
an analog DC voltage which may be automatically evaluated by comparator or
level detector circuits to become digital GO/NO-GO information. (See figure
4-15.)
f) DC voltages at various points, whether they be referenced to ground or to
some other point, will be evaluated with differential or scaling amplifiers and
level detectors. The differential amplifiers or scaling amplifiers will form
the electrical interface to the vehicle and their outputs will have a level de-
tector for each limit to be tested. Figure 4-16 is an example of interface cir-
cuit for detecting a voltage equal to the voltage at the positive battery terminal
plus zero, minus 0. 2 VDC.
g) The breaker point capacitor may be measured by application of a 15 kHz
sinusoidal voltage through a voltage divider configuration as shown in figure
4-17. The frequency accuracy of this oscillator is not critical because the
reference component in the top of the divider is also a capacitor (Cref.) and
will cancel the effects of frequency drift. 15 kHz was chosen as nominal be-
cause at this frequency, the reactance of the breaker point capacitor is about
40 ohms as compared to several kilohms for the ignition coil primary. The
breaker point capacitor may, therefore, be measured without any significant
effect from the ignition coil, ballast resistor or feedthru capacitor. Cref. is
chosen to be equal to the nominal value for the breaker point capacitor, there-
fore, the AC voltage at the breaker points should be equal to 1/2 the AC ref-
erence at the nominal value and indirectly proportional to the deviation from
nominal. The input amplifier has a gain of 2 and will have an output equal to
the AC reference for a nominal breaker point capacitor. This output and the
AC reference are both rectified and filtered in exactly the same manner to
produce proportional DC voltages (eI and e2 ). These DC voltages are
54

DETECTORDWELL390 TEST
BREAEA OER
POINTS A
______________ ANALOG COMMON
PANEL METER::;
LEIDEE
DETECEOERATOR:SIOORM RPM TEST
DETECTOR
Figue 4-5. Tchomter/welMer
55VE

z0
-J 0
00C0 0
o ui
+
0 (0
uu
00
A W
w
LA: w
ww
oww
ww
U)L W)
56

compared in a difference amplifier to produce a DC error voltage which is
indirectly proportional to the deviation from nominal breaker point capaci-
tance; e1 is buffered with a voltage follower to produce a DC reference volt-
age. This voltage is divided in proper proportions to produce a reference for
high limit comparator. Note that all voltage references are taken from the
15 kHz oscillator which eliminates the need for precise amplitude control of
the AC voltage.
h) The spark plug voltage may be continuously monitored during the various
test conditions by a peak-reading kilovoltmeter circuit as shown in figure
4-18. This is basically a scaling amplifier and a sample and hold circuit.
The scaling amplifier transforms the 4-megohm input impedance to a low
impedance suitable to charge the capacitor in the sample and hold circuit.
This amplifier has a gain of 0. 00025 in this circuit and must have a slew rate
of about 20V/us in order to track the HV waveform. The output of the sample
and hold circuit is a DC voltage initially at 0. 00025 x HV and linearly ramping
down to zero due to the input current of the amplifier and the various leakage
currents. This output may be interrogated with level detectors to verify that
the spark plug voltage is within specified limits. The output may be reset to
zero at any time by a relay or switch and will normally retain the highest
peak value that has been observed at the input for a period long enough to en-
able operation of the level detectors and logic memory.
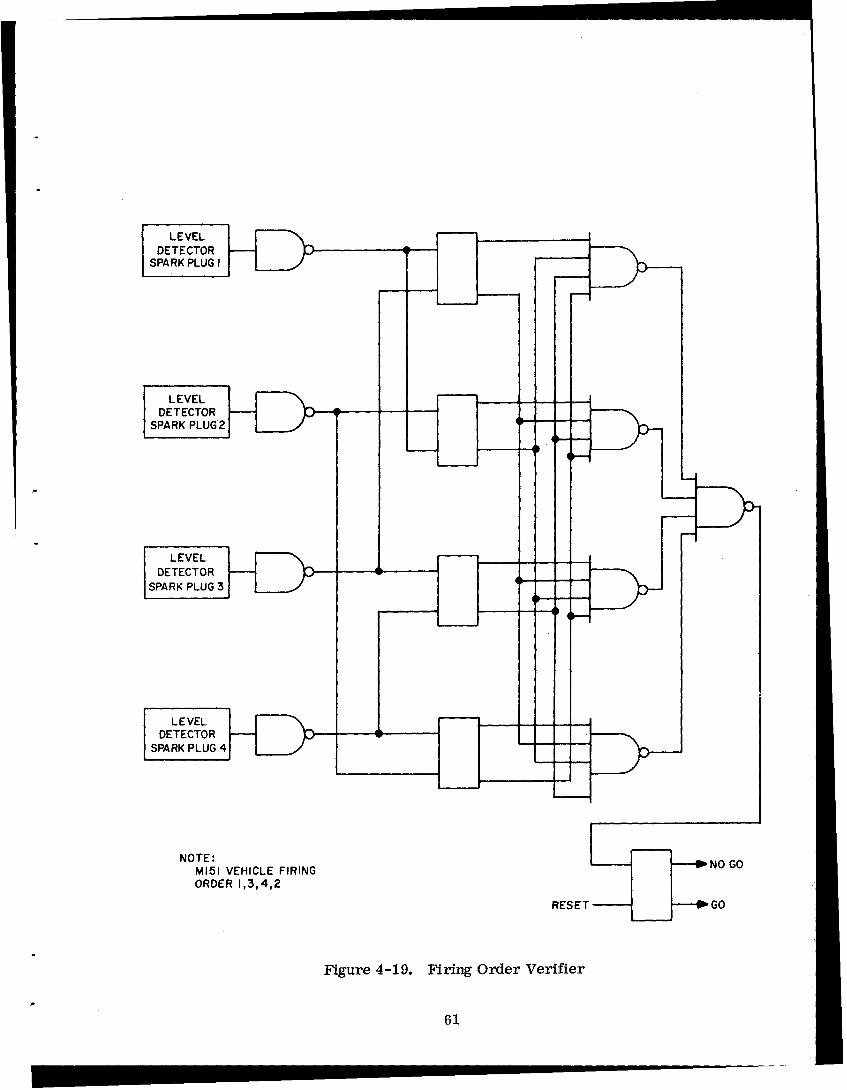
i) The firing order of the vehicles may be verified by inserting the logic
outputs from the respective level detectors into a bank of RS flip-flops and
gating matrix as shown in figure 4-19. In this circuit, the presence of HV
at a spark plug sets the respective flip-flop and the detection of HV at the
next sequential spark plug resets the same flip-flop. In the normal sequence,
only one flip-flop is set at a time and the set output is gated with all of the
other reset outputs to produce a verification for that step. The individual
steps are gated to form a continuous "GO" input to the final flip-flop which
will change state if any of the verification bits are missing to form an
59

-o-J
0w
0
z L
w C
4 -00
wW 0
0 '*0
00+o
zz4ý
0
(1) CL
60
LEVELDETECTOR
SPARK PLUG I
LEVELDETECTOR
SPARK PLUG 2
LEVELDETECTOR
SPARK PLUG 3
LEVELDETECTOR
SPARK PLUG 4
NOTE: - NO GOM151 VEHICLE FIRINGORDER 1,3,4,2
RESET- GO
Figure 4-19. Firing Order Verifier
61

inconsistency. This circuit configuration may be used for any number of
cylinders or firing order by adding flip-flops and gates or reversing input
lines.
5. Generator-Regulator Subsystem
a) Adapter 17-A-2987-75 is used to interface with the generator. The gen-
erator output is fed through the connector while the field circuit is interrupted
for test loading. Figure 4-20 is a diagram of the connector.
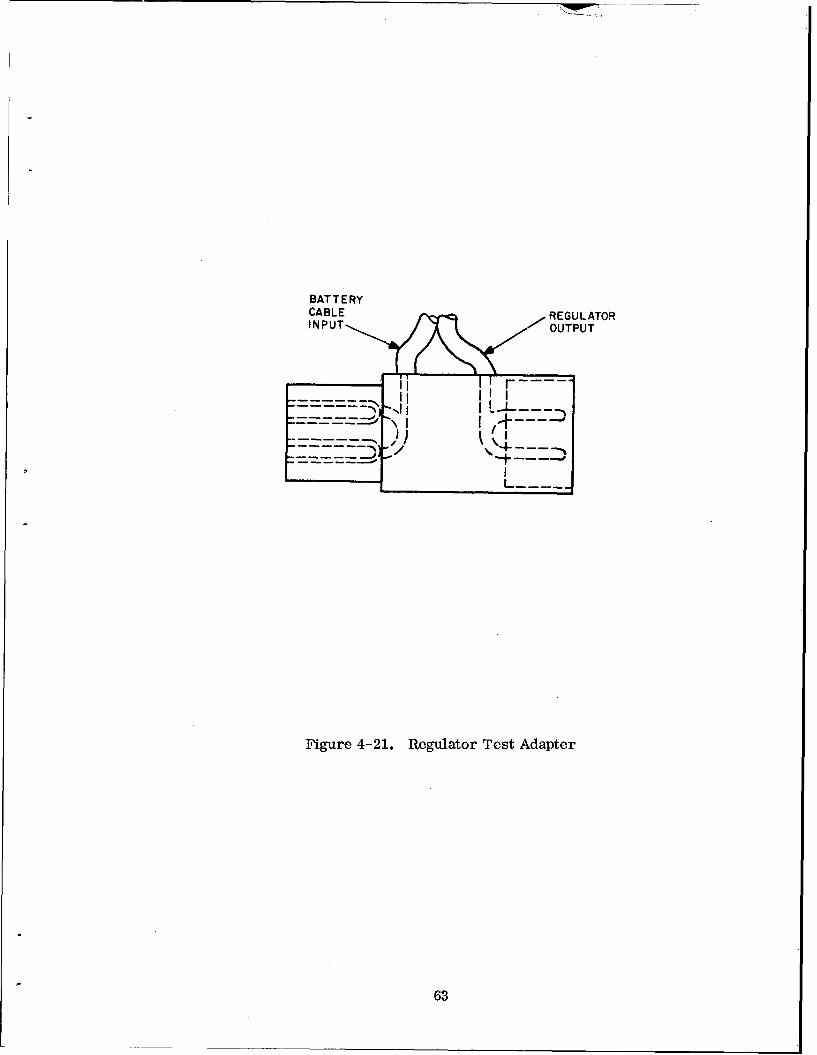
b) Adapter 17-A-2987-50 is used to interface with the regulator. The regu-
lator output is interrupted for monitoring and loading. This connector is
shown in figure 4-21.
GENERATOROUTPUT
REGULATOR GENERATORFIELD CONTROL FIELD
-/4H
II I
Figure 4-20. Generator Test Adapter
62
BATTERYCABLE REGULATORINPUT OUTPUT
- , I I [- i "I I (+
""--- I2)r--'
-- I
Figure 4-21. Regulator Test Adapter
63

VI. CONCLUSIONS AND RECOMMENDATIONS
A. FEASIBILITY OF AUTOMATIC TEST EQUIPMENT
Fault isolating automatic test equipment utilizing the test procedures described
in this report is feasible and desirable for testing wheeled vehicle electrical systems.
All operator actions are machine-directed and almost all operator decisions are
eliminated. This combination insures positive fault isolation. Repair time is mini-
mized in testing and part replacement; unnecessary part replacement is eliminated,
thus reducing material costs.
B. FUTURE AUTOMATIC TEST EQUIPMENT DEVELOPMENT
Westinghouse recommends that additional study time be invested in the following
items for reasons stated:
1. The 421 Battery Test - this test was chosen as the best presently available
test technique for automation where time of testing is essential. (See Section
V, A.) Battery test techniques could be further developed in a study directed
toward this goal.
2. The completely enclosed ignition coil secondary presents an access and mea-
surement problem. To provide consistent and accurate measurements, our
approach was to insert adapters in each spark plug lead for ignition secondary
tests. While this approach provides complete test information, test equip-
ment interface time is high compared to a single secondary connection. If an
ignition secondary test point is not provided on future vehicles, further time
should be expended on investigating and developing a comprehensive test
technique and transducer for this parameter.
3. As an alternate to item 2, we feel that additional test information could be
obtained from analysis of the ignition primary waveform. If a suitable test
64

technique were evolved from development in this area, redesign of the ignition
distributor would be eliminated. Also, since the ignition primary is readily
accessible for test interface, the need for a secondary interface transducer
(item 2) would be eliminated.
4. A final recommendation for further development is a study of parameter
limits to be applied to our test and fault isolation procedures. Parameters
have been defined; only vehicle variations will effect test technique and para-
meter limits. Westinghouse is most anxious to explore this most important
area.
C. FUTURE BUILT-IN TEST POINTS
1. Diagnostic harnesses with connectors for direct connection to automatic test
equipment should be made a part of standard vehicle wiring. Interface points
directed or influenced by our test procedures would be made accessible for
rapid interface thus reducing time required for test equipment hookup. Other
advantages of this harness would be elimination of errors by incorrect multi-
ple connections, minimum number of cables and adapters would be required
with each test set, and a standard connector could be used on all vehicles.
2. To aid in diagnostic testing, the starter switch terminals should be made
easily accessible. Presently, the switch must be removed from the vehicle
for complete verification of its operation when diagnostics are performed on
the starter system.
3. Referring to items 2 and 3 of Future Automatic Test Equipment Development
section, a test point for the ignition secondary should be made available. The
most direct approach to this would be modifying the distributor cap to provide
a plugged connection (similar to the primary access) to the secondary con-
ductor in the cap.
65

D. SECONDARY SUBSYSTEMS
During our study to insure full investigation and effort on diagnostics and automatic
test equipment for electrical subsystems which directly affect vehicle operation and
reliability, the electrical system was divided into "prime" and "secondary" sub-
systems. The "prime" subsystems are those for which we have completed diagnostics
and recommendations for automatic test equipment.
The "secondary" subsystems are: Lighting and main wiring system, Directional
signals, and Instruments, gauges and horn. These subsystems do not require the
operational fault isolation techniques as do the "prime" subsystems; the basic approach
for testing the "secondary" subsystems would be an automatic circuit checker (con-
tinuity tests) with appropriate interface connectors.
Since our basic test philosophy depends on a suspected malfunctioning vehicle,
these "secondary" subsystems need not be tested unless an obvious visual (audio) in-
dication of malfunction is present. Also, these subsystems are independent of the
"prime" operational subsystems and can be tested individually as required or as
desired.
Automatic test equipment is directly applicable to the "secondary" subsystems
as the test procedure consists of test point selection and continuity/resistance mea-
surements.
E. TEST PROCEDURES IMPLEMENTATION
The vehicle diagnostics automatic test equipment block diagram (figure 5-1) is our
concept for implementation of the test procedures. The configuration shows control by
a sequential digital controller unit directed by a diagnostic program. A small digital
computer could be used for control.
Test information flows from left to right in the diagram. Vehicle/Test System
Interface provides the system inputs. These inputs are broken into two groups: 1)
inputs needed for operational "GO" testing, and 2) inputs required only for specific
diagnostics.
66

Input signals are fed either through special signal conditioning circuits or directly
to level detectors and/or comparators for processing. Finally, test conditions aregated and displayed via the system output. Operator actions are also directed by the
output display.
67

APPENDIX ASUBSYSTEM SCHEMATIC DIAGRAMS
Figures A-1 through A-5 are schematic diagrams of each electrical subsystem
as diagnosed. These diagrams are all for the M151 vehicle. Slight modification or
additions are necessary for other vehicles.
70

STARTER SWITCH TERMINAL
C LAM P S~MORE NEG. TERMINAL
VPOSITIVE
TERMINAL 0 ,a CLAMP
CLAMP-' 1-BATTERY INTERCONNECTING CABLE (CKT 68)
OREE P E,,-TENEGR TERMINAL
B.MRE---- NEGATIVE BATER
CBATRCLM-OEPOSITIVE_,- BATEYPOITVETEMIA
E ITERMINAL
CLAMP BATTERY GROUND CABLE (CKT7)
BATTERY SUBSYSTEM CASSGON
A. MORE POSITIVE BATTERYB. MORE NEGATIVE BATTERY
C. BATTERY CLAMP- MORE POSITIVE BATTERY, POSITIVE TERMINALD. BATTERY CLAMP-MORE POSITIVE BATTERY, NEGATIVE TERMINALE. BATTERY CLAMP -MORE NEGATIVE BATTERY, POSITIVE TERMINAL
F. BATTERY CLAMP -MORE NEGATIVE BATTERY, NEGATIVE TERMINALG. BATTERY INTERCONNECTING CABLE (CKT. 68)H. BATTERY GROUND CABLE (CKT. 7)
RO001- LB-I
Figure 1. Battery Subsystem M151 Vehicle
71

STARTER SWITCH TERMNAL-
STARTER SWITCH STARTER SWITCH-TO-STARTERi • ~~CABLE k•KT 6)STRE
STARTE R! • " TERMINAL
STARTER SWITCH TO
BATTERY CABLE (CKT6)
STARTER CASE
GROUND
--BATTERY
SREGULATOR
I--GNITION SWITCH
A. BATTERY-TO-STARTER SWITCH CABLE (CKT. 6)B. STARTER SWITCH
C, STARTER- TO- STARTER SWITCH CABLE (CKT. 6) ROOOI-LB-2
D. STARTER
Figure 2. Starter Subsystem M151 Vehicle
72
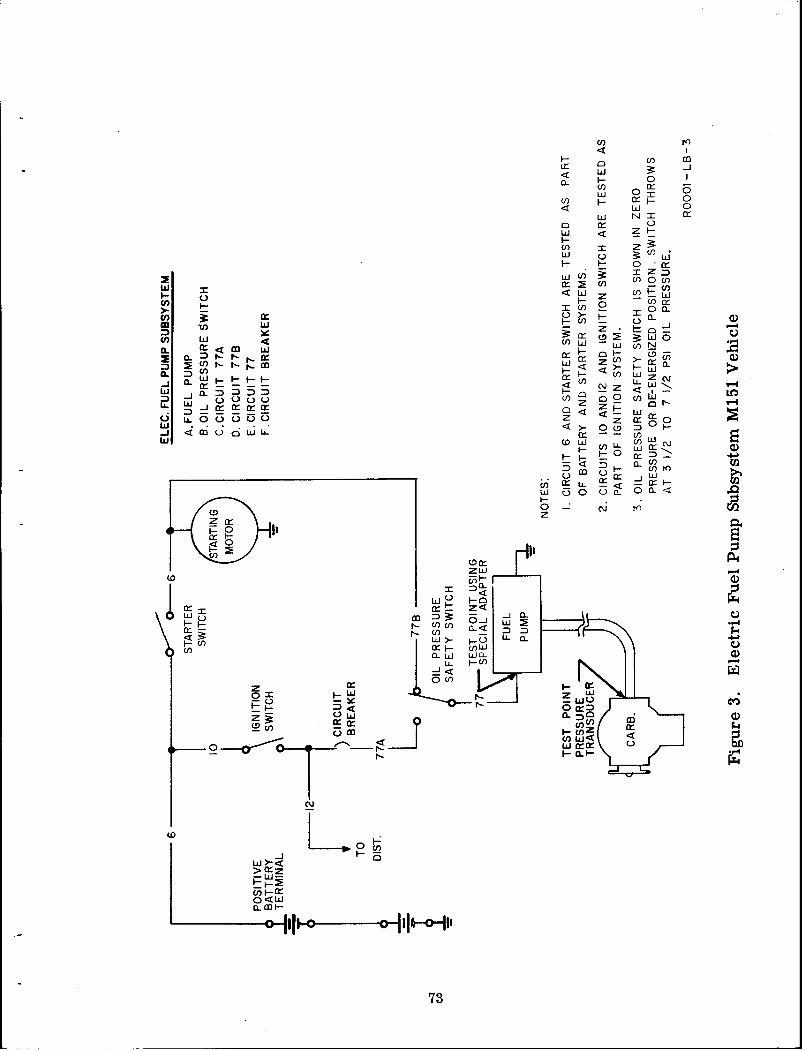
U)
CL U) mLiJ 0m
U) H r F 0
0 w
Hw 0 WH0 -M
Liii
wU) )
0- 0zH) it0 Lfa.
m ) w HU) LL -:3 m i U)W m L U)N
9L 5cn H r WJ ~0- H H LL - - I-F U) W Z C
M- - -, ) LL-
noo U)0
L) U)Jo
LLOOO w z P
C;~~ ~ ~ W, U- -0 3o-Wn g -~ (n
<0 a- U)'F- (nPr
(00
Z: Z C.
0~zHU)
F, --
z I- M
x wirt z<
(0U
U)~ ~ ~ LU F-U -
CLw J W0-aJH
z I- 0 co I
0 W L73

24 V PRIMARY INPUTFROM IGNITION SWITCH
THIS POINT AVAILABLE USING ADAPTER SETF I IGNITION SUBSYSTEM
0.25 UF FEED A. DISTRIBUTOR ASSEMBLY
THRU CAP _ B. DISTRIBUTOR CAP
IIDISTRIBUTOR C. DISTRIBUTOR ROTOR
OHOUSING D. BREAKER POINTSDISTRIBUTOR E, BREAKER POINT CAPACITOR
L F. IGNITION COILRESISTOR - G IGNITION COIL-TO-BREAKER
1 BALLAST
(P/O COIL) POINTS LEAD
H. BALLAST RESISTOR
1. FEEDTHRU CAPACITOR
J. CIRCUIT 12
K. IGNITION SWITCHIGNITION L. CIRCUIT II
I VA COIL ABLE DESIRED M. SPARK PLUG NO. I
P/O TEST N. SPARK PLUG NO. 2AVAILABLE DIST POINTTEST POINT CAP 0 SPARK PLUG NO. 3
P. SPARK PLUG NO.4
Q. SPARK PLUG CABLE NO. I
BREAKER R. SPARK PLUG CABLE NO. 2CAP 0 O1 UF S. SPARK PLUG CABLE NO. 3
SO.23UF T. SPARK PLUG CABLE NO. 4BREAKER
POINTSL _ -- . .. _
SHIELDED
SCREW-ON CABLES
CONNECTOR
THESE POINTS AVAILABLE4 3 2 IOUSING ADAPTER SET
SPARK PLUGSRF
SUPPRESSION IOK [OK IOK 10KRESISTORS
CHASSIS GROUND ROOOI-LC -4
Figure 4. Ignition Subsystem M151 Vehicle
74

•,(IGNITION AND.•TEST POINT USING BATTERY)
TEST ADAPTER
GENERATOR-REGULATOR
SUPPRESSOR
S _ _ 60n£)
220n1-I- CUT-OUT
RELAY
15012S - -- VOLTAGE
I i.RELAY
CURRENT __- _LA,
RELAY
560n 40C, IN1200A
(.,, - - r. SHIELDED HARNESSS,.•"1 ND -CONNECTOR
F YTEST POINT USING SHEILDEDGENERATOR SYSTEM TEST ADAPTER
GENERATOR-REGULATOR SUBSYSTEM
B REGULATORC.FAN BELTSD. GENERATOR-TO-REGULATOR
CABLEE. REGULATOR-TO-STARTER
SWITCH CABLE (CKT. 5)
ROOOI-LC-5
Figure 5. Generator-Regulator Subsystem M151 Vehicle
75

APPENDIX BTEST POINT ANALYSIS
Existing Test Points in the Ignition, Battery, Generator /Regulator, and Starter
subsystem were evaluated/analyzed as to accessibility, type of interface necessary,
and completeness of subsystem measurements that could be made at these points."Existing" was defined as a test point used in procedures called out in Dash 20
manuals and included those points made accessible through the use of adapters.
Each subsystem was also analyzed for the "desirability" of future or other test
points than the existing ones. Determination of these desirable test points was based
on accessibility, amount of information to be gathered by making measurements at
this point and for completeness of checking the subsystems.
This appendix is a summary of the results of this analysis. Each subsystem is
divided into two categories - existing and desirable test points. If a test point is
useful in checking more than one subsystem, reference is made to that fact. Desirable
test points have been broken out to emphasize those that are presently feasible and
those that are recommendations for the future.
76
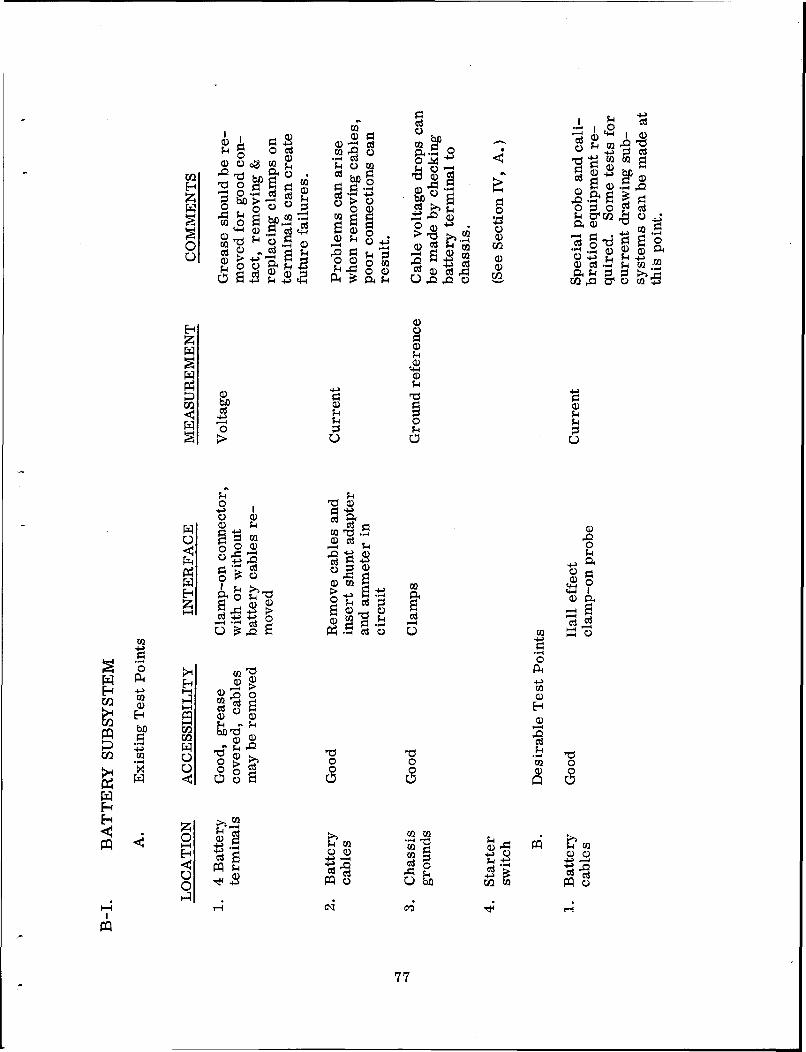
C.)0
0.-4 4-1CI:d
~~ 0 ýd~C
0zý0 04
,-, c0 .. j-4 cn -4 4
H 00m>-40 0>Q h
:00
tQ 0 'dr 0
0) '0o a> -4 00 d a
P 0 a ;4 10c 0 C )w;44< $- 4- -4U
0 00u
ci))
Ci)d .15
WH
1-4 .C2 0 1 -
0 00
H4-)~ 0
0 0d
PP $4 C 0~
77
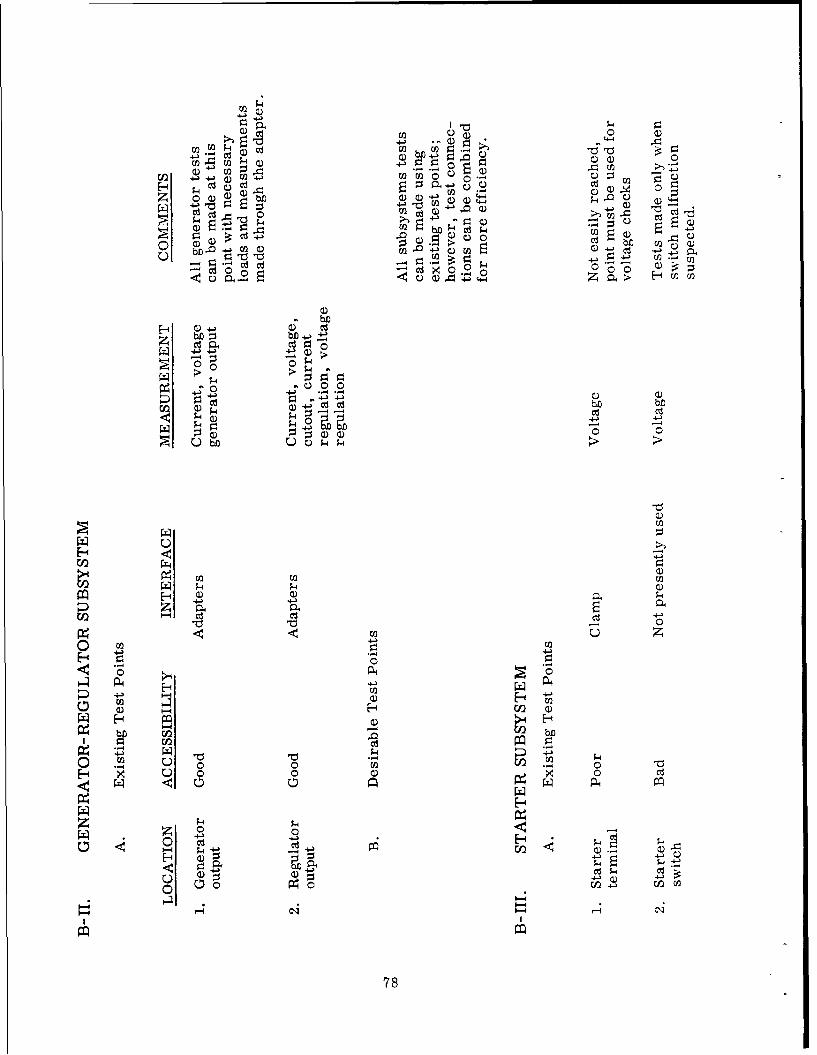
4)-
C)U 0)
- ~ ~ ~ Q U) )C
Q) 4)44 -
H d M)4 U) CtQ) Q)
4).S-4 bC 0 cd
4)0 00 U w > M biU
' ~ ~ Q U)CU d
H U) 0Ub) 4
o o. >- o. 0 .
44 4- 4-).H CQ U) b
o4 -44 0--
0 0z
z P4-4 Cd4 .4
- 4 4-
4--
u ca78

0 c0
O(.- Cd
0 )Q 0) Q)C Q
C- ý4 ; C.)o ;3 Pý 0 4, .
4U 0d OCd Cd~ 0 C) 00.
~~~ (1C ) ) 1 Cd 4
0 C6 w d
C.)
bD0 bJ) bf) Ufcd -4 0Cd
-44 I -4 ---4 -4 4 j0 r 0 ~ 0
> >
00Cd Cd Cd
o4 oH o 0
1 P p0 .0
4JE
-4
000
0
1- p 1- Cd 04 :!E- '-4Q
d 0 C C) 0- 0;C-40 M C. N 0 1
ý41I
14 1-4
79
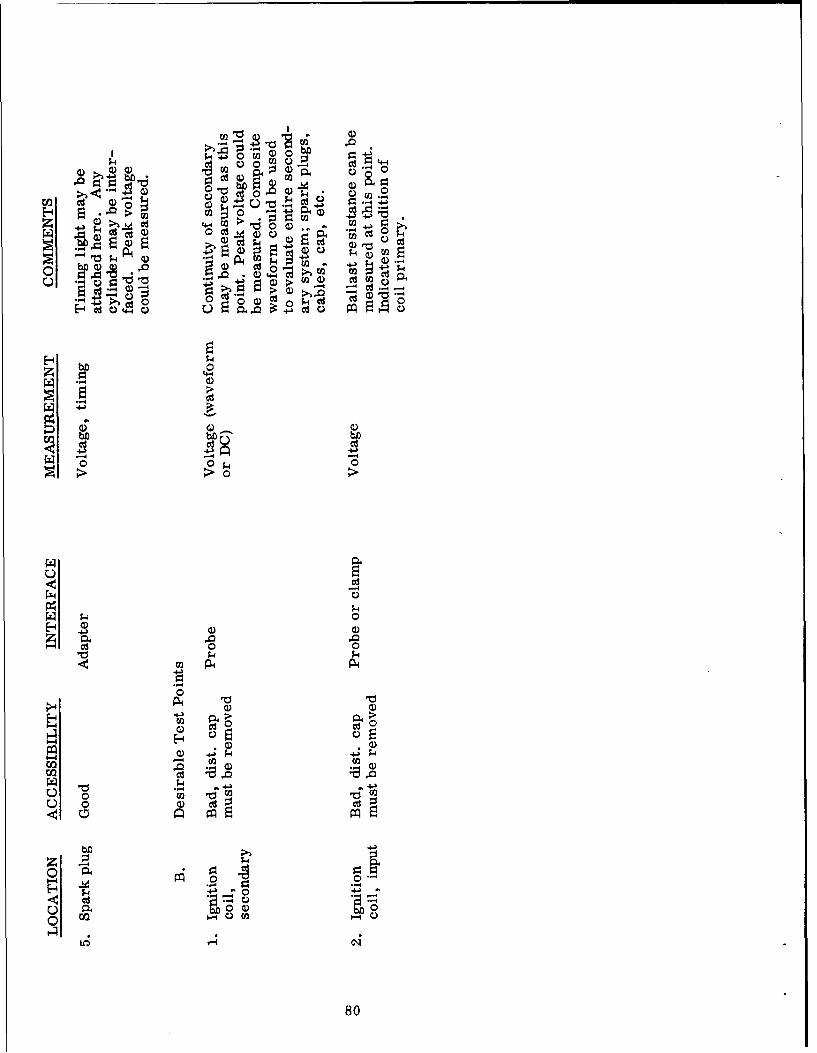
0 0w) (D 0 0
""0 *CL! 02 4
C) +. U 'm. C).-8$- -
o >1 -Y c .4M d ) Wd02
Q Q 04 cC) C
di Q) C)0.>b1 b1
S-44
C)d
,0 ;400 0
I.4
4 J4
00
E44
- 02 9 0
'-4
M 0 d
z P~'4 pi
;44
C) U2 I-A Qca
14 '
80

APPENDIX CFAATE CHARTS
This appendix contains FAATE charts that can be used for Fault Isolation in theBattery and Starter, Ignition, and Generator-Regulator Subsystems. They can be
used in their present form for troubleshooting the M151 Vehicle's electrical system.
The symbols found in the FAATE charts are defined as follows:
Rectangle - Encloses an "Instruction" (Instr.) to be performed by the tester. Theinstruction is identified by a "letter" found in the upper left-hand corner of the
rectangle.
Diamond - Encloses a "Test Node" (TN) and requires a decision of Yes or No, GOor NO-GO, or HI, LO, or GO. The test node is identified by a "number" above
the left point of the diamond.
Circle - Encloses a transfer instruction or reveals the last test node or decisioninvestigated.
Square - Encloses the component to which the fault has been isolated.
81
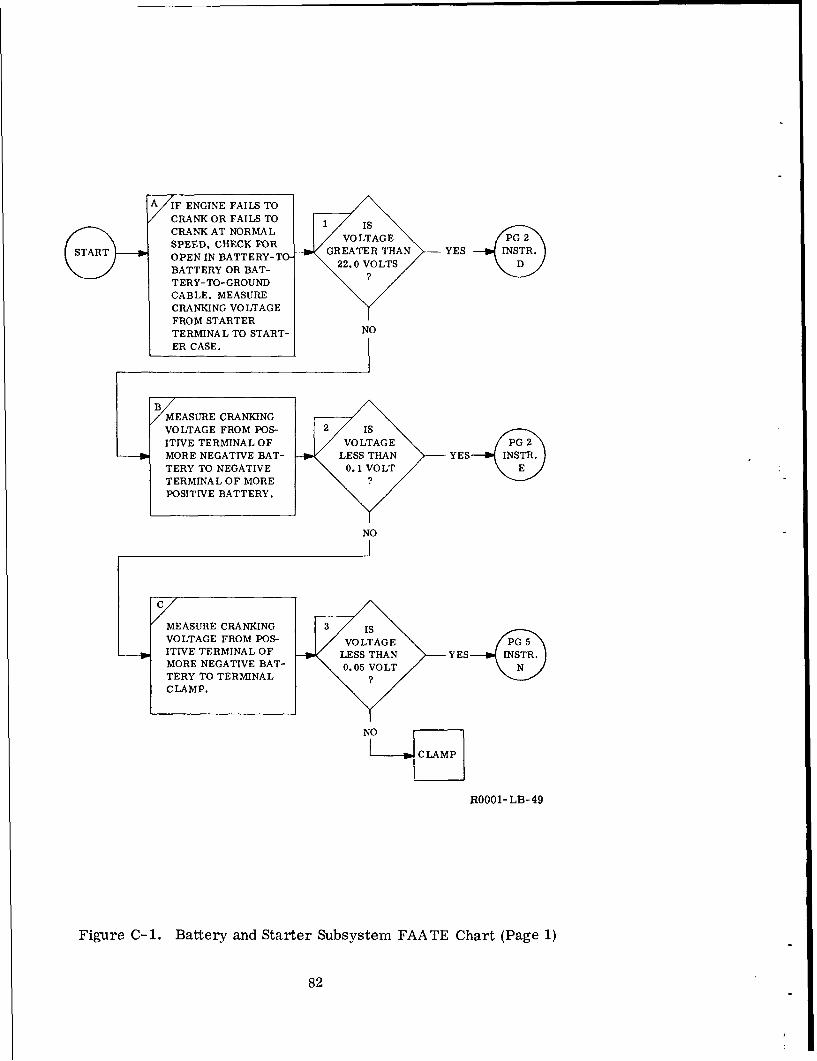
A 1F ENGINE FAILS TOSCRANK OR FAILS TO isE
VCRANK AT NORMALSPEED, CHECK FOR GRTTANOPEN IN BATTERY-T- 22.0 VOLTSBATTERY OR BAT-TERY-TO-GROUNDCABLE. MEASURE
CRANKING VOLTAGEFROM STARTERTERMINAL TO START- NO
ER CASE.
YEASURE CRANKINGVOLTAGE FROM POS- 2 i
ITIVE TERMINAL OF VOLTAGE
MORE NEGATIVE BAT- LESS THAN YES
TERYTO NEGATIVE R0.M1 VOLT
TERMINAL OF MOREL TSPOSITIVE BATTERY.
NO
MEASURE CRANKING 3 iVOLTAGE FROM POS- VOLTAGEITIVE TERMINAL OF LESS THAN YES-4MORE NEGATIVE BAT- •0. 05 VOLT
TERY TO TERMINAL ? /
CLAMP.
R0001- LB- 49
Figure C-1. Battery and Starter Subsystem FAATE Chart (Page 1)
82
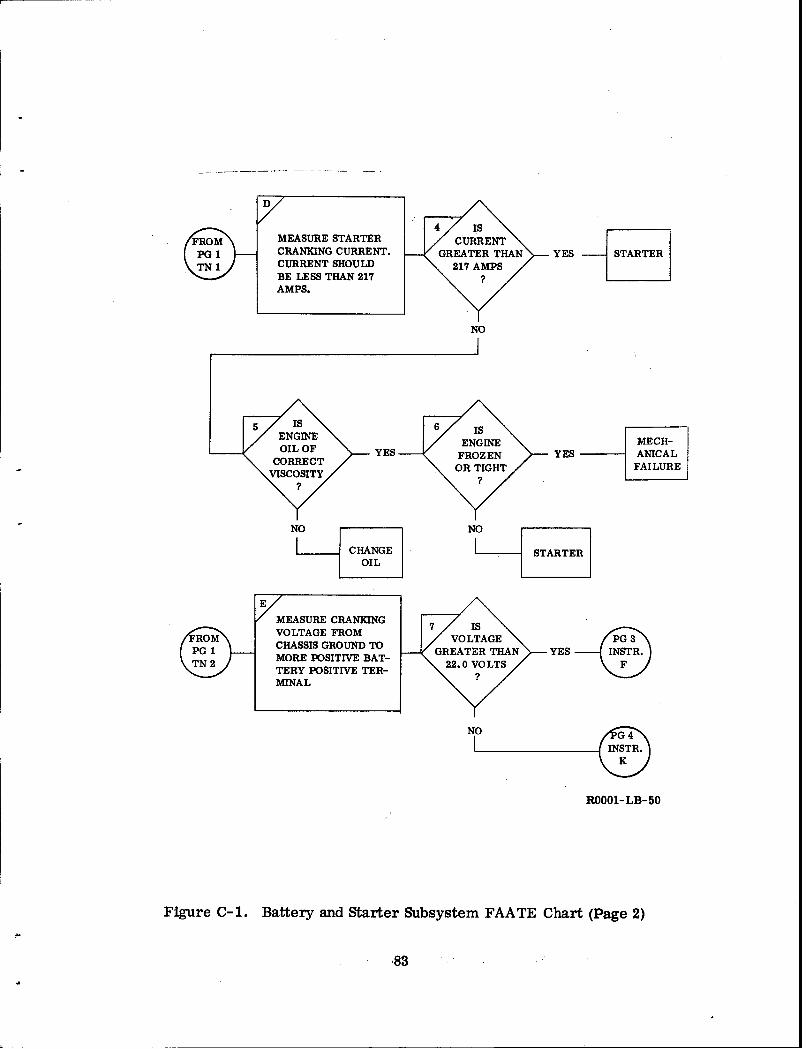
SMEASURE STARTER CURN
CRANKING CURRENT. GREATER THAN YES STARTERCURRENT SHOULD •217 AMPSBE LESS THAN 217 ?AMPS.
NO
S6 isENGINE MECH-
YES FROZEN YES ANICALOR TIGHT FAILURE
NO NO
CHANGE STATER
MEASURE CRANKING 7P 3
SVOLTAGE FROM VOTG
CHASSIS GROUND TO _4 HN YES -
MORE POSITIVE BAT- GET VOLTS YTERY POSITIVE TER- ?MINAL
NO G4
INSTR.K
R0001- LB- 50
Figure C-1. Battery and Starter Subsystem FAATE Chart (Page 2)
83

MlEASURE CRANKING I I
VOLTAGE FROM MORE VOLTAGEPOSITIVE BATTERY LESS THAN YESPOSITIVE TERMINAL YE SVOTO STARTERTERMINAL.
NO
GI
MEASURE CRANKING V Y NVOLTAGE FROM MORE VOLTAGE,
POSITIVE BATTERY LESS THAN YES
POSITIVEL.TERMINAL .05 VOLT
TO CLAMP.P
NOREMR STARTER 1R
SWITCH
R0001-SLB- 51
Figure C-1. Battery and Starter Subsystem FAATE Chart (Page 3)
84

MEASURE CRANK- 11 is STARTERING VOLTAGE AT VOLTAGE SWITCHA STARTER SWITCH GREATER THAN YES TOTERMINAL TO 18.5 VOLTS STARTER
GROUND. ?/ CABLE
NO BATTERYTO
STARTERSWITCHCABLE
MEASURE CRANK- 12 isFROM ING VOLTAGE FROM VOLTAGE PPG3 MORE NEGATIVE LESS THAN YESTN8 BATTERY NEGATIVE 0.1 VOLT
TERMINAL TOROM CHASSIS GROUND.
NO
ASURE CRANK-"ING VOLTAGE FROM VOLTAGE BATTERYSMORE NEGATIVE LESS THAN YES -- TO
BATTERY N E 0.1 VOLT GROUND"-TERMINAL TO ? CABLE• •. CLAMP.
NO
CLAMP
R0001-LB- 52
Figure C-1. Battery and Starter Subsystem FAATE Chart (Page 4)
85

k/FOR DEFECTS * CHECK G
ELECTROLYTIC LEVEL 14 DOFROM DISCHARGE BATTERY POINTSP0 4 • AT 50 AMPS FOR 15 LIE IN THE YES CHARGE
TN12SECS. WAIT 5 SECS GOOD AREA BATTERYAND MEASURE OPEN ?CIRCUIT VOLTAGE
(Vi) CHARGE BAT-TERY AT 14.0 VOLTS
20 AMPS LIMITED FOR
45 SECS. WAIT 15 SECS. NO
AND MEASURE OPEN :B BATTERYCIRCUIT VOLTAGE (V2)PLOT V1 AND V2 ON
GRAPH PG 6.
N
MEASURE CRANKING 15 isFO 'VOLTAGE FROM MORE VOLTAGE BATTERY
PG 1 POSITIVE BATTERY LESS THAN YES TONEGATIVE TERMINAL 0.05 VOLT BATTERY
TO CLAMP
I- CLAMP
R0001-LB-53
Figure C-1. Battery and Starter Subsytem FAA TE Chart (Page 5)
86

14
GOOD
13
V2 VOLTAGEAFTER 12
CHARGE BADGOOD
GOODII
BAD
I0,9 10 II 12 13
V, VOLTAGE AFTER DISCHARGE
Figure C-1. Battery and Starter Subsystem FAATE Chart (Page 6)
87
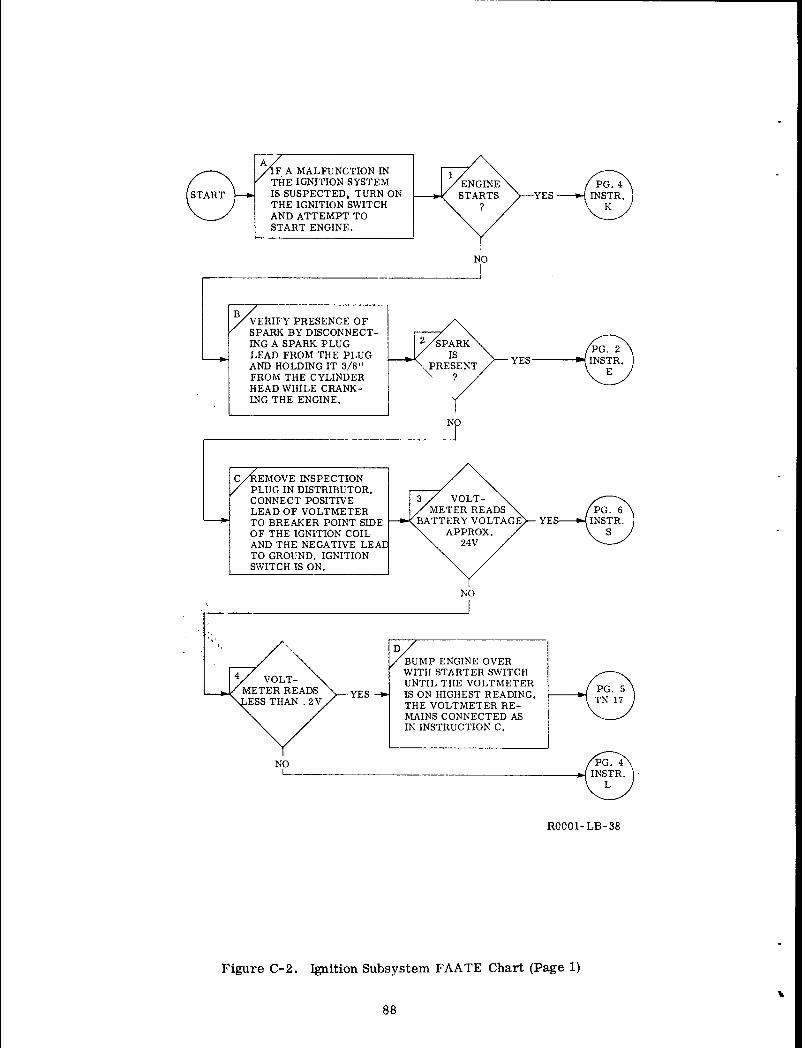
XA1F A MALFUNCTION.IN1THE IGNITION SYSTEM ENGINE PG 4
START IS SUSPECTED, TURN ON STARTS YES OINRTHE IGNITION SWITCH KSI AND ATTEMPT TO
S~START ENGINE.
NO
SPARK BY DISCONNECT-
ING A SPARK PLUG 2 SPARKLEAD FROM THE PLUG i_ s YES
AND HOLDING IT 3/8" ,PRESENTFROM THE CYLINDER ?HEAD WHILE CRANK-ING THE ENGINE.
NO
0/ EMOVE INSPECTION/ PLUG IN DISTRIBUTOR.
CONNECT POSITIVE 3 OT
LEAD OF VOLTMETER METER READSTO BREAKER POINT SIDE BATTERY VOLTAGE YE NTOF THE IGNITION COIL APPROX.AND THE NEGATIVE LEA 2TO GROUND. IGNITIONSWITCH IS ON.
NO
_YB MP ENGINE OVER
4 WITH STARTER SWITCH
'~ VOLT- UNTIL THE VOLTMETER PG.METER READS YES IS ON HIGHEST READING.
ESS THAN 2V THE VOLTMETER RE-MAINS CONNECTED AS
IN INSTRUCTION C.
R0001- LB- 38
Figure C-2. Ignition Subsystem FAATE Chart (Page 1)
88
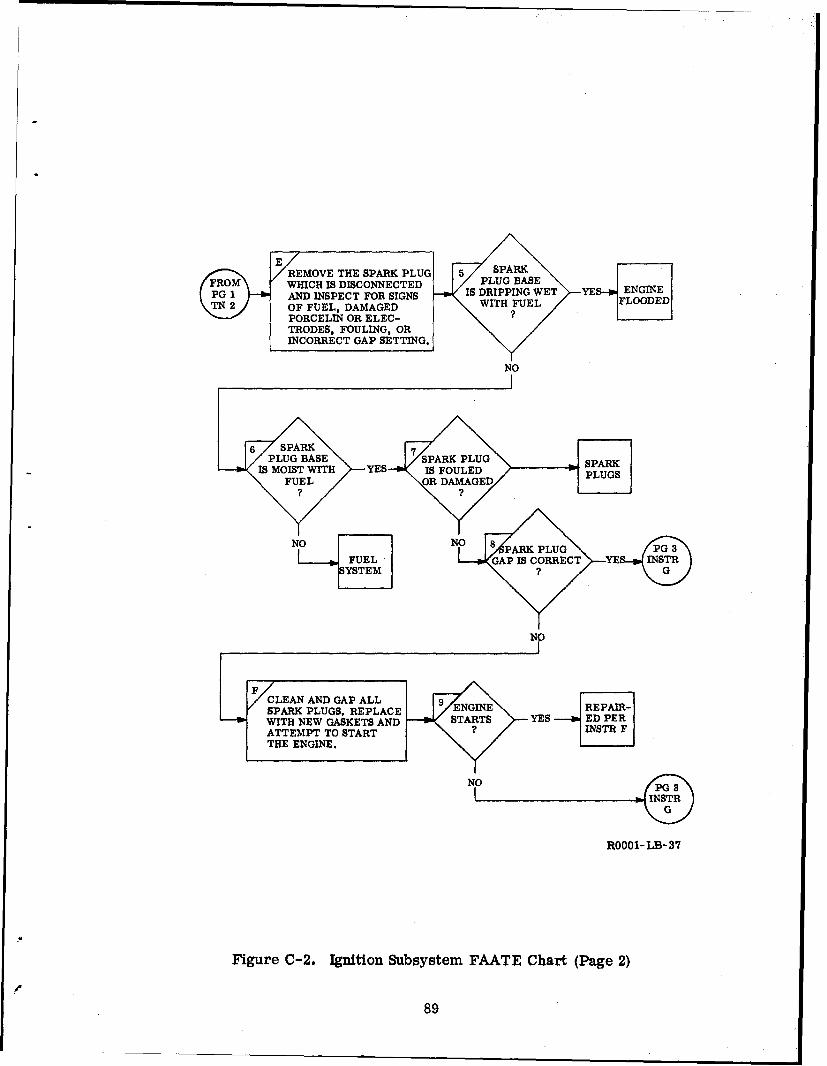
REMOVE THE SPARK PLUG 5 SPARKFROM WHICH IS DISCONNECTED PLUG BASE
PGW1CAND INSPECT FOR SIGNS IS DRIPPING WET YES- ENGINEOF FUEL, DAMAGED WITH FUEL FLOODEDPORCELIN OR ELEC- ?TRODES, FOULING, ORINCORRECT GAP SETTING.
NO
PLUG BASE SPARK PLUGIS MOIST WITH YES IS FOULEDI.SPR
FUEL OR DAMAGED
NO NOUGPARK PLUGRFUEL GAPISCORRECT YE INTTR
SYSTEM G
Nr
CLEAN AND GAP ALL 9SPARK PLUGS, REPLACE EGN EARWITH NEW GASKETS AND STARTS YES ED PERATTEMPT TO START ?INSTR FTHE ENGINE.
NO p
R0001-LB-37
Figure C-2. Ignition Subsystem FAATE Chart (Page 2)
89
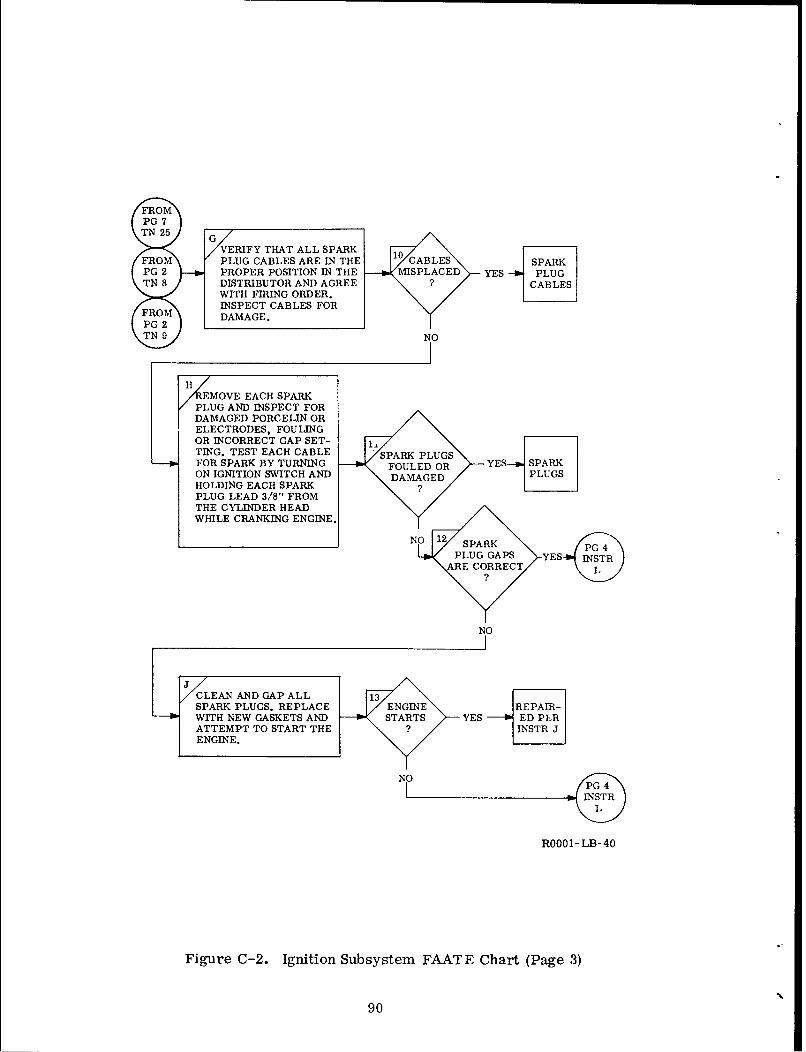
• pVERIFY THAT ALL SPARK
FROM PLUG CABLES ARE IN THE CABLESSPARKPG 2 PROPER POSITION IN THE MISPLACED YES PLUGTN 8 DISTRIBUTOR AND AGREE CABLES
[WITH FIRING ORDER.
INSPECT CABLES FORFR DAMAGE.
NO
HJ
EMOVE EACH SPARKPLUG AND INSPECT FORDAMAGED PORCELIN ORELECTRODES, FOULINGOR INCORRECT GAP SET-TING. TEST EACH CABLE SPARK PLUGSFOR SPARK BY TURNING FOULED OR YESON IGNITION SWITCH AND DAMAGEDHOLDING EACH SPARK ?PLUG LEAD 3/8" FROMTHE CYLINDER HEADWHILE CRANKING ENGINE.
__________________NO 12 SPARK PPLUG GAPS YES
ARE CORRECTL
NO
CENAND GAP ALL 13SPARK PLUGS. REPLACE ENGINE REPAIR-WITH NEW GASKETS AND STARTS YES ED PERATTEMPT TO START THE INSTR JENGINE.
NO PG 4INSTR
L
ROOOI- LB-40
Figure C-2. Ignition Subsystem FAATE Chart (Page 3)
90

SREMOVE INSPECTION PLUG 14 DWELL-FROM IN DISTRIBUTOR. CONNECT METER READS
DWELLMETER TO BREAKER WITHIN SPECIFI- YESPOINT SIDE OF IGNITION CATIONSCOIL AND TO GROUND.
NO
BREAKER
L/ POINTFROMGAP
PG 6TN 21 TURN OFF IGNITION SWITCH.
REMOVE DISTRIBUTOR CAP
FROM AND SPARK PLUG LEADS.PG 3 INSPECT BREAKER POINTS
TN 12 FOR BURNED OR PITTEDCONTACTS AND REPLACE IF
FROM NECESSARY. BUMP EN- 15 T VOLTGINE OVER WITH STARTER M R S
PG SWITCH UNTIL BREAKER BATTERY VOLTAGE STN 13 POINTS ARE AT MAXIMUM APPROX.
OPEN POSITION AND ADJUST 24VFROM GAP TO SPECIFICATIONS.
PG 1 CONNECT POSITIVE LEADTN 4. OF VOLTMETER TO THE
BREAKER POINT SIDE OFIGNITION COIL AND THE NO
FROM NEGATIVE LEAD TO GROUND.PG 5STR R TURN ON IGNITION SWITCH.
M
TURN OFF IGNITION SWITCH. 1DISCONNECT BREAKER POINT 16 VREAKER>CAPACITOR FROM BREAKER METER READS
POINT TERMINAL. TURN OL YES CAPAC-IGNITION SWITCH ON. VOLT- APPROX.METER REMAINS AS IN IN- 24VVIOSTRUCTION L.
NOP7
INSTRAA
R0001-LB-41
Figure C-2. Ignition Subsystem FAATE Chart (Page 4)
91
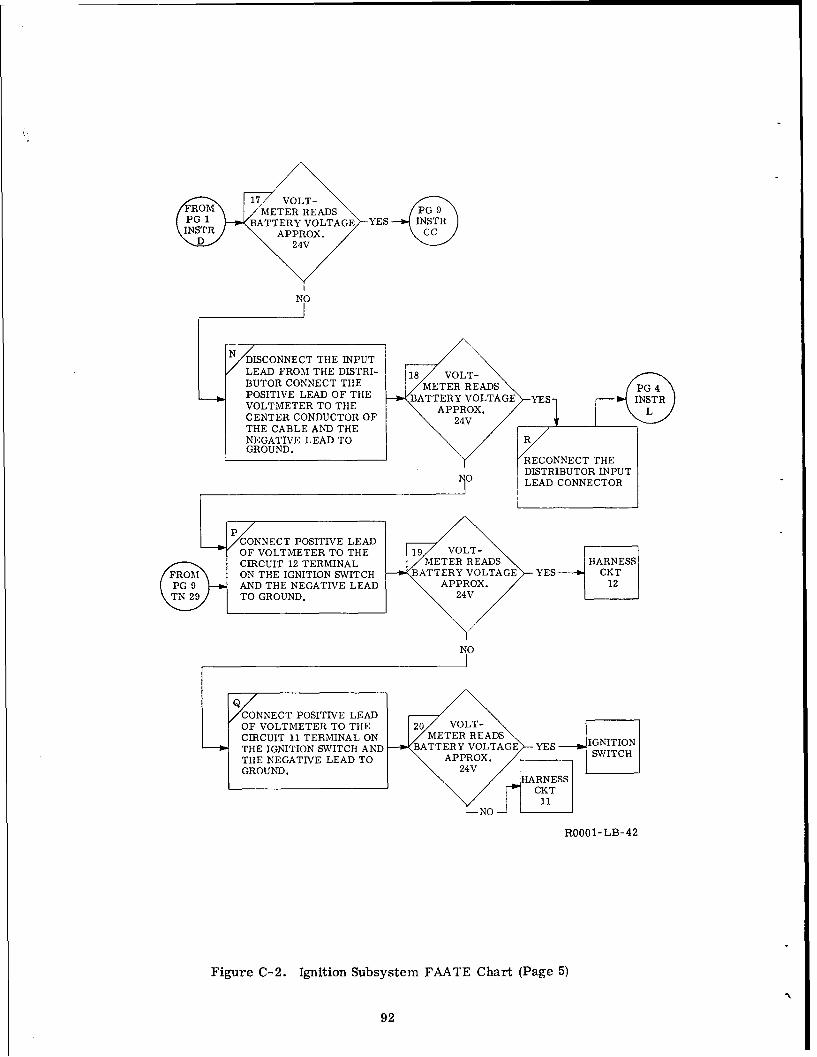
17 R VOLTA- ERM /METER READS PPG 1 BATTERY VOLTAGE YES ISR
APPROX. C
NO
Nf
/ECONNECT THE INPUTLEAD FROM THE DISTRI- 1 OTB U T O R C O N N E C T T H E M E T E R R E D P G 4
POSITIVE LEAD OF THE BATTERY YESVOLTMETER TO THE 1 APPROX.CENTER CONDUCTOR OF M RN
FROM ONTHE CGNLTIOND SWTCHEBTEYVLTG E
NEGATIVE LEAD TO 1GROUND.
RECONNECT THEDISTRIBUTOR INPUT
1•O LEAD CONNECTOR
( NECT POSITIVE LEAD I•
-[OF VOLTMETER TO THE 19 VOT
SI RCUIT 12 TERMINALMERRADHRNS
NO
THE IGNITION SWITCH BATTERY VOLTAGE YES INTAND THE NEGATIVE LEAD TO APPROX. S CN 110
ROF V1- LB- 42
Figure C-2. Ignition Subsystem FAATE Chart (Page 5)
92

MP ENGINE OVER WITH 2 OP
THE VOLTMETER IS ON METER READS YESLOWEST READING. THE LESS THANVOLTMETER REMAINS 0. 2VCONNECTED AS ININSTRUCTION C.
NO
TI
XTURN OFF IGNITION SWITCH.REMOVE DISTRIBUTOR CAPAND SPARK PLUG LEADS.INSPECT BREAKER POINTSFOR PITTED OR CURNEDCONTACTS AND REPLACEIF NECESSARY. INSPECT 22 VOTREARFOR LOOSE CONNECTIONS VOLT- REPAIR-
OR FRAYED WIRED. VERIFY MLESS THAN S INSTR T P
THAT BREAKER POINTS LS 2V
ARE CLOSED. CONNECT0.2(FROM POSITIVE LEAD OF VOLT-PG 8 METER TO THE BREAKERTN 27 POINT SIDE OF IGNITION
COIL AND THE NEGATIVELEAD TO GND. TURN NOIGNITION SWITCH ON.
CONECT POSITIVE LEAD
OF THE VOLTMETER TO 23 VOLT-IGNITIONTHE MOVEABLE CONTACT METER READS-- COIL TOOF THE VBREAKER POINTS TSLESS THAN /PONTAND THE NEGATIVE LEAD 0.VJUMPERTO GND.0.2
NO PG 7INSTR
V
ROOO1-LB-43
Figure C-2. Ignition Subsystem FAATE Chart (Page 6)
93
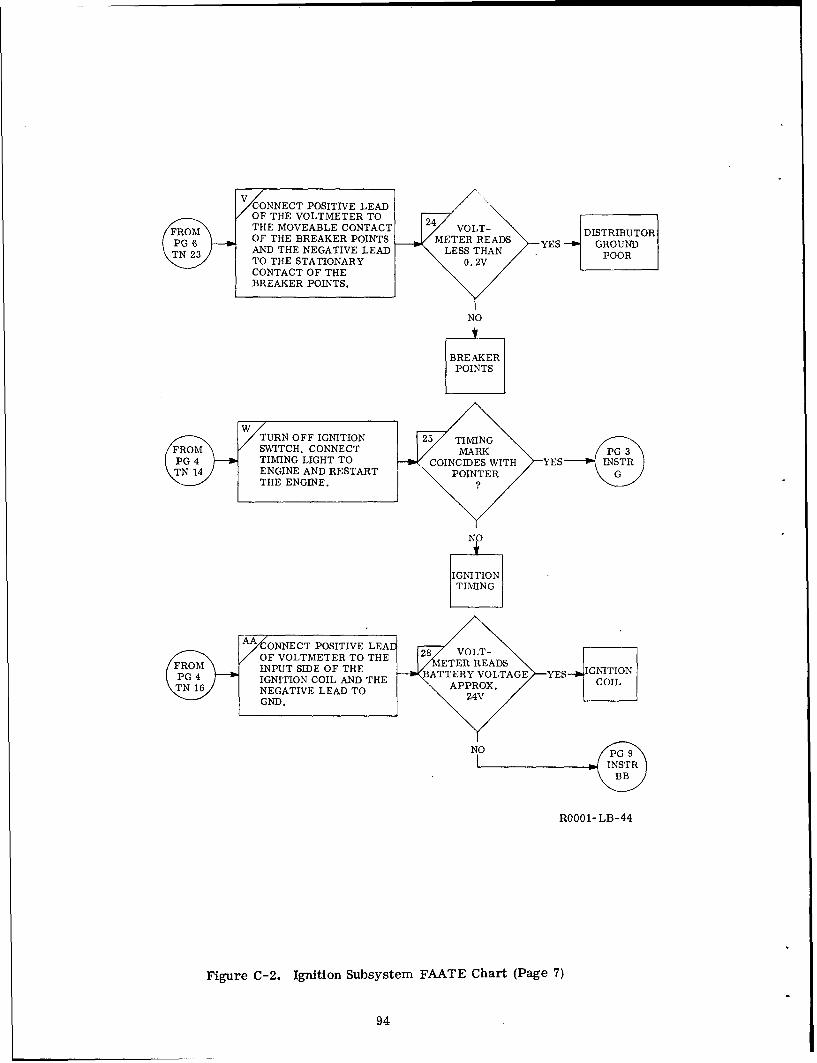
X NNECT POSITIVE LEAD/ OcF THE VOLTMETER TOSTHE MOVEABLE CONTACT 24 VOLT- ITIUO
OF THE BREAKER POINTS METER READS YE DISTRIBUTOROUNDAND THE NEGATIVE LEAD •LESS T>HAN .POTO THE STATIONARY- 0. 2VOCONTACT OF THE \ 0•BREAKER POINTS.
NO
BREAKERPOINTS
TURN OFF IGNITION 25 TIMING/FROM ;• sWITCH. CONNECT MARK
TIMING LIGHT TO COINCIDES WITH YES•.N14/ [ H EGNEtENGINE AND RESTART • POINTER
NO
IGNITION
TIMING
O F VOLTMETER TO THE 28 VOLT-INPUT SIDE OF THE ETER READS
IGNITION COIL AND THE APPROX. COIx~l••lu,/ [1NEGATIVE GN. LEAD TO . APPROX
NO PG 9INSTR
BB
R0001- LB-44
Figure C-2. Ignition Subsystem FAATE Chart (Page 7)
94
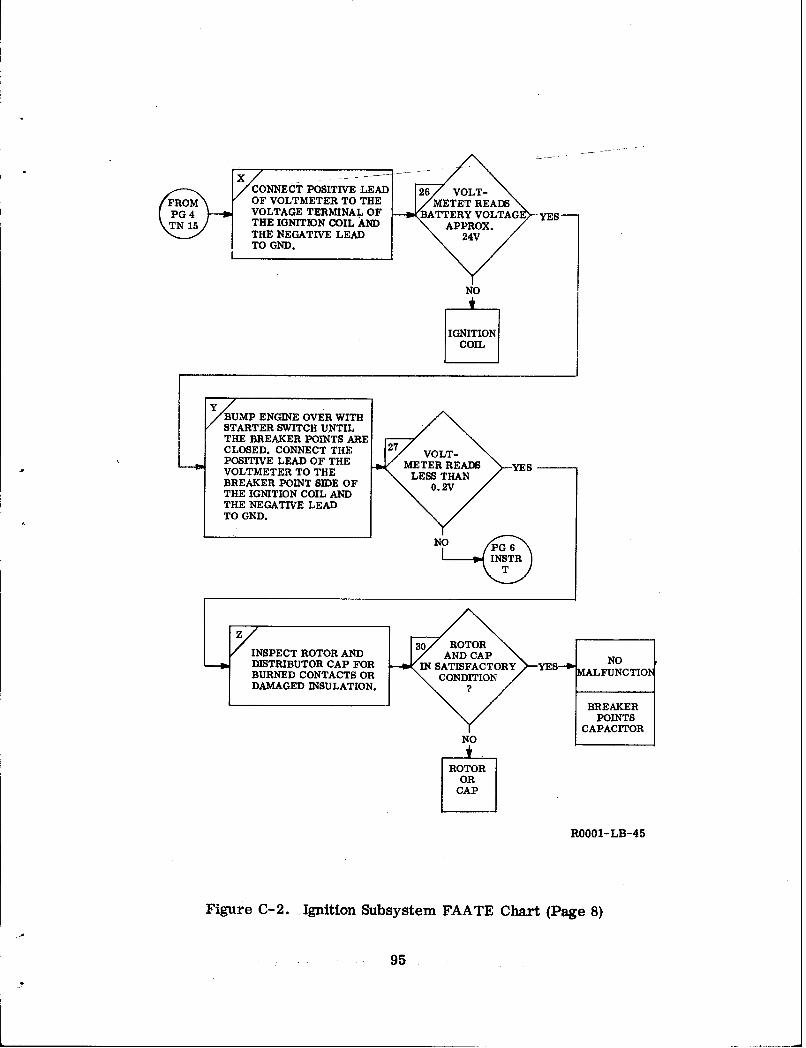
CNNECT POSITIVE LEAD 2 OT/RM /OF VOLTMETER TO THE ETRAD
PG 4 VOLTAGE TERMINAL OF BATTERY VOLTAG EsTHE IGNITION COIL ANDAPRXTHE NEGATIVE LEAD24TO GND.
NO
IGNITIONCOIL
BUMP ENGINE OVER WITHSTARTER SWITCH UNTILTHE BREAKER POINTS ARECLOSED. CONNECT THE 27 VPOSITIVE LEAD OF THE METER READS YS
VOLTMETER TO THE LESS THANBREAKER POINT SIDE OF 0. 2VTHE IGNITION COIL ANDTHE NEGATIVE LEADTO GND.
NO__ PG6
INSTRT
30 ROTORINSPECT ROTOR AND ANDCAP NODISTRIBUTOR CAP FOR IN SATISFACTORY ES--* NCBURNED CONTACTS OR CONDITION MALFUNCTIONDAMAGED INSULATION. ?
BREAKERPOINTS
CAPACITORNO
ROTOROR
CAP
ROOO1-LB-45
Figure C-2. Ignition Subsystem FAATE Chart (Page 8)
95

IERT ADAPTER AT IN- 29 VOLT-PUT LEAD TO THE DIS- METER READSEED THRUTRIBUTOR. CONNECT THE BATTERY VOLTAGE YES APACITORPOSITIVE LEAD OF THE APPROX.
VOLTMETER TO THE 24VADAPTER TERMINAL ANDCONNECT THE NEGATIVE
LEAD TO GND.
NOPG 5
INSTRP
CTURN OFF IGNITION 3 ROTORSWITCH. REMOVE THE AND CAPDISTRIBUTOR CAP AND IN SATISFACTORY YESSPARK PLUG LEADS. CONDTIO
INSPECT THE ROTOR CAND DISTRIBUTOR CAPFOR BURNED CONTACTSOR DAMAGED ISLTO
AND REPLACE IFNECESSARY. NO
ROTOR
ORCAP
CNNECT POSITIVE LEADOF VOLTMETER TO THEINPUT SIDE OF THEIGNITION COIL AND THE VOLT- BREAKERNEGATIVE LEAD TO THE - METER READS yES POINTBREAKER POINT SIDE OF GREATER THAN CAPACITORTHE IGNITION COIL. BUPI2V
THE ENGINE OVER WITHTHE STARTER SWITCHUNTIL THE BREAKERPOINTS ARE CLOSED.TURN ON THE IGNITION NOSWITCH.
IGNITION
COIL
R0001- LB-46
Figure C-2. Ignition Subsystem FAATE Chart (Page 9)
96

TA / VOLTAGE INDICA-TR STAYS INYEILLOW
AREA INDICATING LOPBATTERY VOLTAGE. 1 isEXAMINE BATTERIES VOLTAGE
FOR DEFECTS. CHECK GREATER THAN YES
ELECTROLYTE LEVEL. 24 VOLTSDISCHARGE BATTERY ?
AT 50 AMPS FOR 15
SECS. WAIT 5 SECS.MEASURE OPEN CIR-CUIT VOLTAGE (VI) NO
PG2WAIT 15 SECS. MEA- PIT
SURE OPEN CIRCUIT FALLIN YES
VOLTAGE (V2). PLOT D
V1 AND V2 ON GRAPHPG 8.
"NO
I BATTERY
FPMEASURE VOLTAGE 3OLTAGEAT INDICATOR UNIT EQUAL TO YES TN9
CABLE VOLTAGE/
PP G
NO
R0001-LB-30
Figure C-3. Generator-Regulator Subsystems FAATE Chart, (Page 1)
97

YFLL CHARGE BAT-STERY. RUN ENGINE 4 UTis
AT 1200 RPM. MEA- OTU
SURE REGULATOR YES VNSYOUTPT WILE ON-FROM 0 TO
TROLLING GENERATOR, 2P 4
FIELD CURRENT.
NO
EASURE GENERATOROUTPUT AT 1200 RPM. 5 i
LOAD GENERATOR AND OUTPUT- CONTROL FIELD CUR- 28.5 VOLTS YES
RENT EXTERNALLY A20AMPSj
NO
GEEAO YES to GENERATOR
BELTSBELTS
R0001-LB-31
Figure C-3. Generator-Regualtor Subsystems FAATE Chart, (Page 2)
98

•/MMEASURE BATTERY
FRM TION VOLTAGE WITH BATTERY
PG 2 FIELD CURRENT AD- VOLTAGE YES
VOLTA GE. HOLDGVN-THAN G7.5E
TN4 JUSTED TO GIVE 27. 5 2.5 VOLTS/
FRU VOLTSAREGULATOR O
OEMOVETSTARTERSWITCH AND MEA-SURE BATTERY TER-VOTG
SMINAL CONNECTION GETR YES
VOLTAGE. HOLD GEN- TA 77
ERATOR OUTPUT AT OT
28.5 VOLTS?
NO IREGULATOR
STO STARTERI
CABLE
FROM INDICATOR INDICATORUNIT
NO
GROUNDCONN-ECTION
R0001- LB- 32
Figure C-3. Generator-Regulator Subsystems FAATE Chart, (Page 3)
99
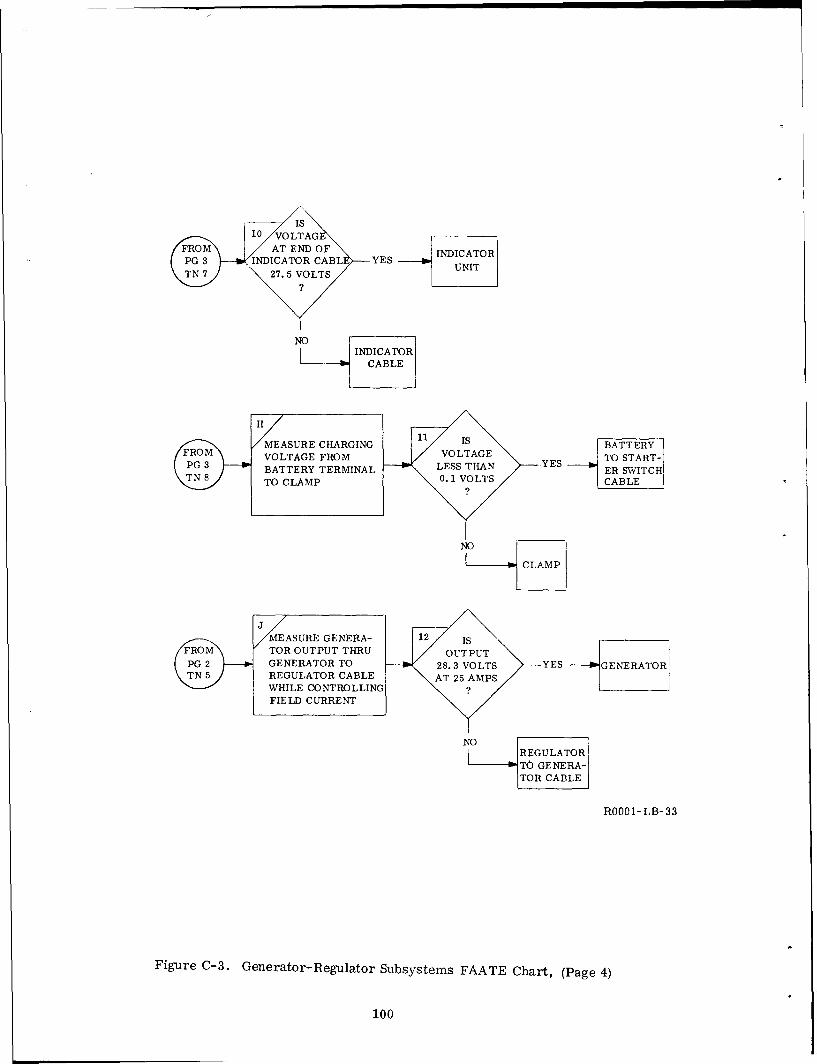
is10 VOLTAG
FRMAT END OFINCAOTPG 3 I�NDICATOR CABL YES UNDICATOR
TN7 27.5 VOLTS
NOINDICATOR
CABLE
SURE CHARGING 11 isBATTERYVOLTAGE FROM VOLTAGE TO START-
BATTERY TERMINAL LESS THAN YES TO STATTO CLAMP 0. 1 VOLTS /CABLE
CLAMP
MEASURE GENERA- 12 isFOTOR OUTPUT THRU OUTPUT
GENERATOR TO 28.3 VOLTS YES GENERATORIREGULATOR CABLE AT 25 AMPS
WHILE CONTROLLING ?FIELD CURRENT
REGULATOR
TO GENERA-TOR CABLE
R0001-LB-33
Figure C-3. Generator-Regulator Subsystems FAATE Chart, (Page 4)
100
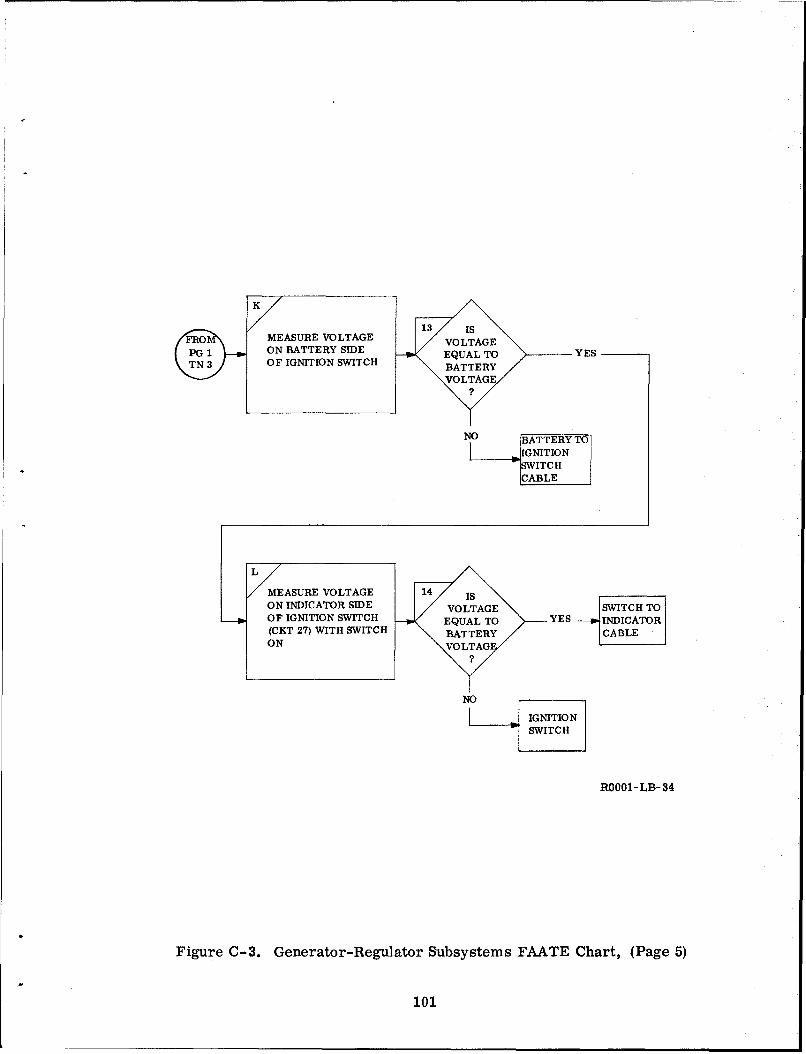
SMEASURE VOLTAGE VOLTAGE
ON BATTERY SIDE EQUAL TO YESOF IGNITION SWITCHBATR
YOLTAE
NO BATTERYTO
IGNITIONSWITCHCABLE
XKASURE VOLTAGE 14 iON INDICATOR SIDE VOTAESWITCH SIC TO
OF IGNITION SWITCH E #X YES INDICATOR(CKTN 27) WITH SWITCH BATTERY CABLE
IGNITIONSWITCH
ROOO1- LB- 34
Figure C-3. Generator-Regulator Subsystems FAATE Chart, (Page 5)
101

CýTTERY OVER-
CHRGE INDICATION 15 i
LOW ELECTROLYTE VREGU-LEVEL AND/ORl VOLT- GRAE THAN LATOR
AGE INDICATOR STAYS 2 OT
IN THE RIGHT RED?
AREA. MEASURE BAT-
TERY VOLTAGE
NO
'mN ENGINE AT 16 is
S1200 RPM AND MEA- OUTPUT
SURE REGULATOR LESS THAN YESTROLLING8GENERA-
OUTPUT WHILE CON- 28 VOLTS
TOR FIELD CURRENT
NO
REGU-LATOR
R0001- LB-35
Figure C- 3. Generator-Regulator Subsystems FAATE Chart, (Page 6)
102

LOW BATTERY VOLT-
AGE INDICATION OF 17 is
VOLTAGE INDICATOR VOLTAGE
START STAYS IN LEFT RED GREATER THAN YES
AREA WITH IGNITION 22.0 VOLTS c
ON. MEASURE BAT- ?
TERY VOLTAGE
NO
'EXAMINE BATTER-]
//ES FOR DEFECTS
/AND ILOW ELECTRO-LYTE LEVEL. DIS- _.___
CHARGE BATTERY AT50 AMPS FOR 15 SECS. POINTSWAIT 5 SECS AND LIE IN -YES CHARGE
SURE OPERN CIRCUIT OBATTERYVOLTAGE (VL).GAREACHARGE BATTERY AT ?14.-0 VOLTS LIMITED
TO 20. 0 AMPS FOR 45
SECS. WAIT 15 SECSAND MEASURE OPEN NO [
CIRCUIT VOLTAGE BAT ER(V2). PLOT Vl AND BATR
V2 ON GRAPH PG 8
ROOOI- LB- 36
Figure C-3. Gene rator-Re gulator Subsystems FAA.TE Chart, (Page 7)
103
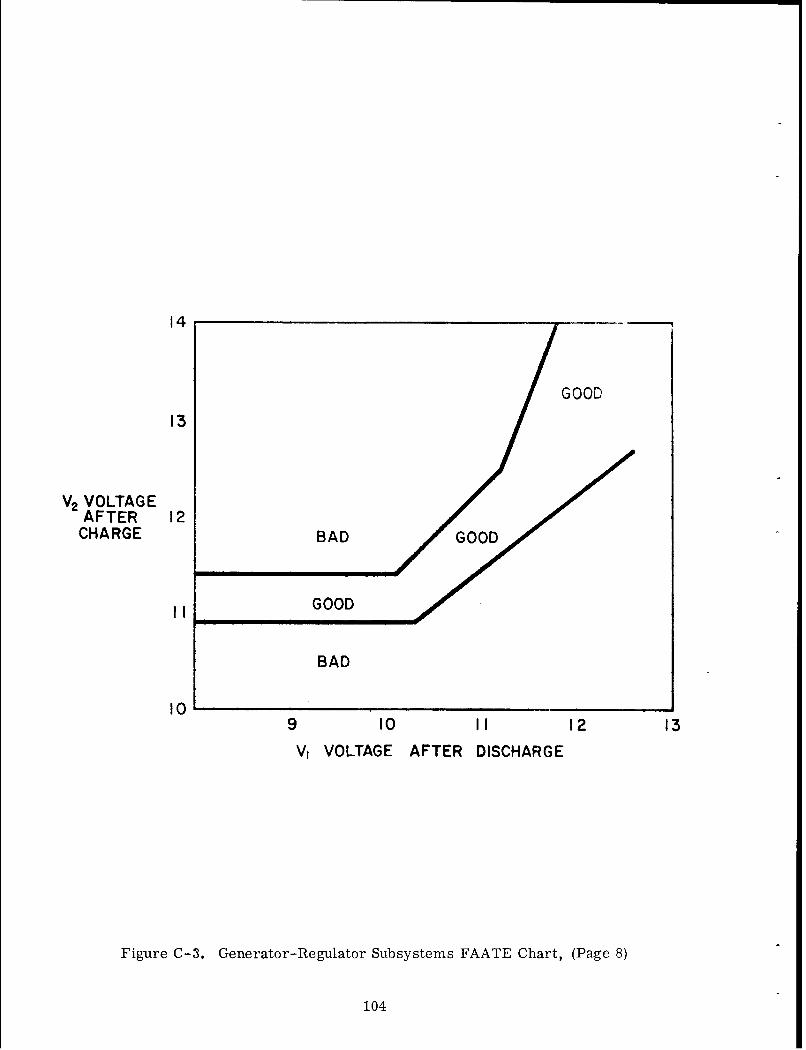
14
GOOD
13
V2 VOLTAGEAFTER 12
CHARGE BADGOOD
II GOOD
BAD
l09 10 II 12 13
V, VOLTAGE AFTER DISCHARGE
Figure C-3. Generator-Regulator Subsystems FAATE Chart, (Page 8)
104

APPENDIX DCOMPUTER- PROGRAMMED FAATE CHARTS
This appendix contains a computer program for diagnostics in the battery and
starter subsystems. The program was generated directly from FAATE for these
subsystems and is intended to show the direct application of FAATE to automatic
test equipment. Examples of typical fault isolation to specific faults, follow the
program.
In the examples, directions to the test operator are printed out and then a ques-
tion mark printed to indicate that a test result must be entered. The test result is
operated on by the program to determine the next operator direction. When the fault
has been isolated by the program, the computer prints the fault identity. With this
computer program, the operator performs only directed test actions and is not re-
lied on to make decisions.
When FAATE is applied to a programmable automatic test system, the operator
actions would be replaced by commands to measurement and stimuli devices to setup
and initiate certain tests. The test results would then be directly entered into the
computer via the measurement devices. The output of the computer would be either
a command for action or the identity of the faulty component.
105

STARTER AND BATTERY SUBSYSTEMS FAATE
FAULT ISOLATION PROGRAM EXTENDED BASIC LANGUAGE
1O0 LET 0S = "MEASURE CRANK("110 LET R$ = "ING VOLTAGE ""120 LET S$ = "FAULT ISOLATED-"130 LET TS = " NEG BATT "140 LET US = POS BATT "150 LET'VS "POS TERMINAL "160 LET WS 2 "NEG TERMINAL "170 LET XS = CLEAN OR"180 LET YS 2 " REPLACE "
190 PRINT "SYMPTOM -
200 PRINT210 PRINT "ENGINE FAILS TO CRANK OR"
220 PRINT "FAILS TO CRANK AT NORMAL CRANKING SPEED"
230 PRINT240 PRINT250 PRINT 05 RS260 PRINT " STARTER TERMINAL TO STARTER CASE"270 INPUT A280 IF A < 18.5 THEN 590290 PRINT300 PRINT OS; "ING CURRENT"310 PRINT " TO STARTER"320 INPUT 8330 IF B < 217 THEN 380340 PRINT350 PRINT SS360 PRINT YSI "STARTER"370 GO TO 2310380 PRINT390 PRINT "CHECK ENGINE OIL VISCOSITY"400 INPUT C410 IF C > 30 THEN 550420 PRINT430 PRINT "MEASURE TORQUE -"
440 PRINT " REQUIRED TO TURN ENGINE"450 INPUT D460 IF D • 50 THEN 510470 PRINT480 PRINT SS490 PRINT " MECHANICAL ENGINE FAILURE"500 GO TO 2310510 PRINT520 PRINT SS530 PRINT Y$; "STARTER"540 GO TO 2310550 PRINT560 PRINT SS570 PRINT " CHANGE TO CORRECT VISCOSITY ENGINE OIL"580 GO TO 2310.590 PRINT600 PRINT GSi R$
106
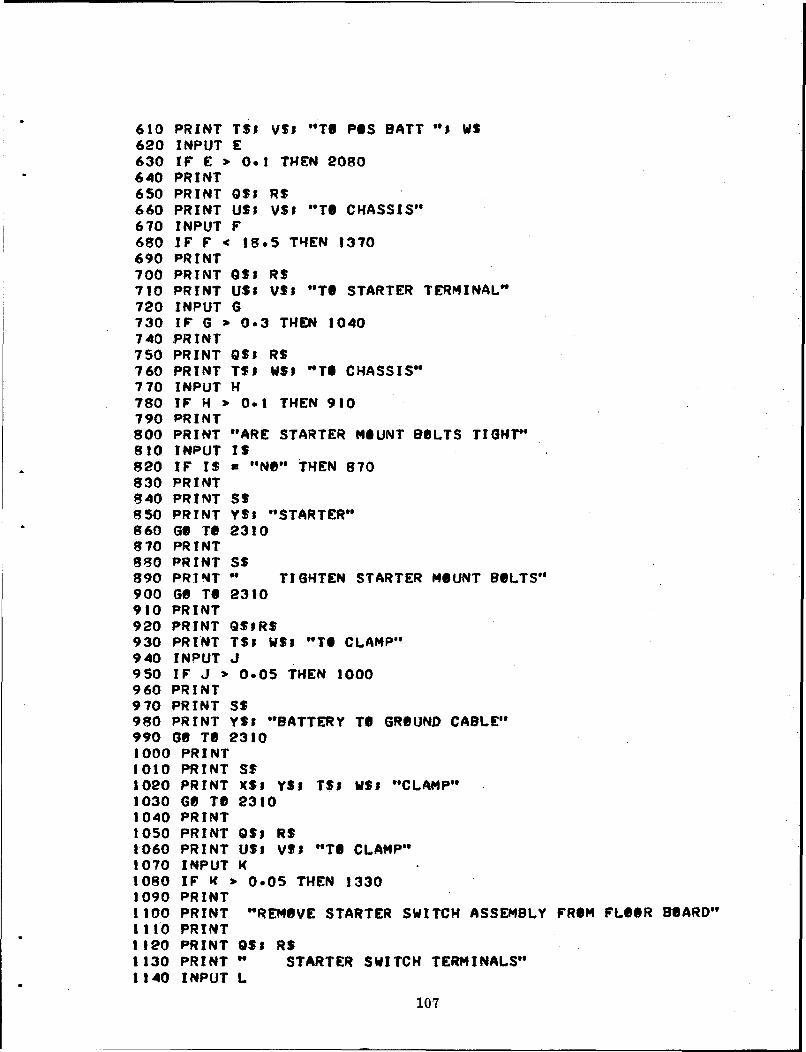
610 PRINT TSs V$! "TO P0S BATT "I WS620 INPUT E630 IF E > 0.1 THEN 2080640 PRINT650 PRINT 051 RS660 PRINT US$ VS "TO CHASSIS"670 INPUT F680 IF F ' 15.5 THEN 1370690 PRINT700 PRINT 0S; RS710 PRINT USt VSj "TO STARTER TERMINAL"720 INPUT G730 IF G > 0.3 THEN 1040740 PRINT750 PRINT OS RS760 PRINT TS WSI "TO CHASSIS"770 INPUT H780 IF H 3 0.1 THEN 910790 PRINT800 PRINT "ARE STARTER MOUNT BOLTS TIGHT"810 INPUT IS820 IF IS a "NO" THEN 870830 PRINT840 PRINT SS850 PRINT Y5# "STARTER"860 GO TO 2310870 PRINT880 PRINT SS890 PRINT " TIGHTEN STARTER MOUNT BOLTS"900 GO TO 2310910 PRINT920 PRINT QSIRS930 PRINT TS; WS "TO CLAMP"940 INPUT J950 IF J =0.,05 THEN 1000960 PRINT970 PRINT SS980 PRINT YSs "BATTERY TO GROUND CABLE"990 GO TO 23101000 PRINT3010 PRINT SS1020 PRINT X$S YM; TS WS; "CLAMP"1030 GO TO 23101040 PRINT1050 PRINT QS RS1060 PRINT US; VS; "TO CLAMP"1070 INPUT K1080 IF K v OO5 THEN 13301090 PRINT1100 PRINT "REMOVE STARTER SWITCH ASSEMBLY FROM FLOOR BOARD"1110 PRINT1120 PRINT $S; RS1130 PRINT " STARTER SWITCH TERMINALS"1140 INPUT L
107

1150 IF L 2 0.1 THEN 12901160 PRINT1170 PRINT Q$S R$1180 PRINT " STARTER SWITCH TO GROUND"1190 INPUT M1200 IF M < 18.5 THEN 12501210 PRINT1220 PRINT St1230 PRINT YS; "STARTER SWITCH TO STARTER CABLE"1240 G6 TO 23101250 PRINT1260 PRINT SS1270 PRINT Y41 "BATTERY TO STARTER SWITCH CABLE"1280 GO TO 23101290 PRINT1300 PRINT S$1310 PRINT X$S YSt "STARTER SWITCH"1320 GO TO 23101330 PRINT1340 PRINT S$1350 PRINT XS; YS; USI VS "CLAMP"1360 GO TO 23101370 PRINT1380 PRINT "INSPECT BATTERY CASE& COVERS, TERMINAL POSTS"1390 PRINT "CHECK FOR LEAKS AND ELECTROLYTIC LEVEL"1400 PRINT1410 PRINT " BATTERY DEFFECTIVE (YES OR NO)"1420 INPUT NS1430 IF NS **NO" THEN 14801440 PRINT1450 PRINT S$1460 PRINT " REPLACE BATTERY"1470 GO TO 23101480 PRINT1490 PRINT "DISCHARGE BATTERY -"£500 PRINT " AT 50 AMPS FOR 15 SECONDS"1510 PRINT1520 PRINT "WAIT 5 SECONDS -"
1530 PRINT " MEASURE OPEN CIRCUIT VOLTAGE"1540 INPUT VI1550 PRINT1560 PRINT "CHARGE BATTERY -"
1570 PRINT " AT 14.0 VOLTS (20 AMPS LIMITED) FOR 45 SECONDS"1580 PRINT1590 PRINT "WAIT 15 SECONDS -"1600 PRINT " MEASURE OPEN CIRCUIT VOLTAGE"1610 INPUT V21620 IF VI ' 8.0 THEN 17801630 IF VI * 10.1 THEN 16701640 IF V2 < 10.9 THEN 1780£650 IF V2 : 11.4 THEN 1780£660 GO TO 18201670 IF VI > 10.3 THEN 1710
108
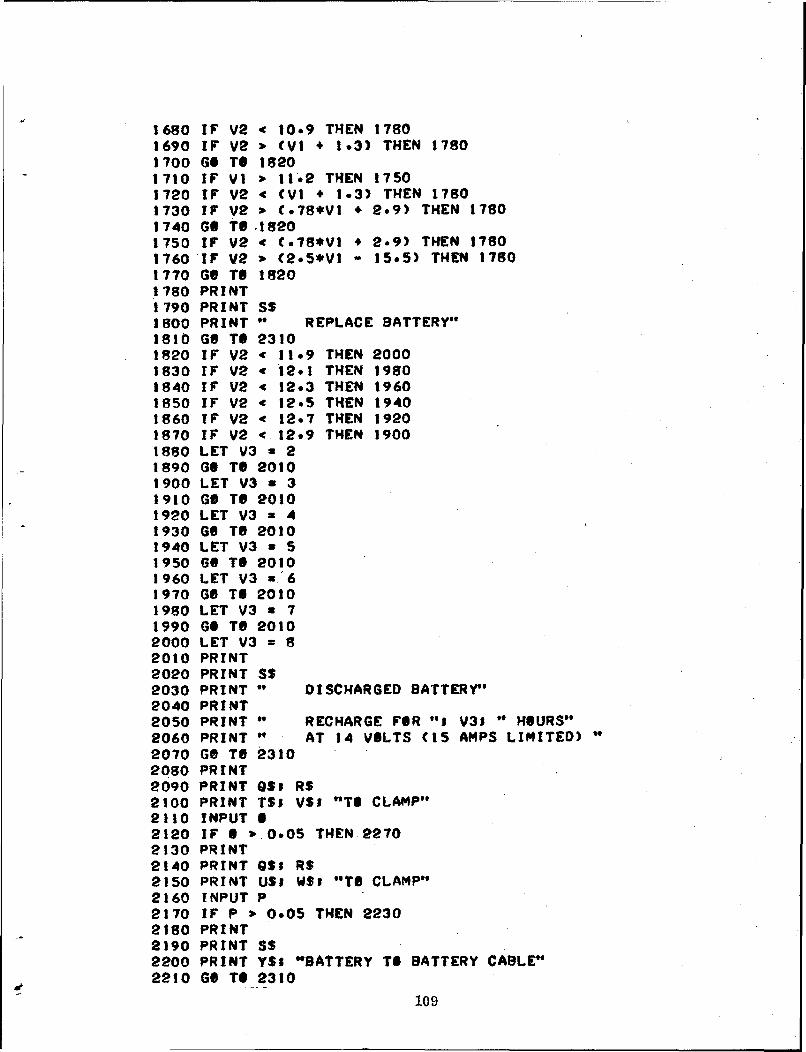
1680 IF V2 < 10.9 THEN 17801690 IF V2 • (VI + 1.3) THEN 17801700 GO TO 18201710 IF VI • 11.2 THEN 17501720 IF V2 < (Vt + 1.3) THEN 17501730 IF V2 P (.78*VI + 2.9) THEN 17801740 GO TO 18201750 IF V2 4 C.789*V1 2.9) THEN 17801760 IF V2 * (2.5*VI - 15.5) THEN 17801770 GO TO 1820
780 PRINT1790 PRINT S$1800 PRINT " REPLACE BATTERY"1810 GO TO 23101820 IF V2 v 11.9 THEN 20001830 IF V2 c 12.1 THEN 19801840 IF V2 v 12.3 THEN 19601850 IF V2 4 12.5 THEN 19401860 IF V2 < 12.7 THEN 19201870 IF V2 • 12.9 THEN 19001880 LET V3 a 21890 GO TO 20101900 LET V3 a 33910 GO TO 20101920 LET V3 x 41930 Gb TO 20101940 LET V3 a 51950 Gb TO 20103960 LET V3 u.63970 Gb TO 20101980 LET V3 a 71990 GO Tb 20102000 LET V3 = 82010 PRINT2020 PRINT SS2030 PRINT " DISCHARGED BATTERY"2040 PRINT2050 PRINT " RECHARGE FOR "1 V31 " HOURS"2060 PRINT " AT 14 VOLTS (15 AMPS LIMITED)2070 GO TO 23102080 PRINT2090 PRINT QS RS2100 PRINT TS VS$ "TI CLAMP"2110 INPUT B2120 IF 0 * 0.05 THEN 22702130 PRINT2140 PRINT QS RS2150 PRINT US; W$i "TO CLAMP"2160 INPUT P2170 IF P > 0*05 THEN 22302180 PRINT2190 PRINT SS2200 PRINT YS; "BATTERY TO BATTERY CABLE"2210 Gb TO 2310
109
2230 PRINT2240 PRINT SS2250 PRINT X$S YS; USY WS "CLAMP"2260 6S TO 23102270 PRINT2280 PRINT S$2290 PRINT X$l Y$e TSI VS "CLAMP'23002310 PRINT2320 PRINT " TEST COMPLETE"2330 END
110

SAMPLE ISOLATION OF DEFECTIVE BATTERY(will not hold charge)
S YMPTOM -
ENGINE FAILS TO CRANK ORFAILS TO CRANK AT NORMAL CRANKING SPEED
MEASURE CRANKING VOLTAGESTARTER TERMINAL TO STARTER CASE
? 18.0
MEASURE CRANKING VOLTAGE -MEG BATT PBS TERMINAL TO POS BATT MEG TERMINAL
? 0
MEASURE CRANKING VOLTAGE -PGS BATT.POS TERMINAL TO CHASSIS
? 1860
INSPECT BATTERY CASE, COVERS, TERMINAL POSTSCHECK FOR LEAKS AND ELECTROLYTIC LEVEL
BATTERY DEFFECTIVE (YES OR NO)? No
DISCHARGE BATTERY -
AT 50 AMPS FOR 15 SECONDS
WAIT 5 SECONDS -MEASURE OPEN CIRCUIT VOLTAGE
? 11.2
CHARGE BATTERY -
AT 14.0 VOLTS (20 AMPS LIMITED) FOR 45 SECONDS
WAIT 15 SECONDS -
MEASURE OPEN CIRCUIT VOLTAGE? 11.5
FAULT ISOLATED-REPLACE BATTERY
TEST COMPLETE
111

SAMPLE ISOLATION OF DISCHARGED BATTERY
SYMPTOM -
ENGINE FAILS TO CRANK ORFAILS TO CRANK AT NORMAL CRANKING SPEED
MEASURE CRANKING VOLTAGE -
STARTER TERMINAL TO STARTER CASE? IR.O
MEASURE CRANKING VOLTAGE -NEG BATT PUS TERMINAL TO PBS BATT NEG TERMINAL
? 0
MEASURE CRANKING VOLTAGE -POS BATT POS TERMINAL TI CHASSIS
? 10.0
INSPECT BATTERY CASE, COVERS* TERMINAL POSTSCHECK FOR LEAKS AND ELECTROLYTIC LEVEL
BATTERY DEFFECTIVE (YES OR NO)? No
DISCHARGE BATTERY -AT 50 AMPS FOR 15 SECONDS
WAIT 5 SECONDS -MEASURE OPEN CIRCUIT'VOLTAGE
? 8.5
CHARGE BATTERY -AT 14.0 VOLTS (20 AMPS LIMITED) FOR 45 SECONDS
WAIT 15 SECONDS -MEASURE OPEN CIRCUIT VOLTAGE
? 11.2
FAULT ISOLATED-DISCHARGED BATTERY
RECHARGE FOR 8 HOURSAT 14 VOLTS (15 AMPS LIMITED)
TEST COMPLETE
112

SAMPLE ISOLATION OF BATTERY TERMINAL CLAMP
SYMPTOM -
ENGINE FAILS TO CRANK ORFAILS TO CRANK AT NORMAL CRANKING SPEED
MEASURE CRANKING VOLTAGE "STARTER TERMINAL TO STARTER CASE? 18.0
MEASURE CRANKING VOLTAGE -NEG BATT POS TERMINAL TO POS BATT NEG TERMINAL
? .6
MEASURE CRANKING VOLTAGE -NEG BATT POS TERMINAL TO CLAMP,
? 0
MEASURE CRANKING VOLTAGE -PBS BATT NEG TERMINAL TO CLAMP
? .5
FAULT ISOLATED-CLEAN OR REPLACE POS BATT NEG TERMINAL CLAMP
TEST COMPLETE
113

SAMPLE ISOLATION OF STARTER SWITCH(High Resistance Contacts)
SYMPTOM -
ENGINE FAILS TO CRANK ORFAILS TO CRANK AT NORMAL CRANKING SPEED
MEASURE CRANKING VOLTAGE -STARTER TERMINAL TO STARTER CASE
? 18.0
MEASURE CRANKING VOLTAGE -NEG BATT Pes TERMINAL TO POS BATT NEG TERMINAL
? 0
MEASURE CRANKING VOLTAGE -POS BATT POS TERMINAL TO CHASSIS
? 22.0
MEASURE CRANKING VOLTAGE -PeS BATT PeS TERMINAL TO STARTER TERMINAL
? 1.!
MEASURE CRANKING VOLTAGE -POS BATT PeS TERMINAL TO CLAMP
? 0
REMOVE STARTER SWITCH ASSEMBLY FROM FLOOR BOARD
MEASURE CRANKING VOLTAGE -
STARTER SWITCH TERMINALS? 1°0
FAULT I SOLATED-CLEAN OR REPLACE STARTER SWITCH
TEST COMPLETE
114

SAMPLE ISOLATION OF STARTER
SYMPTOM -
ENGINE FAILS TI CRANK ORFAILS TO CRANK AT NORMAL CRANKING SPEED
MEASURE CRANKING VOLTAGE -STARTER TERMINAL TO STARTER CASE
? 22.0
MEASURE CRANKING CURRENTTO STARTER
? 65
CHECK ENGINE OIL VISCOSITY? 20
MEASURE TORQUE -REQUIRED TO TURN ENGINE
? 35
FAULT ISOLATED-.REPLACE STARTER
TEST COMPLETE
115

APPENDIX ESAMPLES OF FAULT ISOLATION
In this appendix, two samples of fault isolation are performed:
1. Indication - vehicle operator complains of battery(s) continually needing to
be recharged.
Fault - low generator output due to shorted windings.
2. Indication - vehicle operator complains of engine missing under load.
Fault - low resistance (0. 25M shunt) spark plug (No. 2) due to fouling.
E-I. DISCHARGED: BATTERIES
Assuming other vehicle subsystems operate properly (no ignition or fuel
problems), first the Battery Subsystem test would be performed. This test is done tomake sure the fault is not a defective battery. Fault isolation in this subsystem will
indicate one or two discharged batteries.
To determine the cause of the discharged batteries, the Starter Subsystem
(excessive current draw in starting) and the Generator-Regulator Subsystem(sufficient output to charge batteries) tests are performed.
In the Starter Subsystem test, a "GO" condition will result. Cranking voltage
drop across the starter to battery circuit, engine cranking rpm, and starter cranking
current will all be nominal.
The test flow in the Generator-Regulator Subsystem (figure E-1) will first
indicate low full load voltage output from the regulator. Next, when the generator is
checked for adequate open circuit, field shorted to output, output voltage, a low out-
put voltage will be measured. This low output completes fault isolation to a defective
generator.
E-ll. FOULED PLUG
Assuming other vehicle subsystems operate properly (no starting or battery
related problems or fuel problems), the Ignition Subsystem test would be performed.
116
The test flow in this subsystem is indicated in figure E-2. The first operator
action - "Crank Engine, Ignition OFF" - provides an input to check the breaker points
capacitor. "1 Operator action - Crank Engine, Ignition Switch ON" - provides inputs
to check: 1) dwell angle; 2) breaker point voltage drop; 3) distributor inpur current-
points closed; 4) distributor input voltage; 5) breaker points dc voltage; and 6) dis-
tributor input current - points open. All these measurements, including the breaker
point capacitor, will fall within acceptable limits.
The engine will start. The next operator action will be - 'Run Engine, 450 rpm.
A cylinder balance test is performed on each cylinder. All cylinders except No. 2
will be good. This condition will direct the flow to inserting an adapter in series withthe No. 2 spark plug. A high voltage test will indicate an acceptable or low high
voltage output. Either output will enable fault isolation to the correct component.
Under no-load condition, the high voltage output is more likely to be good; this
condition when combined with the cylinder balance test result will indicate a faulty
No. 2 spark plug.
117

00
00
U))
m 0
I- I -- Z
Iz 0 C0C) z wui C)
.4-)
00
w 0g 0
00
00
z 0
Ir x
0 ýE
0 0w<,02In 4.-
0
200ZU)
100

APPENDIX GSELECTED BIBLIOGRAPHY
The sources cited here are representative reference works indicative of the more
than two years of research effort by Westinghouse PSED Engineering preceding and
during the study program. Alphabetical arrangement has no relationship to either
chronology or importance.
126

1. Allen UTIDivision of Allen Electric and Equipment Co.Kalamazoo Operation2101 N. Pitcher St.Kalamazoo, Mich. 49007
2. Amstro Corporation122 Clinton RoadFairfield, New Jersey 07006
3. Associated Equipment Corporation1541 Salzman AvenueSt. Louis, Missouri
4. Audels Domestic Compact Auto Repair ManualEdwin P. AndersonCopyright, 1963, by Howard W. Sams & Co., Indianapolis, Ind.
5. Automatic Diagnostic of Engine AilmentsPhil HirschElectronics Magazine May 2, 1966
6. Automotive Electrical EquipmentWilliam H. CrouseSixth EditionCopyright, 1966, by McGraw-Hill, Inc.
7. Automatic Inspection and Diagnostic System for Army Tactical VehiclesAlbert Chaflin, George R. StatonUS Army, Frankford Arsenal, Phila, Pa.IEEE Transactions on Aerospace and Electronic SystemsVol AES 2 No 3 May 1966
8. Automotive Mechanics Principles and OperationMervin J. McGuffinCopyright, 1962, CanadaMacMillan Company of Canada, Ltd.
9. The Automobile Electrical SystemRandolph R. Barr and Thomas D. FloccoFirst EditionCopyright, 1960, by R.R. Barr & T.D. Flocco
10. Automatic Switch CoHanover RoadFlorham ParkNew Jersey 07932
127

11. Audit - Automated Diagnostic TestingResearch ReportLong Range Planning ServiceStantord Research InstituteMenlo Park, California
12. Application Notes for Current TransducersPearson Electronics, Inc.4007 Transport StreetPalo Alto, California 94303
13. The Acoustic Analyzer as a Diagnostic Tool for Turbine EnginesJil, Frarey and C. J. ZabriskicCurtis - Wright Corporation
14. Battery and Electrical System TesterMain WarehouseFox Products Company4720 North 18th St.Phila Pa. 19141
15. Battery Manufacturing Company, Inc.14654 DequindreDetroit, Michigan
16. BLH Electronics, Inc.Waltham, Mass. 02154
17. Car Repair 1965Science & Mechanics Publishing Company
18. Cox InstrumentDivision of Lynch Corporation15300 Fullerton Ave.Detroit, Michigan 48227
19. Current Probe Model 3892Test Instruments DivisionAnnapolis OperationBox 391Annapolis Md. 21404
20. Current ProbesGenisco Technology CorporationComponents/Genistron Div.18435 Susana RoadCompton, California 90221
21. California Electronic Manufacturing Co.P.O. Box 555Alamo, California 94507
128
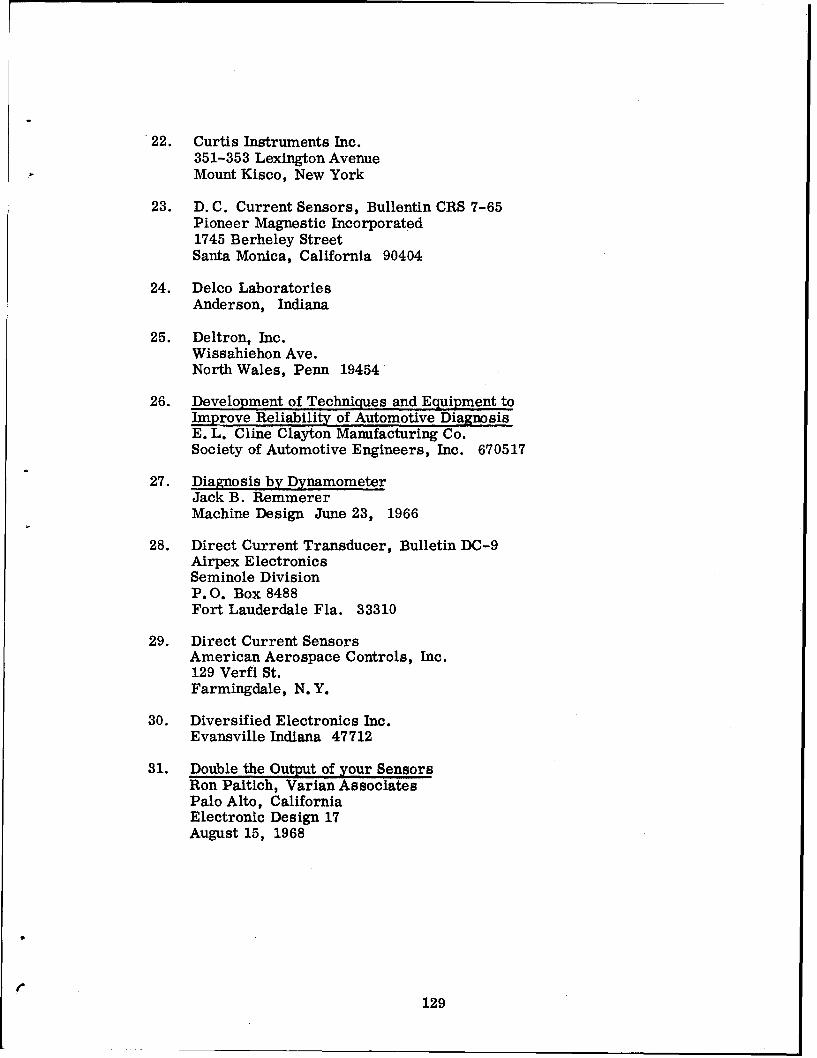
22. Curtis Instruments Inc.351-353 Lexington AvenueMount Kisco, New York
23. D. C. Current Sensors, Bullentin CRS 7-65Pioneer Magnestic Incorporated1745 Berheley StreetSanta Monica, California 90404
24. Delco LaboratoriesAnderson, Indiana
25. Deltron, Inc.Wissahiehon Ave.North Wales, Penn 19454
26. Development of Techniques and Equipment toImprove Reliability of Automotive DiagnosisE. L. Cline Clayton Manufacturing Co.Society of Automotive Engineers, Inc. 670517
27. Diagnosis by DynamometerJack B. RemmererMachine Design June 23, 1966
28. Direct Current Transducer, Bulletin DC-9Airpex ElectronicsSeminole DivisionP.O. Box 8488Fort Lauderdale Fla. 33310
29. Direct Current SensorsAmerican Aerospace Controls, Inc.129 Verfi St.Farmingdale, N. Y.
30. Diversified Electronics Inc.Evansville Indiana 47712
31. Double the Output of your SensorsRon Paitich, Varian AssociatesPalo Alto, CaliforniaElectronic Design 17August 15, 1968
129
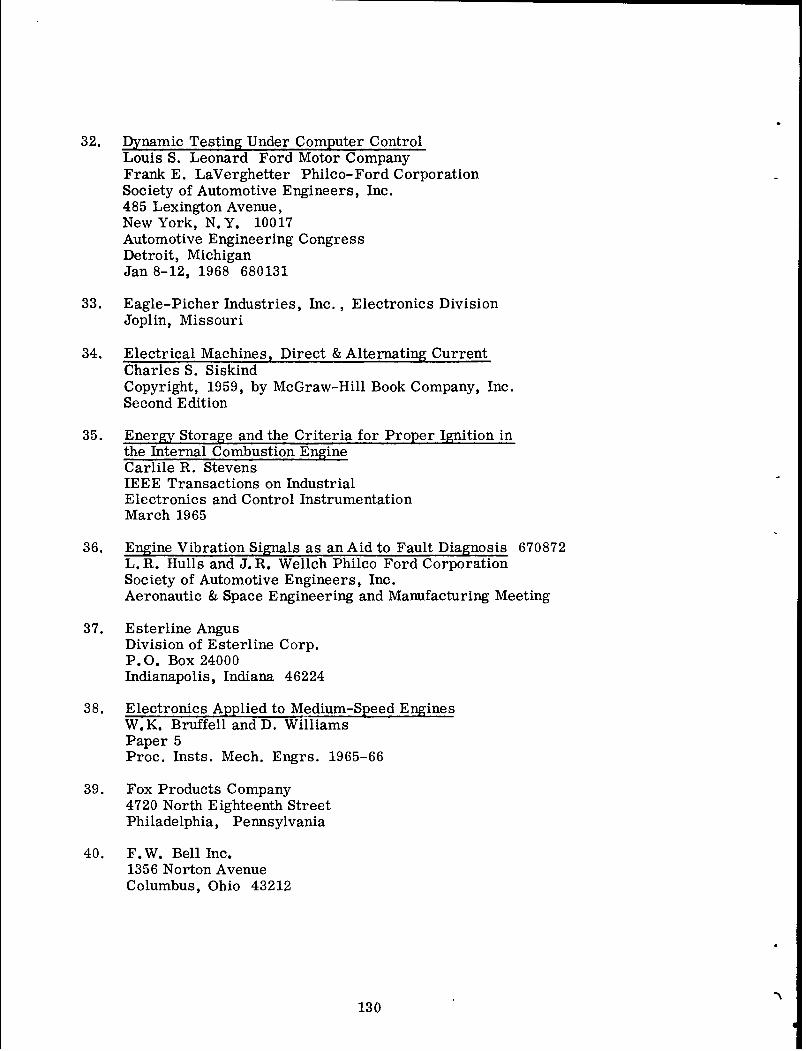
32. Dynamic Testing Under Computer ControlLouis S. Leonard Ford Motor CompanyFrank E. LaVerghetter Philco-Ford CorporationSociety of Automotive Engineers, Inc.485 Lexington Avenue,New York, N.Y. 10017Automotive Engineering CongressDetroit, MichiganJan 8-12, 1968 680131
33. Eagle-Picher Industries, Inc., Electronics DivisionJoplin, Missouri
34. Electrical Machines, Direct & Alternating CurrentCharles S. SiskindCopyright, 1959, by McGraw-Hill Book Company, Inc.Second Edition
35. Energy Storage and the Criteria for Proper Ignition inthe Internal Combustion EngineCarlile R. StevensIEEE Transactions on IndustrialElectronics and Control InstrumentationMarch 1965
36. Engine Vibration Signals as an Aid to Fault Diagnosis 670872L. R. Hulls and J. R. Wellch Philco Ford CorporationSociety of Automotive Engineers, Inc.Aeronautic & Space Engineering and Manufacturing Meeting
37. Esterline AngusDivision of Esterline Corp.P.O. Box 24000Indianapolis, Indiana 46224
38. Electronics Applied to Medium-Speed EnginesW. K. Bruffell and D. WilliamsPaper 5Proc. Insts. Mech. Engrs. 1965-66
39. Fox Products Company4720 North Eighteenth StreetPhiladelphia, Pennsylvania
40. F.W. Bell Inc.1356 Norton AvenueColumbus, Ohio 43212
130
41. Galvanomagnetic DevicesH. Weiss, Siemens AktiengesellschaftIEEE SpectrumJanuary 1968
42. General Motors, General ServiceDetroit, Michigan
43. Glenn's 1967 Auto Repair ManualHarold T. GlennCopyright, 1967, by H. T. Glenn
44. Go-Power Systems1880 Embarcadero RoadPalo Alto, Calfornia, 94303
45. Hewlett-Packard1501 Page Mill RoadPalo Alto, California,
46. Hall Effect Put in ICRobert H. Cushmon, Eastern EditorEDN November 11, 1968
47. Lincoln Saint Louis4010 Goodfellow Blvd.St. Louis, Missouri
48. Lion Research Corporation60 Bridge StreetNewton, Massachusetts 02195
49. Macarr Incorporated4360 Bullard AvenueNew York, N. Y. 10466
50. Motors Auto Repair Manual, 196730th EditionRalph RitchenPublished by Motor, Copyright, 1967 by the Hearst Corportation
51. Marquette Corporation5075 Wayzata BoulevardMinneapolis, Minn, 55416
52. Master Specialties Company1640 MonroviaCosta Mesa, California 92627
53. MOG Electronics Inc.279 Skidmore RoadDecr Park, N.Y. 11729
54. Magsense InstrumentationControl Data Corporation4455 Eastgate MallLa Jolla, California 92037
55. Magnetic Pulse PickupBulletin 95-8072Honeywell, Inc.Apparatus Controls Division2701 Forth Avenue SouthMinneapolis, Minnesota 55408
56. New Ignition System for CarsR. Van Houten and John C. SchweitzerDelta Products, Inc.Grand Junction, Colo.
57. Ohio Semitronics, Inc.1205 Chesapeake Ave.Columbus, Ohio 43212
58. Philco-FordService and Research CenterRotunda DriveDetroit, Michigan
59. Prestolite511 Hamilton StreetToledo, Ohio
60. Proximity SwitchesElectro Products Laborotories, Inc.6125 West Howard StreetChicgo, Illinois 60648
61. Power Instruments Inc.Idea Bulletin No. 2Magnetic Pickup Ideas7352 N. Lawndale Ave.Skikie, Ill. 60076
62. Pastorize Electronics, Inc.385 Elliot St.Newton Upper Falls, Mass 02164
63. Ram Motor, Inc.1903 Barrett RoadTroy, Michigan
64. R.N. Industries4900 CadillacDetroit, Michigan
132
65. Ready Multipurpose Automatic Inspection and Diagnostic SystemA. Chalfin, G. Staton, R. J. BrachmauUS ArmyFrankford Arsenal, Phila Pa.
66. RFL IndustriesInstrumentation DivisionBoonton, New Jersey 07005
67. Simpson Automotive SalesDivision of Simpson Electric Company853 Dundee AvenueElgin, Illinois 60120
68. Sensotec Division1400 Holly AvenueColumbus, Ohio 43212
69. Sun Three Minute Battery TestSun Electric CorporationHarlem and AuondaleChicago, Illinois 60631
70. Sterling International Corporation41-26 27th StreetLong Island City, New York
71. Sun Electric Corporation6323 Avondale RoadChicago, Illinois
72. Tekscope Voll No. 2April 1969Tektron IX, Inc.P.O. Box 500Beaverton, Orengon 97005
73. Transducer TipsElectromechanical Design MagazineFebruary 1969
74. Transducers and Operational AmplifiersH. DoelemanGlassco Instrument Co.Instruments and Control Systems Vol 42
75. Three Hall Effect DevicesM. Nalecz, A. Dunajski,W. Torbicz, H. AiomeckiInstruments and Control Systems Vol 41January 1968
133
76. This is PeizoelectricityE. EllerIEEE Student Journal Vol 4, No. 5September 1966
77. Turbine Engine Condition by Sonic Analyzer MethodJ. L. Frarey Curtiss - Wright Corporation1965 ATA Engineering and Maintenance Conference
78. Tower Ford - Diagnostic LaneMonument StreetBaltimore, Maryland
79. TM-9-2320-209-20Organizational Maintenance Manual for 2-1/2 Ton, 6 x 6 Chassis TruckHeadquarters, Department of the ArmyApril, 1965
80. TM-9-2320-211-20Organizational Maintenance Manual for 5 Ton, 6 x 6 Chassis TruckHeadquarters, Department of the ArmyMarch, 1963
81. TM-9-2320-218-20Organizational Maintenance Manual for Truck, Utility, 1/4 Ton, 4 x 4, M151Headquarters, Department of the ArmyApril, 1963
82. Western Reserve Electronics Inc.12430 Euclid AvenueCleveland, Ohio
83. Whittaker Corporation, Prime Battery DivisionSanta Face, California
84. Whittaker CorporationInstrument Systems Division9601 Canoga Ave.Chatsworth, California 91311
85. 421 Test for All 12 Volt Lead Acid Automotive BatteriesDelco LaboratoiesAnderson, Indiana
134

DISTRIBUTION LIST
Report No. 10717
No. ofAddress Copies
CommanderDefense Documentation CenterCameron StationAlexp--l: ia, Virginia 22314 20
Comr. ig General
US Arn -nk Automotive CommandWarren, o'.higan 48090ATTN: C-xef Scientist/Technical Director of
Laboratories (AMSTA-CL) 1Chief Engineer (AMSTA-CR) 1Research Library (AMSTA-BSL) 3Electrical Division (AMSTA-BE) 9Diagnostic Equipment Branch (AMSTA-RED) 10Maintainability Engineering (AMSTA-MO) 3
135

UnclassifiedSecurity Classification
DOCUMENT CONTROL DAT.4 -f&D(Secur'y claeeification of title, body of abetreat anld tndinde Wnnotatm must be entered when the overall report is classified)
I. OAIGINATIN G ACTIVITY (Coepom-to author) I2. REPORT SECURITY C LASSIFICATIONWestinghouse Electric Corporation UnclassifiedP.O. Box 502 zb. WEI
Detroit, Michigan 482323. REPORT TITLE
Electrical Systems Diagnostic Study For Wheeled Vehicles M1%5, C.M44, M7 M715,'M705, M651, M39
4. DESCRIPTIVE NOTES (Typp of report and inchaisve dates)
Final Engineering Report January 1969 to July 1969S. AUTHOR(S) (La t name, firt name initial)
Jones, Frederick W., Project EngineerRamsburg, Donald C.Sheppard, Charlie A
6. REPORT DATE 7a. TOTAL NO. OP PAQES 7h. NO. OP REPS
1 September 1969 148 ! 2sa. CONTRACT OR GRAN4T No.DAAE07-67-C-1563 Sa. ORIGINATOR'S REPORT NUMBER(S)
Modification P006bPROJECT NO. 10717
C. 9b. OTNE RPORT NO($) (Any other numnbers mhat may be assigned
d.
10. A V A IL ABILITY/LIMITATION NOTICES
Distribution of this document is unlimited.
11. SUPPLEMENTARY NOTES 12. SPONSORING MILITARY ACTIVITY
Department of the ArmyUS Army Tank Automotive Command[Warren, Michigan 48090
13. ABSTRACT
The final report describes the results of a study undertaken by Westinghouse
for USATACOM on the organizational maintenance of US Army wheeled vehicles.
Specifically, the study was addressed to automatic test equipment fault-isolation
procedures for the vehicle electrical system; engine malfunctions were not diagnosed.
Valid diagnostic techniques developed in this study program will eliminate classical
troubleshooting by unskilled personnel and assist operator judgement in pin-pointing faulty
components in the field.
b0
FORM'DD JAN6 1473 UnclassifiedSecurity Classification
UnclassifiedSecurity Classification
14. LINK A LINK B LINK CKEY WORDS
ROLE WT ROLE WT ROLE WT
Electrical System, Wheeled Vehicle
Diagnostic Test Equipment
Fault Isolation Techniques
Organizational Maintenance
INSTRUCTIONS
1. ORIGINATING ACTIVITY: Enter the name and address 10. AVAILABILITY/LIMITATION NOTICES: Enter any lir-of the contractor, subcontractor, grantee, Department of De- itations on further dissemination of the report, other than thosetense activity or other organization(corporte author) issuing imposed by security classification, using standard statementsthe report. such as:2a. REPORT SECUIMTY CLASSIFICATION: Enter the over- (1) "Qualified requesters may obtain copies of thisall security classification of the report. Indicate whether report from DD."Restricted Data" is included. Marking is to be in accord-ance with appropriate security regulations. (2) "Foreign announcement and dissemination of this2b. GROUP: Automatic downgrading is specified in DOD Di- report by DDC Is not authorized."rective 5200. 10 and Armed Forces Industrial Manual Enter (3) "U. S. Government agencies may obtain copies ofthe group number. Also, when applicable, show that optional this report directly from DDM Other qualified DDCmarkings have been used for Group 3 and Group 4 'as author- users shall request throughized.
3. REPORT TITLE: Enter the complete report title in all (4) "U. S. military agencies may obtain copies of thiscapital letters. Titles in all cases should be unclassified, report directly from DDC Other qualified usersIf a meaningful title cannot be selected without classifica- shall request throughtion, show title classification in all capitals in parenthesisimmediately following the title. •"
4. DESCRIPTIVE NOTES: If appropriate, enter the type of (5) "All distribution of this report is controlled. Qual-report, e.g., interim, progress, summary, annual, or final. ified DDC users shall request throughGive the inclusive dates when a specific reporting period iscovered.
If tfie report has been furnished to the Office of Technicalo. AUTHOR(S)e Enter the name(s) of author(s) as shown on Services, Department of Commerce, for sale to the public, indi-or in the report. Enter last name, first name, middle initial cate this fact and enter the price, if known.If military, show rank and branch of service. The name ofthe principal author is an absolute minimum requirement. IL SUPPLEMENTARY NOTES: Use for additional explana-6. REPORT DATE. Enter the date of the report as day, tory notes.month, year, or month, year. If more than one date appears 12. SPONSORING MILITARY ACTIVITY: Enter the name ofon the report, use date of publication, the departmental project office or laboratory sponsoring (pay-7a. TOTAL NUMBER OF PAGES: The total page count in for) the research and development. Include address.should follow normal pagination procedures, Le., enter the 13. ABSTRACT: Enter an abstract giving a brief and factualnumber of pages containing information. summary of the document indicative of the report, even though
7b. Nit may also appear elsewhere in the body of the technical re-rNUMBER OF REFERENCEt Enter the total number of port. If additional space is required, a continuation sheet
references cited in the report. shall be attached. %,8a. CONTRACT OR GRANT NUMBERI If appropriate, enter It is highly desirable that the abstract of classified re-the applicable number of the contract or grant under which ports be unclassified. Each paragraph of the abstract shallthe report was written. end with an indication of the military security classification8b, Sc, k 8d. PROJECT NUMBER: Enter the appropriate of the information in the paragraph, represented as (TS), (S),military department identification, such as project number, (C), or (U).subproject number, system numbers, task number, etc. There is no limitation on the length of the abstract. How-9a. ORIGINATOR'S REPORT NUMBER(S): Enter the offi- ever, the suggested length is from 150 to 225 words.cial report number by which the document will be identified 14. KEY WORDS: Key words are technically meaningful termsand controlled by the originating activity. This number must or short phrases that characterize a report and may be used asbe unique to this report. index entries for cataloging the report. Key words must be9b. OTHER REPORT NUMBER(S): If the report has beei selected so that no security classification is required. Iden-Sassigned any other report numbers (either by the oribinator flare, such as equipment model designation, trade name, mili-or by the aponeor), also enter this numbetr(s) tary project code name, geographic location, may be used askey words but will be followed by an indication of technical
context. The assignment of links, rules, and weights isoptional.
UnclassifiedSecurity Classification