Materials Science & Engineering A - University of …mmrl.ucsd.edu/pdf/MSEA_nanofoam.pdf ·...
13
Fast-condensing nanofoams: Suppressing localization of intense stress waves Cang Zhao a , Yu Qiao a,b,n a Department of Structural Engineering, University of California – San Diego, La Jolla, CA 92093-0085, USA b Program of Materials Science and Engineering, University of California – San Diego, La Jolla, CA 92093, USA article info Article history: Received 5 July 2016 Received in revised form 1 September 2016 Accepted 2 September 2016 Available online 4 September 2016 Keywords: Nanofoam Size effect Energy absorption Localization Stress wave abstract We investigated the propagation of intense stress waves across silica nanofoams, with the pore size ranging from 50 nm to 1 mm and the porosity of 60%. The experimental results showed that if the pore size was relatively large, the stress wave remained localized and its energy was dissipated in narrow bands; if the pore size was below 200 nm, however, the stress wave was homogenized in a broad area and consequently, bulk distributed energy absorption was promoted and the maximum transmitted- wave pressure was significantly reduced. We attribute this phenomenon to the fast condensation of the smallest pores at the wave front. The ability of nanofoams to promote widespread energy absorption may enable efficient stress-wave mitigation techniques. The classic Grady model was modified to take account for the nanopore size effect. & 2016 Elsevier B.V. All rights reserved. 1. Introduction Associated with intense dynamic shear loading, a stress wave can be localized [1,2]; that is, the wave front may become non- uniform in transverse directions. An intense stress wave is often nonlinear; i.e., nonlinear material behaviors, e.g. internal dama- ging, dominate the wave propagation and dissipation. Under this condition, many concepts of linear wave theory, such as acoustic impedance and wave energy conservation, may break down. For instance, as a nonlinear stress wave advances into a solid material, it can cause plastic yielding, micro-cracking, and/or local phase transformation [3–7]; in a foam material, it may trigger cell buckling and ligament rupture [8,9]; in a granular material, it can activate rearrangement of close-packed components [10,11]. The nonlinearity is often coupled with the stress wave localization [12– 14]; i.e., an initially uniform wave front may become localized and the wave energy is dissipated in a number of narrow zones, e.g. shear bands [3,10,15,16]. The instability of stress wave can be caused by either material instability or geometrical instability [1]. Over the years, the stability of stress waves was extensively in- vestigated [1,10,11,17–21]. Shear-band nucleation, propagation, and morphology change were related to materials properties and loading modes. However, there still lack efficient methods to “disperse” intense stress waves and to promote widespread energy absorption. For each material and loading condition, when an intense stress wave is localized, the shear deformation zone (SDZ) has a char- acteristic width, w, ranging from a few nm in metallic glass [22] to hundreds of μm in foam materials [8] or granular materials [23,24]. For brittle solids, based on the equilibrium condition of kinetic energy and strain energy, Grady [25,26] developed a model to predict the fragment length: ρε = ̇ () ⎛ ⎝ ⎜ ⎜ ⎞ ⎠ ⎟ ⎟ L K C 24 1 c 2/3 where K c is the fracture toughness, ρ is the mass density, C is the speed of sound, and ε ̇ is the strain rate. This framework can be applied to analyze both the spacing and the size of SDZ. It captures the effects of strain rate and resistance to shear [27,28]. The Grady model has successfully explained many experimental observations of solid and porous materials [27,29–31]. It suggests that the SDZ size (w) is independent of the characteristic length of the material, e.g. the pore size (d). Foams are solid materials containing empty cells or pores [32]. A few examples of foams include bones [33,34], woods [34,35], carbon nanotube bundles [36], and porous polymers/metals/ ceramics [37–39]. In general, foams are lightweight. They are widely applied for thermal insulation, acoustic damping, and im- pact and vibration protection [32,40]. In a foam material, if a stress wave becomes localized, catastrophic failure would take place in narrow shear bands, with the majority of the protection capacity being “wasted”. In a regular foam material where the pore size is Contents lists available at ScienceDirect journal homepage: www.elsevier.com/locate/msea Materials Science & Engineering A http://dx.doi.org/10.1016/j.msea.2016.09.021 0921-5093/& 2016 Elsevier B.V. All rights reserved. n Corresponding author at: Department of Structural Engineering, University of California – San Diego, La Jolla, CA 92093-0085, USA. E-mail address: [email protected] (Y. Qiao). Materials Science & Engineering A 676 (2016) 450–462
Transcript of Materials Science & Engineering A - University of …mmrl.ucsd.edu/pdf/MSEA_nanofoam.pdf ·...
Materials Science & Engineering A 676 (2016) 450–462
Contents lists available at ScienceDirect
Materials Science & Engineering A
http://d0921-50
n CorrCaliforn
E-m
journal homepage: www.elsevier.com/locate/msea
Fast-condensing nanofoams: Suppressing localization of intensestress waves
Cang Zhao a, Yu Qiao a,b,n
a Department of Structural Engineering, University of California – San Diego, La Jolla, CA 92093-0085, USAb Program of Materials Science and Engineering, University of California – San Diego, La Jolla, CA 92093, USA
a r t i c l e i n f o
Article history:Received 5 July 2016Received in revised form1 September 2016Accepted 2 September 2016Available online 4 September 2016
Keywords:NanofoamSize effectEnergy absorptionLocalizationStress wave
x.doi.org/10.1016/j.msea.2016.09.02193/& 2016 Elsevier B.V. All rights reserved.
esponding author at: Department of Structuria – San Diego, La Jolla, CA 92093-0085, USA.ail address: [email protected] (Y. Qiao).
a b s t r a c t
We investigated the propagation of intense stress waves across silica nanofoams, with the pore sizeranging from �50 nm to �1 mm and the porosity of �60%. The experimental results showed that if thepore size was relatively large, the stress wave remained localized and its energy was dissipated in narrowbands; if the pore size was below �200 nm, however, the stress wave was homogenized in a broad areaand consequently, bulk distributed energy absorption was promoted and the maximum transmitted-wave pressure was significantly reduced. We attribute this phenomenon to the fast condensation of thesmallest pores at the wave front. The ability of nanofoams to promote widespread energy absorption mayenable efficient stress-wave mitigation techniques. The classic Grady model was modified to take accountfor the nanopore size effect.
& 2016 Elsevier B.V. All rights reserved.
1. Introduction
Associated with intense dynamic shear loading, a stress wavecan be localized [1,2]; that is, the wave front may become non-uniform in transverse directions. An intense stress wave is oftennonlinear; i.e., nonlinear material behaviors, e.g. internal dama-ging, dominate the wave propagation and dissipation. Under thiscondition, many concepts of linear wave theory, such as acousticimpedance and wave energy conservation, may break down. Forinstance, as a nonlinear stress wave advances into a solid material,it can cause plastic yielding, micro-cracking, and/or local phasetransformation [3–7]; in a foam material, it may trigger cellbuckling and ligament rupture [8,9]; in a granular material, it canactivate rearrangement of close-packed components [10,11]. Thenonlinearity is often coupled with the stress wave localization [12–14]; i.e., an initially uniform wave front may become localized andthe wave energy is dissipated in a number of narrow zones, e.g.shear bands [3,10,15,16]. The instability of stress wave can becaused by either material instability or geometrical instability [1].Over the years, the stability of stress waves was extensively in-vestigated [1,10,11,17–21]. Shear-band nucleation, propagation,and morphology change were related to materials properties andloading modes. However, there still lack efficient methods to“disperse” intense stress waves and to promote widespread energy
al Engineering, University of
absorption.For each material and loading condition, when an intense stress
wave is localized, the shear deformation zone (SDZ) has a char-acteristic width, w, ranging from a few nm in metallic glass [22] tohundreds of μm in foam materials [8] or granular materials[23,24]. For brittle solids, based on the equilibrium condition ofkinetic energy and strain energy, Grady [25,26] developed a modelto predict the fragment length:
ρ ε=
( )
⎛⎝⎜⎜
⎞⎠⎟⎟L
KC
24
1c
2/3
where Kc is the fracture toughness, ρ is the mass density, C is thespeed of sound, and ε is the strain rate. This framework can beapplied to analyze both the spacing and the size of SDZ. It capturesthe effects of strain rate and resistance to shear [27,28]. The Gradymodel has successfully explained many experimental observationsof solid and porous materials [27,29–31]. It suggests that the SDZsize (w) is independent of the characteristic length of the material,e.g. the pore size (d).
Foams are solid materials containing empty cells or pores [32].A few examples of foams include bones [33,34], woods [34,35],carbon nanotube bundles [36], and porous polymers/metals/ceramics [37–39]. In general, foams are lightweight. They arewidely applied for thermal insulation, acoustic damping, and im-pact and vibration protection [32,40]. In a foam material, if a stresswave becomes localized, catastrophic failure would take place innarrow shear bands, with the majority of the protection capacitybeing “wasted”. In a regular foam material where the pore size is

Nomenclature
A cross-sectional area used in the calculation of acousticimpedance
Ab cross-sectional area of the Hopkinson barsC speed of sound used in the Grady modelCb speed of sound of the Hopkinson barsd pore sizeD diameter of the loading rodDr inner diameter of the support ringEb Young's modulus of the Hopkinson barsF peak forceKc fracture toughnessL fragment lengthm sample massp porosityp2 nominal two-dimensional porosity of a nanofoam
samplep2n nominal two-dimensional porosity of a pristine na-
nofoam samplePHg infiltration pressure of mercuryPi Average maximum incident-wave pressurePt0 equivalent maximum normal stressPtc maximum transmitted-wave pressure in dynamic
compressionPts maximum transmitted-wave pressure in dynamic
shearingPw stress-wave pressurer radius of the loading rodS0 quasi-static shear strengtht sample thicknessT temperatureTP pulse durationU energy associated with stress waveUi energy associated with incident stress waveUk kinetic energy associated with local particle velocityUr energy associated with reflected stress waveUs strain energy associated with local deformationUt energy associated with transmitted stress wavev impact velocity of the strikerV volume of the material that undergoes permanent
structural changesw shear-deformation-zone sizez acoustic impedance of nanofoam sampleβ energy dissipation factorε strainε strain rateρ mass density (mass divided by sample volume)ρb mass density of the Hopkinson barsρs mass density of solid amorphous silicaς pressure reduction factor
C. Zhao, Y. Qiao / Materials Science & Engineering A 676 (2016) 450–462 451
relatively large, e.g. comparable with or larger than the typical SDZsize, the cell buckling at the stress wave front may be viewed as aprocess that reduces the shear resistance; thus, wave energy dis-sipation tends to be limited within a number of narrow bands. Inthe current study, we investigate nanofoams in which the poresare nano-sized, much smaller than the typical SDZ size. In such amaterial, cell buckling may be viewed as a fast condensationmechanism, which increases the effective local shear resistance. Asthe shear banding is suppressed, bulk-distributed energy absorp-tion may be promoted.
2. Methodology
2.1. Materials and specimens
In the current investigation, we processed a set of monolithicsilica foam samples. The pore formation was achieved by sol-gelmethods [39,41,42], and the porous structure was precisely con-trolled by a subcritical calcination (SCC) process [43]. The details ofthe sample preparation have been documented in Appendix A.
The pore formation agents were polyethylene glycol (PEG) forlarge pores, or potassium silicate for small nanopores. After phaseseparation, they were eliminated through acid washing. Then, thesamples were dried at 80 °C for 3 days in a VWR 1330GM oven,and subcritically calcinated at temperatures slightly higher than
Table 1Processing conditions and properties of silica nanofoams.
Component mass ratio TMOS to PEG Colloidal silica to potassium silicate
5.5:1.0 1.3:98.7 7.5:92.5 12.5:8
SCC temperature (°C) 1230 1260 1262 1260Pore size range [780,1980] [240,390] [190,290] [150,2Average pore size (nm) 13807600 315775 240750 1857Porosity (%) 59.672.7 62.770.9 61.670.9 60.77
the glass transition point of amorphous silica glass, 1200 °C, for 1 hin a MTI GSL-1700X horizontal tube furnace. The ramp rate wasinitially set as 3 °C/min; and when the temperature was 100 °Caway from the target temperature, the ramp rate was reduced to1 °C/min. After the SCC procedure, cooling was conducted at a rateof 3 °C/min to minimize the residual stress.
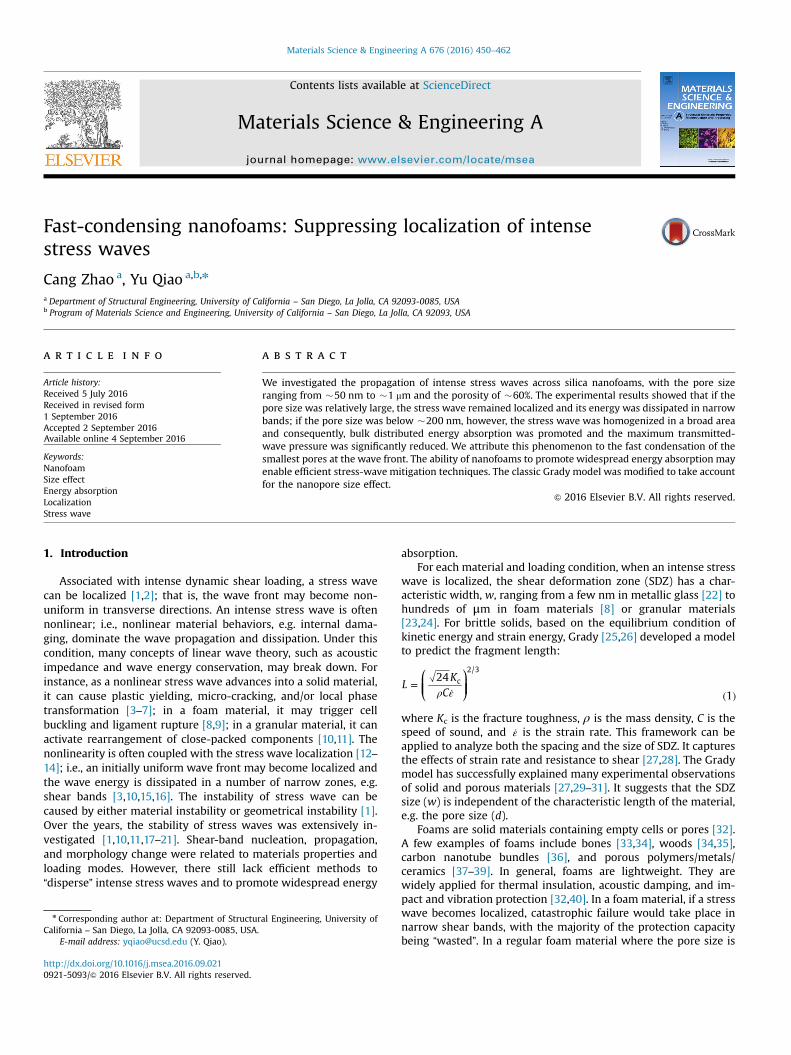
The processing conditions and the key material parameters ofthe silica nanofoams are shown in Table 1. The testing sampleswere disk-shaped, with the diameter of �23 mm and the thick-ness of 4.50 mm. Fig. 1a shows the X-ray diffraction (XRD) analysisresults. Fig. 1(b–d) show the morphology of silica nanofoams.
2.2. Mechanical testing
2.2.1. Shear-promotion-support-ring systemThe shear-promotion-support-ring (SPSR) system, as shown in
Fig. 2a, included a front part and a rear part made of 17–4 PHstainless steel. As depicted in Fig. 2b, a silica nanofoam disk wasmounted between the front part and the rear part, with an thinlayer of petrolatum applied on each interface to reduce potentialfriction and to smoothen stress wave transmission. A loading rodwith the outer diameter of 12.7 mm was compressed against thesurface of the sample. At the back of the silica disk, the supportring and the steel plate on the rear part were used to support thesample. The inner diameter of the support ring was 13.1 mm,slightly larger than the outer diameter of the loading rod; the
7.5 17.0:83.0 22.5:77.5 27.5:72.5 35:65 40:60
1258 1254 1251 1239 122820] [130,180] [100,140] [70,100] [60,80] [40,60]35 155725 120720 85715 70710 507101.2 59.570.8 62.471.4 59.172.0 60.071.5 60.071.3
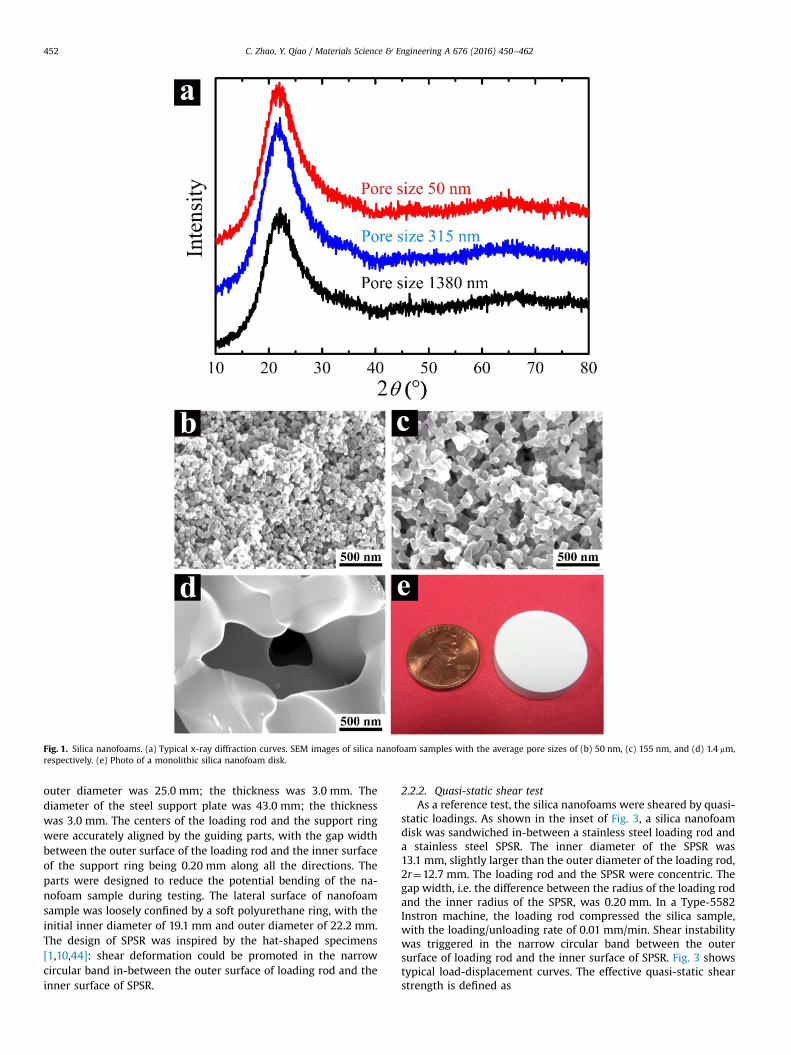
Fig. 1. Silica nanofoams. (a) Typical x-ray diffraction curves. SEM images of silica nanofoam samples with the average pore sizes of (b) 50 nm, (c) 155 nm, and (d) 1.4 mm,respectively. (e) Photo of a monolithic silica nanofoam disk.
C. Zhao, Y. Qiao / Materials Science & Engineering A 676 (2016) 450–462452
outer diameter was 25.0 mm; the thickness was 3.0 mm. Thediameter of the steel support plate was 43.0 mm; the thicknesswas 3.0 mm. The centers of the loading rod and the support ringwere accurately aligned by the guiding parts, with the gap widthbetween the outer surface of the loading rod and the inner surfaceof the support ring being 0.20 mm along all the directions. Theparts were designed to reduce the potential bending of the na-nofoam sample during testing. The lateral surface of nanofoamsample was loosely confined by a soft polyurethane ring, with theinitial inner diameter of 19.1 mm and outer diameter of 22.2 mm.The design of SPSR was inspired by the hat-shaped specimens[1,10,44]: shear deformation could be promoted in the narrowcircular band in-between the outer surface of loading rod and theinner surface of SPSR.
2.2.2. Quasi-static shear testAs a reference test, the silica nanofoams were sheared by quasi-
static loadings. As shown in the inset of Fig. 3, a silica nanofoamdisk was sandwiched in-between a stainless steel loading rod anda stainless steel SPSR. The inner diameter of the SPSR was13.1 mm, slightly larger than the outer diameter of the loading rod,2r¼12.7 mm. The loading rod and the SPSR were concentric. Thegap width, i.e. the difference between the radius of the loading rodand the inner radius of the SPSR, was 0.20 mm. In a Type-5582Instron machine, the loading rod compressed the silica sample,with the loading/unloading rate of 0.01 mm/min. Shear instabilitywas triggered in the narrow circular band between the outersurface of loading rod and the inner surface of SPSR. Fig. 3 showstypical load-displacement curves. The effective quasi-static shearstrength is defined as

Fig. 2. Photos of the shear-promotion-support-ring (SPSR) system. (a) The system components and a silica nanofoam sample; the diameter of the silica nanofoam sample is�23 mm. (b) A silica nanofoam sample mounted in the SPSR system, with the steel loading rod compressing the sample. The diameter of the rod is 12.7 mm and the innerdiameter of the support ring on the rear part is 13.1 mm.
Fig. 3. Typical load-displacement curves under quasi-static shear condition. Thearrows indicate the average pore sizes of the samples. The inset shows the sche-matic of the testing setup; the outer diameter of the compression rod isD¼12.7 mm; the inner diameter of the support ring is Dr¼13.1 mm; the loading/unloading rate is 0.01 mm/min.
Fig. 4. Quasi-static shear strength, S0, as a function of the average pore size, d.
C. Zhao, Y. Qiao / Materials Science & Engineering A 676 (2016) 450–462 453
π= ( )S
Frt2 20
where F is the measured peak loading at the onset of shear failureand t is the sample thickness. Table 2 and Fig. 4 show the quasi-static shear strength (S0).
2.2.3. Dynamic compression testAs another reference test, we also investigated the behaviors of
silica nanofoams under one-dimensional compressive stresswaves, by using a Split Hopkinson Bar (SHB) system [45–47]. Thedetails of the SHB system were documented in Appendix B. A62.8 g titanium (Ti) tube striker was projected by a gas chamberand impacted the stainless steel incident bar. Upon impact, a high-pressure stress wave was generated and propagated along theincident bar [47]. In all the tests, the striker speed was kept at�8.5 m/s. On the other end of the incident bar, a silica nanofoam
Table 2Testing results of silica nanofoams.
d (nm) 13807600 315775 240750 185735p (%) 59.672.7 62.770.9 61.670.9 60.771.2Pi (MPa) 32.770.6 32.370.6 31.471.2 31.170.4S0 (MPa) 10.8 12.7 11.7 10.5Ptc (MPa) 29.9 30.0 30.1 29.6Pts (MPa) 29.374.1 17.871.9 16.471.5 11.970.9β 0.3570.14 0.7570.04 0.8270.02 0.8770.02
disk sample was firmly attached, supported by a stainless steeltransmitted bar from the back. The stress wave entered into thesilica sample, and eventually transmitted to the transmitted bar.The diameters of all the bars were 12.7 mm; the lengths of theincident and the transmitted bars were 178 cm and 152 cm, re-spectively. The incident, reflected and transmitted-wave profileswere measured by the strain gauges mounted on the incident barand the transmitted bar, respectively, as shown in Fig. 5. Thetransmitted-wave pressures (Ptc, the peak pressure in the waveprofile) were summarized in Table 2 and Fig. 6.
2.2.4. Dynamic shear testDynamic shear tests were conducted on silica nanofoam disks
by using the same SHB system as in Section 2.2.3, except that thesample was supported by a stainless steel SPSR from the back. TheSPSR was the same as the support ring in Section 2.2.2. The strikerspeed was maintained at �8.5 m/s. The gap width between theouter surface of incident bar and the inner surface of SPSR was setas 0.20 mm. Fig. 7 shows the incident, reflected and transmitted-wave profiles, respectively. The transmitted-wave pressures (Pts,
155725 120720 85715 70710 5071059.570.8 62.471.4 59.172.0 60.071.5 60.071.331.370.6 32.770.6 29.170.3 31.370.5 31.670.29.8 10.8 9.0 14.6 12.030.6 28.6 29.4 28.3 28.513.470.1 10.570.8 11.271.0 11.071.4 13.871.00.8570.01 0.9070.01 0.8970.02 0.8970.01 0.8270.01

Fig. 5. Typical profiles of (a) incident, (b) reflected, and (c) transmitted stress waves under dynamic compression conditions. The legends indicate the average pore sizes ofsilica foams. The impact rate of striker is �8.5 m/s.
Fig. 6. The transmitted-wave pressure, Ptc, as a function of the average pore size, d.
C. Zhao, Y. Qiao / Materials Science & Engineering A 676 (2016) 450–462454
the peak pressure in the wave profile) of silica nanofoams withdifferent average pore sizes were summarized in Table 2 and Fig. 8.
2.2.5. Quantitative SEM image analysisAfter testing, the dynamically sheared silica samples were well
preserved. Selected samples were cleaved along the radius direc-tion (Fig. 9a), and the areas around the circular bands of sheardeformation in the exposed lateral surfaces, as depicted by thedashed rectangular box in Fig. 9b, were observed under a FEI-XL30environmental scanning electron microscope (SEM) at 20 kV, withthe spot size of 3.0. The SEM samples had been coated with
iridium using an Emitech K575X sputter coater at 85 mA for 6 sprior to the observation. Fig. 9c shows typical SEM images. Theporous structures near and far away from the edge of incident barwere observed at different magnifications, as shown in Fig. 9d.
A quantitative SEM image analysis algorithm was developed todetermine the boundaries of SDZ. Outside the SDZ, no permanentcell deformation could be detected. Inside the SDZ, the porositychanged significantly. Details of this technique has been docu-mented in Appendix C. As shown in Fig. 10, image filtering [48]was first conducted to enhance the local contrast of the originalSEM image. Then, the enhanced image was converted into binaryformat, where the Otsu's method [49] was used to obtain thethreshold. On the converted image, a nominal two-dimensionalporosity, p2, was defined as the fraction of the black area. The p2value of the far field was employed as the reference. For self-comparison purpose, SDZ was defined as the area where the localporosity differs from that in far field by more than �1 ss, with ssbeing the standard deviation. The image analysis results are shownin Fig. 11, with the solid lines marking out the SDZ boundaries.
3. Results and discussion
As shown in Fig. 1e, the testing specimens are in the disk formhaving the diameter of �23 mm and the thickness of 4.50 mm.The porosities of all the foam silica are around 60%; their poresizes ranges from dozens of nm to more than 1 mm, with relativelynarrow pore size distributions. In Fig. 1a, through x-ray diffraction(XRD) analysis, it is confirmed that all the samples were in thesame amorphous silica phase [50]. Fig. 1(b–d) shows the porous

Fig. 7. Typical profiles of (a) incident, (b) reflected, and (c) transmitted stress waves under dynamic shear conditions. The arrows indicate the average pore sizes of silicafoams. The impact rate of striker is �8.5 m/s.
Fig. 8. The transmitted-wave pressure, Pts, as a function of the average pore size, d.
C. Zhao, Y. Qiao / Materials Science & Engineering A 676 (2016) 450–462 455
morphology. The pores are random, interconnected and of similarshapes.
As shown in Fig. 3, the quasi-static peak shear stresses are si-milar for all the foam samples. The results in Table 2 and Fig. 4suggest that the quasi-static shear strength, S0, is quite insensitiveto the pore size, as predicted by the classic theory [32]: Thestrength/hardness and toughness of a foam material are de-termined by its porosity, p.
( )∝ − ( )δ
S p1 30
where δ is a system constant. Since all the silica foam disks in thecurrent study have a similar porosity, �60%, their quasi-staticshear strengths are at the same level, �11.1 MPa.
In the dynamic SHB tests, because the striker speed is keptnearly constant (�8.5 m/s), the incident-wave profiles and pres-sures are similar for all the samples, as shown in Table 2. With theincident-wave pressure of �31 MPa, in the dynamic compressiontest, the cell deformation is quite elastic; while in the dynamicshear tests, the pores collapse (Fig. 9d), and the stress wave ishighly nonlinear. The acoustic impedance (z) of silica foam is de-termined by [51]
ρ= ∙ ∙ ( )z A c 4
where A is the cross sectional area, ρ is the mass density, and c isthe speed of sound, all of which are unrelated to the pore size, d.Thus, the acoustic impedances of all the silica foams should besimilar. The stress wave in the incident bar is one-dimensional andits wave front is regular, i.e. homogeneous along transverse di-rections [47]. When such a one-dimensional stress wave en-counters an interface, a part of it will be reflected, determined bythe impedance mismatch. As shown in Table 2 and Fig. 6, thetransmitted-wave pressure is nearly constant for all the silicafoams, independent of the pore size, indicating that, under com-pressive stress waves, the acoustic impedance and the wave pro-pagation of silica foams are not related to d, as predicted by classicdynamic mechanics theory [52,53].

Fig. 9. Schematics of (a) the SHB experimental setup for the dynamic shear test, and (b) the scanning area (the dashed rectangle) in a SEM sample harvested from a testedsilica foam disk. (c) A typical SEM image of the dynamically sheared silica nanofoam sample. (d) Porous structures in the shear deformation zone (top row) and in the far field(bottom row) of a tested nanofoam sample.
Fig. 10. The filtering technique for the quantitative image analysis: (a) an original SEM image; (b) an enhanced SEM image using the Shading Correction and the LocalEqualization techniques; (c) a binary SEM image using the Otsu method.
C. Zhao, Y. Qiao / Materials Science & Engineering A 676 (2016) 450–462456
In the dynamic shear experiment, while the stress wave in theincident bar was compressive, shear deformation was promoted inthe narrow circular band in-between the outer surface of incidentbar and the inner surface of SPSR. Due to the geometrical change,the stress wave in the silica sample was no longer homogeneous,but localized; i.e. its spatial distribution is nonuniform. Under thiscondition, as shown in Table 2 and Fig. 8, the transmitted-wavepressure becomes highly dependent on the pore size. As the poresize decreases from �1.4 mm to �300 nm, the transmitted-wavepressure is lowered relatively slowly by nearly �30%; as the poresize further decreases to �100 nm, the transmitted-wave pressurerapidly reduces by another �30%. Overall, with the pore sizearound 100–200 nm, the transmitted-wave pressure is only �1/3of that of the large-pore-sized samples. In our experiment, theincident-wave pressure and duration are maintained at constant
levels; as the impedance of the material is unrelated to the poresize, the reflected-wave profiles do not have any correlation withthe pore size. The trend in transmitted waves must be associatedwith the structural changes and the energy absorption of thefoams.
As shown in Fig. 11, when the pore size, d, decreases fromabove 300 nm to �100 nm, the SDZ configuration undergoes asharp transition. When d4300 nm, the stress wave in the silicafoams exhibits typical concentrated characteristics. The shear de-formation is localized in the narrow circular band between theouter surface of incident bar and the inner surface of SPSR. When dis �100–200 nm, the SDZ size abruptly increases. A much broaderfield of material is involved in the wave propagation and porecollapse, leading to a much larger volume of structural variation,V; that is, the localized stress wave is homogenized and

Fig. 11. SEM images of tested silica nanofoams with the average pore sizes of (c) 315 nm, (d) 155 nm, and (e) 120 nm, respectively. The solid squares indicate the local areaswhere nanopores are highly deformed; the solid lines show the boundaries of shear deformation zones (SDZ).
Fig. 12. The average shear-deformation-zone (SDZ) size, w, as a function of theaverage pore size, d, fitted with the power law, w ∝ d1–3χ/2. The diamonds showthe testing data; the solid line is the regressed curve; the dashed line indicates theshear-gap width (200 mm) between the incident bar and the SPSR.
C. Zhao, Y. Qiao / Materials Science & Engineering A 676 (2016) 450–462 457
widespread energy absorption is promoted. Because more waveenergy is dissipated, the transmitted-wave pressure decreaseswith the pore size.
The classic Grady's model, Eq. (1), does not account for any sizeeffect [25,27–31], which is against our observation in silica nano-foams. However, it does provide a framework to collectively ana-lyze the physical parameters [1]. With the pore size (d) being avariable, the SDZ size (w) can be expressed as
ρ ε= ( ) ( )w f K C d, , , , 5c
where f is a certain function. According to the Π theorem [54],
ρ ε=
( )
⎛⎝⎜⎜
⎞⎠⎟⎟w d f
K
C d/
6c
3/2
If f is set to a power law form, Eq. (6) becomes
ρ ε= α
( )
χ⎛⎝⎜⎜
⎞⎠⎟⎟w d
K
C d/
7c
3/2
where α and χZ2/3 are two dimensionless material parameters.Eq. (7) can be rewritten as
ρ ε= α
∙
( )
χχ−⎛
⎝⎜⎞⎠⎟w
KC
d8
c 1 3 /2
When χ¼2/3, Eq. (8) is reduced to Eq. (1) and w is independent ofd. If χ42/3, the SDZ size, w, increases as the pore size, d, de-creases, agreeing with our experimental observation. For the silicananofoams under investigation, as shown in Fig. 11, the SDZ sizewas measured from the SEM image as the area surrounded by thesolid lines, and was averaged over the sample thickness. In Fig. 12,through data fitting, the value of χ is determined as 2.170.1, or�2.0; hence, w∝1/d 2. When the pore size is relatively large, e.g.larger than 300 nm, the SDZ size converges to the shear gap widthof 0.2 mm.
The capacity of energy dissipation of a silica foam may be de-scribed by the energy dissipation factor (β):
β =− −
− ( )U U U
U U 9i r t
i r
where Ui, Ur, and Ut are the energies carried by the incident,
reflected, and transmitted waves, respectively. When a linear, one-dimensional stress wave propagates in an elastic medium, thestress wave energy (U) consists of two parts: the strain energy (Us)associated with local deformation and the kinetic energy (Uk) as-sociated with local particle velocity. The strain energy may beassessed as
) ∫(= ⋅ ( )U A C E P dt/ 2 , 10s b
T
wb b0
2P
where Ab, Cb, Eb, Pw, and t are the cross-sectional area of themedium, the speed of sound, the Young's modulus of the medium,the wave pressure, and the time, respectively [55,56]. The in-tegration is performed over the pulse duration, TP. The kineticenergy can be estimated as
∫(ρ= )⋅ ( )U A C E P dt/ 2 , 11k b b b b
T
w3 2
0
2P
where ρb is the mass density. Thus, the stress wave energy (U)

Fig. 13. The energy dissipation factor, β, as a function of the average pore size, d.
C. Zhao, Y. Qiao / Materials Science & Engineering A 676 (2016) 450–462458
∫ ∫ρξ= + = + ⋅ = ⋅
( )
⎛⎝⎜⎜
⎞⎠⎟⎟U U U
A CE
A C
EP dt P dt
2 2 12s k
b
b b b
b
T
w
T
wb b
3
2 0
2
0
2P P
where ξ¼AbCb/(2Eb)þρbAbCb3/(2Eb2). For a linear elastic medium,
Eb¼ρbCb2; hence, ξ¼AbCb/Eb. For the Split Hopkinson Bar (SHB)system used in the current investigation, Ab¼126.7 mm2;Cb¼5790 m/s; Eb¼196.5 GPa. Therefore, the system constantξ¼3.73�10–12 m5N/s. Here, the definition of stress wave energy isonly for self-comparison purpose.
The calculation results of the energy dissipation factor, β, aresummarized in Table 2 and Fig. 13. With a relatively large pore sizeabove 1 mm, the energy dissipation is quite low; as the pore sizedecreases, β rapidly increases, and reaches the peak value as d is�100 nm, consistent with the observed SDZ configurations.
The wave homogenization in small-pore-sized silica nanofoamsshould be attributed to the fast condensation caused by cell de-formation. When a stress wave encounters a hard inclusion, itsfront may be dispersed to a broader field [18]. In the silica nano-foams under investigation, initially the materials are uniform. Asthe intense localized stress wave advances, pore collapse occurs.When the pore size is relatively large, e.g. comparable with orlarger than the characteristic size of wave front, pore collapseleads to local “softening”, which promotes wave instability [57,58],so that the stress wave is concentrated in the gap between theincident bar and the SPSR. When the pores are relatively small, e.g.much smaller than the characteristic size of wave front, theircollapse takes only a short period of time and effectively becomesa local compaction/hardening process. Therefore, shear con-centration is suppressed, and the wave front is dispersed into farfield.
In the dynamic shear test, the broadening of intense stresswave is evident only when the pore size is sufficiently small. Toidentify the critical condition where the wave broadening starts,we define the pressure reduction factor (ς)
ς| |= − ( )P P P/ 13ts t t0 0
where Pt0 is the equivalent maximum normal stress under quasi-static shear condition. For the silica nanofoams with the porosityof �60%, the measured Pt0 is �16.1 MPa. When ς>0 ( ς+), themaximum transmitted-wave pressure is higher than 16.1 MPa, andthis region is defined as the Regular Region; when ς<0 ( ς−), themaximum transmitted-wave pressure is lower than 16.1 MPa, andthis region is defined as the Nano Region. The boundary betweenthe Regular Region and the Nano Region, �200 nm, defines thepoint where the localized stress wave starts to be homogenized.
4. Conclusions
According to conventional theory, pore size has little influenceon the quasi-static shear strength of a foam. In the current study,we show that when a silica foam is subjected to an intense shearstress wave and its pore size is less than 200 nm, a strong sizeeffect can be observed: The smaller the pores, the broader theshear-deformation zone is and the more energy the silica foamabsorbs. That is, as the pore size is reduced to the nanometer scale,silica nanofoam suppresses shear localization and promotes bulk-distributed energy absorption. We attribute this size effect to thefast condensation of the nanopores at the stress wave front. As thepore size is smaller than the characterize lengths of wave front andtypical shear deformation zone, and the pore collapse time isshorter than the characteristic time of wave propagation, porecollapse effectively leads to local hardening and disperses the in-tense stress wave to a broader field. Thus, a large volume of ma-terial is involved in energy absorption and the transmitted-wavepressure is much reduced. The classic Grady's equation is modifiedto capture the pore size effect; the shear-deformation-zone sizeapproximately follows an inverse-square law of the pore size. Thepresence of the Nano Region of foam materials may open a door tomitigation of intense stress waves and promotion of energyabsorption.
Acknowledgements
This research was supported by The Army Research Office un-der Grant No. W911NF-12-1-0011, for which the authors aregrateful to Dr. David M. Stepp. Special thanks are also due toProfessors Jian Luo, Vitali F. Nesterenko and Marc A. Meyers for theuseful discussions.
Appendix A. Sample processing and characterization
A.1. Sol-gel methods
Silica monoliths with various pore sizes were synthesizedthrough sol-gel method, following the works of [42] for silicasamples with the average pore size smaller than 500 nm, and[39,41] for silica samples with larger average pore sizes,respectively.
For the former (smaller pores), Sigma-Aldrich Ludox HS-40colloidal silica was mixed with PQ Kasil-1 potassium silicate so-lution in a flask, by magnetic stirring for 30 min. The total masswas 800 g. The mass ratio was in the range from 1:99 to 40:60. Alarger colloidal silica amount would lead to a smaller pore size.With the silica-silicate mixture being vigorously stirred, 200 gformamide solution (40 wt% formamide and 60 wt% deionizedwater) was slowly added in, and the stirring continued for 30 min,by using a magnetic stirrer. Then the solution was transported intoa polypropylene plastic vial with the inner diameter of 35.6 mmand the height of 16.3 mm. After aging at room temperature for24 h, the wet gels were rinsed first by 1 M ammonium nitrate,then by 1 M nitric acid, then by deionized water at about 90 °C,and finally by pure methanol at room temperature.
For the latter (larger pores), 28 g Sigma-Aldrich polyethyleneglycol (PEG, with the average molecular weight of 10,000) was firstdissolved in 300 ml 0.01 M acetic acid aqueous solution. Then,150 ml Sigma-Aldrich tetramethyl orthosilicate (TMOS, 98%) wasadded and thoroughly mixed by a magnetic stirrer in a flask for30 min. The mixture was transported into a polypropylene plasticvial with the inner diameter of 46.2 mm and the height of

Table A1Effects of SCC temperature on the porosity and the pore size.
Sample No. Temperature (°C) Porosity Pore size (nm)
#03 850 85.6% 210767#03 1250 55.1% 159770
#07 850 83.8% 132749#07 1250 65.8% 106741
#10 850 79.9% 4173#10 1150 78.1% 4472#10 1200 76.0% 4577#10 1250 65.5% 4679
Fig. A1. Typical curves of mercury porosimetry. The black line (left) is a sorptionisotherm curve. The olive line (right) is dP/dV.
C. Zhao, Y. Qiao / Materials Science & Engineering A 676 (2016) 450–462 459
21.6 mm. After aging at 40 °C for 72 h, the gels were washed se-quentially by 0.1 M aqueous ammonia solution at about 120 °C,0.1 M nitric acid and deionized water at about 90 °C, and finallypure methanol at room temperature.
In both methods, each step of the rinsing process was repeatedfor more than five times. After rinsing, the silica monolith wasthermally treated in a VWR 1330GM oven at 80 °C for 72 h.
A.2. Subcritical calcination
The obtained silica monoliths had different average pore sizesand porosities. The pore size and the porosity were highly corre-lated. In order to uncouple these two important parameters, spe-cifically to vary the pore size in a broad range and keep the por-osity around 60%, a subcritical calcination (SCC) treatment wascarried out in a MTI GSL-1700X horizontal tube furnace at selectedtemperatures (Ts) for 1 h. The SCC temperatures ranged from850 °C to 1265 °C. The ramp rate was initially set as 3 °C/min; andwhen the temperature was less than 100 °C away from Ts, wasreduced to 1 °C/min. In order to minimize the residual stress, thecooling rate was set to be 3 °C/min. More details have beendocumented elsewhere [43].
As shown in Table A1, compared with the pore size, the por-osity was much more sensitive to the SCC temperature [43]. As theSCC temperatures were optimized for silica monoliths of variousinitial pore sizes, their porosities could be adjusted to a similarlevel, �60% while their pore sizes ranged from �50 nm to�1400 nm, as shown in Table 1 in the main text.
A.3. Surface conditioning
The SCC-treated silica monoliths were surface polished by a setof silicon carbide sandpapers [59,60], starting from 320-grit ones,followed by 600-grit, 1200-grit, and finally 2500-grit sandpapers.The initial sample thickness before SCC treatment was 10–14 mm,and 8–9 mm after the treatment. The sample thickness after eachstep of sandpaper polishing was 5–6 mm, 5 mm, 4.75 mm, and4.50 mm, respectively. The tolerance of final thickness was 750 mm.
A.4. Porosity
The porosity of a silica nanofoam sample, p, was calculatedfrom its mass density, ρ [32]: p¼1�ρ/ρs, where ρs¼2.2 g/cm3 isthe density of solid amorphous silica [61]. The mass density wasthe mass of the disk sample divided by its volume [43].
A.5. Pore size
The pore size was evaluated by the Washburn equation [62]:d¼4s � cosθ/PHg, where θ�140° is the contact angle, s¼0.484 N/mthe surface tension of mercury, and PHg the mercury infiltrationpressure. The mercury porosimetry analysis was conducted byimmersing a silica nanofoam sample with the mass of 0.5–1.5 ginto mercury in a stainless steel cylinder. The inner diameter of thecylinder was 19.05 mm. The top of the cylinder was sealed with asteel piston and a Buna-N o-ring. On an Instron 5582 machine, atthe rate of 0.10 mm/min, the piston was compressed into the cy-linder. The piston displacement and piston force were recorded.The change of the system volume, V, was obtained by multiplyingthe piston displacement with the piston cross-sectional area. Thepiston pressure, P, was calculated via dividing the piston force bythe piston cross-sectional area. In Fig. A1, the first order derivationof dP/dV was used to determine the range of the infiltration pla-teau. The lower limit was taken as the point where dP/dV abruptlydropped; the upper limit was set as the point where dP/dV startedto depart from zero. The average pore size was taken as the middlepoint between the minimum and the maximum pore sizes cal-culated from the infiltration plateau.
A.6. Powder x-ray diffraction
The SCC-treated silica nanofoams were characterized by aBruker D8 Advance Diffractometer using Cu Kα radiation(λ¼1.5418 Å), with the scan speed of 0.1 s/step, the step size of0.02°, the 2θ range of 10–80°. Fig. 1a in the main text shows typicalx-ray diffraction curves of silica nanofoams.
A.7. SEM image analysis
The silica nanofoams were observed under a FEI-XL30 en-vironmental scanning electron microscope (SEM) at 20 kV, with aspot size of 3.0. The SEM samples had been coated with iridiumusing an Emitech K575X sputter coater at 85 mA for 6 s prior tothe observation. The porous configurations of the samples withdifferent average pore sizes were shown in Fig. 1(b–d) in the maintext, with the same scale bar of 500 nm. Take the sample with theaverage pore size of �315 nm as an example, Fig. A2 shows theporous structure at different magnifications.
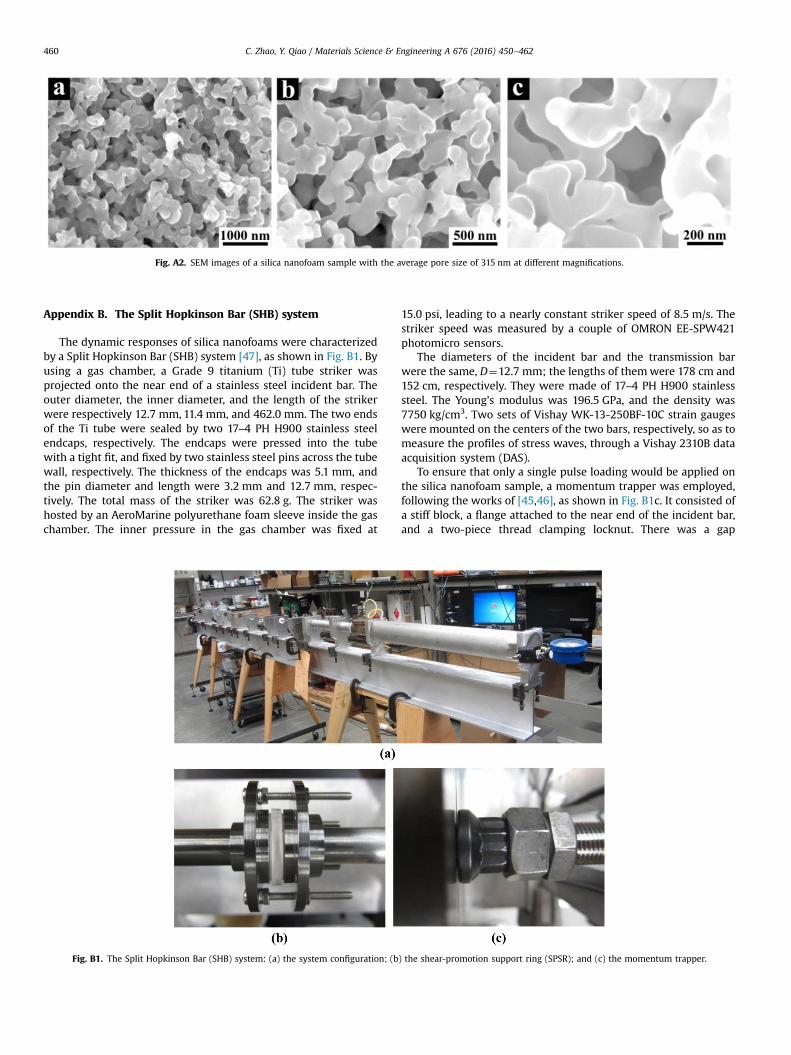
Fig. A2. SEM images of a silica nanofoam sample with the average pore size of 315 nm at different magnifications.
C. Zhao, Y. Qiao / Materials Science & Engineering A 676 (2016) 450–462460
Appendix B. The Split Hopkinson Bar (SHB) system
The dynamic responses of silica nanofoams were characterizedby a Split Hopkinson Bar (SHB) system [47], as shown in Fig. B1. Byusing a gas chamber, a Grade 9 titanium (Ti) tube striker wasprojected onto the near end of a stainless steel incident bar. Theouter diameter, the inner diameter, and the length of the strikerwere respectively 12.7 mm, 11.4 mm, and 462.0 mm. The two endsof the Ti tube were sealed by two 17–4 PH H900 stainless steelendcaps, respectively. The endcaps were pressed into the tubewith a tight fit, and fixed by two stainless steel pins across the tubewall, respectively. The thickness of the endcaps was 5.1 mm, andthe pin diameter and length were 3.2 mm and 12.7 mm, respec-tively. The total mass of the striker was 62.8 g. The striker washosted by an AeroMarine polyurethane foam sleeve inside the gaschamber. The inner pressure in the gas chamber was fixed at
Fig. B1. The Split Hopkinson Bar (SHB) system: (a) the system configuration; (b
15.0 psi, leading to a nearly constant striker speed of 8.5 m/s. Thestriker speed was measured by a couple of OMRON EE-SPW421photomicro sensors.
The diameters of the incident bar and the transmission barwere the same, D¼12.7 mm; the lengths of themwere 178 cm and152 cm, respectively. They were made of 17–4 PH H900 stainlesssteel. The Young's modulus was 196.5 GPa, and the density was7750 kg/cm3. Two sets of Vishay WK-13-250BF-10C strain gaugeswere mounted on the centers of the two bars, respectively, so as tomeasure the profiles of stress waves, through a Vishay 2310B dataacquisition system (DAS).
To ensure that only a single pulse loading would be applied onthe silica nanofoam sample, a momentum trapper was employed,following the works of [45,46], as shown in Fig. B1c. It consisted ofa stiff block, a flange attached to the near end of the incident bar,and a two-piece thread clamping locknut. There was a gap
) the shear-promotion support ring (SPSR); and (c) the momentum trapper.

C. Zhao, Y. Qiao / Materials Science & Engineering A 676 (2016) 450–462 461
between the flange and the rigid block. The gap width was pre-cisely controlled so that the motion of the flange would be stoppedimmediately after the tensile stress wave generated by the strikerhad entered into the incident bar. Thus, repeated pulse loadingwas prevented.
Appendix C. Quantitative image analysis
The silica nanofoam disks tested in the dynamic shear experi-ment were well preserved for further examination. After testing, aSEM sample was harvested from the disk, and the area aroundshear deformation zone in the exposed lateral surface was observedby a FEI-XL30 environmental scanning electron microscope (SEM).
Because the depth of the SEM view field was larger than thepore size, there would inevitably be shadows in the SEM images.In order to carry out a quantitative image analysis, image filteringwas conducted through a combination of the Shading Correctiontechnique developed by Reyes-Aldasoro [48] and the LocalEqualization function provided by the Image-Pro Plus software(Media Cybernetics Manufacturing, Warrendale, PA, USA), as de-monstrated in Fig. 10 in the main text. A SEM image was firstenhanced by the Shading Correction, reducing the shadow of theporous structure. Then it was imported into Image-Pro Plus, andLocal Equalization was employed to enhance its local contrast withthe window size of 60 pixels, the step of 1 pixel, and the standarddeviation of 0.5. Finally the Otsu's method [49] was used to obtainthe threshold (Matlab built-in function Graythresh) and the imagewas converted into binary format. On the converted image, anominal two-dimensional porosity, p2, was defined as the fractionof the black area. The measurement results of p2 qualitativelymatched the porosity data calculated from mass density (p) foruntested silica nanofoams, quite acceptable for self-comparisonpurpose. The numbers of pixels in white and black areas werecounted through the Matlab built-in function Bwarea.
SEM images of an exposed inner surface were placed together toconstruct an overall map. The map was divided into a large numberof small grids, and for each grid the value of local nominal two-dimensional porosity, p2, was calculated. The grid was rectangular,with the size of 93m mm by 242n mm, where m and n are positiveintegers. Typically, a 2500 mm by 4500 mm area surrounding theshear deformation zone was scanned. The scanning area coveredmore than one half of the sample thickness. The scanning was along5 or 6 straight lines parallel to the sample depth direction; alongeach line about 20 points were scanned; and around each pointabout 6 SEM images were taken. Cracked areas were skipped.
For each pore size, a reference nominal two-dimensional por-osity, p2n, was measured from a pristine nanofoam sample. As thesample was quite homogeneous and the number of pores waslarge, across an exposed inner surface, the standard deviation ofp2n was less than 2% of its average value. The results are shown inTable C1.
For a dynamically sheared sample, if the local value of p2 wasdifferent from p2n by more than �1 ss, with ss being the standarddeviation, the pores in the grid was regarded as being damaged.The image analysis results were shown in Fig. 11 in the main text,with the black squares indicating the local areas of deformedporous structures and the lines marking out the boundaries ofshear deformation zones.
Table C1Image analysis results of pristine silica nanofoams.
d (nm) 315775 240750 185735 155725 120720 85715p (%) 63.0 62.1 62.9 60.6 63.5 62.4p2n (%) 52.470.8 50.871.0 50.771.3 50.470.6 52.470.8 50.470.8
References
[1] V.F. Nesterenko, Dynamics of Heterogeneous Materials, Springer Science &Business Media, New York, NY, 2001.
[2] M.A. Meyers, Dynamic Behavior of Materials, John Wiley & Sons, Somerset, NJ,1994.
[3] M.A. Meyers, G. Subhash, B.K. Kad, L. Prasad, Mech. Mater. 17 (1994) 175–193.[4] Y. Me-Bar, D. Shechtman, Mater. Sci. Eng. 58 (1983) 181–188.[5] S.P. Timothy, I.M. Hutchings, Acta Metall. 33 (1985) 667–676.[6] Q. Xue, M. Meyers, V. Nesterenko, Acta Mater. 50 (2002) 575–596.[7] P. Longère, A. Dragon, Mech. Mater. Part B 80 (2015) 203–218.[8] D.K. Balch, J.G. O’Dwyer, G.R. Davis, C.M. Cady, G.T. Gray, D.C. Dunand, Mater.
Sci. Eng.: A 391 (2005) 408–417.[9] R. Tounsi, E. Markiewicz, G. Haugou, F. Chaari, B. Zouari, Int. J. Solids Struct. 80
(2016) 501–511.[10] M.A. Meyers, V.F. Nesterenko, J.C. LaSalvia, Q. Xue, Mater. Sci. Eng.: A 317
(2001) 204–225.[11] C. Daraio, V.F. Nesterenko, E.B. Herbold, S. Jin, Phys. Rev. Lett. 96 (2006)
058002.[12] S. Pauly, S. Gorantla, G. Wang, U. Kühn, J. Eckert, Nat. Mater. 9 (2010) 473–477.[13] R.O. Ritchie, Nat. Mater. 10 (2011) 817–822.[14] C. Zener, J.H. Hollomon, J. Appl. Phys. 15 (1944) 22–32.[15] M. Zhou, A. Rosakis, G. Ravichandran, J. Mech. Phys. Solids 44 (1996) 981–1006.[16] Y. Xu, J. Zhang, Y. Bai, M.A. Meyers, Metall. Mater. Trans. A 39 (2008) 811–843.[17] M.A. Porter, C. Daraio, I. Szelengowicz, E.B. Herbold, P. Kevrekidis, Physica D:
Nonlinear Phenom. 238 (2009) 666–676.[18] A. Leonard, C. Daraio, Phys. Rev. Lett. 108 (2012) 214301.[19] V.F. Nesterenko, C. Daraio, E.B. Herbold, S. Jin, Phys. Rev. Lett. 95 (2005)
158702.[20] Y. Starosvetsky, A.F. Vakakis, Phys. Rev. E 82 (2010) 026603.[21] G. Theocharis, N. Boechler, P.G. Kevrekidis, S. Job, M.A. Porter, C. Daraio, Phys.
Rev. E 82 (2010) 056604.[22] E. Pekarskaya, C. Kim, W. Johnson, J. Mater. Res. 16 (2001) 2513–2518.[23] V. Nesterenko, M. Meyers, H. Chen, Acta Mater. 44 (1996) 2017–2026.[24] K.A. Alshibli, S. Sture, J. Comput. Civ. Eng. 13 (1999) 103–109.[25] D. Grady, J. Appl. Phys. 53 (1982) 322–325.[26] D.E. Grady, M.E. Kipp, Int. J. Rock Mech. Min. Sci. Geomech. Abstr. (1980)
147–157.[27] C. Shih, M. Meyers, V. Nesterenko, Acta Mater. 46 (1998) 4037–4065.[28] C. Shih, V. Nesterenko, M. Meyers, J. Appl. Phys. 83 (1998) 4660–4671.[29] V.F. Nesterenko, P.-H. Chiu, C. Braithwaite, A. Collins, D.M. Williamson, K.L.
Olney, D. Benson, F. McKenzie, M.L. Elert, W.T. Buttler, AIP Conference Pro-ceedings-American Institute of Physics, 2012, p. 533.
[30] P. Forquin, F. Hild, A. Probabilistic, Damage model of the dynamic fragmen-tation process in brittle materials, in: A. Hassan, G. Erik van der (Eds.), Ad-vances in Applied Mechanics, Elsevier, Cambridge, MA, 2010, pp. 1–72.
[31] P. Perzyna, Int. J. Solids Struct. 22 (1986) 797–818.[32] L.J. Gibson, M.F. Ashby, Cellular Solids: Structure and Properties, Cambridge
University Press, London, UK, 1997.[33] L.J. Gibson, J. Biomech. 38 (2005) 377–399.[34] P. Fratzl, R. Weinkamer, Prog. Mater. Sci. 52 (2007) 1263–1334.[35] M. Borrega, L.J. Gibson, Mech. Mater. 84 (2015) 75–90.[36] R.H. Baughman, A.A. Zakhidov, W.A. de Heer, Science 297 (2002) 787–792.[37] J.L. Hedrick, K.R. Carter, J.W. Labadie, R.D. Miller, W. Volksen, C.J. Hawker, D.
Y. Yoon, T.P. Russell, J.E. McGrath, R.M. Briber, Nanoporous polyimides, in: H.R. Kricheldorf (Ed.), Progress in Polyimide Chemistry II, Springer Berlin Hei-delberg, Springer, Heidelberg, Germany, 1999, pp. 1–43.
[38] B.C. Tappan, S.A. Steiner, E.P. Luther, Angew. Chem. Int. Ed. 49 (2010)4544–4565.
[39] K. Nakanishi, Synthesis Concepts and Preparation of Silica Monoliths, Mono-lithic Silicas in Separation Science: Concepts, Syntheses, Characterization,Modeling and Applications, John Wiley & Sons, Somerset, NJ 2010, p. 11.
[40] M. Scheffler, P. Colombo, Cellular Ceramics: Structure, Manufacturing, Prop-erties and Applications, John Wiley & Sons, Somerset, NJ, 2006.
[41] R. Miyamoto, Y. Ando, C. Kurusu, Hz Bai, K. Nakanishi, M. Ippommatsu, J. Sep.Sci. 36 (2013) 1890–1896.
[42] R.D. Shoup, Controlled pore silica bodies gelled from silica sol-alkali silicatemixtures, in: M. Kerker (Ed.), Colloid and Interface Science, Academic Press,New York, 1976, pp. 63–69.
[43] C. Zhao, M. Wang, Y. Shi, J. Cao, Y. Qiao, Mater. Des. 90 (2016) 815–819.[44] M.A. Meyers, L.E. Murr, K.P. Staudhammer, Shock-Wave and High-Strain-Rate
Phenomena in Materials, CRC, CRC Press, Boca Raton, FL, 1992.[45] B. Song, W. Chen, Exp. Mech. 44 (2004) 622–627.[46] S. Nemat-Nasser, J.B. Isaacs, J.E. Starrett, Proc. R. Soc. Lond. Ser. A: Math. Phys.
Sci. 435 (1991) 371–391.[47] H. Kolsky, Stress Waves in Solids, Courier Corporation, North Chelmsford, MA,
1963.[48] C.C. Reyes-Aldasoro, Electron. Lett. 45 (2009) 454–456.[49] N. Otsu, Automatica 11 (1975) 23–27.[50] K. Nakanishi, J. Porous Mater. 4 (1997) 67–112.[51] Lawrence E. Kinsler, Austin R. Frey, Alan B. Coppens, James V. Sanders, Fun-
damentals of Acoustics, 4th ed., Wiley-VCH, 1999, p. 560.[52] B.A. Auld, Acoustic Fields and Waves in Solids, Рипол Классик, Krieger
Publ., Malabar, FL, 1973.[53] L.L. Beranek, J. Acoust. Soc. Am. 13 (1942) 248–260.

C. Zhao, Y. Qiao / Materials Science & Engineering A 676 (2016) 450–462462
[54] P.W. Bridgman, Dimensional Analysis, Yale University Press, New Haven, CT,1922.
[55] F.B. Surani, X. Kong, D.B. Panchal, Y. Qiao, Appl. Phys. Lett. 87 (2005) 163111.[56] B. Song, W. Chen, Exp. Mech. 46 (2006) 407–410.[57] K.A. Dannemann, J. Lankford, Mater. Sci. Eng.: A 293 (2000) 157–164.[58] P. Tan, S. Reid, J. Harrigan, Z. Zou, S. Li, J. Mech. Phys. Solids 53 (2005)
2174–2205.
[59] Y. Diao, T. Harada, A.S. Myerson, T. Alan Hatton, B.L. Trout, Nat. Mater. 10(2011) 867–871.
[60] T. Kawaguchi, J. Iura, N. Taneda, H. Hishikura, Y. Kokubu, J. Non-Cryst. Solids 82(1986) 50–56.
[61] C.J. Brinker, G.W. Scherer, Sol-Gel Science: The Physics and Chemistry of Sol-Gel Processing, Gulf Professional Publishing, Houston, TX, 1990.
[62] E.W. Washburn, Phys. Rev. 17 (1921) 273–283.