Materials Management Program 2017-18 Report to …...This report informs the Oregon Legislature...
33
State of Oregon Department of Environmental Quality Materials Management Program 2017-18 Report to the Legislature Submitted to: Oregon Legislative Assembly By: Materials Management Program June 2019 Materials Management Program 700 NE Multnomah St. Suite 600 Portland, OR 97232 Phone: 503-229-5696 800-452-4011 Fax: 503-229-6124 Contact: Shannon Davis www.oregon.gov/DEQ DEQ is a leader in restoring, maintaining and enhancing the quality of Oregon’s air, land and water.
Transcript of Materials Management Program 2017-18 Report to …...This report informs the Oregon Legislature...
State of Oregon Department of Environmental Quality
Materials Management Program 2017-18 Report to the Legislature Submitted to: Oregon Legislative Assembly By: Materials Management Program June 2019
Materials Management Program 700 NE Multnomah St.
Suite 600
Portland, OR 97232 Phone: 503-229-5696
800-452-4011
Fax: 503-229-6124 Contact: Shannon Davis
www.oregon.gov/DEQ
DEQ is a leader in restoring, maintaining and
enhancing the quality of
Oregon’s air, land and
water.

State of Oregon Department of Environmental Quality 1
This report prepared by:
Oregon Department of Environmental Quality
700 NE Multnomah Street, Suite 600
Portland, OR 97232
1-800-452-4011
www.oregon.gov/deq
Contact:
Shannon Davis
503-229-6832
DEQ can provide documents in an alternate format or in a language other than English upon request. Call
DEQ at 800-452-4011 or email [email protected].

State of Oregon Department of Environmental Quality 2
Table of Contents
Executive Summary ...................................................................................................................................... 3
1. Purpose and legal context ......................................................................................................................... 5
2. Introduction: The 2050 Vision .................................................................................................................. 6
3. Foundational research and policy work .................................................................................................... 7
3.1 Monitoring Oregon’s greenhouse gas emissions ................................................................................ 7
3.2 Studies of environmental footprinting and attributes .......................................................................... 9
4. Collaborations with communities and businesses ................................................................................... 11
4.1 Grants to local governments, nonprofits, and schools ...................................................................... 11
4.2 Business initiatives ............................................................................................................................ 12
Concrete and EPDs ............................................................................................................................. 12
5. Sustainable production and consumption ............................................................................................... 13
5.1 Preventing the wasting of food ......................................................................................................... 13
5.2 Reuse, repair and product lifespan extension .................................................................................... 14
5.3 Sustainable procurement ................................................................................................................... 16
5.4 Preventing Lead-based Paint Dispersion during Building Demolitions ........................................... 16
6. Waste recovery and disposal ................................................................................................................... 18
6.1 Household hazardous waste collection ............................................................................................. 18
6.2 Product stewardship for electronics waste (Oregon E-Cycles) and architectural paint .................... 19
Architectural paint stewardship .......................................................................................................... 19
Oregon E-Cycles ................................................................................................................................. 21
6.3 The Recycling Opportunity Act and Changes under Senate Bill 263 (2015) ................................... 22
A Disruption to the Recycling Market ................................................................................................ 22
Preparing for SB 263 compliance ....................................................................................................... 23
Improving Access to Recycling Services for Tenants throughout Oregon ......................................... 24
6.4 Permitting of solid waste facilities and complaint response ............................................................. 25
Municipal Disposal Facilities and Permits .......................................................................................... 25
Short-term Disposal Permits and Beneficial Use Determinations ...................................................... 26
Solid Waste Orphan Account .............................................................................................................. 26
Composting Facilities ......................................................................................................................... 26
Complaints response ........................................................................................................................... 27
6.5 Metro’s waste reduction program: compliance with state requirements ........................................... 28
6.6 Studies of recovery rates and waste composition ............................................................................. 29
Oregon’s Material Recovery and Waste Generation Rates ................................................................. 29
Waste Composition Study ................................................................................................................... 32

State of Oregon Department of Environmental Quality 3
Executive Summary The Materials Management Program at the Oregon Department of Environmental Quality works to
reduce the environmental and human health impacts of products and materials that Oregonians make and
use by promoting waste prevention, the sustainable production and use of materials, and proper disposal
of hazardous and other waste.
This report contains updates relating to the statewide solid waste management plan, product stewardship,
waste prevention, household hazardous waste, Metro’s waste reduction program, Oregon’s waste
generation and waste reduction, the permitting of solid waste disposal facilities and solid waste program
funding, compliance and enforcement of Materials Management violations, the operation of Oregon’s
system for electronics recycling, and the implementation of multitenant recycling throughout Oregon. The
report uses 2018 data, unless otherwise specified.
Materials Management’s work is guided by Materials Management in Oregon: 2050 Vision and
Framework for Action, available at https://www.oregon.gov/deq/FilterDocs/MManagementOR.pdf. The
2050 Vision was adopted by the Environmental Quality Commission in 2012 as an update to Oregon’s
solid waste management plan. It outlines an approach to waste management that emphasizes the
sustainable use of materials across all stages of their life cycle, from their design and production to their
use and final disposal. This approach includes strategies for waste prevention—such as by encouraging
reuse and repair to extend the useful life of a product—in addition to the more traditional strategies of
increasing rates of recycling, composting and energy recovery.
In 2017 and 2018, Materials Management
undertook projects and collaborations that
maintained this holistic approach to reducing the
environmental impacts of materials that
Oregonians use. These projects and
collaborations involve the promotion of food
waste prevention, sustainable government
procurement, reuse and repair, new measures of
environmental outcomes, toxics reduction and
cleaner production. At the same time, Materials
Management continued the vital work in solid
waste management – permitting, inspections,
and investigation of complaints – crucial to
ensuring the proper operation of disposal sites.
Examples of the program’s accomplishments in
2017 and 2018 include:
Collaborating with communities and
businesses to advance materials
management plans and projects, including
awarding over $670,000 in grants in 2017 and making $600,000 available in 2018 to local
governments, nonprofits and schools. Through financial and extensive technical assistance, DEQ also
helped two Oregon concrete producers develop product labels that measured and disclosed the
environmental impacts of their different concrete mixes – allowing concrete purchasers to select
lower-impact mixes for construction projects.
The materials life cycle
State of Oregon Department of Environmental Quality 4
Undertaking key initiatives to prevent the wasting of food. For instance, DEQ conducted a study on
the causes of food waste in partnership with Portland State University; made a food waste prevention
campaign available for local governments to use; and published reports on the environmental impacts
associated with the production and transport of various food products, such as tomatoes, wine, pork,
beer and coffee.
Advancing Oregon’s reuse and repair industry through micro-grants and pilot projects to spur job
creation and investment in local reuse and repair businesses. Working with Oregon Health Authority
and the Construction Contractor’s Board, DEQ also developed best practices for the demolition of
residences with lead-based paint.
Addressing household hazardous waste through funding events to collect household hazardous waste
in areas where local services are lacking; coordinating the cleanout of aging and unsafe chemical
stockpiles in 68 school chemistry labs; and supervising the conduct of PaintCare, a paint stewardship
organization that has collected over 5.4 million gallons of leftover paint from 2010 to 2018.
Administering Oregon’s product stewardship programs for collecting electronics waste, Oregon E-
Cycles, which collected 20 million pounds of recycled electronic devices in 2018.
Conducting foundational research projects, such as the Consumption-Based Emissions Inventory,
which analyzes global greenhouse gas emissions resulting from Oregon’s consumption and helps
measure Oregon’s global “carbon footprint.” DEQ also published a report on popular packaging
attributes that reviewed 18 years of data on the comparative environmental impacts of biobased,
recyclable, compostable and “made from recycled content” packaging materials and food service
ware.
Conducting extensive research and outreach to help local communities prepare for new multitenant
recycling opportunities to be made available in 2022.
Accounting for Oregon’s waste flows and recovery rate (the portion of discards recycled or otherwise
recovered) through the Material Recovery Survey and Waste Composition Study. In 2016,
Oregonians generated 5.3 million tons of waste and recovered 42.2 percent of the waste generated. In
2017, Oregonians generated 5.5 million tons of waste and recovered 42.1 percent.
These accomplishments took place amid an increase in Oregon’s waste generation and a disruption to the
international recycling markets that has challenged Oregon’s recycling infrastructure. Materials
Management is addressing these challenges by evaluating environmental impacts of materials across their
whole life cycle and pursuing strategies that can reduce the most significant impacts.

State of Oregon Department of Environmental Quality 5
1. Purpose and legal context This report informs the Oregon Legislature about the work of the Materials Management Program of the
Oregon Department of Environmental Quality, with a focus on work in 2017 and 2018.
It fulfills DEQ’s requirement under ORS 459A.015 and 459A.020 to report biennially to the Oregon
Legislature on Oregon’s Integrated Solid Waste Management Plan, updated in 2012 as
Materials Management in Oregon: 2050 Vision and Framework for Action. DEQ’s Solid Waste
Program is now called the Materials Management Program to more accurately reflect the focus on
addressing environmental impacts of materials across their full life cycle, not only at end of life.
This report also fulfills DEQ’s requirement under ORS 459A.340 to report on the operations of Oregon
E-Cycles, the statewide system for collection, transportation and recycling of covered electronic devices.
Additionally, it fulfills DEQ’s requirement to provide information in 2019 on the implementation of
multitenant recycling throughout Oregon, as described in ORS 459A.015 (Section 13c of Oregon Laws
2015, chapter 534).

State of Oregon Department of Environmental Quality 6
2. Introduction: The 2050 Vision Oregon law (ORS 459A.020) requires the state to have
an integrated solid waste management plan. In 2012, the
Environmental Quality Commission approved a major
update to that plan, Materials Management in Oregon:
2050 Vision and Framework for Action.
The 2050 Vision adopted a “materials management”
approach to waste management. This approach takes
into account environmental and human health impacts
across the full life cycle of materials, valuing strategic
choices that reduce the most significant impacts. As
detailed in the 2050 Vision, many environmental
impacts – such as resource depletion, pollution and
greenhouse gas emissions – stem not just from how
materials are disposed, but also how they are produced,
used and managed. DEQ estimates that 66.3 percent of
greenhouse gas emissions associated with Oregonians’
consumption of goods and services in 2015 occurred
before the point of purchase. Less than one percent of
emissions are associated with disposal – that is, when a
product is landfilled, recycled or otherwise disposed.1
The 2050 Vision contemplates an Oregon where
producers make products sustainably and every
option is a sustainable option; people live well and
consume sustainably; and materials have the most
useful life possible before and after discard. It
includes a list of about 50 actions as a framework
to achieve the Vision.
In 2017-18, Materials Management continued
work on many of these actions by supporting and
performing foundational research; fostering
collaborations and partnerships along issues such
as the wasting of food; reducing the environmental
impacts of construction through the use of green
building materials; and promoting reuse and
repair.
The 2050 Vision calls for an update every six years
to its framework for action. In 2019, DEQ will
begin reevaluating the framework to update
existing actions and identify new ones for
implementing the Vision.
1 Oregon Department of Environmental Quality, “Oregon’s Greenhouse Gas Emissions through 2015: An assessment of Oregon’s sector-based and consumption-based greenhouse gas emissions,” May 2018, https://www.oregon.gov/deq/FilterDocs/OregonGHGreport.pdf.
The materials life cycle
State of Oregon Department of Environmental Quality 7
3. Foundational research and policy work
Materials Management’s foundational research helps DEQ and others identify priorities for reducing the
environmental impacts of products and materials. In 2017-18, Materials Management conducted a major
update to its inventories of Oregon’s greenhouse gas emissions. Materials Management also published
numerous reports evaluating the environmental impacts of different foods and product packaging across
their whole life cycle.
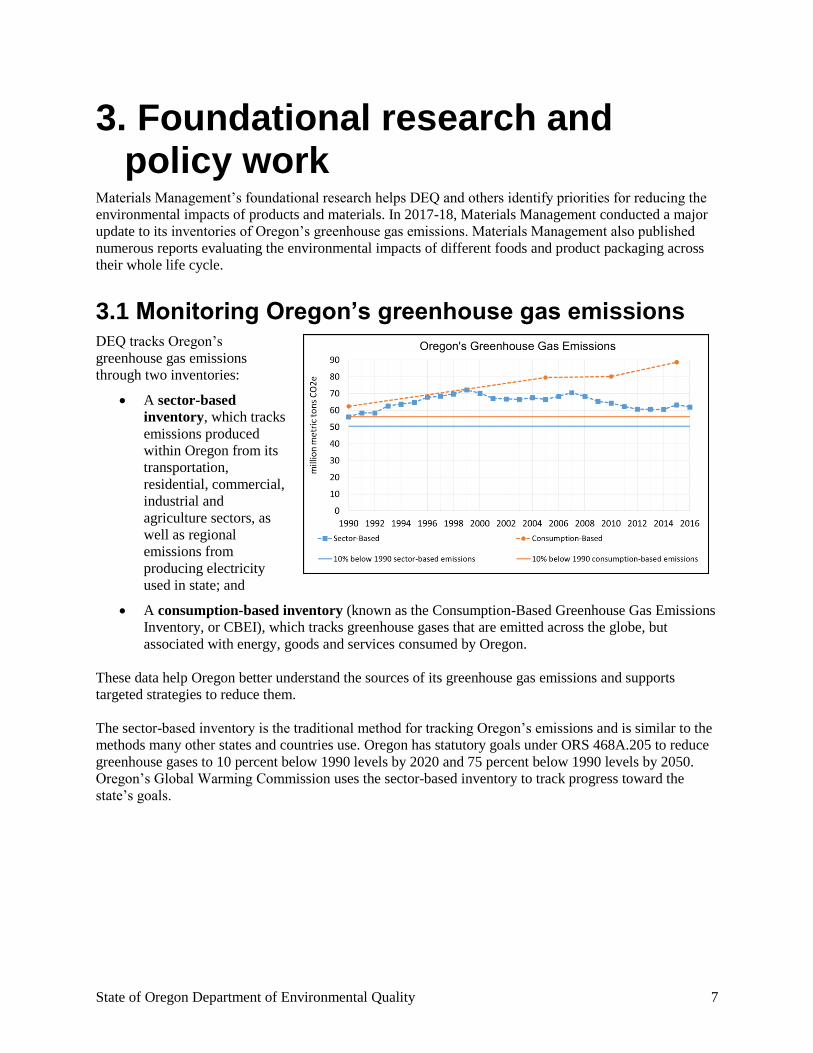
3.1 Monitoring Oregon’s greenhouse gas emissions DEQ tracks Oregon’s
greenhouse gas emissions
through two inventories:
A sector-based
inventory, which tracks
emissions produced
within Oregon from its
transportation,
residential, commercial,
industrial and
agriculture sectors, as
well as regional
emissions from
producing electricity
used in state; and
A consumption-based inventory (known as the Consumption-Based Greenhouse Gas Emissions
Inventory, or CBEI), which tracks greenhouse gases that are emitted across the globe, but
associated with energy, goods and services consumed by Oregon.
These data help Oregon better understand the sources of its greenhouse gas emissions and supports
targeted strategies to reduce them.
The sector-based inventory is the traditional method for tracking Oregon’s emissions and is similar to the
methods many other states and countries use. Oregon has statutory goals under ORS 468A.205 to reduce
greenhouse gases to 10 percent below 1990 levels by 2020 and 75 percent below 1990 levels by 2050.
Oregon’s Global Warming Commission uses the sector-based inventory to track progress toward the
state’s goals.
State of Oregon Department of Environmental Quality 8
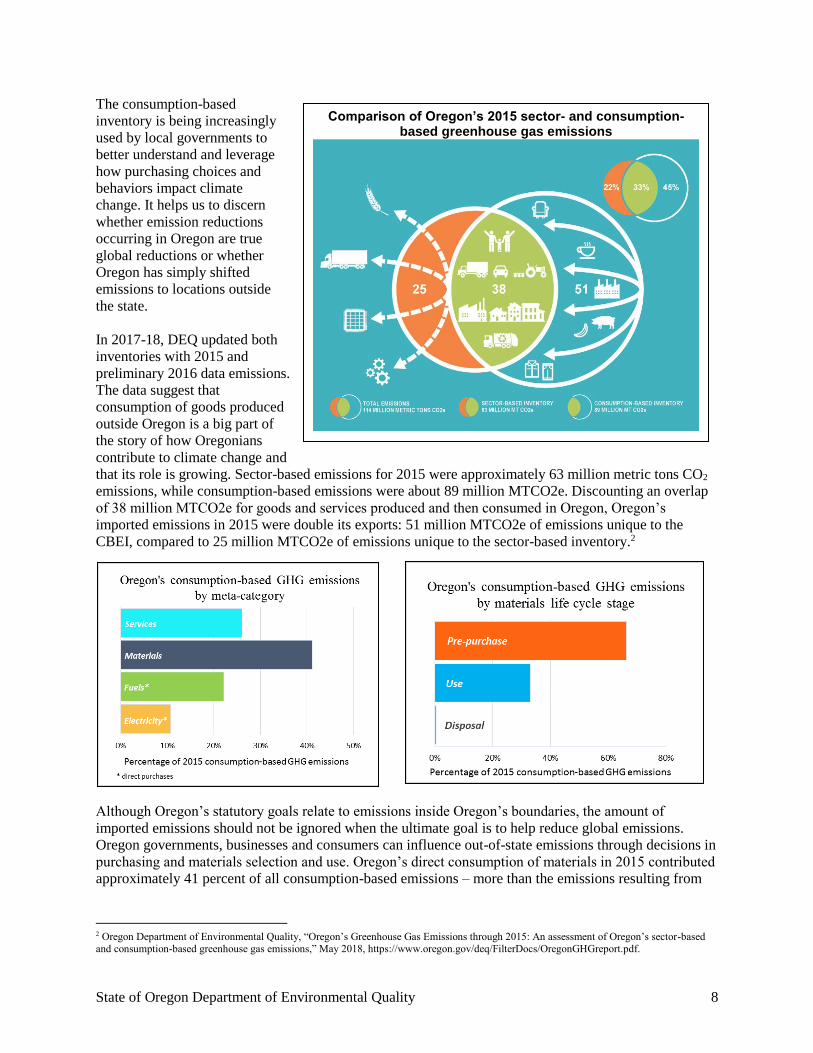
The consumption-based
inventory is being increasingly
used by local governments to
better understand and leverage
how purchasing choices and
behaviors impact climate
change. It helps us to discern
whether emission reductions
occurring in Oregon are true
global reductions or whether
Oregon has simply shifted
emissions to locations outside
the state.
In 2017-18, DEQ updated both
inventories with 2015 and
preliminary 2016 data emissions.
The data suggest that
consumption of goods produced
outside Oregon is a big part of
the story of how Oregonians
contribute to climate change and
that its role is growing. Sector-based emissions for 2015 were approximately 63 million metric tons CO2
emissions, while consumption-based emissions were about 89 million MTCO2e. Discounting an overlap
of 38 million MTCO2e for goods and services produced and then consumed in Oregon, Oregon’s
imported emissions in 2015 were double its exports: 51 million MTCO2e of emissions unique to the
CBEI, compared to 25 million MTCO2e of emissions unique to the sector-based inventory.2
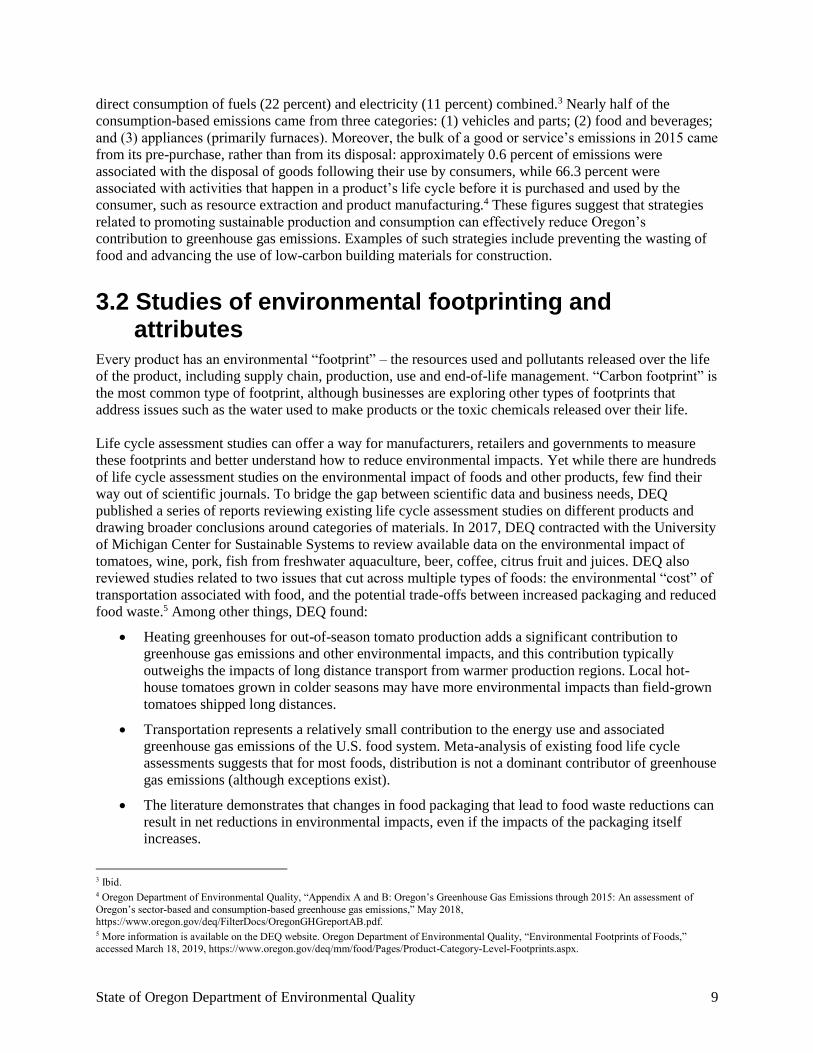
Although Oregon’s statutory goals relate to emissions inside Oregon’s boundaries, the amount of
imported emissions should not be ignored when the ultimate goal is to help reduce global emissions.
Oregon governments, businesses and consumers can influence out-of-state emissions through decisions in
purchasing and materials selection and use. Oregon’s direct consumption of materials in 2015 contributed
approximately 41 percent of all consumption-based emissions – more than the emissions resulting from
2 Oregon Department of Environmental Quality, “Oregon’s Greenhouse Gas Emissions through 2015: An assessment of Oregon’s sector-based and consumption-based greenhouse gas emissions,” May 2018, https://www.oregon.gov/deq/FilterDocs/OregonGHGreport.pdf.
Comparison of Oregon’s 2015 sector- and consumption- based greenhouse gas emissions
State of Oregon Department of Environmental Quality 9
direct consumption of fuels (22 percent) and electricity (11 percent) combined.3 Nearly half of the
consumption-based emissions came from three categories: (1) vehicles and parts; (2) food and beverages;
and (3) appliances (primarily furnaces). Moreover, the bulk of a good or service’s emissions in 2015 came
from its pre-purchase, rather than from its disposal: approximately 0.6 percent of emissions were
associated with the disposal of goods following their use by consumers, while 66.3 percent were
associated with activities that happen in a product’s life cycle before it is purchased and used by the
consumer, such as resource extraction and product manufacturing.4 These figures suggest that strategies
related to promoting sustainable production and consumption can effectively reduce Oregon’s
contribution to greenhouse gas emissions. Examples of such strategies include preventing the wasting of
food and advancing the use of low-carbon building materials for construction.
3.2 Studies of environmental footprinting and attributes
Every product has an environmental “footprint” – the resources used and pollutants released over the life
of the product, including supply chain, production, use and end-of-life management. “Carbon footprint” is
the most common type of footprint, although businesses are exploring other types of footprints that
address issues such as the water used to make products or the toxic chemicals released over their life.
Life cycle assessment studies can offer a way for manufacturers, retailers and governments to measure
these footprints and better understand how to reduce environmental impacts. Yet while there are hundreds
of life cycle assessment studies on the environmental impact of foods and other products, few find their
way out of scientific journals. To bridge the gap between scientific data and business needs, DEQ
published a series of reports reviewing existing life cycle assessment studies on different products and
drawing broader conclusions around categories of materials. In 2017, DEQ contracted with the University
of Michigan Center for Sustainable Systems to review available data on the environmental impact of
tomatoes, wine, pork, fish from freshwater aquaculture, beer, coffee, citrus fruit and juices. DEQ also
reviewed studies related to two issues that cut across multiple types of foods: the environmental “cost” of
transportation associated with food, and the potential trade-offs between increased packaging and reduced
food waste.5 Among other things, DEQ found:
Heating greenhouses for out-of-season tomato production adds a significant contribution to
greenhouse gas emissions and other environmental impacts, and this contribution typically
outweighs the impacts of long distance transport from warmer production regions. Local hot-
house tomatoes grown in colder seasons may have more environmental impacts than field-grown
tomatoes shipped long distances.
Transportation represents a relatively small contribution to the energy use and associated
greenhouse gas emissions of the U.S. food system. Meta-analysis of existing food life cycle
assessments suggests that for most foods, distribution is not a dominant contributor of greenhouse
gas emissions (although exceptions exist).
The literature demonstrates that changes in food packaging that lead to food waste reductions can
result in net reductions in environmental impacts, even if the impacts of the packaging itself
increases.
3 Ibid. 4 Oregon Department of Environmental Quality, “Appendix A and B: Oregon’s Greenhouse Gas Emissions through 2015: An assessment of
Oregon’s sector-based and consumption-based greenhouse gas emissions,” May 2018, https://www.oregon.gov/deq/FilterDocs/OregonGHGreportAB.pdf. 5 More information is available on the DEQ website. Oregon Department of Environmental Quality, “Environmental Footprints of Foods,” accessed March 18, 2019, https://www.oregon.gov/deq/mm/food/Pages/Product-Category-Level-Footprints.aspx.

State of Oregon Department of Environmental Quality 10
DEQ, the Washington Department of Ecology and the Oregon Sustainability Board also published four
case studies on businesses that used product environmental footprinting in business practice. One case
study focused on HP’s use of life cycle assessment to demonstrate the environmental benefits offered by
small batch digital printing. Another case study focused on Impossible Foods, Inc., a producer of plant-
based meat alternatives that uses life cycle assessment to evaluate the impacts and resource use along the
supply chain of its flagship product, communicate with customers, and help inform business decisions.
These case studies offer insight into the benefits the businesses gained with environmental footprinting,
the challenges faced, lessons learned and best practices.6
In 2018, DEQ published a review of the comparative environmental impacts of “eco” packaging materials
and service ware ascribed with such attributes as “biobased,” “recyclable,” “compostable” and “recycled
content.”7 This review encompassed 18 years of life cycle assessment research and tested the widespread
assumptions that packaging and service ware comprised of biobased, recycled content, recyclable, or
compostable materials would yield lower environmental impacts than other types of packaging. DEQ
found that these attributes did not reliably or consistently equate with lower environmental impacts –
something that was hinted at in DEQ’s prior work in life cycle assessments. For example, DEQ’s e-
commerce packaging assessment identified lightweight shipping bags – even if made from mixed
materials such as paper/plastic blends that were difficult to recycle and contained limited recycled
materials – often resulted in lower environmental burdens across their production, use, and disposal than
recyclable paperboard boxes.
DEQ is distributing the results of these reviews in presentations, informational sheets and other forms to
engage peers in other states, businesses, academia, and the food and packaging design community.
6 Oregon Department of Environmental Quality, “Product Environmental Footprint Case Studies,” accessed March 18, 2019, https://www.oregon.gov/deq/mm/production/Pages/Product-Case-Studies.aspx. 7 Additional information is available on the DEQ website. Oregon Department of Environmental Quality, “Popular Packaging Attributes,” accessed March 18, 2019, https://www.oregon.gov/deq/mm/production/Pages/Materials-Attributes.aspx.
State of Oregon Department of Environmental Quality 11
4. Collaborations with communities and businesses
4.1 Grants to local governments, nonprofits, and schools
Through its general grants program, Materials
Management helps recipients fight waste, build
capacity for reuse and repair, support responsible
recycling in rural communities, or otherwise
advance the 2050 Vision. Past recipients include
local governments, schools and nonprofits from
across the state. In 2017, Materials Management
awarded 20 grants totaling over $670,000, which
included $100,000 in funds provided by Metro for
edible food rescue projects in the Portland
metropolitan area. Grants supported projects related
to food waste reduction; food rescue and
redistribution; reuse and repair projects; school
programs; and community recycling and
composting projects. For example:
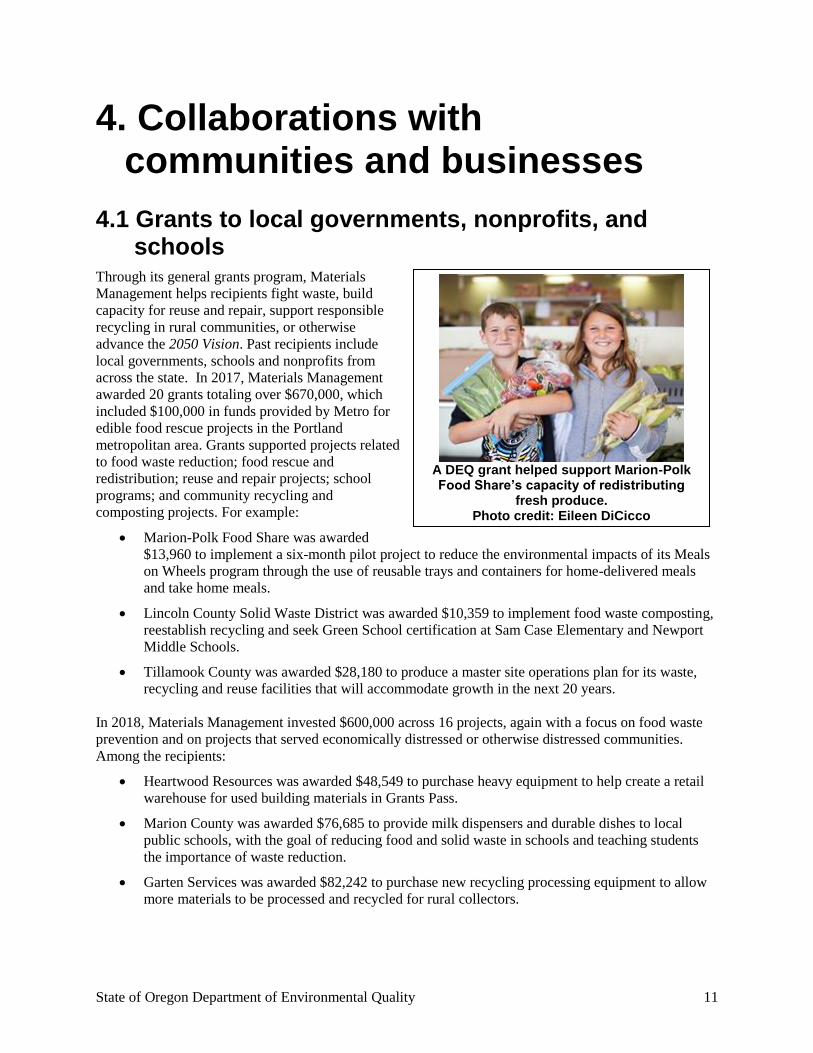
Marion-Polk Food Share was awarded
$13,960 to implement a six-month pilot project to reduce the environmental impacts of its Meals
on Wheels program through the use of reusable trays and containers for home-delivered meals
and take home meals.
Lincoln County Solid Waste District was awarded $10,359 to implement food waste composting,
reestablish recycling and seek Green School certification at Sam Case Elementary and Newport
Middle Schools.
Tillamook County was awarded $28,180 to produce a master site operations plan for its waste,
recycling and reuse facilities that will accommodate growth in the next 20 years.
In 2018, Materials Management invested $600,000 across 16 projects, again with a focus on food waste
prevention and on projects that served economically distressed or otherwise distressed communities.
Among the recipients:
Heartwood Resources was awarded $48,549 to purchase heavy equipment to help create a retail
warehouse for used building materials in Grants Pass.
Marion County was awarded $76,685 to provide milk dispensers and durable dishes to local
public schools, with the goal of reducing food and solid waste in schools and teaching students
the importance of waste reduction.
Garten Services was awarded $82,242 to purchase new recycling processing equipment to allow
more materials to be processed and recycled for rural collectors.
A DEQ grant helped support Marion-Polk Food Share’s capacity of redistributing
fresh produce. Photo credit: Eileen DiCicco

State of Oregon Department of Environmental Quality 12
4.2 Business initiatives Business and the environment are closely connected. In many cases, the majority of a product’s
environmental footprint often comes from business decisions – about a product’s design, the raw
materials required for production and the type of transportation used for delivery – made long before the
product reaches the end customer.8 The Business Initiatives program aims to help businesses reduce
environmental impacts along the whole life cycle of their products. It collaborates with businesses and
organizations to develop tools and resources for measuring impacts, provide technical support, build
capacity, conduct research and contribute to the broader conversation about environmental impacts.
Concrete and EPDs
One area for such collaboration lies in the
building and construction sector. Concrete
consumption in Oregon accounts for over
one percent of greenhouse gas emissions in
the state – a significant amount for an
individual material.9 Cement, a main
component of concrete that binds the rocks
together, carries a high carbon footprint for
its production, and contributes roughly 85
percent of the greenhouse gas impacts of
most concrete mixes. Overall, cement
production represents an estimated five to
seven percent of global emissions.10
Replacing cement with alternative
materials in a concrete mix can reduce the
carbon and energy impact by as much as
40 percent. Previously, the market lacked
standardized ways to measure and disclose
the environmental impacts of different
concrete mixes. That has begun to change with the help of green building certification programs such as
Leadership in Energy and Environmental Design. These programs provide “points” to products that
measure and disclose their environmental impacts on third-party verified product labels known as
Environmental Product Declarations.
DEQ is collaborating with the Oregon Concrete and Aggregate Producers Association to help Oregon
concrete producers create EPDs for their concrete mixes. Through this partnership, concrete producers in
Oregon gain free access to an online EPD tool, technical support from DEQ and reimbursements for the
verification of the EPD.11 With EPDs, purchasers of concrete can select low-impact mixes while
potentially contributing to public or private carbon reduction targets. In 2017, CalPortland became the
first concrete producer in Oregon to have registered EPDs for approximately 150 concrete mixes. In 2018,
Knife River published EPDs for four of its Oregon plants, covering 479 mixes. 8 For example, production and transportation accounts for 83 percent of the product footprint of an iPhone 6s. https://www.apple.com/environment/pdf/products/iphone/iPhone6s_PER_sept2015.pdf 9 Oregon Department of Environmental Quality, “Oregon’s Greenhouse Gas Emissions through 2015: An assessment of Oregon’s sector-based and consumption-based greenhouse gas emissions,” May 2018, https://www.oregon.gov/deq/FilterDocs/OregonGHGreport.pdf. 10 Emad Benhelal et al., “Global Strategies and Potentials to Curb CO2 Emissions in Cement Industry,” Journal of Cleaner Production 51 (July 15, 2013): 142–61, https://doi.org/10.1016/j.jclepro.2012.10.049. 11 More information is available on the OCAPA website. OCAPA, “Oregon Concrete EPDs,” accessed March 18, 2019, https://www.ocapa.net/oregon-concrete-epds.
Part of a flyer promoting DEQ’s collaboration to
concrete producers. Environmental Product Declarations for concrete mixes are similar to
nutrition facts labels on food. Both measure and
disclose information to the consumer.

State of Oregon Department of Environmental Quality 13
5. Sustainable production and consumption
5.1 Preventing the wasting of food Food is a significant material in terms of environmental impacts, and an estimated 25 to 40 percent of all
food produced or imported for consumption in the United States is never eaten. Both the 2050 Vision and
the Oregon Global Warming Commission’s Interim Roadmap to 202012 identify preventing food waste as
a priority for Oregon because of the environmental burdens associated with the food production,
distribution, refrigeration, preparation and final disposal of food. A significant amount of greenhouse gas
impacts associated with food comes from its production. The EPA’s Waste Reduction Model estimates
that potential greenhouse gas savings associated with preventing the wasting of one ton of food are
approximately 20 times larger than the savings associated with recycling that food through composting.13
In 2017, DEQ identified nine projects to pursue in the next five years to prevent the wasting of food.14
The first project, a five-part study on wasted food generation in Oregon, is nearly complete. Conducted in
partnership with Portland State University’s Community Environmental Services, this study included
qualitative interviews15 with Oregon residents that raised issues such as the aspirational natural of food
purchases; the roles that the source (e.g., grocery versus farmers markets) and available quantities of food
played in their waste; commonly discarded items; and the perception that composted food is not “wasted.”
The second part of the study used a statewide phone survey of 486 households in Oregon and more in-
depth studies using food diaries in 272 Oregon households as ways to assess what and how much food
Oregonians waste, and why.16 DEQ expects to complete and publish the remaining components of the
study in 2019. The study results will inform strategies for future outreach and business partnerships, and
establish a benchmark against which future progress will be evaluated.
As part of a project on messaging, DEQ developed a food waste prevention campaign that local
governments can use in their communities. This “Wasted Food Wasted Money” campaign contains flyers
and brief guides in English, Spanish, Vietnamese, and Russian that offer grocery stores, restaurants, and
other food service businesses tips on how to prevent wasted food. This campaign is gaining wider
distribution through a partnership with Metro regional government and the Oregon Restaurant and
Lodging Association, where it serves as the base material for the prevention component of ORLA’s
program to promote prevention, food donation and composting among its members. As part of the ORLA
partnership, DEQ also has co-sponsored workshops for commercial food service businesses that help
them develop roadmaps for reducing food waste. DEQ is also conducting a study to identify effective
messaging to reduce consumer food waste. This study will further support development of a statewide
campaign to promote prevention, help DEQ identify and disseminate best practices for preventing wasting
of food, and provide a basis for more effective policies and programs.
12 Oregon Global Warming Commission, “Interim Roadmap to 2020,” October 29, 2010, https://digital.osl.state.or.us/islandora/object/osl%3A6221/datastream/OBJ/view. 13 US EPA, “Organic Materials Chapters [Documentation for Greenhouse Gas Emission and Energy Factors Used in the Waste Reduction Model (WARM)],” February 2016, https://www.epa.gov/sites/production/files/2016-03/documents/warm_v14_organic_materials.pdf. 14 Oregon Department of Environmental Quality, “Oregon DEQ Strategic Plan for Preventing the Wasting of Food,” March 2017, https://www.oregon.gov/deq/FilterDocs/foodstrategic.pdf. 15 Oregon Department of Environmental Quality, “Oregon Wasted Food Study: Measurement, motivations and opportunities to waste less food,” May 26, 2017, https://www.oregon.gov/deq/FilterDocs/WastedFoodStudyTask1.pdf. 16 Oregon Department of Environmental Quality, “2017 Oregon Wasted Food Statewide Phone Survey,” October 11, 2017, revised May 28, 2018, https://www.oregon.gov/deq/FilterDocs/wastedfoodsurvey2017.pdf.
State of Oregon Department of Environmental Quality 14
DEQ is also playing a lead role in convening a regional coalition of interested states and cities to advance
food waste reduction. DEQ is doing this work through the Pacific Coast Collaborative. PCC is an
intergovernmental partnership aimed at fostering collaboration among its members and is comprised of
British Columbia, the states of Washington, Oregon and California, and the cities of Vancouver (BC),
Seattle, Portland, San Francisco, Oakland and Los Angeles. In spring 2017, DEQ hosted a summit for
PCC to discuss opportunities to work together on wasted food prevention and recovery research and
program implementation needs. At the Global Climate Action Summit in September 2018, the PPC
partners announced a commitment to a regional goal of halving food waste by 2030. This includes efforts
to prevent, rescue and recover wasted food. DEQ and other PCC partners are now reaching out to food
retailers and manufacturers to join in adopting a 50 percent reduction goal for 2030 and collaborate on
identifying effective, industry-wide actions to reduce wasted food. DEQ has separately adopted a goal of
reducing the generation of wasted edible food by 15 percent by 2025 and 40 percent by 2050 in Oregon.
5.2 Reuse, repair and product lifespan extension In 2017-18, DEQ conducted and supported
several projects to advance repair and reuse.
Many projects directly spurred job creation or
investment in the local repair and reuse industry.
Some, such as those related to deconstruction
and demolition of buildings, also helped promote
practices intended to reduce harm to human
health.
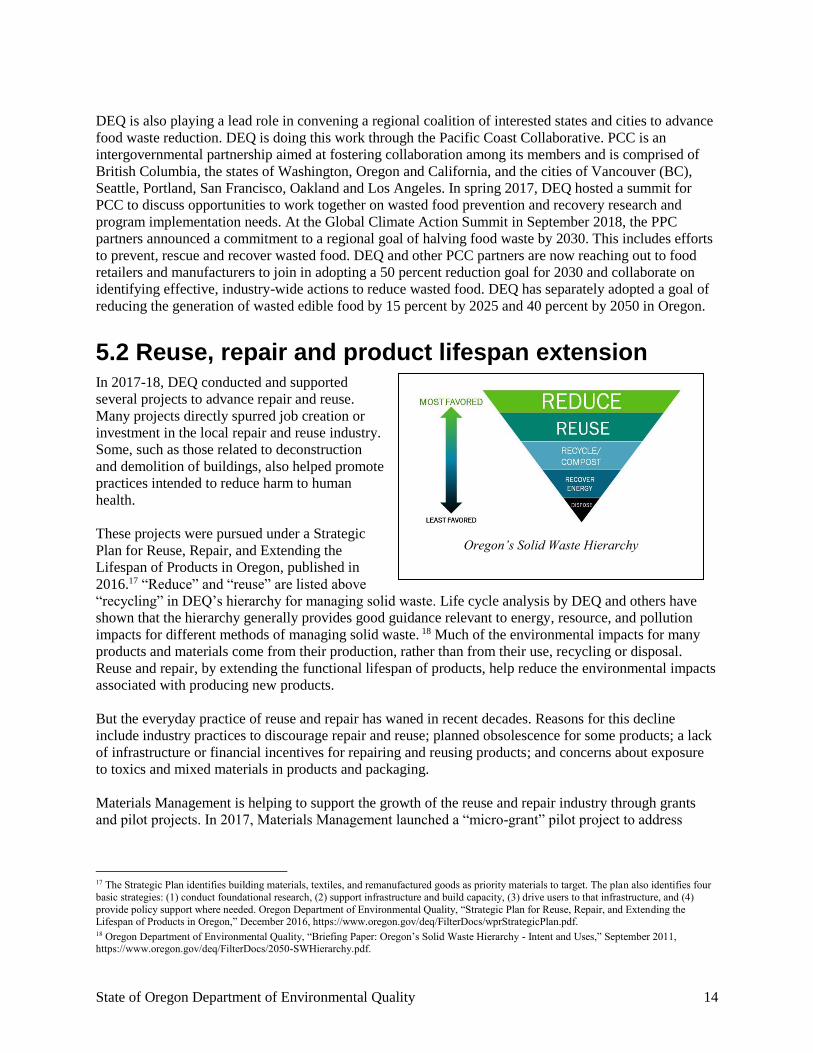
These projects were pursued under a Strategic
Plan for Reuse, Repair, and Extending the
Lifespan of Products in Oregon, published in
2016.17 “Reduce” and “reuse” are listed above
“recycling” in DEQ’s hierarchy for managing solid waste. Life cycle analysis by DEQ and others have
shown that the hierarchy generally provides good guidance relevant to energy, resource, and pollution
impacts for different methods of managing solid waste. 18 Much of the environmental impacts for many
products and materials come from their production, rather than from their use, recycling or disposal.
Reuse and repair, by extending the functional lifespan of products, help reduce the environmental impacts
associated with producing new products.
But the everyday practice of reuse and repair has waned in recent decades. Reasons for this decline
include industry practices to discourage repair and reuse; planned obsolescence for some products; a lack
of infrastructure or financial incentives for repairing and reusing products; and concerns about exposure
to toxics and mixed materials in products and packaging.
Materials Management is helping to support the growth of the reuse and repair industry through grants
and pilot projects. In 2017, Materials Management launched a “micro-grant” pilot project to address
17 The Strategic Plan identifies building materials, textiles, and remanufactured goods as priority materials to target. The plan also identifies four
basic strategies: (1) conduct foundational research, (2) support infrastructure and build capacity, (3) drive users to that infrastructure, and (4)
provide policy support where needed. Oregon Department of Environmental Quality, “Strategic Plan for Reuse, Repair, and Extending the Lifespan of Products in Oregon,” December 2016, https://www.oregon.gov/deq/FilterDocs/wprStrategicPlan.pdf. 18 Oregon Department of Environmental Quality, “Briefing Paper: Oregon’s Solid Waste Hierarchy - Intent and Uses,” September 2011, https://www.oregon.gov/deq/FilterDocs/2050-SWHierarchy.pdf.
Oregon’s Solid Waste Hierarchy
State of Oregon Department of Environmental Quality 15
workforce development needs of small reuse or
repair businesses in Oregon. Many of these
businesses have strong demand for their
services; often comprised of only one or two
staff members, however, they lack the time or
resources to train new staff. Materials
Management provided micro-grants of up to
$10,000 to cover the costs of training and capital
equipment that could result in increased long-
term capacity, new jobs and a better customer
experience. Grants were awarded in 2017 to:
1. The Renewal Workshop in Cascade
Locks, to invest in capital equipment
and train two new sewists to repair and
renew high-end clothing that has been
returned to stores;
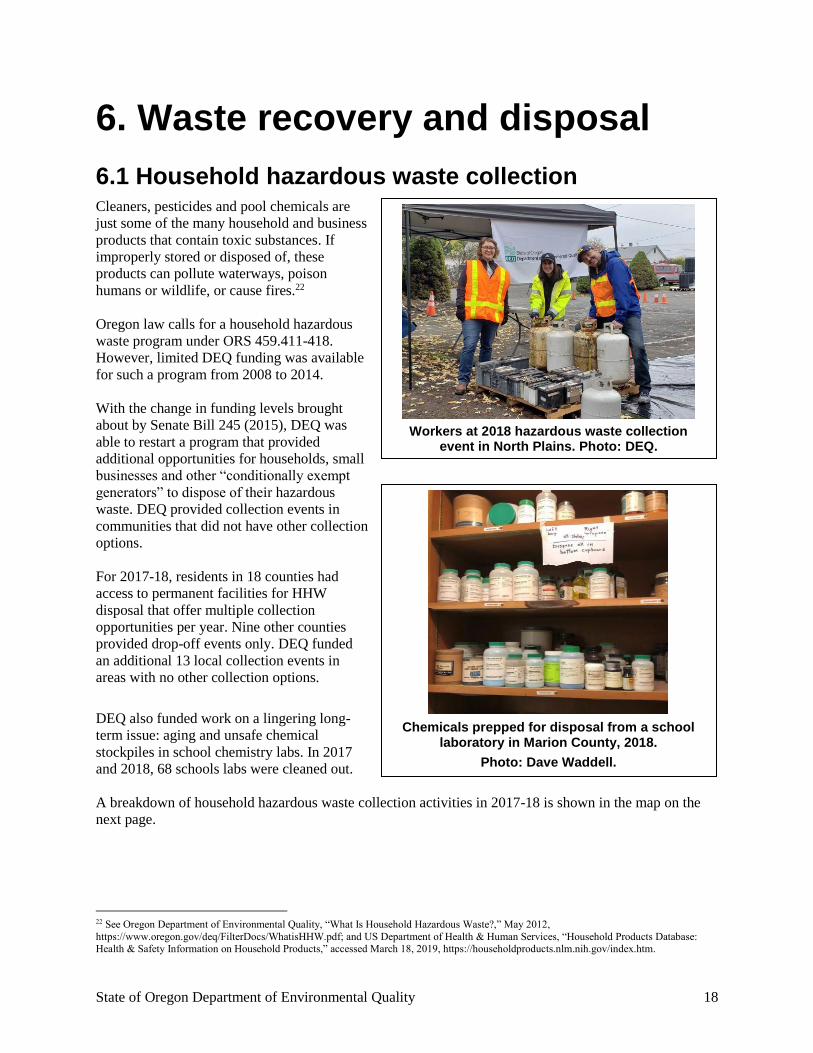
2. Salvage Works in Portland, to train and
hire a new employee to increase
capacity for reusing salvaged wood;
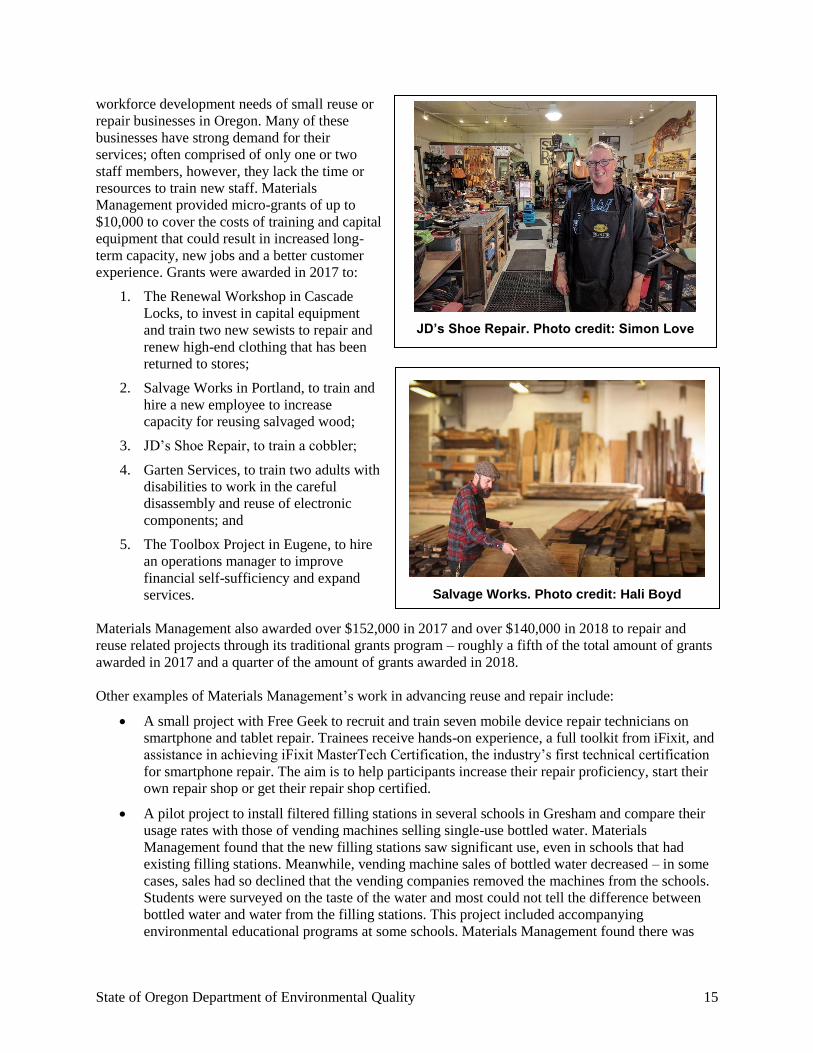
3. JD’s Shoe Repair, to train a cobbler;
4. Garten Services, to train two adults with
disabilities to work in the careful
disassembly and reuse of electronic
components; and
5. The Toolbox Project in Eugene, to hire
an operations manager to improve
financial self-sufficiency and expand
services.
Materials Management also awarded over $152,000 in 2017 and over $140,000 in 2018 to repair and
reuse related projects through its traditional grants program – roughly a fifth of the total amount of grants
awarded in 2017 and a quarter of the amount of grants awarded in 2018.
Other examples of Materials Management’s work in advancing reuse and repair include:
A small project with Free Geek to recruit and train seven mobile device repair technicians on
smartphone and tablet repair. Trainees receive hands-on experience, a full toolkit from iFixit, and
assistance in achieving iFixit MasterTech Certification, the industry’s first technical certification
for smartphone repair. The aim is to help participants increase their repair proficiency, start their
own repair shop or get their repair shop certified.
A pilot project to install filtered filling stations in several schools in Gresham and compare their
usage rates with those of vending machines selling single-use bottled water. Materials
Management found that the new filling stations saw significant use, even in schools that had
existing filling stations. Meanwhile, vending machine sales of bottled water decreased – in some
cases, sales had so declined that the vending companies removed the machines from the schools.
Students were surveyed on the taste of the water and most could not tell the difference between
bottled water and water from the filling stations. This project included accompanying
environmental educational programs at some schools. Materials Management found there was
Salvage Works. Photo credit: Hali Boyd
JD’s Shoe Repair. Photo credit: Simon Love

State of Oregon Department of Environmental Quality 16
little difference in filler usage from the schools that received education compared with those that
didn’t. This suggests that the presence of the fillers was enough to encourage their use.
The completion of a workforce development project, begun in 2015, to grow the Portland area’s
building deconstruction industry. Deconstruction is the systematic dismantling of a structure that
prioritizes salvage of materials for reuse. It is a gentler alternative to mechanical demolition,
where heavy machinery is used to take down a structure quickly, leaving little material available
for salvage. An ordinance passed in Portland in 2016 required projects seeking a demolition
permit of a house or duplex to fully deconstruct the structure if it was built in 1916 or earlier, or if
it was a designated historic resource. While the ordinance would create an instant supply of work
and materials, the city had concerns about the potential high price of deconstruction and the
ability of existing firms to meet the workload. DEQ helped the city address these concerns in
three ways, offering grants to assist with deconstruction projects in 2015, supporting the first
training for contractors in July 2016, and helping to fund on-the-ground worker training to build
the workforce in March 2017. Prior to the ordinance’s adoption, there were three firms in
Portland that solely focused on deconstruction, with no special certification requirements for
these firms.19 As of December 2018, there are 12 Certified Deconstruction Contractors.20
5.3 Sustainable procurement DEQ is also collaborating with other departments in Oregon and the nation to promote sustainable
procurement. The goal of sustainable procurement is to incorporate criteria related to environmental,
social and economic sustainability into government procurements. As part of this effort, DEQ staff
participated as an Oregon representative in a multi-state team to develop a national price agreement for
Facilities, Maintenance, Repair and Operations. In this capacity, DEQ provided technical support in
defining product sustainability criteria and evaluating vendor applications. DEQ also provided technical
support for the separate development of Oregon’s state price agreement for Facilities, Maintenance,
Repair and Operations, with a focus on including additional product sustainability criteria. These price
agreements provide access for both local and state governments to products with lower environmental
impacts.
5.4 Preventing Lead-based Paint Dispersion during Building Demolitions
In addition to the projects described above, DEQ is providing technical support for a project led by the
Oregon Health Authority to address lead-paint dispersion during building demolitions.
Older housing with lead-based paint is known to be a major source of exposure to lead in both adults and
children in Oregon. Despite the residential use of lead-based paint being banned in 1978, many homes
still contain it, providing a pathway (through paint chips and dust) to exposure. Regulations exist to limit
lead exposure during renovation, repair and repainting of residences with lead-based paint present, yet no
regulations exist for controlling lead dust from demolitions. Oregon Senate Bill 871, which was passed in
the 2017 legislative session, aims to close the regulatory gap by allowing local permitting authorities to
adopt an ordinance for controlling lead dust from demolitions that includes:
a. A permit to demolish;
19 City of Portland Bureau of Planning and Sustainability, “Portland’s Deconstruction Program 12-month Status Report,” March 12, 2018, https://www.portlandoregon.gov/bps/article/679905. 20 City of Portland Bureau of Planning and Sustainability, “List of Certified Deconstruction Contractors,” accessed April 15, 2019, https://www.portlandoregon.gov/bps/article/595154.

State of Oregon Department of Environmental Quality 17
b. A lead-based paint certification for contractors performing demolitions; and
c. A set of best practices chosen from the list developed by the Oregon Health Authority, DEQ, and
the Construction Contractor’s Board.
DEQ worked with OHA and CCB to develop Best Practices for the Demolition of Residences with Lead-
Based Paint, which was published on January 1, 2018.21 Since the publication, the City of Portland has
adopted an extensive residential demolition ordinance that implements many of the practices
recommended in this document. Overall, the publication of best practices provides an important resource
for cities wanting to limit the dispersion of lead-paint dust during residential building demolitions. DEQ
will continue to support the update and implementation of these best practices.
21 Oregon Health Authority, “Best Practices for the Demolition of Residences with Lead-Based Paint,” January 1, 2018,
https://www.oregon.gov/oha/PH/HEALTHYENVIRONMENTS/HEALTHYNEIGHBORHOODS/LEADPOISONING/Documents/Best-Practices-Demolition-of-Residences.pdf.
State of Oregon Department of Environmental Quality 18
6. Waste recovery and disposal
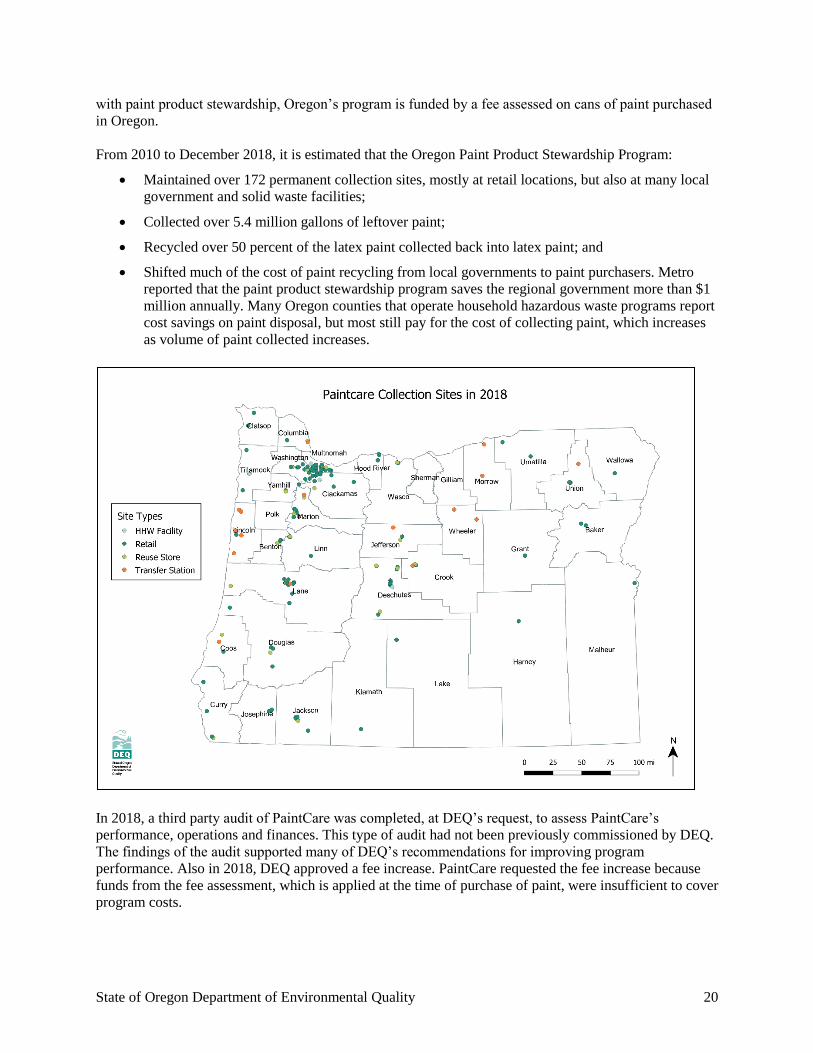
6.1 Household hazardous waste collection Cleaners, pesticides and pool chemicals are
just some of the many household and business
products that contain toxic substances. If
improperly stored or disposed of, these
products can pollute waterways, poison
humans or wildlife, or cause fires.22
Oregon law calls for a household hazardous
waste program under ORS 459.411-418.
However, limited DEQ funding was available
for such a program from 2008 to 2014.
With the change in funding levels brought
about by Senate Bill 245 (2015), DEQ was
able to restart a program that provided
additional opportunities for households, small
businesses and other “conditionally exempt
generators” to dispose of their hazardous
waste. DEQ provided collection events in
communities that did not have other collection
options.
For 2017-18, residents in 18 counties had
access to permanent facilities for HHW
disposal that offer multiple collection
opportunities per year. Nine other counties
provided drop-off events only. DEQ funded
an additional 13 local collection events in
areas with no other collection options.
DEQ also funded work on a lingering long-
term issue: aging and unsafe chemical
stockpiles in school chemistry labs. In 2017
and 2018, 68 schools labs were cleaned out.
A breakdown of household hazardous waste collection activities in 2017-18 is shown in the map on the
next page.
22 See Oregon Department of Environmental Quality, “What Is Household Hazardous Waste?,” May 2012,
https://www.oregon.gov/deq/FilterDocs/WhatisHHW.pdf; and US Department of Health & Human Services, “Household Products Database: Health & Safety Information on Household Products,” accessed March 18, 2019, https://householdproducts.nlm.nih.gov/index.htm.
Workers at 2018 hazardous waste collection
event in North Plains. Photo: DEQ.
Chemicals prepped for disposal from a school
laboratory in Marion County, 2018.
Photo: Dave Waddell.

State of Oregon Department of Environmental Quality 19
6.2 Product stewardship for electronics waste (Oregon E-Cycles) and architectural paint
Oregon law has special requirements for two materials common in the waste stream: architectural paint
and electronics waste. They are the subject of product stewardship requirements.
Product stewardship is an approach to environmental management in which those who design,
manufacture, sell and use consumer products take responsibility for reducing negative impacts to the
economy, environment, public health and worker safety. For manufacturers, this can include assuring
convenient collection of their products and recycling their share of returned products. For retailers and
consumers, this can mean taking an active role in recycling or disposing of a product in a proper way.
Architectural paint stewardship
Architectural finishes such as paints, varnishes and stains can be a large component of materials delivered
to household hazardous waste collection programs. When stored or disposed of improperly, these
materials can be hazardous to human health, wildlife and water quality. Managing waste paints is also
expensive for local governments. These substances are the focus of ORS 459A.820-855, which require
manufacturers of latex and oil-based architectural paints, stains and coatings to undertake responsibility
for reducing the generation of these materials, promote reuse of these materials and provide complete
end-of-life management for them, including recycling, energy recovery and disposal.
PaintCare, an industry-run product stewardship organization, implements this recovery program in
Oregon on behalf of architectural paint manufacturers under a plan approved by DEQ. As in other states
State of Oregon Department of Environmental Quality 20
with paint product stewardship, Oregon’s program is funded by a fee assessed on cans of paint purchased
in Oregon.
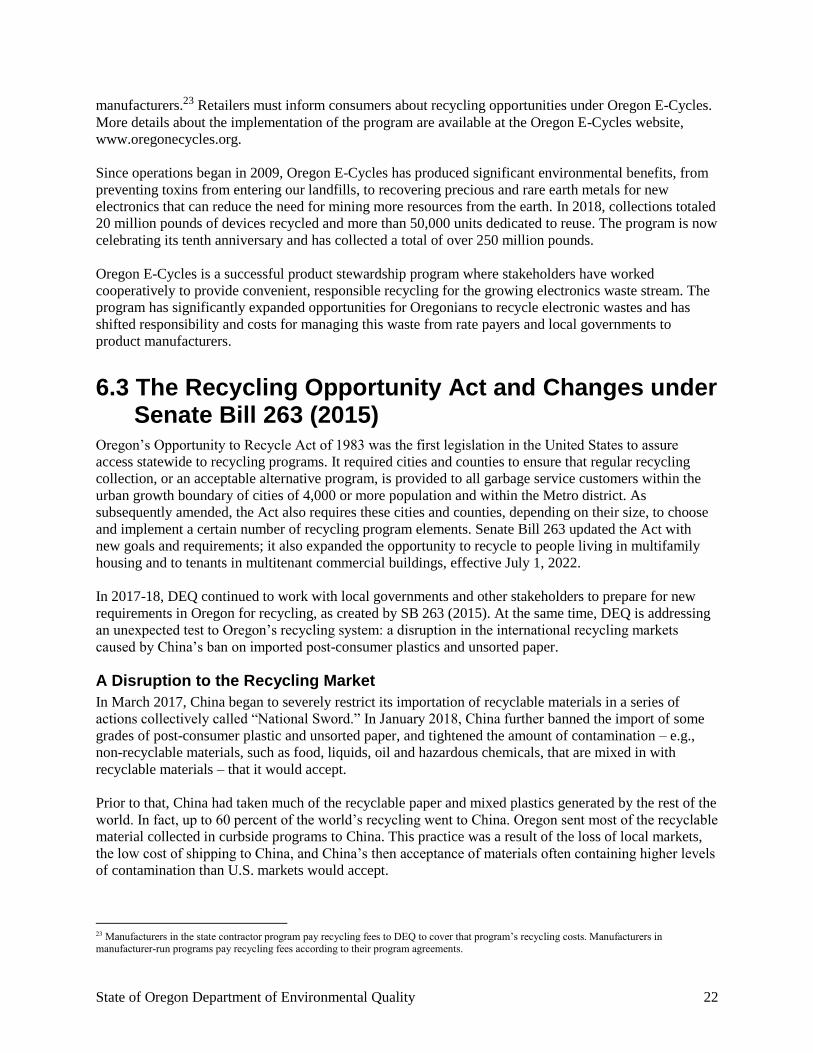
From 2010 to December 2018, it is estimated that the Oregon Paint Product Stewardship Program:
Maintained over 172 permanent collection sites, mostly at retail locations, but also at many local
government and solid waste facilities;
Collected over 5.4 million gallons of leftover paint;
Recycled over 50 percent of the latex paint collected back into latex paint; and
Shifted much of the cost of paint recycling from local governments to paint purchasers. Metro
reported that the paint product stewardship program saves the regional government more than $1
million annually. Many Oregon counties that operate household hazardous waste programs report
cost savings on paint disposal, but most still pay for the cost of collecting paint, which increases
as volume of paint collected increases.
In 2018, a third party audit of PaintCare was completed, at DEQ’s request, to assess PaintCare’s
performance, operations and finances. This type of audit had not been previously commissioned by DEQ.
The findings of the audit supported many of DEQ’s recommendations for improving program
performance. Also in 2018, DEQ approved a fee increase. PaintCare requested the fee increase because
funds from the fee assessment, which is applied at the time of purchase of paint, were insufficient to cover
program costs.

State of Oregon Department of Environmental Quality 21
PaintCare and DEQ are working on an updated program plan for 2019-2022, which is required by law,
and was due by PaintCare on January 1, 2018. PaintCare continues to operate under the existing plan until
the updated plan is approved by DEQ.
Oregon E-Cycles
Oregon E-Cycles is a statewide program, financed by manufacturers, that provides responsible recycling
for televisions, computers, monitors, printers, keyboards and mice. Anyone bringing seven or fewer items
at a time may recycle their electronics at no charge at participating collection sites. Households, small
businesses and small nonprofits may recycle more than seven at a time.
Electronics recycling is important because electronics contain hazardous substances such as lead,
cadmium and mercury that can harm our health and environment. Electronics also contain valuable
materials such as copper, gold and aluminum that can be recycled and used in new products. Recycling
keeps toxics out of our landfills and incinerators and conserves natural resources.
The Oregon E-Cycles program was created in 2007 by Oregon’s Electronics Recycling Law. In its current
form, the law mandates a minimum level of collection service in each county, with at least one site for
every city with a population of 10,000 or more. In 2018, there were 246 collection sites, including public
and private transfer stations, landfills, recycling and refurbishment centers, thrift stores and retail
locations. DEQ’s Oregon E-Cycles webpage provides a search page and a hotline number for locating
collection sites and services at https://www.oregon.gov/DEQ/ecycles/Pages/Consumers.aspx.
Under the law, manufacturers whose devices are sold in or into Oregon must register their brands with
DEQ and join either a state-contracted recycling program or a manufacturer-run recycling program. Each
recycling program operates under a plan approved by DEQ and is funded by its participating
State of Oregon Department of Environmental Quality 22
manufacturers.23 Retailers must inform consumers about recycling opportunities under Oregon E-Cycles.
More details about the implementation of the program are available at the Oregon E-Cycles website,
www.oregonecycles.org.
Since operations began in 2009, Oregon E-Cycles has produced significant environmental benefits, from
preventing toxins from entering our landfills, to recovering precious and rare earth metals for new
electronics that can reduce the need for mining more resources from the earth. In 2018, collections totaled
20 million pounds of devices recycled and more than 50,000 units dedicated to reuse. The program is now
celebrating its tenth anniversary and has collected a total of over 250 million pounds.
Oregon E-Cycles is a successful product stewardship program where stakeholders have worked
cooperatively to provide convenient, responsible recycling for the growing electronics waste stream. The
program has significantly expanded opportunities for Oregonians to recycle electronic wastes and has
shifted responsibility and costs for managing this waste from rate payers and local governments to
product manufacturers.
6.3 The Recycling Opportunity Act and Changes under Senate Bill 263 (2015)
Oregon’s Opportunity to Recycle Act of 1983 was the first legislation in the United States to assure
access statewide to recycling programs. It required cities and counties to ensure that regular recycling
collection, or an acceptable alternative program, is provided to all garbage service customers within the
urban growth boundary of cities of 4,000 or more population and within the Metro district. As
subsequently amended, the Act also requires these cities and counties, depending on their size, to choose
and implement a certain number of recycling program elements. Senate Bill 263 updated the Act with
new goals and requirements; it also expanded the opportunity to recycle to people living in multifamily
housing and to tenants in multitenant commercial buildings, effective July 1, 2022.
In 2017-18, DEQ continued to work with local governments and other stakeholders to prepare for new
requirements in Oregon for recycling, as created by SB 263 (2015). At the same time, DEQ is addressing
an unexpected test to Oregon’s recycling system: a disruption in the international recycling markets
caused by China’s ban on imported post-consumer plastics and unsorted paper.
A Disruption to the Recycling Market
In March 2017, China began to severely restrict its importation of recyclable materials in a series of
actions collectively called “National Sword.” In January 2018, China further banned the import of some
grades of post-consumer plastic and unsorted paper, and tightened the amount of contamination – e.g.,
non-recyclable materials, such as food, liquids, oil and hazardous chemicals, that are mixed in with
recyclable materials – that it would accept.
Prior to that, China had taken much of the recyclable paper and mixed plastics generated by the rest of the
world. In fact, up to 60 percent of the world’s recycling went to China. Oregon sent most of the recyclable
material collected in curbside programs to China. This practice was a result of the loss of local markets,
the low cost of shipping to China, and China’s then acceptance of materials often containing higher levels
of contamination than U.S. markets would accept.
23 Manufacturers in the state contractor program pay recycling fees to DEQ to cover that program’s recycling costs. Manufacturers in manufacturer-run programs pay recycling fees according to their program agreements.

State of Oregon Department of Environmental Quality 23
To meet China’s new contamination standards, Oregon processors added more workers, slowed down
their sort lines, and made other sorting improvements to remove more contaminants. Despite these efforts,
meeting China’s stringent contamination standards became infeasible for Oregon recycling processors,
and selling materials to China was no longer a viable solution. Alternate markets in Southeast Asia, India
and elsewhere have been identified, but are insufficient to absorb the loss of China’s markets.
The increase in global competition for the remaining and emerging recycling markets and the cost of
producing cleaner materials to compete for those markets have strained Oregon’s recycling programs.
Some communities in Oregon have suspended the collection of some materials for recycling, such as
plastics. Others have maintained services with rate increases. In a few cases, as a last resort, materials
collected for recycling have been disposed as garbage. (This practice is legal when the cost to recycle
exceeds the cost to landfill.) From September 1, 2017 to January 31, 2019, 15,388 tons, or approximately
two percent of all materials collected for recycling, have been sent to landfills.24 DEQ is working closely
with local governments, collectors, processors and industry representatives to continue recycling as much
as possible in Oregon and to explore long-term strategies to make Oregon’s recycling system more
resilient.
Preparing for SB 263 compliance
The disruption exposed weaknesses in Oregon’s recycling system and the worldwide market. Some of the
recovery goals set forth by SB 263 may now be more difficult to achieve. However, many of SB 263’s
requirements – for instance, the education and promotion program addressing contamination – also offer
opportunities to make Oregon’s recycling system more resilient and effective. The disruption also
underlines the importance of promoting the prevention of waste generation, and why reduce and reuse are
prioritized above recycling in DEQ’s solid waste hierarchy. DEQ is planning and undertaking various
projects related to SB 263 compliance with this in mind. Among them:
The new laws require certain local governments to implement three to five waste prevention and
reuse program elements. In 2017, DEQ developed two campaigns that local governments can use
for this requirement: “Wasted Food Wasted Money,” a campaign for food service businesses on
preventing food waste, and “Make Every Thread Count,” a campaign for consumers on how to be
more thoughtful about clothing purchases and to extend the useful life of their clothing.25 These
multilingual campaigns include toolkits that allow local governments to use the campaigns as-is
or to customize campaigns to fit their communities.
Senate Bill 263 sets a goal of 25 percent food waste recovery by 2020. DEQ will conduct a
statewide survey of the recovery rate for food waste in 2020, and, if the recovery rate is below 25
percent, include an evaluation of options to improve recovery, along with recommendations for
meeting or modifying the recovery goal for food waste. As described in more detail in the
“Sustainable production and consumption” section of this Report, DEQ is doing significant work
in promoting the prevention of food waste and regards strategies to prevent the wasting of food as
a priority, even if prevention is not counted in the recovery rate (which only tracks food once it
has been disposed).
DEQ plans to research recycling contamination, and model contamination-sampling methods that
local governments can choose to implement.
DEQ is also planning future projects related to carpet waste and plastic waste. Both have recovery
rate goals under SB 263. China’s current ban has complicated the picture, particularly for plastics,
24 Oregon Department of Environmental Quality, “Disposal Occurrences,” March 4, 2019, https://www.oregon.gov/deq/FilterDocs/mm-disposalconcurr.pdf 25 These campaigns can be accessed at https://www.oregon.gov/deq/mm/wpcampaigns/Pages/Wasted-Food-Wasted-Money.aspx and https://www.oregon.gov/deq/mm/wpcampaigns/Pages/textiles.aspx, respectively.

State of Oregon Department of Environmental Quality 24
as it has removed the largest market for recyclable materials at present. DEQ intends to survey
the recovery rates for plastic waste and carpet waste in 2020 and 2025, respectively. DEQ will
also conduct a broader review of options available for promoting the sustainable production and
consumption of these materials.
Improving Access to Recycling Services for Tenants throughout Oregon
Oregon’s strong recycling tradition is built on the idea that everyone should have the opportunity to
recycle. However, many people who live in multifamily communities or work in multitenant commercial
properties have inconsistent, inadequate access to recycling collection services.
To support improvements to multitenant recycling services and reduce contamination, DEQ has been
leading an ongoing, collaborative effort with involvement from many stakeholders. This work will help
communities implement the expanded Opportunity to Recycle Act that will explicitly include tenants—
effective July 1, 2022 and in cities over 4,000 people, cities in the Metro Service District and associated
urban growth boundaries.
To date, DEQ has undertaken the following efforts:
Conducted research on the current state of multitenant recycling in Oregon. Research findings can
be viewed on the DEQ website at https://www.oregon.gov/deq/recycling/Pages/Multi-Tenant-
Stakeholder-Resources.aspx.
Facilitated a stakeholder workgroup to develop a draft plan for how DEQ and other parties can
support recycling and reduce contamination at multitenant properties.
Collected feedback from stakeholders on the draft plan, through online comments and four public
meetings across the state.
Analyzed the cost of implementing a range of actions from the draft plan.
The stakeholder involvement and public outreach across the state significantly shifted DEQ’s approach to
this project. DEQ learned a great deal about the practical implications of the draft plan, and as a result,
will be revising it to create a simplified, more cost effective path forward. DEQ staff are now working on
that revision and will circulate it with stakeholders before proceeding with implementation.
Following an update of the draft work plan, DEQ plans to complete the following activities before July
2022:
Create a toolkit of templates, best practices, model language and other resources for
communities to use in their multitenant recycling programs.
Consider developing potential baseline rules to support successful, cost effective
implementation of state statute.
Consider the use of other resources, such as technical assistance or grants to help local
communities implement multitenant recycling.
Conduct outreach and educate communities around the state about how to reduce contamination
in recycling, access supporting tools from DEQ and meet new statutory requirements.

State of Oregon Department of Environmental Quality 25
6.4 Permitting of solid waste facilities and complaint response
To ensure the continued proper operation of these landfills and other disposal facilities, Materials
Management staff does substantial work in advising, overseeing and managing recovery, recycling and
disposal of waste. They permit and inspect solid waste facilities, including municipal, construction and
demolition and industrial waste landfills; waste tire disposal sites; transfer stations; and material recovery,
solid waste treatment, conversion technology and anaerobic digester and other composting facilities. They
provide technical assistance to counties and cities for recovery, recycling, management and disposal of
waste. They respond to complaints, ensure compliance, and help educate the public on waste prevention,
waste recovery and waste disposal.
Municipal Disposal Facilities and Permits
Materials Management currently oversees approximately 321 disposal site permits26 and 15 tire carrier
permits statewide. The numbers of permits in each major category appear in the table below.
Municipal Industrial Total
Open landfills 31 18 49
Closed landfills 36 24 60
Transfer stations & material recovery facilities 141 3 144
Treatment facilities 1 4 5
Incineration/Energy Recovery 1 1
Anaerobic Digester Composting Facility Permit 4 4
Aerobic Composting Facility Permit 14 14
Aerobic Composting Facility Registration 41 41
Conversion Technology Facility Permit 1 1
Sludge Lagoons & Transfer 2 2
Tire permits (carrier, storage, and combined
storage and carrier) 15 15
Many Oregon landfills were closed in the past three decades and continue to be permitted to make sure
that in closure they do not contaminate surface or ground water, create harmful landfill gases, or cause
other environmental problems over time.
DEQ inspects active disposal sites annually or biennially. Facilities also monitor and report to DEQ. DEQ
inspects closed landfills every two or three years to verify that post-closure care (gas and groundwater
monitoring) and maintenance of closed landfills are being carried out as required.
A list of active permitted facilities (including municipal solid waste disposal landfills, transfer stations,
and compost, material recovery, waste tire and household hazardous waste facilities) is available at
https://www.deq.state.or.us/lq/sw/disposal/permittedfacilities.htm. DEQ receives approximately 10-to-15
new permit applications each year.
26 Does not include short term solid waste letters of authorization.
State of Oregon Department of Environmental Quality 26
Short-term Disposal Permits and Beneficial Use Determinations
In addition to permitting solid waste disposal sites, DEQ works with businesses, local governments, the
Oregon Department of Transportation, Army Corps of Engineers, ports and others to permit one-time or
short-term disposal of slightly contaminated soil or sediment at locations where environmental impacts
will be minimal. DEQ also reviews applications to beneficially use waste in ways that are productive and
still protect human health and the environment. Expensive and unnecessary disposal costs can be avoided
when waste materials are beneficially used. Through these efforts, DEQ provides ways to allow
redevelopment of contaminated sites or brownfields and construction of roads and other infrastructure to
take place in a more cost-effective manner. These options also allow waste to be used as fill or to make
new products. DEQ receives approximately five-to-15 short term disposal authorization requests per year
and two-to-five beneficial use applications per year. A list of Beneficial Use Determinations is available
at https://www.oregon.gov/deq/mm/Pages/Beneficial-Use-Determinations.aspx.
Solid Waste Orphan Account
Since 1993, DEQ has collected $0.13/ton on all domestic solid waste disposed in Oregon or transported
out-of-state for disposal. This solid waste orphan site fee funds the Solid Waste Orphan Site Account.
SWOSA funds can be used for cleanup of hazardous substances at solid waste disposal sites owned or
operated by a local government and at privately-owned or operated sites that have received domestic solid
waste where the responsible party is unknown, unwilling or unable to undertake the cleanup. The statute
also includes requirements for matching funding from local governments to access the account and caps
their liability.
In 2017-18, DEQ used SWOSA funds at five approved sites. These sites are: the Creswell Landfill (Lane
County), Shinglehouse Slough Landfill (Coos County), Hawks Landfill (Multnomah County), KFD
Landfill (now Cully Park in Multnomah County) and Santosh Landfill (Columbia County). In 2019, DEQ
plans to continue work at these sites and also conduct cleanup activities at the Kelso Street Waste Tire site
(Lane County).
In 2019-20, DEQ intends to focus more effort on conducting a site assessment program that evaluates and
prioritizes disposal sites throughout Oregon for SWOSA eligibility and funding. DEQ will initiate
cleanup activities at emergency sites as they are identified and annually approve funding at non-
emergency sites according to their priority.
Composting Facilities
Composting facilities are operations that use biological processes (microorganisms) to decompose organic
feedstocks such as yard debris, animal manures and food discards. In Oregon, composting facilities
include aerobic composting facilities and anaerobic digestion facilities. Aerobic composting facilities use
microorganisms that prefer oxygen and produce compost. Anaerobic digesters use microorganisms that
thrive in low oxygen environments and create and capture methane gas to produce electricity or other fuel
products. Digesters also produce liquid and solid by-products called digestate that can be used for soil
fertilizing and conditioning or further processed into compost.
The products of composting facilities provide numerous environmental benefits. The use of compost,
when incorporated into soil, can improve soil tilth and fertility and provide a more stable form of nitrogen
less susceptible to leaching into water supplies. Compost also helps reduce compaction and increases
infiltration. Incorporation of compost into soil stores carbon, helping to reduce atmospheric carbon. By
capturing methane gas, anaerobic digesters avoid the release of methane to the atmosphere, a significant
component of greenhouse gas.
State of Oregon Department of Environmental Quality 27
Composting operations use various methods to compost feedstocks such as yard debris, food waste and
manure into finished compost. Primary aerobic composting methods include: (1) large static pile
composting (this was used in the past and continues in some places in Oregon) and (2) turned windrow
composting with or without installed piping and motorized blowers to force-aerate the piles. Anaerobic
digestion is a common technology used at municipal wastewater treatment plants, food processing
facilities, and in processing manure on farms. The digestion process takes place in sealed tanks to create
an oxygen free environment needed for microorganisms to breakdown the feedstocks. Methane gases
generated can be used to create heat, electricity or transportation fuels. Some wastewater treatment plants
burn-off or “flare” the gases because they lack equipment to utilize the methane.
Oregon currently has 55 DEQ-permitted aerobic composting facilities. Forty-one are assessed as low-risk;
21 are located on farms. There are also approximately ten on-farm composting facilities under Oregon
Dept. of Agriculture oversight.
There are four DEQ-permitted anaerobic digesters; two receive food waste; one is located within the
Portland Metro boundary but is not yet operational. There are also eight anaerobic digesters operating on
farms under Oregon Dept. of Agriculture oversight using manure as feedstock; three of these receive very
small quantities of food waste.
Complaints response
Materials Management staff respond to solid waste complaints about illegal disposal, unpermitted
disposal, as well as concerns about odors, dust, asbestos or other environmental concerns at disposal sites.
In 2017, Materials Management received 200 solid waste complaints in its Western region, 80 solid waste
complaints in its Northwest Region and 25 solid waste complaints in its Eastern region. In 2018,
Materials Management received 219 solid waste complaints in its Western region, 257 solid waste
complaints in its Northwest Region and 30 solid waste complaints in its Eastern region.
Materials Management’s investigations of complaints are part of DEQ’s overall effort to ensure that
businesses and individuals comply with state and federal environmental laws. DEQ uses a variety of tools
to bring about compliance, including technical assistance, compliance inspections, investigation of
complaints, warning letters, assessment of civil penalties and compliance orders. Most violations are
resolved through informal enforcement: Warning Letters or Warning Letters with Opportunity to Correct.
Repeated or more serious violations can result in a formal enforcement action that includes a civil
penalty. Formal enforcement actions are handled by the Office of Compliance and Enforcement.
For 2017-18, 22 companies and individuals subject to some type of Materials Management investigation
were assessed civil penalties totaling over $480,000. In many cases, these penalties reflect not only
assessments for Materials Management violations, but also for water quality, hazardous waste, or other
violations of DEQ rules or permits.
In 2017, DEQ successfully enforced against a virtual floating landfill of over 24 vessels on the Columbia
River. The sinking vessels contained numerous types of hazardous and solid waste. The project involved
significant coordination and collaboration between DEQ, U.S. Coast Guard and the Department of State
Lands, and DEQ was awarded a Certificate of Merit from the Coast Guard for its “actions to protect the
public and sensitive ecosystem in and around the Columbia River by eliminating all oil and hazardous
material threats associated with 26 vessels located at the leased Department of State Lands property in
Goble, Oregon.”

State of Oregon Department of Environmental Quality 28
6.5 Metro’s waste reduction program: compliance with state requirements
Metro is completing an update of its 10-year solid waste management plan, also known as its Regional
Waste Plan.
The 2030 Regional Waste Plan is a blueprint to guide investments in the Metro region’s solid waste
system and reduce the environmental and health impacts of products, from their manufacturing to final
disposition. The plan is intended to move the Metro region towards a sustainable materials management
approach that identifies and addresses impacts across the full life cycle of materials and products. This
shift is based on recent changes in policy guidance at the federal and state levels, including the adoption
of the 2050 Vision by the Environmental Quality Commission and its implementation by DEQ.
The plan also marks another shift in the region’s approach to waste management by incorporating actions
that will advance progress towards meeting the goals of Metro’s Strategic Plan to Advance Racial Equity,
Diversity and Inclusion. This Equity Strategy focuses on eliminating the disparities that people of color
experience, especially in those areas related to Metro’s policies, programs and services. Under Oregon
state law (ORS 459.055), any jurisdiction sending more than 75,000 tons of solid waste per year to a
permitted disposal site, including landfills in exclusive farm use zones, is required to prepare a waste
reduction program for review and approval by DEQ. With over one million tons of garbage sent to
Oregon landfills, the Metro region is subject to the statutory waste reduction program requirements.
Metro has created an appendix to the Regional Waste Plan that describes the elements of the 2030
Regional Waste Plan that make up the waste reduction program and demonstrate the region’s compliance
with specific statutory and regulatory requirements. All local jurisdictions in the Metro region are
required to comply with the waste reduction provisions set forth in state law (ORS 459A.005 to 459A.010
and Oregon Administrative Rule 340-090-0030 to 340-090-0050). Metro has been designated by the state
as the compliance reporting agency for the region’s three-county area. Local jurisdictions provide data to
Metro to assist with this annual responsibility.
The Metro waste reduction program provides:
A commitment by Metro and other local governments in the region to reduce the volume of waste
that would otherwise be disposed of in a landfill through techniques such as waste prevention,
recycling, reuse, composting and energy recovery;
Energy efficient, cost-effective approaches for waste reduction; and
Strategies that are commensurate with the type and volume of solid waste generated in the Metro
region.
The statutory waste reduction program requirements in ORS 459.055(3)(B) also include the requirement
to meet or exceed the waste prevention, reuse and recycling requirements in ORS 459.250 (requiring the
provision of a place for collecting source-separated recyclable materials as a condition to a disposal site
permit being issued or renewed) and ORS 459A.005 to 459A.085 (collectively referred to as the
opportunity to recycle statutes). Most of the opportunity to recycle requirements in ORS 459A are
currently met through existing requirements for local governments set forth in the Metro Code. However,
the 2030 Regional Waste Plan contains additional actions that help Metro and other local governments in
the region meet or exceed these requirements.
The 2030 Regional Waste Plan also includes a measurement framework to evaluate progress towards the
plan’s vision and goals. The measurement framework consists of six key indicators and many goal-level

State of Oregon Department of Environmental Quality 29
indicators. Five of the key indicators are directly related to the statutory waste reduction program actions.
They are:
1. Greenhouse gas emissions associated with the products and services consumed in the Metro
region.
2. Annual tons of waste generated.
3. Number, geographic location and demographics of youth reached through education programs.
4. Share of multifamily communities with adequate collection services.
5. Recycling contamination by sector.
Metro, and the cities and counties in the region will be responsible for collecting the necessary data for
constructing the plan’s indicators. On an annual basis, Metro will report on the status of each action in the
2030 Regional Waste Plan and whether it has been implemented. Reporting on the key and goal
indicators will occur at least every three years. In addition, Metro, in consultation with DEQ, will meet its
statutory reporting responsibilities by periodically reporting to the Environmental Quality Commission on
the implementation of the waste reduction program.
More information on the Metro Regional Waste Plan is available at www.oregonmetro.gov/public-
projects/2030-regional-waste-plan.
6.6 Studies of recovery rates and waste composition In 2017-18, DEQ completed the Material Recovery Survey and Waste Generation reports for 2016 and
2017. These reports show an increase in the amount of waste generated by Oregon from 2016 to 2017 by
about three percent. However, Oregon also saw an increase from 2016 to 2017 in the percentage of waste
that was recovered. DEQ also conducted and published a Waste Composition Study for 2016. This study
provides a detailed breakdown of Oregon’s waste stream that sheds light on what materials dominate the
waste stream and how much recyclable material is being thrown away. The last Waste Composition Study
was conducted in 2010.
Oregon’s Material Recovery and Waste Generation Rates
There are two general destinations for materials at the end of their useful lives: disposal and recovery.
Disposal is landfilling or incineration. Recovery is recycling, composting, incineration for energy return,27
or other ways of regaining resources from the material.
Oregon has long-term goals under ORS 459A.010 to reduce solid waste generation (the sum of disposal
and recovery, or total tonnage of the waste stream) and to increase the rate of material recovery from the
general solid waste stream (also known as the “recovery rate” or the percentage of generation that is
recovered). DEQ’s most recent data shows Oregonians:
Generated 5,276,375 tons of waste in 2016 and 5,534,877 tons of waste in 2017 (a nearly five
percent increase);
Disposed of 3,050,432 tons into landfills and incinerators in 2016 and 3,207,448 tons in 2017 (a
five percent increase); and
Recovered 42.2 percent of waste generated in 2016 and 42.1 percent of waste generated in 2017.
27 Under ORS 459A.010(4), materials burned for energy recovery are only counted as recovered if no viable market exists to recycle the material,
or, in the case of mixtures of materials burned for energy recovery, if half, or less than half, of the mixed materials by weight could have been recycled if properly source separated.

State of Oregon Department of Environmental Quality 30
Recovery rate calculations had previously been affected by a provision of law allowing individual
wastesheds to claim “recovery credits” for waste prevention, reuse and residential composting. Many
wastesheds applied for credits as part of their annual Opportunity to Recycle Report submitted to DEQ. In
2015, the Oregon Legislature eliminated these credits from the calculation, and these credits are not
counted in the recovery rates for 2016 and 2017.
On a per-capita basis, every Oregonian generated roughly 7.1 pounds of waste a day in 2016 and
recovered three pounds; in 2017, every Oregonian generated roughly 7.3 pounds of waste a day,
recovering 3.1 pounds for re-utilization. The rise in generation was likely the result of a busy economy
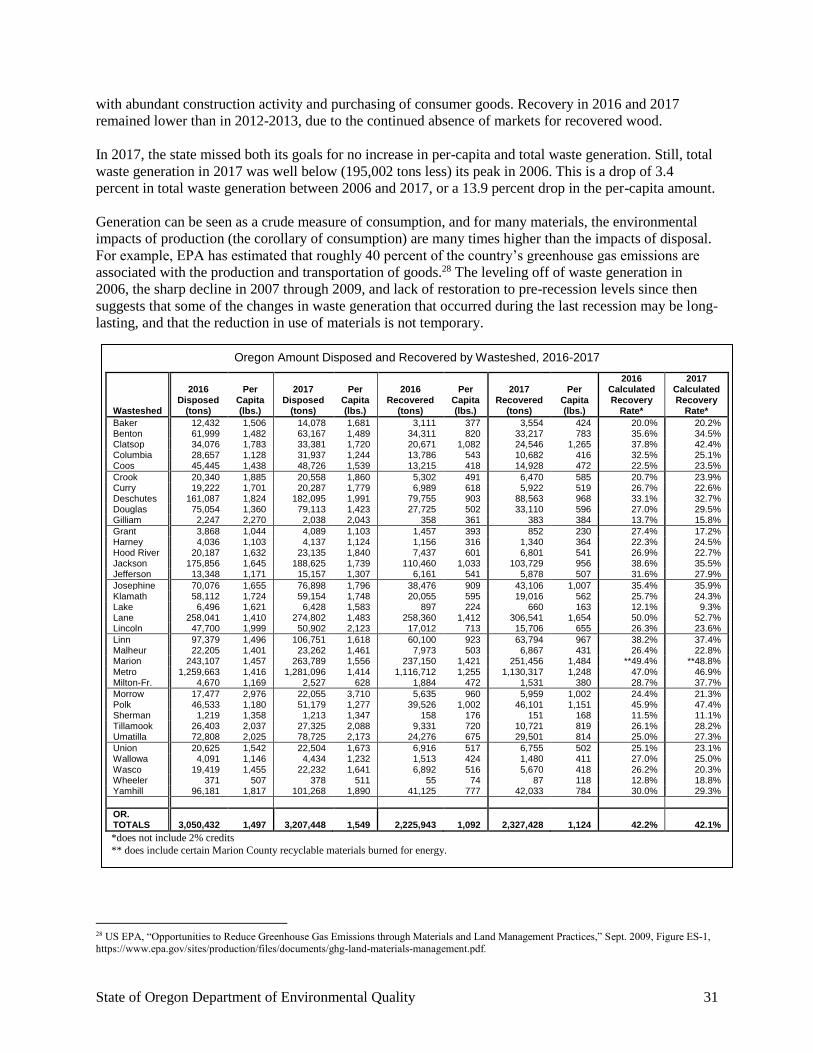
State of Oregon Department of Environmental Quality 31
with abundant construction activity and purchasing of consumer goods. Recovery in 2016 and 2017
remained lower than in 2012-2013, due to the continued absence of markets for recovered wood.
In 2017, the state missed both its goals for no increase in per-capita and total waste generation. Still, total
waste generation in 2017 was well below (195,002 tons less) its peak in 2006. This is a drop of 3.4
percent in total waste generation between 2006 and 2017, or a 13.9 percent drop in the per-capita amount.
Generation can be seen as a crude measure of consumption, and for many materials, the environmental
impacts of production (the corollary of consumption) are many times higher than the impacts of disposal.
For example, EPA has estimated that roughly 40 percent of the country’s greenhouse gas emissions are
associated with the production and transportation of goods.28 The leveling off of waste generation in
2006, the sharp decline in 2007 through 2009, and lack of restoration to pre-recession levels since then
suggests that some of the changes in waste generation that occurred during the last recession may be long-
lasting, and that the reduction in use of materials is not temporary.
28 US EPA, “Opportunities to Reduce Greenhouse Gas Emissions through Materials and Land Management Practices,” Sept. 2009, Figure ES-1, https://www.epa.gov/sites/production/files/documents/ghg-land-materials-management.pdf.
Oregon Amount Disposed and Recovered by Wasteshed, 2016-2017
Wasteshed
2016 Disposed
(tons)
Per Capita (lbs.)
2017 Disposed
(tons)
Per Capita (lbs.)
2016 Recovered
(tons)
Per Capita (lbs.)
2017 Recovered
(tons)
Per Capita (lbs.)
2016 Calculated Recovery
Rate*
2017 Calculated Recovery
Rate*
Baker 12,432 1,506 14,078 1,681 3,111 377 3,554 424 20.0% 20.2% Benton 61,999 1,482 63,167 1,489 34,311 820 33,217 783 35.6% 34.5% Clatsop 34,076 1,783 33,381 1,720 20,671 1,082 24,546 1,265 37.8% 42.4% Columbia 28,657 1,128 31,937 1,244 13,786 543 10,682 416 32.5% 25.1% Coos 45,445 1,438 48,726 1,539 13,215 418 14,928 472 22.5% 23.5%
Crook 20,340 1,885 20,558 1,860 5,302 491 6,470 585 20.7% 23.9% Curry 19,222 1,701 20,287 1,779 6,989 618 5,922 519 26.7% 22.6% Deschutes 161,087 1,824 182,095 1,991 79,755 903 88,563 968 33.1% 32.7% Douglas 75,054 1,360 79,113 1,423 27,725 502 33,110 596 27.0% 29.5% Gilliam 2,247 2,270 2,038 2,043 358 361 383 384 13.7% 15.8%
Grant 3,868 1,044 4,089 1,103 1,457 393 852 230 27.4% 17.2% Harney 4,036 1,103 4,137 1,124 1,156 316 1,340 364 22.3% 24.5% Hood River 20,187 1,632 23,135 1,840 7,437 601 6,801 541 26.9% 22.7% Jackson 175,856 1,645 188,625 1,739 110,460 1,033 103,729 956 38.6% 35.5% Jefferson 13,348 1,171 15,157 1,307 6,161 541 5,878 507 31.6% 27.9%
Josephine 70,076 1,655 76,898 1,796 38,476 909 43,106 1,007 35.4% 35.9% Klamath 58,112 1,724 59,154 1,748 20,055 595 19,016 562 25.7% 24.3% Lake 6,496 1,621 6,428 1,583 897 224 660 163 12.1% 9.3% Lane 258,041 1,410 274,802 1,483 258,360 1,412 306,541 1,654 50.0% 52.7% Lincoln 47,700 1,999 50,902 2,123 17,012 713 15,706 655 26.3% 23.6%
Linn 97,379 1,496 106,751 1,618 60,100 923 63,794 967 38.2% 37.4% Malheur 22,205 1,401 23,262 1,461 7,973 503 6,867 431 26.4% 22.8% Marion 243,107 1,457 263,789 1,556 237,150 1,421 251,456 1,484 **49.4% **48.8% Metro 1,259,663 1,416 1,281,096 1,414 1,116,712 1,255 1,130,317 1,248 47.0% 46.9% Milton-Fr. 4,670 1,169 2,527 628 1,884 472 1,531 380 28.7% 37.7%
Morrow 17,477 2,976 22,055 3,710 5,635 960 5,959 1,002 24.4% 21.3% Polk 46,533 1,180 51,179 1,277 39,526 1,002 46,101 1,151 45.9% 47.4% Sherman 1,219 1,358 1,213 1,347 158 176 151 168 11.5% 11.1% Tillamook 26,403 2,037 27,325 2,088 9,331 720 10,721 819 26.1% 28.2% Umatilla 72,808 2,025 78,725 2,173 24,276 675 29,501 814 25.0% 27.3%
Union 20,625 1,542 22,504 1,673 6,916 517 6,755 502 25.1% 23.1% Wallowa 4,091 1,146 4,434 1,232 1,513 424 1,480 411 27.0% 25.0% Wasco 19,419 1,455 22,232 1,641 6,892 516 5,670 418 26.2% 20.3% Wheeler 371 507 378 511 55 74 87 118 12.8% 18.8% Yamhill 96,181 1,817 101,268 1,890 41,125 777 42,033 784 30.0% 29.3%
OR. TOTALS 3,050,432 1,497 3,207,448 1,549 2,225,943 1,092 2,327,428 1,124 42.2% 42.1%
*does not include 2% credits
** does include certain Marion County recyclable materials burned for energy.

State of Oregon Department of Environmental Quality 32
Pursuant to ORS 459A.012, DEQ is actively researching and developing a method for calculating an
additional, alternative set of recovery rates for wastesheds based on the energy savings represented by
recovery efforts. ORS 459A.012 allows DEQ to calculate alternative recovery rates based on reductions
in greenhouse gas emissions, or other environmental impacts.
In 2018 and 2019, Oregonians will be challenged to increase their recovery rate to approach the 2020 and
2025 goals. Equally important, they will be challenged to reduce overall environmental impacts by
reducing generation, and acting throughout the materials life cycle.
Waste Composition Study
The Waste Composition Study
complements the Material
Recovery Survey by filling in
information about quantities of
individual materials in the
disposal stream. It helps DEQ
answer questions like “What
materials dominate the disposal
stream?”; “How much
recyclable material is being
thrown away?”; and “Which
disposed materials deserve
greater focus in recovery
efforts?”
The Waste Composition Study
is conducted at least once every
three biennia, with assistance of
more than 50 disposal site
operators throughout the state, as well as most of the solid waste collection companies in the state. DEQ
began fieldwork on the most recent study in May 2016. The statewide results of that study are shown in
the “Components of Disposed Materials in 2016 Waste Composition Study” graph.
DEQ provides additional waste composition sampling and analysis for local governments that have
contributed funds for information beyond the basic design of the Waste Composition Study. These local
governments include Marion County, Lane County, Washington County, Metro, and the City of Portland.
The statewide results and additional sampling and analysis are available at
https://www.oregon.gov/deq/mm/Pages/Waste-Composition-Study.aspx.