Materials identification using a small-scale …discovery.ucl.ac.uk/1489854/1/OFlynn et al...
15
Materials identification using a small-scale pixellated X-ray diffraction system D O’Flynn 1 , C. Crews 1 , I. Drakos 1 , C. Christodoulou 1 , M.D. Wilson 2 , M.C. Veale 2 , P. Seller 2 and R.D. Speller 1 1 Department of Medical Physics and Biomedical Engineering, University College London, WC1E 6BT, United Kingdom 2 Detector Development Group, Rutherford Appleton Laboratory, Harwell Science & Innovation Campus, Didcot OX11 0QX, United Kingdom E-mail: [email protected] Abstract. A transmission X-ray diffraction system has been developed using a pixellated, energy-resolving detector (HEXITEC) and a small-scale, mains operated X-ray source (Amptek Mini-X). HEXITEC enables diffraction to be measured without the requirement of incident spectrum filtration, or collimation of the scatter from the sample, preserving a large proportion of the useful signal compared with other diffraction techniques. Due to this efficiency, sufficient molecular information for material identification can be obtained within five seconds despite the relatively low X- ray source power. Diffraction data are presented from caffeine, hexamine, paracetamol, plastic explosives and narcotics. The capability to determine molecular information from aspirin tablets inside their packaging is demonstrated. Material selectivity and the potential for a sample classification model is shown with principal component analysis, through which each different material can be clearly resolved.
Transcript of Materials identification using a small-scale …discovery.ucl.ac.uk/1489854/1/OFlynn et al...

Materials identification using a small-scale
pixellated X-ray diffraction system
D O’Flynn1, C. Crews1, I. Drakos1, C. Christodoulou1, M.D.
Wilson2, M.C. Veale2, P. Seller2 and R.D. Speller1
1Department of Medical Physics and Biomedical Engineering, University College
London, WC1E 6BT, United Kingdom2Detector Development Group, Rutherford Appleton Laboratory, Harwell Science &
Innovation Campus, Didcot OX11 0QX, United Kingdom
E-mail: [email protected]
Abstract. A transmission X-ray diffraction system has been developed using a
pixellated, energy-resolving detector (HEXITEC) and a small-scale, mains operated
X-ray source (Amptek Mini-X). HEXITEC enables diffraction to be measured without
the requirement of incident spectrum filtration, or collimation of the scatter from
the sample, preserving a large proportion of the useful signal compared with other
diffraction techniques. Due to this efficiency, sufficient molecular information for
material identification can be obtained within five seconds despite the relatively low X-
ray source power. Diffraction data are presented from caffeine, hexamine, paracetamol,
plastic explosives and narcotics. The capability to determine molecular information
from aspirin tablets inside their packaging is demonstrated. Material selectivity and
the potential for a sample classification model is shown with principal component
analysis, through which each different material can be clearly resolved.

Materials identification using a small-scale pixellated X-ray diffraction system 2
1. Introduction
X-ray diffraction (XRD) is a technique which gives detailed information on the molecular
structure of a material, arising due to the constructive interference of coherently
scattered X-rays from different atomic planes. XRD is a powerful tool for sample
identification, giving very high material specificity and sensitivity [1, 2, 3]. A large
advantage of XRD over Raman imaging, another molecular fingerprinting technique, is
the penetrating nature of X-rays compared with laser light. With transmission XRD,
objects can be probed whilst inside packaging, which is of particular use in the cases of
suspicious powders or pharmaceuticals, since samples can be kept intact and preparation
time is reduced. By comparison with X-ray imaging methods, greater sample sensitivity
and specificity can be achieved with XRD due to the molecular information provided.
The relation describing the conditions for an increase in observed intensity due to XRD
is summarised by Bragg’s law: nλ = 2d sin θ, where λ is the X-ray wavelength, θ is the
angle between the incident X-rays and the crystallographic planes in the sample and d
gives the spacing between these planes.
Standard experimental approaches to XRD can be divided into two broad
categories: angular dispersive (ADXRD) and energy dispersive (EDXRD). The former
approach requires a close-to-monochromatic X-ray source, and Bragg’s law is probed by
detecting the X-ray intensity as a function of scattering angle. This can be performed
by a mechanical rotation of the X-ray source and detector about the sample, or by
the use of a pixellated X-ray detector with an area large enough to capture a sufficient
range of angles. With EDXRD, the scattering angle is kept fixed, and diffraction from
a broad spectrum of X-ray energies is measured by the use of a single element energy-
resolving detector (or an array of detectors) [4]. EDXRD is typically performed in
transmission mode (with the detector placed on the opposite side of the sample to the
X-ray source), and ADXRD is measured in either reflection or transmission. A lower
incident X-ray energy is generally used in reflection geometries (for example, Cu Kα
radiation: 8.06 keV), since this gives a wide spread of diffraction angles for a given set
of sample d-spacings, making peaks easier to resolve. In transmission, the X-ray energy
needs to be greater (of the order of 10-100keV) in order for photons to pass through
the sample; alternatively, the sample thickness needs to be on the sub-millimetre scale.
In order to perform real-world materials identification with XRD, there is a
requirement to overcome limitations in efficiency and/or practicality of both angular
dispersive and energy dispersive techniques. The need for a rotation of source and
detector for ADXRD in diffractometers results in equipment which is large and unwieldy,
and scanning inside packaging is not possible with the low X-ray energies used.
Transmission ADXRD is limited by the need for a narrow energy window at an energy
high enough for reasonable sample penetration - without the use of a synchrotron it is
difficult to achieve such a small range of energies - and there is a trade-off between energy
resolution and X-ray flux when using spectral filtration methods. EDXRD requires the
diffracted beam to be very strongly collimated in order to reduce the broadening of the
Materials identification using a small-scale pixellated X-ray diffraction system 3
diffraction peaks due to low angular resolution. Such collimation means that the vast
majority of the diffracted signal is not utilised. Each technique has inherent issues with
counting statistics since they discard a lot of useful information from the scattered X-rays
- either spatial, spectral, or both. Pixellated diffraction (PixD) is a method of combining
transmission ADXRD and EDXRD, utilising the benefits of both approaches - i.e.
simultaneous measurements over a range of scattering angles and X-ray energies [5, 6].
PixD was developed with the use of the HEXITEC pixellated energy-resolving detector
[7, 8, 9]. HEXITEC is made up of a 20× 20× 1 mm cadmium telluride (CdTe) crystal
bump bonded to an application-specific integrated circuit (ASIC) to give an 80 × 80
pixel array with 250µm pitch. Unlike germanium-based energy resolving detectors,
CdTe does not need to be operated at cryogenic temperatures. With HEXITEC, the
crystal is peltier cooled, and typical operating temperatures are between 0-10 ◦C. The
ASIC detects the charge created by each photon interaction, and converts this into an
energy value. Therefore, each pixel outputs an individual energy spectrum for a single
acquisition. This is in contrast to other pixellated, energy-resolving detectors in which
a number of energy thresholds (typically four or less) can be set by the user, above
which all photon interactions are counted indistinguishably [10, 11, 12, 13, 14]. The
energy-resolving capability of HEXITEC allows an unfiltered incident X-ray beam to be
used for XRD. The pixellation of the detector means that the angular distribution of the
diffracted X-rays can be observed without the need for a collimator positioned between
the sample and the detector, provided the incident beam is sufficiently collimated and
the sample is thin enough to reduce the uncertainty in the origin of the diffracted X-rays
along the incident beam axis [6]. The combination of pixellation and energy resolution
gives a greatly enhanced measurable diffraction signal intensity compared with ADXRD
and EDXRD. A previous report has demonstrated accurate material specificity with the
PixD technique - particularly that of plastic explosive samples - with sufficient counting
statistics for identification obtained in one second using a high power (420W) X-ray
source [5].
In moving towards more practical applications of the pixellated diffraction system,
this report presents results from performing the PixD technique using a small,
lightweight, mains/battery operated X-ray source. The effects of this source on the
observed diffraction spectra of a range of materials are discussed, covering plastic
explosives, illicit drugs and pharmaceuticals. The potential of the system for classifying
materials within packaging is demonstrated for aspirin tablets. This capability is of
particular relevance to the pharmaceutical industry, where counterfeiting is a serious
global problem [15, 16].
2. Experimental detail
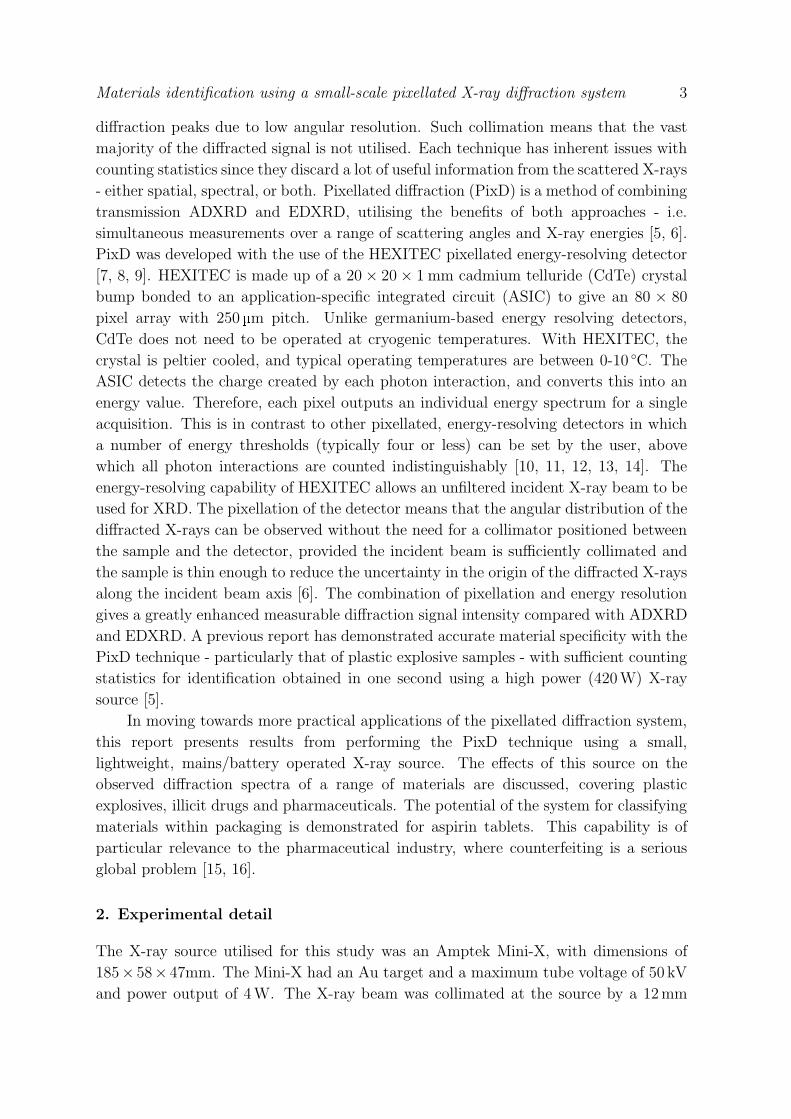
The X-ray source utilised for this study was an Amptek Mini-X, with dimensions of
185× 58× 47mm. The Mini-X had an Au target and a maximum tube voltage of 50 kV
and power output of 4W. The X-ray beam was collimated at the source by a 12mm

Materials identification using a small-scale pixellated X-ray diffraction system 4
Brass collimator
on source
(1 mm pinhole)
Al+Pb collimator
(0.5 mm pinhole)
Sample
HEXITEC
detector
Scattered
X-rays
6 mm
3 mm
150 mm 51 mm 109 mm
(a) (b)
Figure 1. (a) Schematic plan view of the experimental setup (b) The Amptek Mini-X
source
Scattering a
ngle
(degre
es)
0
2
4
6
8
10
12
0 2 4 6 8 10 12 140
50
100
150
200
250
300
350
400
Scattering angle (degrees)
Nu
mb
er
of
pix
els
Figure 2. (a) The scattering angles measured by the pixels across the detector, due
to sample and detector positioning. (b) The number of pixels which are represented
as a function of scattering angle (pixels covered by the beam stop are omitted).
long brass collimator insert with a 1mm pinhole, and by an additional 0.5mm lead
pinhole before the sample. The HEXITEC detector was placed behind the sample, with
the collimated X-ray beam aligned with the bottom-left corner of the detector. A lead
beam stop covering the primary beam was put in place during diffraction measurements,
and pixels covered by the beam stop were not included in the data analysis. A schematic
plan view of the experimental setup and image of the Mini-X source are shown in Figure
1. The source was operated at 50 kV, and the maximum tube current at this voltage
of 80 µA. The scattering angle as a function of pixel position across the detector given
by this geometry is shown in Figure 2. Due to the radial nature of the diffraction and
the positioning of the detector, some scattering angles were sampled more frequently
than others (Figure 2 (b)). For example, there are over 6 times the number of pixels
positioned at a scattering angle of 9◦ than at 12◦. In combination with the energy
spectra of the pixels, this introduced a bias into the overall momentum transfer plot,
which was corrected for in the data analysis.
The diffraction profiles of a range of different polycrystalline materials were taken
with the small-scale pixellated diffraction setup for this work. For comparison with
the large-scale system, caffeine, hexamine and three different explosive materials were

Materials identification using a small-scale pixellated X-ray diffraction system 5
tested. In order to demonstrate the potential of this system for material identification of
illicit/counterfeit drugs, diffraction data was also taken for three diamorphine (heroin)
and two cocaine samples seized by the UK Border Force, aspirin tablets (Tesco
Dispersible Aspirin, 300mg) and a crushed paracetamol tablet. Diffraction profiles for
the aspirin were measured both inside and outside the blister pack to demonstrate the
ability of the technique to identify materials without the need to open the packaging.
The caffeine, hexamine, paracetamol and explosive samples were each 3mm thick, and
held in place between layers of Mylar film. The drug samples were contained inside
clear polythene bags which could not be opened for security reasons; these bags were
lightly compressed between two flat plastic plates (with large holes for the incident and
diffracted X-rays to pass through unobstructed) to give sample thicknesses of 4± 1mm.
The aspirin tablets were kept in their standard form, and were 3.5mm thick.
A common issue with pixellated, energy-resolving detectors is the presence of charge
sharing, i.e. when the charge cloud generated in the CdTe from a single photon
interaction is spread across more than one detector pixel. This, in turn, causes the
energy contribution from the photon to be divided across these pixels. Charge-sharing
effects are mitigated in HEXITEC due to the relatively large pixel size, although they
remain significant. Charge-sharing discrimination was applied for this work, i.e. when
events were detected in neighbouring pixels in the same frame, these events were removed
from the final data. The counting rate used was 5520 frames per second.
The spread of X-ray energies up to 50 keV from the Mini-X source defined the
momentum transfer range able to be probed in this work (for a given range of angles).
The effect of acquisition times on the counting statistics with the maximum X-ray flux
of 80 µA was observed by taking multiple diffraction profiles for each sample over a range
of times from 1-600 seconds.
3. Results and discussion
3.1. Energy-angle space in pixellated diffraction
The background subtracted pixellated diffraction data for caffeine at three discrete
energies, acquired over 600 seconds, are shown in Figure 3. The two arcs visible represent
diffraction from four different atomic spacings of caffeine (7.53 A, 7.40 A, 3.37 A and
3.30 A) - the respective first two and latter two spacings are close enough so as to be
unresolvable with this technique. It can be seen that approximately one-quarter of the
diffraction “cones” emitted from the sample are intersected by the detector. Moving to
higher X-ray energy windows, the arcs gradually decrease in radius - this behaviour is
as described by Bragg’s law, and is also represented by an energy-angle map in Figure
4.
The pixellated diffraction information was converted into a plot of momentum
transfer space utilising the unique energy spectra and scattering angle of each detector

Materials identification using a small-scale pixellated X-ray diffraction system 6
15 keV 30 keV20 keV
Caffeine
Figure 3. Pixellated X-ray diffraction from caffeine, with X-rays generated at 50 kV
and 80µA, and an acquisition time of 600 s. The energy windows shown have a width
of 2 keV. The region of low intensity in the bottom-left corner of the detector is due
to the lead beam stop.
10
8
6
4
240
35
30
25
20
15
10
5
Energy (keV)
Angle (degrees)
Figure 4. An energy-angle map of the pixellated X-ray diffraction signal from caffeine.
pixel, and the relationship:
x =E
hcsin θ (1)
where x is the momentum transfer for a photon of energy E scattered through an angle
2θ. When the pixel spectra are converted into the generic momentum transfer space,
they can be summed together to fully utilise the counting statistics of the diffraction
data [5]. The peaks seen at momentum transfer values of 0.68 and 1.48 nm−1 (from

Materials identification using a small-scale pixellated X-ray diffraction system 7
)
Caffeine
Figure 5. X-ray diffraction patterns for caffeine obtained by converting the pixellated
diffraction data into momentum transfer space. Both datasets are background
subtracted and corrected for momentum transfer weighting, and the effect of correcting
for the X-ray spectrum is shown.
here referred to as peak A and peak B, respectively) are in agreement with those seen
in previously published ADXRD data for caffeine [17, 18]. Peak A has a full width at
half maximum (FWHM) of 0.09nm−1, and peak B has a FWHM of 0.17nm−1. This
difference in peak widths is likely due to the larger separation of the unresolved peaks
at peak B compared with those at peak A.
The diffraction data for caffeine corrected for background contributions and
momentum transfer weighting is shown in Figure 5. Also shown is the result of a
normalisation for the X-ray spectrum emitted from the Mini-X source. The output
spectrum at 50 kV was directly measured using HEXITEC. When applying the spectral
correction, the relative intensities at higher momentum transfer are increased markedly,
albeit with an associated increase in statistical noise - due to the drop off of incident
photons at the higher energy end of the Bremsstrahlung spectrum. Figure 6 shows
the contributions to the overall momentum transfer plot from different energy windows
across the range of incident energies. These data illustrate the need to go to energies
greater than 15 keV with this detector geometry setup in order to scan a sufficient region
of momentum transfer space.
3.2. Hexamine
Diffraction patterns in the form of spots rather than rings indicate the presence of a
preferred crystallographic orientation within the sample, or grain sizes which are large

Materials identification using a small-scale pixellated X-ray diffraction system 8
1 2
Inte
nsity (
a.u
.)
0
0.2
0.4
0.6
0.8
15-15 keV
0.5 1 1.5 2 2.5 3
Inte
nsity (
a.u
.)
0
0.1
0.2
0.3
0.4
0.515-25 keV
Momentum transfer (nm-1
)
0.5 1 1.5 2 2.5 3
Inte
nsity (
a.u
.)
0
0.05
0.1
0.15
0.225-35 keV
Momentum transfer (nm-1
)
0.5 1 1.5 2 2.5 3
Inte
nsity (
a.u
.)
0
0.02
0.04
0.06
0.0835-45 keV
Figure 6. The contribution to the overall momentum transfer spectrum from
different energy windows across the range of the incident X-ray spectrum, corrected
for background and momentum transfer weighting.
enough such that the incident X-ray beam effectively passes through a limited number of
single crystals within the sample. The pixellated diffraction pattern of hexamine shown
in Figure 7 is due to the grain size of the sample being comparable with the width
of the intersecting X-ray beam (∼1mm). The ability to detect the diffraction spots
from samples such as hexamine over a relatively large area shows a clear advantage of
using HEXITEC over small, single element energy-resolving detectors - in the latter
case these spots may not be detected due to the detector positioning. The nature of the
diffraction images obtained from hexamine in comparison with caffeine demonstrates
the potential for grain size determination of an unknown material, which could also
be a useful identification metric. In the case of the plastic explosive materials, the
pixellated diffraction data show evidence of preferred orientations and/or large grain
powders (RDX and/or PETN) being present inside the plastic binding materials for the
Semtex and C4 samples (Figure 8).

Materials identification using a small-scale pixellated X-ray diffraction system 9
Hexamine
Figure 7. Pixellated X-ray diffraction from hexamine, with X-rays generated at 50 kV
and 80µA, and an acquisition time of 600 s. The energy windows shown have a width
of 3 keV.
Semtex 1ASemtex H C4
Figure 8. Pixellated diffraction patterns for plastic explosive compounds, summed
over all energies.
3.3. Illicit drugs
The compositions of the illicit drug samples are given in Table 1. Note that since
the materials with which the drugs were cut had unknown quantities, it is difficult
to infer any impact these may have on these diffraction data. There is limited XRD
information available on cocaine and diamorphine in the literature, although previous
EDXRD studies by Cook et al. [19, 20] were used to make a comparison with the data
shown here. The diffraction spectrum for diamorphine obtained with the PixD method
shows three peaks in intensity at momentum transfers of 0.7, 0.9 and 1.15nm−1 (Figure
9). This result correlates with that found for freebase heroin (of which diamorphine is
the active ingredient) by Cook et al.
Cocaine in two different forms was also studied using EDXRD by Cook et al., where
it was found that the freebase form had a markedly different diffraction spectrum to
that of cocaine hydrochloride. The cocaine samples provided for this study were in an
unknown form, but by comparison of their diffraction profiles with those shown in the
previous EDXRD work they appear to be cocaine hydrochloride, which contains a series

Materials identification using a small-scale pixellated X-ray diffraction system 10
Momentum transfer (nm-1
)
0.5 1 1.5 2 2.5 3
Inte
nsity (
a.u
.)
0
0.2
0.4
0.6
0.8
1Diamorphine
Momentum transfer (nm-1
)
0.5 1 1.5 2 2.5 3
Inte
nsity (
a.u
.)
0
0.1
0.2
0.3
0.4
0.5
0.6Cocaine
Figure 9. Pixellated diffraction spectra for illicit drug materials, background
subtracted and normalised for the momentum transfer weighting in the detector.
of peaks in the momentum transfer range 0.9-1.6nm−1.
3.4. Aspirin and paracetamol
The observed diffraction profiles for aspirin tablets inside and outside of the blister
packaging are given in Figure 10. The features seen in both profiles are similar, with
a slightly higher background seen for the aspirin in package data, thought to be due
to extra X-ray scatter from the packaging. In order to better understand the nature
of the PixD results obtained for aspirin, they were compared with previously acquired
high resolution diffraction data of a ground up aspirin tablet taken on synchrotron
beamline ID31 at the ESRF, France [21]. The synchrotron data were taken in angular
dispersive mode with an X-ray energy of 15.60 keV (wavelength of 0.794 83 A). An
agreement between the PixD and synchrotron data is seen. In particular, the single
peak at 0.88 nm−1, the multiple peaks between 1.16 and 1.30 nm−1 and the double peak
at 1.51 nm−1 in the synchrotron data correspond with the three respective main peaks
in the pixellated diffraction data.
Paracetamol commonly forms in one of two distinct polymorphs in its
pharmaceutical form [22, 23]. A pixellated diffraction measurement was taken on a
crushed paracetamol tablet, and the resultant diffraction pattern is shown in Figure 11.
These data correspond with previously published ADXRD diffractometer data for the
monoclinic Form I polymorph of paracetamol [24, 25].
3.5. Principal component analysis
Principal component analysis (PCA) is a data analysis technique which determines the
largest variances between datasets, and can vastly reduce large quantities of data by
transforming them into a new space [26, 27]. In this principal component (PC) space,
datasets which are similar are grouped in nearby regions, and sets which are different are

Materials identification using a small-scale pixellated X-ray diffraction system 11
Momentum transfer (nm-1
)
0.5 1 1.5 2 2.5 3
Inte
nsity (
a.u
.)
0
0.2
0.4
0.6
0.8
1
Aspirin
Unpackaged
In package
Synchrotron
Figure 10. Pixellated diffraction spectra for an aspirin tablet, both inside and outside
of its packaging. Data are background subtracted and normalised for the momentum
transfer weighting in the detector. For comparison, synchrotron X-ray diffraction data
from a ground aspirin tablet is shown, taken at the ID31 beamline, ESRF, France [21].
Momentum transfer (nm-1
)
0.5 1 1.5 2 2.5 3
Inte
nsity (
a.u
.)
0
0.2
0.4
0.6
0.8
1
Paracetamol (crushed tablet)
Figure 11. Pixellated diffraction spectra for a crushed paracetamol tablet,
background subtracted and normalised for the momentum transfer weighting in the
detector.

Materials identification using a small-scale pixellated X-ray diffraction system 12
Illicit drug quantity Other materials
Diamorphine 1 73% Phenobarbitone
Diamorphine 2 69% Phenobarbitone
Caffeine
Diazepam
Diamorphine 3 42% Phenobarbitone
Caffeine
Diazepam
Paracetamol
Cocaine 1 75% Unknown
Cocaine 2 69% Unknown
Table 1. Compositions of the illicit drug samples provided by the UK Home Office.
easily separated, making PCA ideal for pattern matching algorithms. The first principal
component axis (PC1) describes the largest variance between the datasets. The second
axis (PC2) describes the largest variance constrained to be orthogonal to PC1, and so
on.
PCA has been shown to work with noisy data [28], and thus it is a useful tool for
determining the minimum acceptable acquisition time for the PixD technique using the
Mini-X source. PCA was performed on the data after grouping all diffraction spectra
into one matrix (different samples in each row, the time normalised intensity at each
momentum transfer value in the columns). The result of the analysis was a series of
scores for each sample, which can be visualised as their coordinates in PC space. The
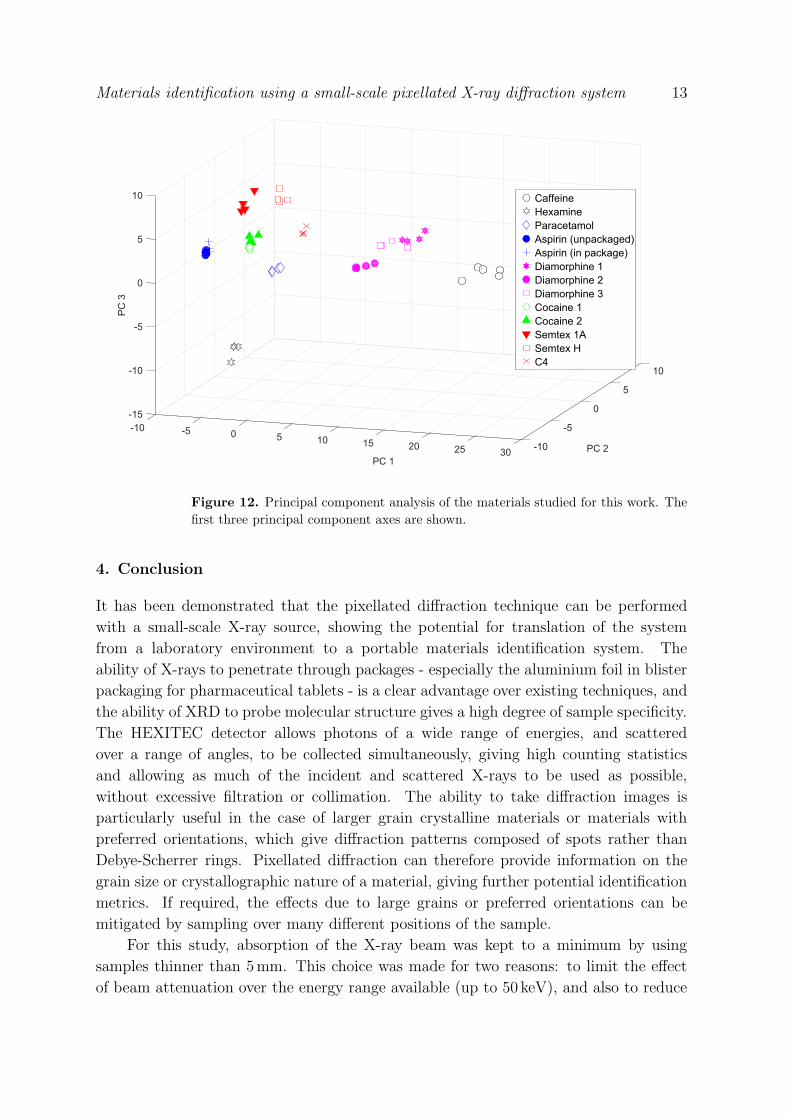
result of the PCA on the data presented in the previous section, with acquisition times
of 5, 10, 60 and 600 seconds is shown in Figure 12. For acquisition times greater than
five seconds, there is a clustering of the data points representing each sample. This
clustering breaks down when including the data collected for less than five seconds,
with points representing these datasets beginning to overlap with other clusters. This
can be explained by the noise in these datasets being large enough so as to mask the
features which are used by the PCA to differentiate the spectra. In the case of data
collected for five or more seconds, the different materials are clearly separable using the
first three principal components, and the acquisition times have no significant bearing on
the overall position in PC space of each material. For materials identification purposes,
this is a very useful result, since discriminant analysis can be used to classify regions in
PC space; unidentified materials can then be classified based on which region they fall
in to as defined by the discriminant analysis. This approach requires prior knowledge
in the form of a library of diffraction spectra of materials to be tested against.
Materials identification using a small-scale pixellated X-ray diffraction system 13
10
5
PC 2
0
-5
-10302520
PC 1
151050-5-10
-5
-10
-15
5
0
10
PC
3
Caffeine
Hexamine
Paracetamol
Aspirin (unpackaged)
Aspirin (in package)
Diamorphine 1
Diamorphine 2
Diamorphine 3
Cocaine 1
Cocaine 2
Semtex 1A
Semtex H
C4
Figure 12. Principal component analysis of the materials studied for this work. The
first three principal component axes are shown.
4. Conclusion
It has been demonstrated that the pixellated diffraction technique can be performed
with a small-scale X-ray source, showing the potential for translation of the system
from a laboratory environment to a portable materials identification system. The
ability of X-rays to penetrate through packages - especially the aluminium foil in blister
packaging for pharmaceutical tablets - is a clear advantage over existing techniques, and
the ability of XRD to probe molecular structure gives a high degree of sample specificity.
The HEXITEC detector allows photons of a wide range of energies, and scattered
over a range of angles, to be collected simultaneously, giving high counting statistics
and allowing as much of the incident and scattered X-rays to be used as possible,
without excessive filtration or collimation. The ability to take diffraction images is
particularly useful in the case of larger grain crystalline materials or materials with
preferred orientations, which give diffraction patterns composed of spots rather than
Debye-Scherrer rings. Pixellated diffraction can therefore provide information on the
grain size or crystallographic nature of a material, giving further potential identification
metrics. If required, the effects due to large grains or preferred orientations can be
mitigated by sampling over many different positions of the sample.
For this study, absorption of the X-ray beam was kept to a minimum by using
samples thinner than 5mm. This choice was made for two reasons: to limit the effect
of beam attenuation over the energy range available (up to 50 keV), and also to reduce

Materials identification using a small-scale pixellated X-ray diffraction system 14
the loss of angular resolution due to scatter from different depths within the sample [6].
The relatively low maximum current output for the Mini-X tube of 80 µA (at 50 kV)
affected the counting statistics of the experiment, and so the minimum counting time
required in order to successfully distinguish between different samples. The acquisition
time of five seconds reported here is still relatively fast for illicit materials identification,
especially when minimal sample preparation is required. The technique of principal
component analysis demonstrates that material identification can be achieved through
pattern recognition - although a prior library of materials to test for is needed.
5. Acknowledgements
This research was funded under the Innovative Research Call in Explosives and Weapons
Detection (2010) initiative, a cross-government programme sponsored by a number
of departments and agencies under the UK Government’s CONTEST strategy, in
partnership with US Department of Homeland Security. The explosives and narcotics
samples were provided by the Home Office Centre for Applied Science and Technology.
The experiments and handling of these samples were conducted in full compliance with
UK laws, rules and regulations.
References
[1] Shell J W 1963 Journal of Pharmaceutical Sciences 52 24–29 ISSN 1520-6017
[2] Peplow D E and Verghese K 1998 Physics in Medicine and Biology 43 2431
[3] Harding G and Schreiber B 1999 Radiation Physics and Chemistry 56 229 – 245 ISSN 0969-806X
[4] Kampfe B, Luczak F and Michel B 2005 Particle & Particle Systems Characterization 22 391–396
ISSN 1521-4117
[5] O’Flynn D, Reid C B, Christodoulou C, Wilson M D, Veale M C, Seller P, Hills D, Desai H, Wong
B and Speller R 2013 Journal of Instrumentation 8 P03007
[6] O’Flynn D, Desai H, Reid C B, Christodoulou C, Wilson M D, Veale M C, Seller P, Hills D, Wong
B and Speller R D 2013 Crime Science 2 4
[7] Jones L, Seller P, Wilson M and Hardie A 2009 Nuclear Instruments and Methods in Physics
Research Section A: Accelerators, Spectrometers, Detectors and Associated Equipment 604 34
– 37 ISSN 0168-9002 Proceedings of the 8th International Conference on Position Sensitive
Detectors
[8] Seller P, Bell S, Cernik R J, Christodoulou C, Egan C K, Gaskin J A, Jacques S, Pani S, Ramsey
B D, Reid C, Sellin P J, Scuffham J W, Speller R D, Wilson M D and Veale M C 2011 Journal
of Instrumentation 6 C12009
[9] Veale M C, Kalliopuska J, Pohjonen H, Andersson H, Nenonen S, Seller P and Wilson M D 2012
Journal of Instrumentation 7 C01035
[10] Llopart X, Campbell M, Dinapoli R, San Segundo D and Pernigotti E 2002 Nuclear Science, IEEE
Transactions on 49 2279–2283 ISSN 0018-9499
[11] Ballabriga R, Campbell M, Heijne E, Llopart X and Tlustos L 2007 Nuclear Science, IEEE
Transactions on 54 1824–1829 ISSN 0018-9499
[12] Bellazzini R, Spandre G, Brez A, Minuti M, Pinchera M and Mozzo P 2013 Journal of
Instrumentation 8 C02028
[13] Romano A, Pacella D, Claps G, Causa F and Gabellieri L 2015 Journal of Instrumentation 10
C02046

Materials identification using a small-scale pixellated X-ray diffraction system 15
[14] Vincenzi A, de Ruvo P, Delogu P, Bellazzini R, Brez A, Minuti M, Pinchera M and Spandre G
2015 Journal of Instrumentation 10 C04010
[15] Newton P N, Green M D, Fernndez F M, Day N P and White N J 2006 The Lancet Infectious
Diseases 6 602 – 613 ISSN 1473-3099
[16] Degardin K, Roggo Y and Margot P 2014 Journal of Pharmaceutical and Biomedical Analysis 87
167 – 175 ISSN 0731-7085 review Papers on Pharmaceutical and Biomedical Analysis 2013
[17] Phadnis N V, Cavatur R K and Suryanarayanan R 1997 Journal of Pharmaceutical and Biomedical
Analysis 15 929 – 943 ISSN 0731-7085
[18] Lehmann C and Stowasser F 2007 Chemistry A European Journal 13 2908–2911 ISSN 1521-3765
[19] Cook E, Fong R, Horrocks J, Wilkinson D and Speller R 2007 Applied Radiation and Isotopes 65
959 – 967 ISSN 0969-8043
[20] Cook E, Pani S, George L, Hardwick S, Horrocks J and Speller R 2009 IEEE Transactions on
Nuclear Science 56 1459 –1464 ISSN 0018-9499
[21] Reproduced with permission from A. Fitch at the ESRF
http://www.iucr.org/resources/commissions/powder-diffraction/projects/organic-datasets
[22] Nichols G and Frampton C S 1998 Journal of Pharmaceutical Sciences 87 684–693 ISSN 1520-6017
[23] Espeau P, Colin R, Tamarit J L, Perrin M A, Gauchi J P and Leveiller F 2005 Journal of
Pharmaceutical Sciences 94 524–539 ISSN 1520-6017
[24] Pecharsky V K and Zavalij P Y 2009 Fundamentals of Powder Diffraction and Structural
Characterization of Materials (Springer US) ISBN 978-0-387-09578-3
[25] Perrin M A, Neumann M A, Elmaleh H and Zaske L 2009 Chem. Commun. (22) 3181–3183
[26] Lee D D and Seung H S 1999 Nature 401 788–791 ISSN 0028-0836
[27] Theodorakou C and Farquharson M J 2009 Physics in Medicine and Biology 54 4945
[28] Luggar R D, Farquharson M J, Horrocks J A and Lacey R J 1998 X-Ray Spectrometry 27 87–94
ISSN 1097-4539