Materials for Hydrogen Storage and Synthesis of …549550/FULLTEXT01.pdfMaterials for Hydrogen...
94
Materials for Hydrogen Storage and Synthesis of New Materials by Hydrogenation Serhiy Luzan Doctoral Thesis Department of Physics Umeå University Umeå 2012
Transcript of Materials for Hydrogen Storage and Synthesis of …549550/FULLTEXT01.pdfMaterials for Hydrogen...
Materials for Hydrogen Storage and Synthesis of New Materials by Hydrogenation
Serhiy Luzan
Doctoral Thesis Department of Physics Umeå University Umeå 2012

© Serhiy Luzan ISBN: 978-91-7459-463-8 Printed by KBC Service Center Umeå, Sweden, 2012

Abstract The search for new materials for hydrogen storage is important for the development of future
hydrogen energy applications. In this Thesis, it is shown that new materials with interesting
properties can be synthesized by the reaction of hydrogen with various nanocarbon precursors. The
thesis consists of two parts. The first part is devoted to studies of hydrogen storage in some metal-
organic frameworks (MOFs) and nanostructured carbon materials, while the second part describes
synthesis of new materials by the reaction of hydrogen gas with various carbon materials (i.e.
fullerene C60, single-walled carbon nanotubes (SWCNTs), and fullerene C60 encapsulated inside
SWCNTs (C60@SWCNTs)).
Hydrogen adsorption was measured for a set of Zn- and Co-based MOFs at near ambient
temperatures. MOFs synthesized using different metal clusters and organic connecting ligands
allowed to study effects of different surface area, pore volume, and pore shapes on hydrogen storage
parameters. Hydrogen adsorption values in the studied MOFs correlated well with surface area and
pore volume but did not exceed 0,75wt.%. Therefore, new methods to improve the hydrogen storage
capacity in MOFs were investigated. The addition of metal catalysts was previously reported to
improve significantly hydrogen storage in MOFs. In this thesis the effect of Pt catalyst addition on
hydrogen adsorption in MOF-5 was not confirmed. Contrary to previous reports, hydrogen
adsorption in MOF-5 mixed/modified with Pt catalysts had fast kinetics, correlated well with surface
area, and was on the same level as for unmodified MOF-5. New nanostructured carbon materials
were synthesized by the reaction between fullerene C60 and coronene/anthracene. Despite negligible
surface area these materials adsorbed up to 0,45wt.% of hydrogen at ambient temperatures.
The reaction of fullerene C60 with hydrogen gas was studied at elevated temperatures and
hydrogen pressures. In situ gravimetric monitoring of the reaction was performed in a broad
temperature interval with/without addition of metal catalysts (i.e. Pt and Ni). The reaction resulted in
synthesis of hydrogenated fullerenes C60Hx (with x≤56) followed by fullerene cage fragmentation
and collapse upon prolonged duration of hydrogen treatment. Possible mechanisms of C60
hydrogenation and fragmentation were discussed. It is demonstrated that reaction of SWCNTs with
hydrogen gas at elevated temperatures and hydrogen pressures can be used for nanotube opening,
purification from amorphous carbon, side-wall hydrogenation, and partial unzipping of SWCNTs.
Some graphene nanoribbons (GNRs) were synthesized as the result of SWCNTs unzipping. A
surprising ability of hydrogen to penetrate inside SWNTs and to react with encapsulated fullerene
C60 was demonstrated.
iii

Sammanfattning Sökandet efter nya material för vätelagring är viktigt för utveckling av framtida
väteenergitillämpningar. I denna avhandling visas att nya material med intressanta egenskaper kan
syntetiseras genom reaktion av väte med olika nanokolprekursorer. Avhandlingen består av två
delar. Den första delen ägnas åt studier av vätelagring i vissa metall-organiska fackverk (så kallade
MOFs) och nanostrukturerade kolmaterial medan den andra delen beskriver syntes av nya material
genom reaktion av vätgas med olika kolmaterial (dvs. fulleren C60, enkelväggiga kolnanorör
(SWCNTs) och fulleren C60 kapslat i SWCNTs (C60 @ SWCNTs)).
Väteadsorptionen mättes för ett antal Zn- och Co-baserade MOFs vid rumstemperatur. MOFs
syntetiserades med hjälp av olika metallkluster och organiska ligander för att studera effekterna av
olika yta, porvolym och porformer på vätelagringsparametrarna. Väteadsorptionsvärden i de
studerade MOFs korrelerade väl med yta och porvolym, men översteg inte 0,75wt.%. Därför
undersöktes nya metoder för att förbättra kapaciteten för vätelagring i MOFs. Tillsättning av
metallkatalysatorer har tidigare rapporterats avsevärt förbättra vätelagring i MOFs. I denna
avhandling kunde effekten av en tillsats av Pt-katalysator på väteadsorption i MOF-5 inte bekräftas.
I motsats till tidigare rapporter hade väteadsorption i MOF-5 blandad/modifierad med Pt-
katalysatorer snabb kinetik och korrelerade väl med arean, men var på samma nivå som för
omodifierad MOF-5. Nya nanostrukturerade kolmaterial syntetiserades genom reaktion mellan
fulleren C60 och coronene/antracene. Trots försumbar yta adsorberade dessa material upp till
0,45wt.% väte vid rumstemperatur.
Reaktionen av fulleren C60 med vätgas studerades vid förhöjda temperaturer och vätetryck. In
situ gravimetrisk övervakning av reaktionen utfördes i ett brett temperaturintervall med/utan tillsats
av metallkatalysatorer (dvs. Pt och Ni). Reaktionen resulterade i syntes av hydrogenerade fullerener
C60Hx (med x≤56) följt av fragmentering och kollaps av fullerenstrukturen vid förlängd varaktighet
av vätebehandlingen. Möjliga mekanismer för hydrering och fragmentering av C60 diskuteras. Det
har visats att reaktionen mellan SWCNTs och vätgas vid förhöjda temperaturer och vätetryck kan
användas för öppning av nanorör, borttagning av amorft kol, funktionalisering av sidoväggar och
partiell "blixtlåsöppning" av SWCNTs. Reaktionen kan också syntetisera grafen-nanoband (GNRs)
som en följd av att SWCNTs öppnas på längden. En överraskande stor förmåga för väte att tränga in
i SWNT och där reagera med inkapslade fullerenmolekyler C60 demonstrerades.
iv
List of publications The thesis is based on the following publications which are reprinted with the kind permission of the
publishers:
1. Thermal Decomposition of C60H18.
Luzan S.M., Cataldo F., Tsybin Y.O., Talyzin A.V. J. Phys. Chem. C, 2009, 113, 13133-
13138.
2. Hydrogen storage in Co- and Zn-based metal-organic frameworks at ambient temperature.
Luzan S.M., Jung H., Chun H., Talyzin A.V. Int. J. Hydrogen Energy, 2009, 34, 9754-9759.
3. High-temperature reactions of C60 with polycyclic aromatic hydrocarbons.
Martin N.M., Luzan S.M., Talyzin A.V. Chem. Phys., 2010, 368, 49-57.
4. Hydrogen adsorption in Pt catalyst/MOF-5 materials.
Luzan S.M. and Talyzin A.V. Micropor. Mesopor. Mater., 2010, 135, 201-205.
5. Reaction of C60 with Hydrogen Gas: In Situ Monitoring and Pathways.
Luzan S.M., Tsybin Y.O., Talyzin A.V. J. Phys. Chem. C, 2011, 115, 11484-11492.
6. Hydrogenation, Purification, and Unzipping of Carbon Nanotubes by Reaction with
Molecular Hydrogen: Road to Graphene Nanoribbons.
Talyzin A.V., Luzan S.M., Anoshkin I.V., Nashibulin A.G., Jiang H., Kauppinen E.I.,
Mikoushkin V.M. Shnitov V.V., Marchenko D.E., Noreus D. ACS Nano, 2011, 5, 5132-
5140.
7. Effect of Catalysts on the Reaction of C60 with Hydrogen.
Luzan S.M. and Talyzin A.V. Fullerenes, Nanotubes, and Carbon Nanostructures, 2012, 20,
319-323.
8. Hydrogen-Driven Collapse of C60 Inside Single-Walled Carbon Nanotubes.
Talyzin A.V., Luzan S.M., Anoshkin I.V., Nashibulin A.G., Jiang H., Kauppinen E.I. Angew.
Chem. Int. Ed., 2012, 51, 4435-4439.
v

Besides, some interesting results can be found in the following papers which were not included in
the thesis:
9. Pressure-Induced Insertion of Liquid Acetone into the Graphite Oxide Structure.
Talyzin A.V. and Luzan S.M. J. Phys. Chem. C, 2010, 114, 7004-7006.
10. Comment to the “Response to “Hydrogen adsorption in Pt catalyst/MOF-5 materials” by Li
et al [1]”.
Luzan S.M. and Talyzin A.V. Micropor. Mesopor. Mater., 2011, 139, 216-218.
11. Coronene Fusion by Heat Treatment: Road to Nanographenes.
Talyzin A.V., Luzan S.M., Leifer K., Akhtar S., Fetzer J., Cataldo F., Tsybin Y.O., Tai
C.W., Dzwilewski A., Moons E. J. Phys. Chem. C, 2011, 115, 13207-13214.
12. Temperature dependent structural breathing of hydrated graphite oxide in H2O.
Talyzin A.V., Luzan S.M., Szabo T., Chernyshev D., Dmitriev V. Carbon, 2011, 49, 1894-
1899.
13. Hydration of Graphite Oxide in Electrolyte and Non-Electrolyte Solutions.
Luzan S.M. and Talyzin A.V. J. Phys. Chem. C, 2011, 115, 24611-24614.
14. Phase Transitions in Graphite Oxide Solvates at Temperatures Near Ambient.
You S., Luzan S.M., Yu J., Sundqvist B., Talyzin A.V. J. Phys. Chem. Letters, 2012, 3(7),
812-817.
15. Effect of synthesis method on solvation and exfoliation of graphite oxide.
You S., Luzan S.M., Talyzin A.V. Submitted to Carbon.
vi

Table of contents 1 Introduction .................................................................................................................................. 1
1.1 An overview of hydrogen storage: problems and targets ..................................................... 1 1.2 Materials for hydrogen storage............................................................................................. 3
1.2.1 Hydrogen storage via physisorption............................................................................. 3 1.2.2 Hydrogen storage via spillover................................................................................... 11 1.2.3 Hydrogen storage via chemisorption.......................................................................... 14
1.2.3.1 Metal hydrides and complex hydrides.................................................................... 14 1.2.3.2 Hydrogen storage in fullerene C via chemisorption60 ............................................ 15
1.3 Synthesis of new materials by hydrogenation of C and CNTs60 ........................................ 19 1.3.1 Isolation of new hydrogenated fullerenes................................................................... 19 1.3.2 Synthesis of fragmented fullerenes and fullerene fragments...................................... 20 1.3.3 Hydrogenation of carbon nanotubes: functionalization and unzipping...................... 21 1.3.4 Hydrogenation of molecules (C ) encapsulated inside SWCNTs60 ............................. 22
2 Motivation for this work............................................................................................................. 24 3 Experimental section .................................................................................................................. 25
3.1 Synthesis of the materials ................................................................................................... 25 3.1.1 MOF-5 (synthesis of the raw material, mixed and “bridged” with Pt catalyst) ......... 25 3.1.2 Hydrogenation of fullerene C , SWCNTs, and C @SWCNTs60 60 ............................... 25 3.1.3 Reactions of fullerene C with anthracene/coronene60 ................................................ 26
3.2 Characterization techniques................................................................................................ 26 3.2.1 X-ray diffraction analysis ........................................................................................... 26 3.2.2 Nitrogen sorption analysis .......................................................................................... 28 3.2.3 Rubotherm gravimetric system................................................................................... 33 3.2.4 Thermogravimetric measurements ............................................................................. 35 3.2.5 Raman and IR spectroscopy. ...................................................................................... 36 3.2.6 Mass spectrometry...................................................................................................... 38
4 Results and discussion................................................................................................................ 40 4.1 Hydrogen adsorption in some Co- and Zn-based MOFs.................................................... 40 4.2 Hydrogen adsorption in MOF-5 doped/bridged with Pt-catalyst ....................................... 44 4.3 Hydrogen adsorption in nanocarbon materials prepared by the cycloaddition reaction of C with coronene and anthracene60 .................................................................................................. 49 4.4 Hydrogenation of C60 ......................................................................................................... 51
4.4.1 Hydrogenation of C as a function of the reaction temperature60 ................................ 51 4.4.2 Hydrogenation of C as a function of the reaction time60 ............................................ 54 4.4.3 C hydrogenation and fragmentation pathways60 ........................................................ 54 4.4.4 HPLC separation of hydrogenated fullerenes............................................................. 55 4.4.5 Hydrogenation of C with addition of metal catalysts60 .............................................. 56 4.4.6 Reversibility of C hydrogenation60 ............................................................................. 59 4.4.7 Thermal decomposition of C H60 18.............................................................................. 62
4.5 Hydrogenation of SWCNTs ............................................................................................... 63 4.6 Hydrogenation of fullerene C inside SWCNTs60 ............................................................... 68
5 Conclusions ................................................................................................................................ 71 6 Summary of the included papers and my contribution to these papers ...................................... 73
6.1 Paper 1 ................................................................................................................................ 73 6.2 Paper 2 ................................................................................................................................ 73 6.3 Paper 3 ................................................................................................................................ 73 6.4 Paper 4 ................................................................................................................................ 74
vii

6.5 Paper 5 ................................................................................................................................ 74 6.6 Paper 6 ................................................................................................................................ 75 6.7 Paper 7 ................................................................................................................................ 76 6.8 Paper 8 ................................................................................................................................ 76
7 Acknowledgements .................................................................................................................... 77 8 References .................................................................................................................................. 78
viii

List of Abbreviations: ACs – Activated carbons AC – Alternating current APPI FT-ICR – Atmospheric pressure photoionization Fourier transform ion cyclotron
resonance BCC – Body-centered cubic BET – Brunauer-Emmett-Teller BJH – Barrett, Joyner, and Halenda BTB – Benzene tribenzoate CCD – Charge coupled device CNTs – Carbon nanotubes CNTH – Carbon nanotube hydrogenated CVD – Chemical vapour deposition DFT – Density functional theory DMF – N,N’-dimethylformamide DOE – Department of energy DSC – Differential scanning callorimetry DTA – Differential thermal analysis FCC – Face-centered cubic FT-IR – Fourier transform infrared GAI – Generalized adsorption isotherm GCMC – Grand canonical Monte Carlo GNFs – Graphite nanofibers GNRs – Graphene nanoribbons HCl – Hydrochloric acid HPLC – High-performance liquid chromatography IR – Infrared IRMOFs – Isoreticular metal-organic frameworks IUPAC – International union of pure and applied chemistry MALDI TOF – Matrix-assisted laser desorption ionization time-of-flight MOFs – Metal-organic frameworks MS – Mass spectrometry NMR – Nuclear magnetic resonance PAHs – Polycyclic aromatic hydrocarbons Pt/AC – Platinum catalyst supported on activated carbon RT – Room temperature SEM – Scanning electron microscopy SWCNTs – Single-walled carbon nanotubes TEM – Transmission electron microscopy TGA – Thermo-gravimetric analysis XPS – X-ray photoelectron spectroscopy XRD – X-ray diffraction 1D/3D – 1 dimensional/3 dimensional
ix
1
1 Introduction
1.1 An overview of hydrogen storage: problems and targets
New alternative energy sources are required to replace fossil fuels, for example by wind and
solar energy. One of the actively explored concepts is to convert solar energy directly to hydrogen
and then to use hydrogen as an energy carrier and a fuel for e.g. cars. Considering that water covers
about 71% of the Earth surface we have almost an unlimited source of hydrogen which is an ideal
energy carrier. It has an extremely high gravimetrical energy density (142MJ/kg) which is at least
three times larger than the equivalent value for liquid hydrocarbons (47MJ/kg). Hydrogen as the fuel
is also environmentally friendly as the only exhaust product in both combustion and fuel cell
engines is water vapour. Therefore, hydrogen is an attractive candidate for replacement of petrol or
diesel in cars or other vehicles.
Hydrogen can be used as a fuel in cars with slightly modified combustion engines. However,
combustion engines are not a sustainable solution due to relatively low efficiency of ~25%. On
another hand, cars can be powered by fuel cells, electrochemical devices, which combine hydrogen
and oxygen to produce electricity. Fuel cells convert hydrogen in electricity with an efficiency of
50-60% and release only water and heat as side products. The main obstacle for widespread
application of fuel cells is the absence of sufficiently good and compact, light-weight hydrogen
storage systems which are capable of delivering hydrogen gas to a fuel cell at nearly room
temperature and at pressures not much higher than atmospheric pressure.
An average modern car equipped with a combustion engine needs approximately 30-35 liters of
petrol or diesel to travel 500km. The combined weight of the fuel and the tank is about 80kg. A car
equipped with a fuel cell engine would need about 5kg of hydrogen to travel the same distance. The
problem is that 5kg of hydrogen at normal conditions (room temperature and atmospheric pressure)
occupies ~56 000 liters of space which is equivalent to a balloon of 5m diameter1, 2
.
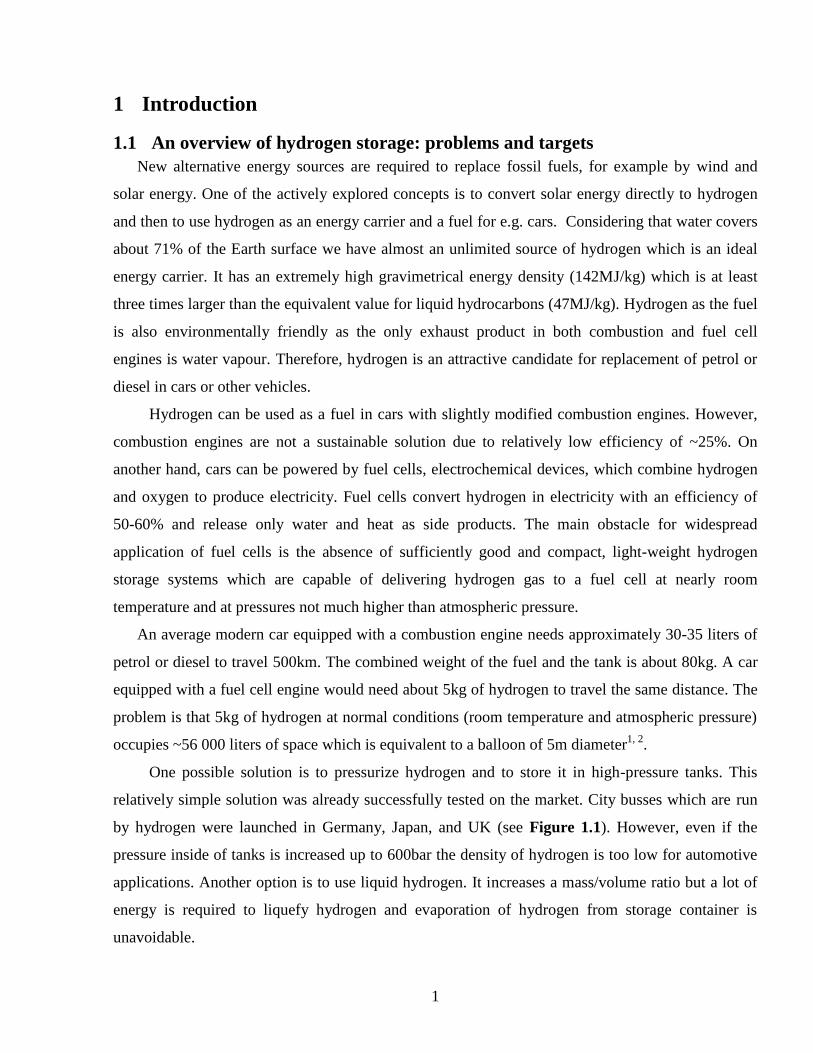
One possible solution is to pressurize hydrogen and to store it in high-pressure tanks. This
relatively simple solution was already successfully tested on the market. City busses which are run
by hydrogen were launched in Germany, Japan, and UK (see Figure 1.1). However, even if the
pressure inside of tanks is increased up to 600bar the density of hydrogen is too low for automotive
applications. Another option is to use liquid hydrogen. It increases a mass/volume ratio but a lot of
energy is required to liquefy hydrogen and evaporation of hydrogen from storage container is
unavoidable.
2
Figure 1.1. a) Schematic representation of a fuel cell vehicle3; b) a city bus with a fuel cell engine and
hydrogen as a fuel4.
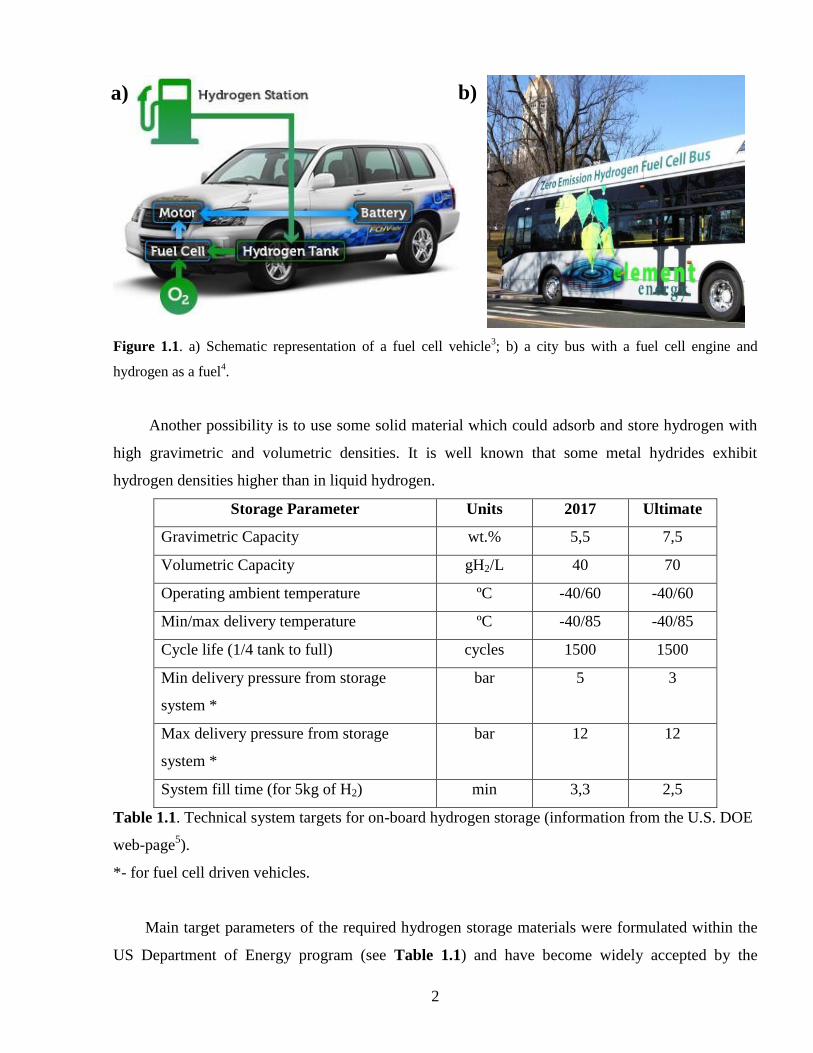
Another possibility is to use some solid material which could adsorb and store hydrogen with
high gravimetric and volumetric densities. It is well known that some metal hydrides exhibit
hydrogen densities higher than in liquid hydrogen.
Storage Parameter Units 2017 Ultimate
Gravimetric Capacity wt.% 5,5 7,5
Volumetric Capacity gH2/L 40 70
Operating ambient temperature ºC -40/60 -40/60
Min/max delivery temperature ºC -40/85 -40/85
Cycle life (1/4 tank to full) cycles 1500 1500
Min delivery pressure from storage
system *
bar 5 3
Max delivery pressure from storage
system *
bar 12 12
System fill time (for 5kg of H2) min 3,3 2,5
Table 1.1. Technical system targets for on-board hydrogen storage (information from the U.S. DOE
web-page5).
*- for fuel cell driven vehicles.
Main target parameters of the required hydrogen storage materials were formulated within the
US Department of Energy program (see Table 1.1) and have become widely accepted by the
a) b)
9

3
international scientific community. Current gravimetrical targets for hydrogen storage were set by
DOE in 2009 to reach 5,5wt.% by 2017.
Hydrogen storage materials could be divided into two classes depending on the mechanism of
hydrogen sorption: materials where adsorption is due to physisorption or due to chemisorption. In
case of physisorption, molecular hydrogen is weakly bound to the surface of the material by van der
Waals or hydrogen bonds. In case of chemisorption, H2 molecules dissociate into atomic hydrogen
which is then absorbed into the bulk forming stronger ionic or covalent bonds with the material. In
the next sections we will review various materials studied for hydrogen storage, discuss their
advantages and drawbacks, and list factors affecting hydrogen storage in those materials.
1.2 Materials for hydrogen storage
1.2.1 Hydrogen storage via physisorption
The physisorption mechanism suggests adsoption of molecular hydrogen on a surface via
relatively weak van der Waals bonding. Several characteristic features of physisorption can be
noted. The adsorption process is fast, i.e. the saturation is achieved within minutes after hydrogen
pressure is stabilized, and fully reversible. Hydrogen is released when pressure is lowered and is
adsorbed when pressure is increased again. Surface area is the main factor which controls hydrogen
adsorption capacity of the material. The more surface area which is accessible for sorbate molecules
the more sorbate molecules will be adsorbed on the sorbent surface. The most frequently studied
sorbents are activated carbons, carbon nanostructured materials (e.g. fullerenes, carbon nanotubes,
nanographene flakes), and metal-organic frameworks.
Carbon materials
Activated Carbons: activated carbons (ACs) is one of the most studied gas adsorption
materials and also shows some of the best performances for storage of hydrogen. ACs are
synthesized by carbonization of organic precursors followed by an activation step using e.g.
annealing in an oxidizing atmosphere or chemical treatment. Such synthesis procedure results in
materials with very high surface area (up to 3300m2/g) which have superior hydrogen adsorption
properties at 77 K. ACs were reported to adsorb about 6,0 wt.% of H2 at 40 bar pressure at 77 K6.
This experimental value is close to the maximal theoretically possible hydrogen adsorption value of
6,6 wt.% calculated for ACs1. Calculations were performed considering the maximum possible
theoretical concentration of hydrogen molecules on a graphene sheet (~0,4H/C) and considering
double side coverage of a graphene sheet by hydrogen. At ambient temperatures hydrogen
adsorption in ACs normally does not exceed 1wt.% 7.

4
Carbon nanotubes: carbon nanotubes (CNTs) discovered in 19918 attracted a lot of attention
as a promising material for hydrogen storage applications (see Figure 1.2a). Prior to hydrogen
adsorption measurements nanotubes are typically subjected to some treatment to make the inner part
accessible for gas penetration and to increase the accessible surface area. At liquid nitrogen
temperatures CNTs adsorb up to 8,0wt.% of H29. However, at ambient temperatures CNTs were
shown to store less than 1wt.% of H2 at pressures up to 100bar10, 11
. Experimental results are in good
agreement with the most recent theoretical calculations which showed that hydrogen adsorption in
those materials should not exceed 1wt.% at ambient temperature and moderate pressures12
.
Figure 1.2. a) Single-walled carbon nanotube; b) buckminsterfullerene C60.
A lot of research effort was recently concentrated on modification of CNTs with the aim of
improving their hydrogen storage properties. For example, it was shown both theoretically13
and
experimentally14
that defects induced on side-walls of CNTs improve their hydrogen adsorption
capacity. Several methods were suggested in order to make defect CNTs, for example acid
treatment15
, ball milling16
, plasma etching17
, and heat treatment in various environments (e.g.
ammonia, oxygen, open air)18, 19
were used.
It should be noted that many of early studies of hydrogen storage in CNTs (and some other
carbon materials) reported significantly overestimated values for gravimetric capacity which later
were proved to be erroneous due to various experimental errors. For example, Dillon et al (1997)
reported hydrogen adsorption in low purity single-walled CNTs at ambient temperature in the range
of 5-10wt.%20
. For graphite nanofibers (GNFs), one of the reports claimed values as high as 67wt.%
at 25ºC and 120bar of H2 pressure21
. This value of hydrogen adsorption is three times higher than
the hydrogen content in methane CH4 and suggests that about 12 hydrogen atoms are adsorbed on
a) b)

5
one carbon atom on the CNT surface which is, of course, impossible. The latter example emphasizes
that hydrogen adsorption measurements, which are performed according to procedures which are
very simple at a first glance, is a very delicate experiment which requires a lot of considerations to
avoid many different types of errors22
.
Fullerenes: in contrast to other carbon materials such as CNTs, ACs and graphite nanofibers
(GNFs), bulk fullerene C60 powder shows negligible values of BET surface area (see Figure 1.2b)23
.
Nevertheless, solid C60 (fullerite) is able to store some hydrogen but the mechanism of this storage is
more similar to intercalation than to physisorption. The face-centered cubic (FCC) structure of C60
has two kinds of interstitial sites: octahedral (d=4,12Å) and tetrahedral (d=2,24Å). The kinetic
diameter of a hydrogen molecule is 2,9Å24
which is less than the size of the octahedral holes.
Hydrogen molecules diffuse into the lattice of C60 without dissociation and occupy octahedral holes.
The kinetics of the diffusion process is more slow (could take tens of minutes) compared to normal
physisorption where equilibrium is achieved within minutes. Another typical feature is the absence
of a strong correlation of hydrogen storage capacity with temperature variations. The hydrogen
storage capacity of C60 is limited to one H2 molecule per octahedral void which results in about 0,1-
0,2wt.% of H2 observed over broad ranges of temperatures and pressure25-27
. Using high-energy ball
milling hydrogen adsorption was increased up to 0,7wt.% at room temperature and 300bar of
hydrogen pressure28
. It should be noted that along with improvement of hydrogen uptake authors
observed an increase of the surface area of ball-milled fullerene C60 from less than 1m2/g (below the
detection limit) up to 255m2/g after 48 hours of treatment and partial collapse of fullerene cage
structure.
Graphene: graphene is another possible candidate as a hydrogen storage material. At the
moment the only method which can be employed for synthesis of bulk amounts of powdered
graphene-like material is the thermal exfoliation of graphite oxide29
. It should be noted that
materials produced by this method consist mostly of graphite sheets with a thickness of 2-15
graphene layers. This material is very similar to ACs but has a smaller surface area of the order of
600-1000m2/g. The hydrogen adsorption in a graphene-like material with a surface area of 640m
2/g
was estimated as 0,72wt.% at 100bar and 298K which is on the same level as for ACs with
comparable surface area30
.
Metal-Organic Framework Materials (MOFs)
Probably the most promising materials for hydrogen adsorption via physisorption are MOFs.
MOFs are crystalline coordination polymers which consist of metal clusters connected by organic
linkers (see Figure 1.3)24
. Hydrogen adsorption properties of more than 200 MOFs were studied31
.
6
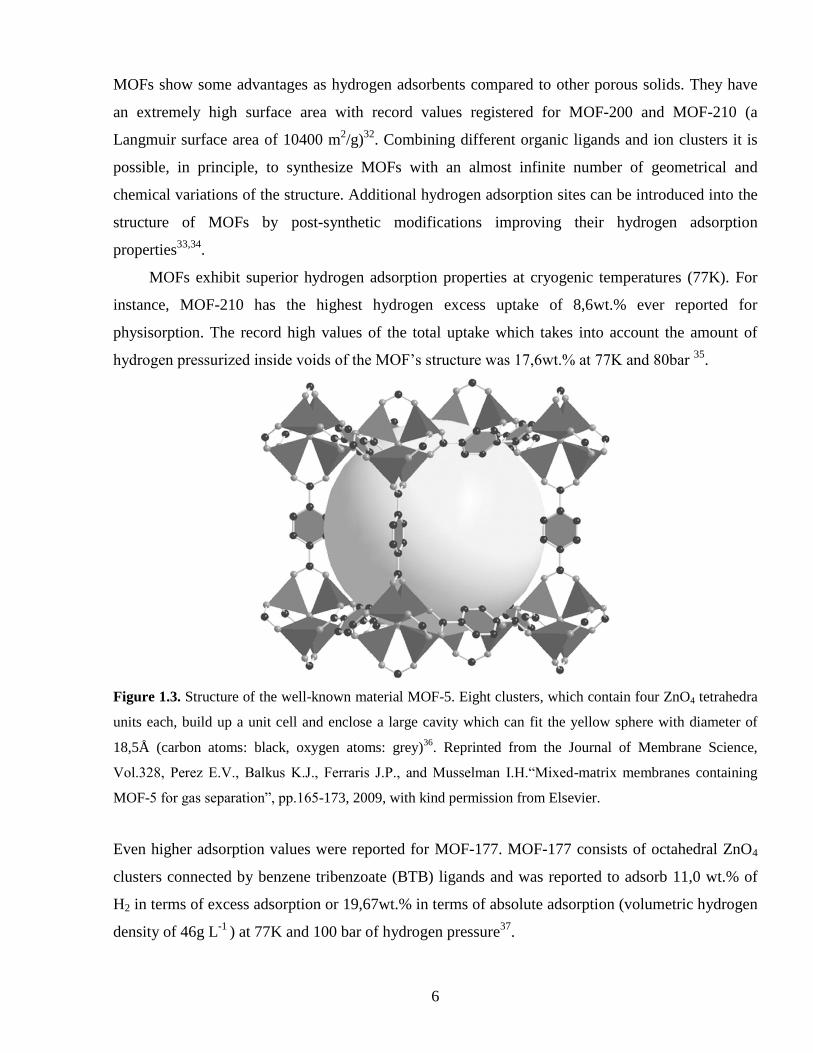
MOFs show some advantages as hydrogen adsorbents compared to other porous solids. They have
an extremely high surface area with record values registered for MOF-200 and MOF-210 (a
Langmuir surface area of 10400 m2/g)
32. Combining different organic ligands and ion clusters it is
possible, in principle, to synthesize MOFs with an almost infinite number of geometrical and
chemical variations of the structure. Additional hydrogen adsorption sites can be introduced into the
structure of MOFs by post-synthetic modifications improving their hydrogen adsorption
properties33,34
.
MOFs exhibit superior hydrogen adsorption properties at cryogenic temperatures (77K). For
instance, MOF-210 has the highest hydrogen excess uptake of 8,6wt.% ever reported for
physisorption. The record high values of the total uptake which takes into account the amount of
hydrogen pressurized inside voids of the MOF’s structure was 17,6wt.% at 77K and 80bar 35
.
Figure 1.3. Structure of the well-known material MOF-5. Eight clusters, which contain four ZnO4 tetrahedra
units each, build up a unit cell and enclose a large cavity which can fit the yellow sphere with diameter of
18,5Å (carbon atoms: black, oxygen atoms: grey)36
. Reprinted from the Journal of Membrane Science,
Vol.328, Perez E.V., Balkus K.J., Ferraris J.P., and Musselman I.H.“Mixed-matrix membranes containing
MOF-5 for gas separation”, pp.165-173, 2009, with kind permission from Elsevier.
Even higher adsorption values were reported for MOF-177. MOF-177 consists of octahedral ZnO4
clusters connected by benzene tribenzoate (BTB) ligands and was reported to adsorb 11,0 wt.% of
H2 in terms of excess adsorption or 19,67wt.% in terms of absolute adsorption (volumetric hydrogen
density of 46g L-1
) at 77K and 100 bar of hydrogen pressure37
.
7
At ambient temperatures, hydrogen adsorption in MOFs is relatively low and usually does not
exceed 1 wt.%24
. However, even with values of gravimetric storage capacity on the level of 1 wt.%
MOFs are among the best of the materials which store hydrogen by the physisorption mechanism.
The gravimetric capacity of MOFs is as good as that of the best ACs 7 and CNTs
10, but their
volumetric properties are far superior. In MOFs a high surface area is combined with a bulk density
comparable to the real density which is a strong advantage compared to ACs. The ratio between the
real and bulk density shows the accessibility of the structure for guest molecules. In ACs, extremely
high dispersion results in a low bulk density, tens of times below the real density of graphite.
Therefore, a real tank filled with crystalline MOF powder will be able to store more hydrogen
compared to highly dispersed activated carbons.
Very strong research efforts have been recently focused on improving hydrogen storage in
MOFs at ambient temperatures which requires an understanding of the main factors influencing
hydrogen adsorption. Some factors are the same as for most other materials where hydrogen is
stored due to physisorption while other factors are inherent only for MOFs.
Hydrogen bonding strength: possibly the most crucial factor is the bonding strength of H2
molecules to the adsorbent surface which is proportional to the isosteric heat of adsorption. H2
molecules interact with the surface of MOFs via the weak van der Waals force which results in low
isosteric heat of adsorption in the range of 4-7 kJ*mol-1
31
. According to calculations an isosteric
heat of hydrogen adsorption in the range of 22-25 kJ*mol-1
is needed to store ~7wt.% of hydrogen at
298K and 30bar of hydrogen pressure38
. Therefore, in order to achieve the desired hydrogen uptake
in MOFs hydrogen bonding strength should be enhanced by a factor of 3-4. Several recently
suggested ideas on how to improve the strength of hydrogen interaction with MOFs are the
following: reducing pore size, introducing unsaturated metal adsorption sites, doping MOFs with
alkali metals, changing organic ligands and metal clusters, and using the hydrogen spillover effect.
All those methods have their cons and pros which will be discussed in later sections.
Surface area: an important factor influencing hydrogen adsorption in porous materials is
surface area. Hydrogen adsorption in MOFs is higher for MOFs with larger BET surface area (see
Figure 1.4). The relation between hydrogen uptake and BET surface area in MOFs is almost linear
at 77K and high hydrogen pressures. A similar linear relation between hydrogen uptake and BET
surface area of MOFs is also observed at room temperatures, but to observe it MOFs need a proper
activation. The proper activation procedure is needed to remove solvent molecules and to produce
unsaturated open metal sites which are important for hydrogen adsorption at room temperatures39
.

8
Pore volume: another important factor which influences hydrogen adsorption due to
physisorption is pore volume. Hydrogen adsorption in MOFs correlates with total pore volume
though this correlation is more pronounced at 77K24, 40
. Theoretical calculations performed for a
Figure 1.4. Excess hydrogen uptake in MOFs at 77K (left figure) and at room temperatures (right figure)
plotted versus BET surface area39
. Reprinted with permission from Chemical Reviews, Vol.112, Suh MP.,
Park HJ., Prasad TK. et al. “Hydrogen storage in metal-organic frameworks”, pp. 782-835, Copyright 2012
American Chemical Society.
family of MOFs with the same framework topology and the same surface chemistry but with
different pore sizes showed that three different adsorption regimes exist at 77K: at low pressure,
hydrogen uptake correlates with the heat of adsorption; at intermediate pressure, uptake correlates
with the surface area; while at the highest pressures uptake correlates with pore volume41
. A good
example of how different factors determine hydrogen adsorption in different pressure ranges can be
seen in Figure 1.5.
Pore geometry: the shape and size of pores are also crucial for hydrogen adsorption. Due to
the overlap of the potential fields from both sides of the pore walls, small pores should have higher
affinity towards hydrogen and thus higher hydrogen uptake capacity comparing to pores with larger
diameter. This theoretical assumption was confirmed by experimental results. Using thermal
desorption measurements Panella et al showed that hydrogen desorbs from MOFs with smaller pore
sizes at higher temperatures than from MOFs with larger pore sizes42
. According to theoretical
calculations, carbon-based materials with a pore width of 6Å (for slit pore geometry) have higher
hydrogen uptake at very low pressures while materials with a larger pore width of 9Å are more

9
appropriate for hydrogen storage at higher pressures (the kinetic diameter of a hydrogen molecule is
2,9Å)24
. There are few possible methods to reduce pore sizes in MOFs. One method is to introduce
Figure 1.5. Theoretical values of hydrogen uptake calculated for different MOFs: a) at 0,1bar plotted versus
isosteric heat of adsorption; b) at 30bar plotted versus accessible surface area; c) at 120bar plotted versus pore
volume41
. Reprinted with permission from the Journal of Physical Chemistry B, Vol.110, Frost H., Duren T.,
Snurr R.Q. “Effects of surface area, free volume, and heat of adsorption on hydrogen uptake in metal-organic
frameworks”, pp. 9565-9570, Copyright 2006 American Chemical Society.
bulky groups into organic ligands. However, in this case the improved gravimetric adsorption
properties are accompanied by an increased density of the framework which results in only a
negligible improvement of hydrogen uptake43
. Another method to reduce pore sizes is catenation, or
penetration, of two or more identical frameworks44
. This technique was proven to work at low
pressure and 77K43
, but GCMC simulations predicted that it would not work at high pressures due to
a reduced free volume45
. Via impregnation of MOFs with organic molecules such as fullerene C60,
free volume within pores can be reduced and additional hydrogen adsorption sites can be introduced
inside the framework. Theoretical calculations performed for IRMOF-8 and IRMOF-10 impregnated
with C60 showed that those materials have higher hydrogen uptake at 77K and pressures up to 10bar
comparing to pristine MOFs46
. In fact, synthesis of MOF-177 impregnated with C60 was reported in
the literature but no hydrogen adsorption data is available for this material47
.
Adsorption sites in MOFs: inelastic neutron scattering and neutron diffraction studies
revealed that MOFs have two groups of hydrogen adsorption sites: inorganic clusters and organic
ligands48, 49
. At lower pressures hydrogen adsorption starts on metal clusters and when these sites are
saturated (at higher pressures) adsorption continues on organic linkers. This was verified
experimentally in MOFs with different compositions of metal clusters and variations of surface
area50
. For example, a study by Hirscher and Panella revealed that at low pressures (up to approx. 6
bar) a Cu-based MOF material has a greater hydrogen uptake than a Zn-based MOF-5 material due

10
to a stronger interaction with hydrogen. At higher pressures the adsorption behavior is changed, and
due to its higher surface area MOF-5 exhibits a greater hydrogen storage capacity (see Figure 1.6).
The importance of inorganic metal clusters for hydrogen adsorption was also demonstrated by Botas
et al using MOF-5 with part of the Zn substituted by Co atoms51
.
Figure 1.6. Hydrogen adsorption isotherms of MOF-5 (squares) and Cu-BTC (dots) at 77K. The
experimental data were fitted with a Langmuir-type equation50
. Reprinted from Scripta Materialia, Vol.56,
Hirscher M. and Panella B. “Hydrogen storage in metal-organic frameworks”, pp.809-812, 2007, with kind
permission from Elsevier.
It is important to note that adsorption sites on metal clusters need to be carefully activated by
complete removal of the solvent molecules which contaminate the material after synthesis52
.
Another group of hydrogen adsorption sites is associated with organic ligands. There is no
single opinion on how the structure and the chemical composition of organic ligands influence
hydrogen adsorption in MOFs. Some theoretical studies showed that larger aromatic ligands can
improve hydrogen adsorption53
while some other theoretical studies showed that the increased
weight of MOFs due to introduction of heavy organic ligands would have a negative effect on
hydrogen adsorption54
. The latter assumption was confirmed by experimental data. Rowsell et al
performed hydrogen uptake measurements on a series of MOFs obtained from MOF-5 by addition
of functional groups (such as -Br, -NH2, -C2H4-) to connecting ligands43
. They did not observe any
correlations between functionalities introduced into ligands and hydrogen uptake.

11
Summarizing this section, the most important factors which define hydrogen storage capacity
of MOFs at ambient temperature are surface area and pore volume while other factors are mostly
important at cryogenic temperatures.
1.2.2 Hydrogen storage via spillover
The hydrogen spillover effect suggests dissociation of molecular hydrogen into atomic
hydrogen over metal catalyst particles and subsequent migration of atomic hydrogen to support
materials. The hydrogen spillover process is a well-known phenomenon in catalysis reactions55
.
Transition metals with nearly filled d-shells (e.g. Ni, Pt, Pd) are normally used as catalysts to initiate
hydrogen spillover56
. For the first time hydrogen spillover was observed in hydrogenation of
ethylene which proceeded much faster if the Pt/SiO2 catalyst was used57
. In later studies hydrogen
spillover was observed in hydrogenation of the Pt-doped activated carbon58
. It should be noted that
the hydrogen spillover effect is typically observed at elevated temperatures in the range of 150-
400ºC.
Figure 1.7. a) Schematic representation of the hydrogen spillover process in MOFs mixed (top picture) or
bridged (bottom picture) with Pt/AC catalyst; b) hydrogen adsorption measured for pristine MOF-5(empty
squares), MOF-5 mixed with Pt/AC catalyst (filled diamonds), and MOF-5 bridged with Pt/AC catalyst
(filled triangles)59
. Reprinted with permission from the Journal of American Chemical Society, Vol.128, Li
Y. and Yang RT. “Hydrogen storage in metal-organic frameworks by bridged hydrogen spillover”, pp. 8136-
8137, Copyright 2006 American Chemical Society.
In the early 90s a few reports were published in which hydrogen spillover in catalytic reactions
was observed at near ambient temperatures, e.g. in hydrogenation of benzene and in hydrogenation
of TiO2 samples60, 61
. In recent years the concept of hydrogen spillover was actively introduced into
the hydrogen storage field by the group of Prof. R.T Yang for various adsorbents doped with metal
a) b)

12
catalysts (see Figure 1.7a). They reported the improvement of hydrogen adsorption by the factor of
1,5-4 in ACs62
, CNTs63
, GNFs56
, zeolites64
, and graphene65
doped with metal catalysts.
In 2006 this group reported a remarkable increase of hydrogen adsorption for MOF materials
with catalyst added by simple grinding66
, and the next study from the same group reported an even
further increased hydrogen adsorption by improving the contact between the metal catalyst and the
adsorbent67
. To improve the contact a precursor (usually glucose or sucrose) is carbonized forming
carbon bridges between the source of spillover and the adsorbent. Using this relatively simple
“bridging” technique the group of Prof. R.T. Yang reported a hydrogen adsorption of 3wt.%
measured in MOF-5 modified with Pt/AC catalyst (at ambient temperatures and 100bar of H2
pressure). This represents an impressive improvement of hydrogen adsorption by a factor of 7,5
comparing to pristine MOF-559
while an improvement by a factor of ~3,3 was reported for the
simple mixture of MOF-5 with Pt/AC catalyst66
.
These studies demonstrated some unique features of spillover related to hydrogen
adsorption/desorption which make it rather different compared to hydrogen adsorption via
physisorption, and the difference was considered to be specific for the spillover mechanism.
Hydrogen adsorption in catalyst doped MOFs exhibited linear isotherms (for pressures at least up to
100bar, see Figure 1.7b)59
, slow adsorption kinetics (see Figure 1.8)68
, and showed no correlation
between hydrogen uptake and surface area/pore volume of the adsorbent68
.
Figure 1.8. Kinetics of hydrogen adsorption in different IRMOF-8 samples bridged with Pt/AC catalyst at
room temperature (adsorption via hydrogen spillover)68
. Reprinted with permission from the Journal of
American Chemical Society, Vol.131, Tsao C.-S., Yu M.-S., Wang C.-Y., et al. “Nanostructure and hydrogen
spillover of bridged metal-organic frameworks”, pp. 1404-1406, Copyright 2009 American Chemical
Society.

13
In a recent article the group of Prof. R.T. Yang claimed that the metal catalyst was not needed
at all to observe hydrogen spillover in exfoliated graphite oxide (called graphene in this study)69
. An
enhancement of hydrogen adsorption compared to activated carbons with similar surface area
together with slow adsorption kinetics was explained by hydrogen spillover on edge sites or
structural vacancies in graphene sheets. However, several other studies performed on exfoliated
graphite oxide did not confirm this effect30, 70
.
Moreover, very few reports with independent confirmation of increased hydrogen adsorption
in metal doped MOFs are available after 6 years following the initial report68, 71-73
. That is somewhat
surprising taking into account the very high levels of reported hydrogen adsorption which meet
current DOE targets. However, in 2009 another independent study68
confirmed the reports from
Prof. R.T. Yang's group and provided us with motivation to reproduce and further develop
hydrogen storage materials based on MOFs and the spillover mechanism.
In some part the later study seems to contradict the earlier one. For example, the group of Prof.
R.T. Yang reported that the enhancement and the total values of hydrogen adsorption via spillover in
various carbon materials are proportional to the surface area of those materials, i.e. materials with
higher surface area have higher hydrogen adsorption via the spillover mechanism63
. On the contrary,
Tsao et al reported that materials with a more defective structure, i.e. with smaller surface area, have
higher hydrogen adsorption via spillover compared to the same type of materials with larger surface
area68
.
Following the initial claims on the significant increase of hydrogen adsorption in MOFs via
spillover59, 66, 73
more and more reports appear in the literature where authors have failed to observe
any spillover features measuring hydrogen adsorption in materials prepared according to seemingly
the same synthesis procedures74, 75
. The reproducibility of hydrogen adsorption on carbon materials
was also seriously questioned in some recent studies. For example, the group of Prof. R.T. Yang
claimed that hydrogen spillover is a reversible process62, 66
. During desorption hydrogen atoms were
assumed to migrate back to metal catalyst particles where they supposedly recombined into
molecular hydrogen (i.e. reverse “spillover”), and desorbed76
. In later studies it was shown that new
C-H bonds were indeed formed during hydrogen adsorption in some carbon materials doped with
metal catalysts, but elevated temperatures in the interval of 250-300ºC were needed to break those
bonds and to desorb hydrogen56, 77
. Therefore, according to those reports hydrogen spillover at
ambient temperatures led to the irreversible hydrogen storage, and the reversible hydrogen storage
was entirely due to physisorption of molecular hydrogen.

14
The theoretical model proposed by the group of Prof. R.T. Yang in order to explain reversible
hydrogen adsorption in MOFs via the spillover mechanism was also subjected to strong
criticism76,78,79
. Psofogiannakis and Froudakis showed that H atoms must overcome a tremendous
energy barrier (>60kcal/mol) in order to migrate from Pt to the graphite surface and therefore this
process is very unlikely to happen at room temperature80
. This theoretical result agrees well with
some experimental data which showed that there was no transfer of atomic hydrogen from metal
catalyst particles to the adsorbent surface during hydrogen adsorption measurements in Pt-doped
GNFs81
. Moreover, it was shown that the net hydrogen adsorption measured on Pd-loaded activated
carbons was the sum of atomic hydrogen chemisorbed on Pd clusters and molecular hydrogen
physisorbed on the activated carbon surface82
.
Summarizing this chapter, many intriguing results in the field of hydrogen storage were
reported for various adsorbents (MOFs, ACs, zeolites, CNTs, GNFs etc) doped with metal catalysts,
and some attempts were made to explain those results using the concept of hydrogen spillover83
. It
should be noted that some hydrogen adsorption results reported in this field are very close to DOE
targets, e.g. hydrogen adsorption of 4wt.% was reported for Pt-modified IRMOF-859
. However, very
few independent confirmations of these hydrogen adsorption results were available at the moment
when we started to work in this field, some experimental results being questioned and actively
debated. The factors affecting hydrogen adsorption via the spillover mechanism as well as the very
existence of this effect at room temperatures were not clear. Therefore, more studies in this field
were required to clarify many questions. In particular, we intended to verify the effect of metal
catalyst nanoparticles on hydrogen storage in MOF materials and to clarify the possibility of using
the room temperature spillover mechanism for hydrogen adsorption/desoprtion.
1.2.3 Hydrogen storage via chemisorption
1.2.3.1 Metal hydrides and complex hydrides
Metal hydrides are among the most common materials for hydrogen storage and represent an
extremely broad research field at the moment. Hydrogen can chemically react with some solids
forming covalent or ionic bonds, i.e. be stored via chemisorption. Most common materials
considered for hydrogen storage are various metal hydrides (e.g. hydrides of elemental metals and
complex hydrides). Hydrides of light metals such as Li, Be, Na, Mg, B, and Al are especially
attractive due to their high gravimetric capacity for hydrogen storage. One of the most studied metal
hydrides, magnesium hydride, MgH2, shows a high gravimetric H2 capacity of 7,7 wt.% and good
reversibility84
. However, the main disadvantages of MgH2 as well as of most other metal hydrides

15
are the high temperature of hydrogen release, slow desorption, and a high reactivity towards air and
oxygen. For instance, release of hydrogen from MgH2 was observed upon heating at 300ºC and
1bar H285
. It is possible to lower the hydrogen release temperature (by ~40-100ºC) using e.g.
strongly dispersed material84,86
.
Some of the most interesting materials studied for hydrogen storage during the last decade are
complex hydrides. Sodium, lithium, and beryllium, which are the only metallic elements lighter than
magnesium, can form solid-state compounds with hydrogen with extremely high hydrogen content
(e.g. 18 wt.% for LiBH4). Alanates and borohydrides of various compositions are the most typical
representatives of this group. Disadvantages of hydrogen storage in complex hydrates are relatively
high temperatures of hydrogen release, slow kinetics, and problems with re-hydrogenation.
Summarizing this section, metal hydrides and complex hydrides have high contents of
hydrogen, but high hydrogenation/dehydrogenation temperatures, slow kinetics, and degradation
upon successive adsorption/desorption cycling are the main problems which needs to be solved for
hydrogen storage applications.
1.2.3.2 Hydrogen storage in fullerene C60 via chemisorption
Fullerene C60 has also been considered as a possible material for hydrogen storage
applications. For example, the reaction of fullerene C60 with hydrogen gas was actively studied
within the program sponsored by USA DOE87, 88
.
The C60 molecule has a ball-shaped cage structure (see Figure 1.2) as discovered by Kroto and
Smalley in 198589
. Hydrogen can react with fullerene C60 by the opening C=C double bonds and
formation of covalent C-H bonds. As a result, hydrogenated fullerenes (also called fulleranes) with
composition C60Hx are formed where X is always an even number of hydrogen atoms.
Theoretically, a maximum of 60 hydrogen atoms could be attached both to the inner
(endohedrally) and outer (exohedrally) surfaces of the fullerene cage. The composition C60H60
would correspond to 7,7wt.% of H2, but it was never observed experimentally. Experimental
observations of C60 hydrogenation are also limited only to exohedral attachment of hydrogen atoms
while experimental evidence for the endohedral type of covalent functionalization is yet to be found.
Fulleranes can be synthesized by numerous methods such as hydroboration90
,
hydrozirconation91
, transfer hydrogenation92
, electrochemical reduction93
, reduction by Zn-HCl in
toluene solution94
, chemical reduction with diimides95
, hydrogen radical-induced hydrogenation96
,
and photo-induced electron transfer97
. However, the most important method for production of

16
fulleranes in bulk amounts is a direct reaction of fullerene C60 with hydrogen gas at elevated
temperatures and pressures98
.
Hydrogenation of C60 by hydrogen gas was observed for the first time by Petrie et al99
. As it
was believed that only ionized fullerenes could react with hydrogen gas, iodoethane was used to
promote ionization of C6096
. In later studies it was shown that hydrogenation of C60 using hydrogen
gas does not require any catalyst if the reaction is performed at elevated conditions. The typical
temperature range required for hydrogenation of C60 is 350-450ºC100-107
at a hydrogen pressure
range of 5-120bar100-107
.
Figure 1.9. Fullerene C60 with different degree of hydrogenation: pristine C60 (1); medium degree of
hydrogenation (2); highly hydrogenated C60 (3); products of hydrogenation-induced collapse of fullerene
molecules (4) 108
. Reprinted from the book by Cataldo F. and Iglesias-Groth S. “Fulleranes: the hydrogenated
fullerenes”, pp.89, 2010, with kind permission from Springer Science and Business Media.
Hydrogenation of C60 results in drastically changed physical properties: pristine C60 is black in
color and opaque, while highly hydrogenated fullerenes become white and transparent (see Figure

17
1.9)108
. Pristine C60 is a semiconductor whereas highly hydrogenated fullerenes are insulators108, 109
.
Fulleranes are also chemically more inert compared to pristine C60 due to saturation of the C=C
double bonds suitable for functionalization. Moreover, the addition of H atoms results in significant
changes in the shape of the fullerene molecule (see Figure 1.10).
The high gravimetric and volumetric capacity of hydrogen is an advantage of fulleranes.
However, the relatively high temperatures required for hydrogenation and hydrogen release, as well
as slow kinetics of hydrogenation, are the main obstacles for application of fulleranes as hydrogen
storage materials100
. Using proper catalysts could be a possible way to solve these problems.
Various metals such as Ni, Pd, Pt, or intermetallic compounds were tested previously in attempts to
lower the hydrogenation temperature for C60100,110,111
. Using these catalysts the hydrogenation
temperature of C60 can be lowered by ~50-100ºC. Moreover, addition of metal catalysts significantly
improves hydrogenation kinetics, e.g. addition of Pt catalysts was found to improve the reaction rate
by approximately ten times for a reaction performed at 400ºC and 50 bar H2 pressure112, 113
.
However, the temperature of hydrogenation remains to be too high even if catalysts are used.
Figure 1.10. Hydrogenated fullerenes:
a) C3v isomer of C60H18114
. Reprinted with permission from Organic Letters, Vol.7, Wågberg T. et al.
“Selective synthesis of the C3v isomer of C60H18”, pp. 5557-5560, Copyright 2005 American Chemical
Society.
b) C3i isomer of C60H36 115
. Reprinted with permission from the Journal of Physical Chemistry B, Vol.97, Hall
L.E., McKenzie D.R., Attala A.M. et al. “The structure of hydrogenated fullerene (C60H36)”, pp. 5741-5744,
Copyright 1993 American Chemical Society.
a) b)

18
Nevertheless, hydrogenation of C60 remains to be a very intensively developing research field.
Recently, Schur et al reported synthesis of fulleranes with an extremely high hydrogen content of
8,2wt.% where 7,7wt.% (corresponds to an average composition of C60H60) of hydrogen was
covalently bonded to the C60 cage and 0,5wt.% of hydrogen was adsorbed in voids of the
structure116
. It should be noted that these authors did not consider possible fullerane fragmentation
which is likely to happen upon extensive hydrogenation and would lead to formation of a mixture of
polycyclic aromatic hydrocarbons (PAHs)103, 104
.
Materials which are considered for hydrogen storage applications must release hydrogen
during dehydrogenation. However, dehydrogenation of fulleranes is much less studied compared to
hydrogenation of C60. Highly hydrogenated fulleranes (C60Hx, where x> 36) are relatively unstable
and partial collapse of the structure is observed already upon extensive hydrogenation. Therefore, it
is expected that dehydrogenation would lead to even more pronounced fullerane decomposition.
This assumption was confirmed by experimental results 106, 117
. However, dehydrogenation was
mainly studied for very complex mixtures of C60Hx which consisted of fulleranes with a broad
variation of hydrogen content87
. Fulleranes with a lower content of hydrogen, e.g. C60H18, are
expected to have higher stability against thermally induced decomposition. For instance, a
hydrofullerene mixture containing approximately 3,5wt.% of hydrogen was reported to release
hydrogen reversibly 100
. In order to verify reversibility of hydrogenation for fulleranes with lower
hydrogen content dehydrogenation experiments must be carried out on samples containing a single
isomer of C60Hx (where 18<x<36).
Very promising results which will possibly revive interest in fullerenes as hydrogen storage
material were recently published by Teprovich et al who studied hydrogen storage in C60 mixed with
lithium hydride118
. The new composite material had a reversible hydrogen storage of up to 5wt.%
depending on the C60/Li molar ratio. Moreover, hydrogenation had much faster kinetics and lower
desorption temperatures (~270ºC comparing to 500-600ºC reported for ordinary fulleranes). Those
results open possibilities for synthesis of new materials for hydrogen storage which are based on
simple mixtures of metal hydrides with C60.
Hydrogenation of C60 was extensively studied over the past 20 years. The research in this field
resulted in the synthesis of many new and interesting materials which could be of interest from
many different points of view and their importance is not limited only to hydrogen storage
applications There is also a general fundamental interest in more detailed studies of the
hydrogenation of fullerenes which is the subject of next section.
19
1.3 Synthesis of new materials by hydrogenation of C60 and CNTs
1.3.1 Isolation of new hydrogenated fullerenes
Besides hydrogen storage applications, there is a general interest in more detailed studies of
fullerene C60 hydrogenation which could lead to synthesis of new materials. Hydrogenation of C60
normally results in a very complex mixture of fulleranes with different content of hydrogen103
while
only few fulleranes, mostly with low hydrogen content, were so far isolated and
characterized114,119,120
. The two most studied fulleranes synthesized successfully are C60H18 and
C60H36 92, 114, 121
. No other fulleranes C60Hx with x>18 were so far isolated in a pure state. Another
problem in synthesis and separation of highly hydrogenated fullerenes is the high number of
possible isomers with the same C60Hx composition. For instance, the number of possible C60H36
isomers is 6*1014
122
out of which over 100 isomers were summarized by Clare and Kepert123
. In
fact, C60H36 was usually obtained as a mixture of several isomers124
.
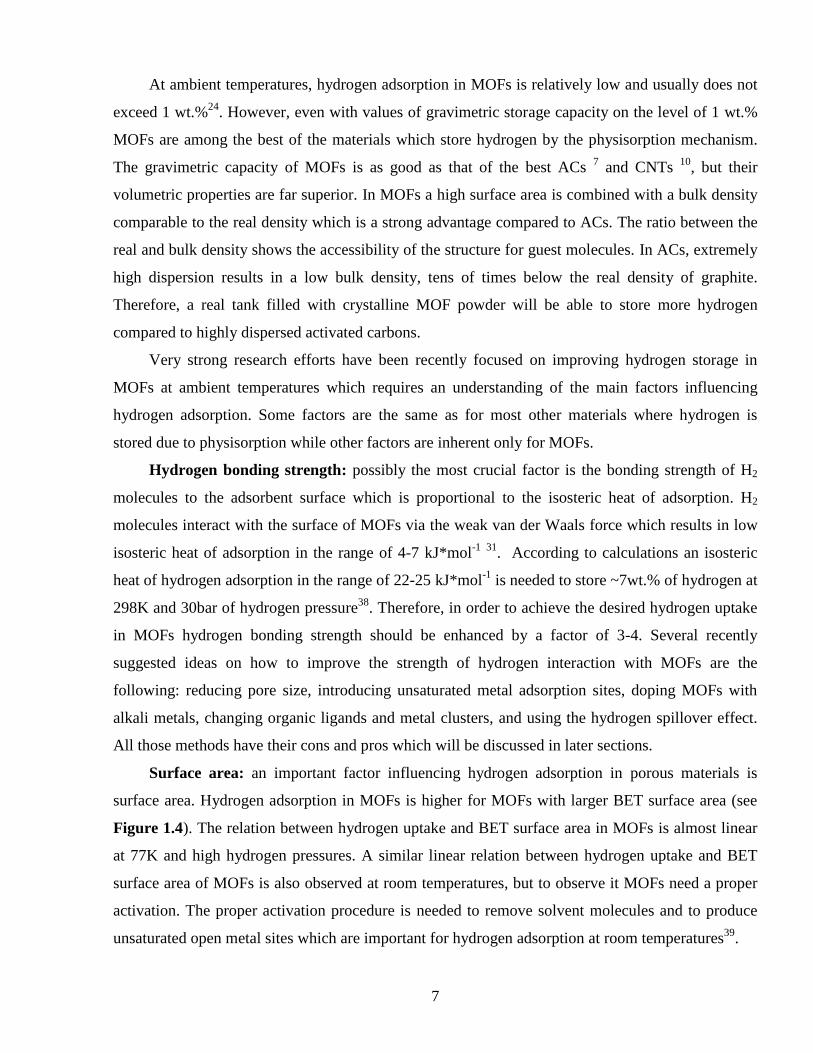
Figure 1.11. HPLC separation of a fulleranes mixture using acetonitrile-toluene mixed with different ratios
as a mobile phase: a) 15:85; b) 25:75; c) 35:65125
. Reprinted from Chromatographia, Vol.48, Bucsi I., Szabo
P., Aniszfeld R., et al. “HPLC separation of hydrogenated derivatives of buckminsterfullerene”, pp.59-64,
1998, with kind permission from Springer Science and Business Media.
Liquid chromatography is a very efficient tool to separate different fullerenes (e.g. C60. C70,
C82 etc) from pristine mixtures obtained e.g. by arc discharge method. However, fulleranes are

20
usually produced as even more complicated mixtures with tens of various molecules of slightly
different compositions. Only few attempts to isolate fulleranes other than C60H18 and C60H36 are
available in literature. It is known that fulleranes are separated in a high-performance liquid
chromatography (HPLC) column according to the number of H atoms attached to the cage: highly
hydrogenated C60 elute first while fulleranes with lower hydrogen content show longer retention
time125
. Due to high complexities of fulleranes mixtures (consist of fulleranes with various degrees
of hydrogenation or of different isomers of the same C60Hx composition) the chromatographic bands
overlap making isolation of pure fractions impossible (see Figure 1.11).
Optimization of HPLC separation seem to be a very promising method for isolation of pure
fulleranes. However, it is desirable also to synthesize less complex mixtures of fulleranes to ensure
easier separation. The ideal solution would be to find methods for direct synthesis of fulleranes with
a certain composition, e.g. by variation of synthesis conditions (temperature, hydrogen pressure,
hydrogenation time). For instance, synthesis of a C3v isomer of C60H18 with 95% purity was
achieved in our group earlier by direct hydrogenation of C60 at 400ºC and 100bar of hydrogen
pressure and a certain duration of treatment (see Figure 1.10)114
. Synthesis of highly hydrogenated
fulleranes can be expected in the future choosing appropriate synthesis conditions and combining
them with advanced HPLC methods.
1.3.2 Synthesis of fragmented fullerenes and fullerene fragments
Recent studies performed in our group revealed that prolonged hydrogenation at extreme
conditions leads to fullerane break up by removal of several carbon atoms off the cage thus forming
fragmented fulleranes. Formation of fragmented fulleranes is possible due to saturation of dangling
bonds by hydrogen atoms and stabilization of the fragmented structure by hydrogen103
. Even more
prolonged hydrogenation leads to complete collapse of the fullerane structure and to formation of
PAHs mixtures. Hydrogen driven collapse of fullerene C60 was proposed by Talyzin et al as a new
method to synthesize various unusual PAHs126
. One possible example of such an unusual molecule
is the “buckybowl”, cup-like non-planar hydrocarbon molecules which recently attracted strong
attention 127
. Those unusual molecules could possibly be used as precursors for the synthesis of
CNTs with certain chiralities, e.g. pentaindenocorannulene C44H18 was proposed as an attractive
precursor for synthesis of “armchair” [5,5] SWCNTs (see Figure 1.12)128
.
Buckybowls are synthesized by bottom-to-top approach using planar precursor molecules129
.
This synthesis procedure is complicated, does not have high yield, and result in the synthesis of
microgram amounts of buckybowls. On the other hand, buckybowls can be considered as large

21
fragments of fullerene C60 molecules. Understanding of hydrogen driven collapse of C60 and using it
in a controlled way would open a possibility for synthesis of buckybowl molecules in bulk amounts.
Figure 1.12. Examples of some buckybowl molecules: 1) corranulene C20H10130
; 2) sumanene C21H12127
; 3) a
C40H10 molecule which can be considered as the simplest capped carbon nanotube129
; 4)
pentaindenocorannulene C44H18128
. Reprinted with permission from the Journal of American Chemical
Society, Vol.133, Wu T.-C., Hsin H.-J., Kuo M.-Y., et al. “Synthesis and Structural Analysis of a Highly
Curved Buckybowl Containing Corannulene and Sumanene Fragments”, pp. 16319-16321, Copyright 2011
American Chemical Society.
1.3.3 Hydrogenation of carbon nanotubes: functionalization and unzipping
Hydrogenation at extreme temperature and hydrogen pressure conditions is also very
interesting to apply for reaction with carbon nanotubes. For example, functionalization of CNTs
with hydrogen can be used as an efficient tool for improving their dispersion properties.
Hydrogenated CNTs were reported to disperse well in common organic solvents such as methanol,
ethanol, chlorophorm, and benzene131
. Moreover, hydrogenation can be used to increase the band
gap, i.e. decrease conductivity, of CNTs due to transformation of sp2-bonds into sp
3-bonds which
lead to localization of -electrons132
. Therefore, hydrogenation may help to obtain purely
semiconducting CNTs samples if all metallic nanotubes become semiconducting after
hydrogenation.
Initially, it was assumed that CNTs do not react with molecular hydrogen, and therefore
atomic hydrogen should be used for hydrogenation. Nikitin et al reported synthesis of hydrogenated
CNTs by hydrogenation with atomic hydrogen where 65 15 at.% of carbon atoms were
hydrogenated. Hydrogenation was reversible and all hydrogen was released upon heating at
600ºC133
. In later studies it was shown that the degree of CNTs hydrogenation depends on the CNTs

22
diameter134
. For CNTs with an average diameter of ~2nm almost 100% hydrogenation with a
relatively low desorption temperature of 200-300ºC was achieved.
CNTs can also be used as a precursor for the synthesis of GNRs135
. GNRs of a specific width,
2 times the diameter of the parent nanotubes, can be produced by unzipping of CNTs. At the
moment the most common method for unzipping CNTs is oxidation135, 136
. Hydrogenation, which
was successful for opening of C60 molecules, had not been tested for CNTs unzipping prior to our
experiments. Successful unzipping of CNTs by hydrogenation will lead to synthesis of oxygen-free
GNRs which is impossible when GNRs are synthesized by CNTs oxidation137,138
.
One of the initial aims of our experiments with hydrogenation of carbon nanotubes was to
verify the possibility of their opening using annealing in hydrogen. CNTs are normally closed by
fullerene-like cups after synthesis and these are usually removed by chemical or mechanical
treatments to make the inner space of the CNTs available e.g. for encapsulation of other
molecules139
. Based on our experimental data on hydrogen driven C60 collapse101, 103
we expected
that extensive hydrogenation would lead to removal of the fullerene-like CNT tips. Therefore, we
tested hydrogenation as a tool for CNTs opening, and possibly CNTs unzipping.
1.3.4 Hydrogenation of molecules (C60) encapsulated inside SWCNTs
One more interesting opportunity is to apply gas phase hydrogenation to some molecules
encapsulated inside of CNTs. It is known that the inner space of CNTs can be filled with various
molecules to study their chemical reactions in 1D-confined space. There are reports on CNTs filled
with coronene140
, anthracene141
, ferrocene142
, adamantane143
, and GNRs144
. One of the best studied
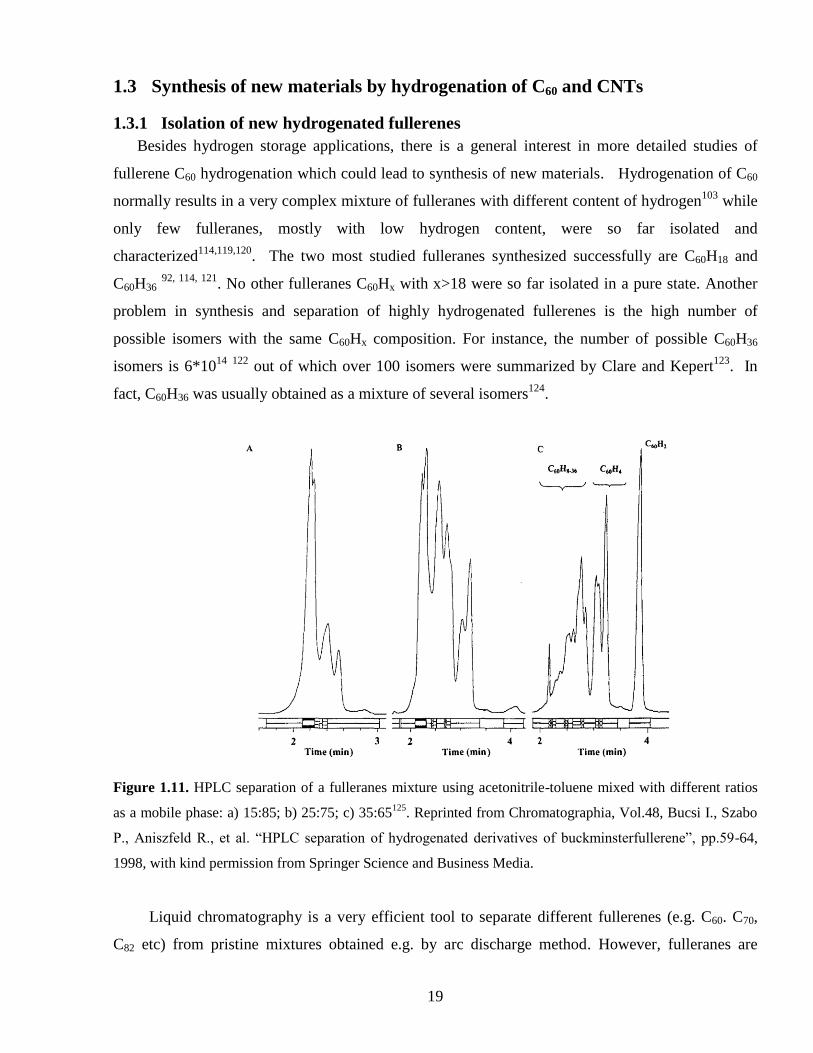
examples of encapsulated CNTs is peapods (C60@CNTs) which are obtained by insertion of C60
molecules into CNTs (see Figure 1.13)141
. Experiments performed earlier in our group showed that
hydrogen gas could penetrate into the inner space of C60@CNTs and react with C60. Formation of
fulleranes with small hydrogen content (~C60H12-14) was observed upon exposure of C60@CNTs to
hydrogen gas while the CNTs walls remained non-hydrogenated145
. Therefore, we decided to check
how peapods will react with hydrogen in a broader temperature interval and at various durations of
hydrogenation.
23
Figure 1.13. Schematic picture of C60@SWCNTs peapods: a) side view; b) front view; c) tilted view.

24
2 Motivation for this work This thesis consists of two major parts. In the first part I summarize our results on hydrogen
storage in various materials. In particular, we studied hydrogen adsorption for a set of Zn- and Co-
based MOFs which have different surface area and pore geometry. We also verified the effect of
structural stability on hydrogen adsorption in MOFs. Looking for new possibilities to improve
hydrogen adsorption in MOFs we studied a set of Pt-doped and Pt-modified (via the “bridging”
technique) MOF-5 samples where the hydrogen “spillover” effect was expected.
Carbon materials are attractive candidates for hydrogen storage due to their light weight and
high availability. In this thesis we studied hydrogen storage in novel nanocarbon materials
synthesized by the reaction between fullerene C60 and anthracene/coronene.
We also studied hydrogenation of C60 in a broad temperature interval using a gravimetric
method which allows to monitor C60 hydrogenation in situ. Using a gravimetric balance we tried to
optimize hydrogenation conditions and to synthesize fullerane mixtures with relatively simple C60Hx
compositions. The HPLC technique was used aiming to separate highly hydrogenated fulleranes.
We examined the effect of metal catalyst (Pt and Ni) addition on kinetics of C60 hydrogenation and
composition of hydrogenation products. The composition of every hydrogenated sample was studied
with atmospheric pressure photoionization Fourier transform-ion cyclotron resonance (APPI FT-
ICR) and matrix-assisted laser desorption/ionization time-of-flight (MALDI-TOF) mass
spectrometry which shed light on the mechanism of hydrogenation and fragmentation of C60 induced
by extensive hydrogenation.
In order to use C60 for hydrogen storage the reversibility of the hydrogenation process must be
verified, especially for mildly hydrogenated fulleranes which have higher stability comparing to
highly hydrogenated species. In this work we studied dehydrogenation of a sample which consists of
95% purity C3v isomer of C60H18.
Hydrogenation is a powerful tool for synthesis of new materials or for modifying physical
properties of existing materials as was earlier shown for hydrogenation of C60108
. In this work we
explore hydrogenation of CNTs with molecular hydrogen which according to our previous
experience with C60 should lead to opening of CNTs. Opened CNTs could be later impregnated with
various molecules, e.g. C60, and hydrogenation of C60 can be studied in the 1D-confined space of
CNTs. In this work we studied hydrogenation of C60@CNTs in a broad temperature interval and
compared it with hydrogenation of bulk C60.
25
3 Experimental section
3.1 Synthesis of the materials
3.1.1 MOF-5 (synthesis of the raw material, mixed and “bridged” with Pt catalyst)
MOF-5 was synthesized by the “one pot” method. According to this method a source of metal
clusters (zinc nitrate hexahydrate: Zn(NO3)2*H2O, 98%, Sigma Aldrich) and a source of organic
ligands (terephtalic acid: H2BDC, 98%, Sigma-Aldrich) were dissolved in N,N’-dimethylformamide
(DMF, ≥99,8%, A.C.S. reagent, Sigma Aldrich) under mild stirring. In order to promote
deprotonation of terephatlic acid triethylamine was dropwise added to the solution. After 2h of
stirring the solution was filtered off, washed three times with DMF, and dried in an oven maintained
at 105ºC during 20h. In order to cause hydrogen spillover MOF-5 was mixed with platinum 5wt.%
on activated carbon (or 10wt.% Pt/AC) in a weight ratio 9:1 using an agate mortar and pestle. To
facilitate spillover the contact between the catalyst and MOF-5 was improved using carbon bridges.
In order to build them a ternary physical mixture of sucrose (A.C.S. reagent, Sigma–Aldrich), Pt/AC
catalyst, and MOF-5 (the weight ratio 1:1:8) was first heated to 200ºC with a ramp of 1ºC/min and
kept for 3 h in a helium atmosphere (the melting point of sucrose is 186ºC). During the first step
sucrose is supposed to melt thoroughly and to fill spaces between catalyst particles and MOF-5.
Then the temperature was increased to 300ºC, and held for 12 h. During this step sucrose
carbonized, supposedly forming carbon bridges between Pt-catalyst and MOF-5. After the bridging
process was completed, samples were cooled down to room temperature with a ramp of 1ºC/min.
3.1.2 Hydrogenation of fullerene C60, SWCNTs, and C60@SWCNTs
C60 powder (sublimed, >99,9% pure, purchased from MER Corp., USA) was loaded into a
stainless steel container. The hydrogenation reaction was performed in a sealed chamber under a
static hydrogen pressure of 50bar and in the temperature interval of 350-440ºC. The weight change
of the fullerene C60 powder during hydrogenation was measured in situ by the Rubotherm
gravimetric system (see Chapter 3.2.3 for more details).
To study the effect of metal catalyst addition on C60 hydrogenation we mixed C60 powder with
Ni catalyst (supported on Al2O3/SiO2, 65wt.% of Ni) and Pt catalyst (supported on carbon black,
60wt.% of Pt) using agate mortar and pestle. Ni catalyst was mixed with C60 powder in a 1:1 (Ni:C)
ratio. Pt catalyst was mixed with C60 powder in a 3:1 (Pt:C) ratio.
SWCNTs were provided by the group of Prof. Kauppinen from Aalto University. They
synthesized SWCNTs by an aerosol chemical vapour deposition (CVD) method using CO

26
decomposition on Fe particles146
. Hydrogenation of SWCNTs was performed in alumina crucibles
placed in a sealed chamber under a static hydrogen pressure of 50bar and in the temperature interval
of 400-550ºC. Typical duration of the hydrogenation experiment was 72hours.
C60@SWCNTs was synthesized by the C60 gas phase encapsulation method in vacuum as
described elsewhere147
. Hydrogenation of C60@SWCNTs was performed in alumina crucibles
placed in a sealed chamber under a static hydrogen pressure of 50bar and temperatures of 450, 500,
and 550ºC. Typical duration of the hydrogenation experiment was 72hours.
3.1.3 Reactions of fullerene C60 with anthracene/coronene
The reaction between C60 and anthracene/coronene was conducted under argon atmosphere in
the temperature interval of 290–800ºC for 20–24 h. The powder C60 (99.5%, SES Research, Huston,
USA) was mixed with coronene (97%, Aldrich, Germany) or anthracene (96.9%, Fluka, Sigma–
Aldrich, Germany) using agate mortar and pestle, loaded into a stainless steel reactor (inner volume
ca. 0.6 cm3) and closed under argon. Experiments were performed for powders mixed in a ratio of
one molecule of C60 per one molecule of anthracene/coronene. Several additional experiments were
performed for fullerene C60 mixed with anthracene in a ratio of 2:1, but the difference was
insignificant.
3.2 Characterization techniques
3.2.1 X-ray diffraction analysis
X-ray diffraction (XRD) technique is an important technique which is commonly used for the
structural characterization of materials. All atoms in crystalline materials are considered as sets of
parallel crystallographic planes which are characterized by Miller indices (h k l). Diffraction
maxima occur when a certain set of crystallographic planes fulfill conditions for constructive
interference provided by the Bragg law (see Figure 3.1):
2 sind n (1).
where is the angle between the incident beam and the crystallographic plane, d is the distance
between two successive crystallographic planes, is a radiation wavelength, and n is an integer
number. In other words, the interference occurs if the path difference of the beams diffracted from
two adjacent planes 2 sinL d equals to an integer number of wavelength .
XRD patterns are recorded by an X-ray diffractometer. The major parts of every X-ray
diffractometer are a X-ray tube, a sample desk, and a detector. The X-ray tube generates X-ray
radiation and consists of a tungsten filament and a water cooled Cu cup. The filament is connected

27
to a source of AC current (usually of the order of 10 A). Electrons are emitted from the surface of
the filament and are accelerated by a potential difference applied between the tungsten wire and the
copper cup (normally 40kV). Upon the collision of electrons with the cup part of their energy is
converted into radiation which leaves the X-ray tubes through windows usually made of beryllium.
Outgoing X-ray radiation is filtered, so that only 1CuK and
2CuK lines (1,5405 and 1,5443Å
correspondingly with a mean value of 1,542Å) are used. Incident radiation is diffracted by the
sample, which is placed in the middle of the goniometer circle (see Figure 3.2), and recorded by a
detector. The intensity of diffracted radiation is normally measured by a scintillation counter which
could detect radiation with a wavelength of 0,5 - 2,7Å.
Figure 3.1. Diffraction of incident X-rays from the family of parallel atomic planes.
The X-ray diffractometer used in this work operates in the Bragg-Brentano mode. In this mode
the X-ray tube, the detector, and the sample are located on the focusing circle. The X-ray tube is
fixed, and the detector moves along the goniometer circle with an angular speed which is two times
higher than the angular speed of the sample (the rotational axes of the sample and of the detector
coincide). During the XRD analysis the detector is always at 2 angle and the sample surface is
always at angle in respect to the incident X-ray beam. The detector scans around the sample in the
specified 2 interval and records the angle and the intensity of diffracted radiation. The angle
when incident radiation is diffracted and the intensity of diffracted radiation form a two dimensional

28
pattern. Each reflection on this pattern corresponds to the set of parallel crystallographic planes (h k
l). X-ray diffraction measurements in this thesis were performed using Siemens D5000
diffractometer with CuK radiation.
Figure 3.3. Siemens D5000 diffractometer with its main constituent parts: 1) X-ray tube, 2) sample holder, 3)
detector.
3.2.2 Nitrogen sorption analysis
Nitrogen sorption analysis is a powerful tool for investigations of the material porosity. The
basic principle of this technique is to measure the amount of nitrogen adsorbed by the material at
certain conditions and applying some theoretical models to convert this amount into such properties
of the material as surface area, pore volume, micropore volume, total pore volume, or pore size
distribution function etc.
The amount of nitrogen n adsorbed by the material depends on temperature T, equilibrium
pressure p, and on the nature of the nitrogen-sorbent system:
( , , )n f p T system (2).
If a specific nitrogen-material system is maintained at a constant temperature T, which is below the
nitrogen critical temperature, the nitrogen adsorption isotherm for this specific system is
0 T
pn f
p
(3)

29
where p0 is nitrogen saturation pressure at temperature T. Nitrogen adsorption isotherm is a relation
between the amount nitrogen adsorbed and relative pressure p/p0 at a known temperature (in case of
Figure 3.4. Types of adsorption isotherms148
. Reprinted from the Journal of Pure&Applied Chemistry,
Vol.57, Sing KSW., Everett DH., Haul RAW., et al. “Reporting physisorption data from gas/solid systems
with special reference to the determination of surface area and porosity”, pp.603-619, 1985 with permission
from IUPAC.
nitrogen adsorption T= –196ºC). Looking at the shape of the isotherm one can predict the type of
material porosity, i.e. to understand whether the sorbent is a microporous, mesoporous, or non-
porous material. The classification of nitrogen adsorption isotherms according to IUPAC is shown
in Figure 3.4. For instance, Type I isotherms are normally measured on microporous adsorbents,
e.g. MOFs, AC. Type II isotherms are measured on non-porous or macroporous adsorbents. Type III
and Type V isotherms do not show any transition point between monolayer-multilayer adsorption
(marked by point B in case of Type II isotherms). Materials with Type III or V isotherms do not
adsorb nitrogen by layers but nitrogen molecules are clustered around some favorable adsorption
sites. Typically, Type III or V isotherms are observed for materials which have relatively weak
interaction with nitrogen molecules. Mesoporous adsorbents normally exhibit Type IV isotherms
where the monolayer-multilayer adsorption on mesopore walls is followed by capillary
condensation. Type VI isotherms with clear layer-by-layer adsorption are measured on materials
which have highly uniform surface.
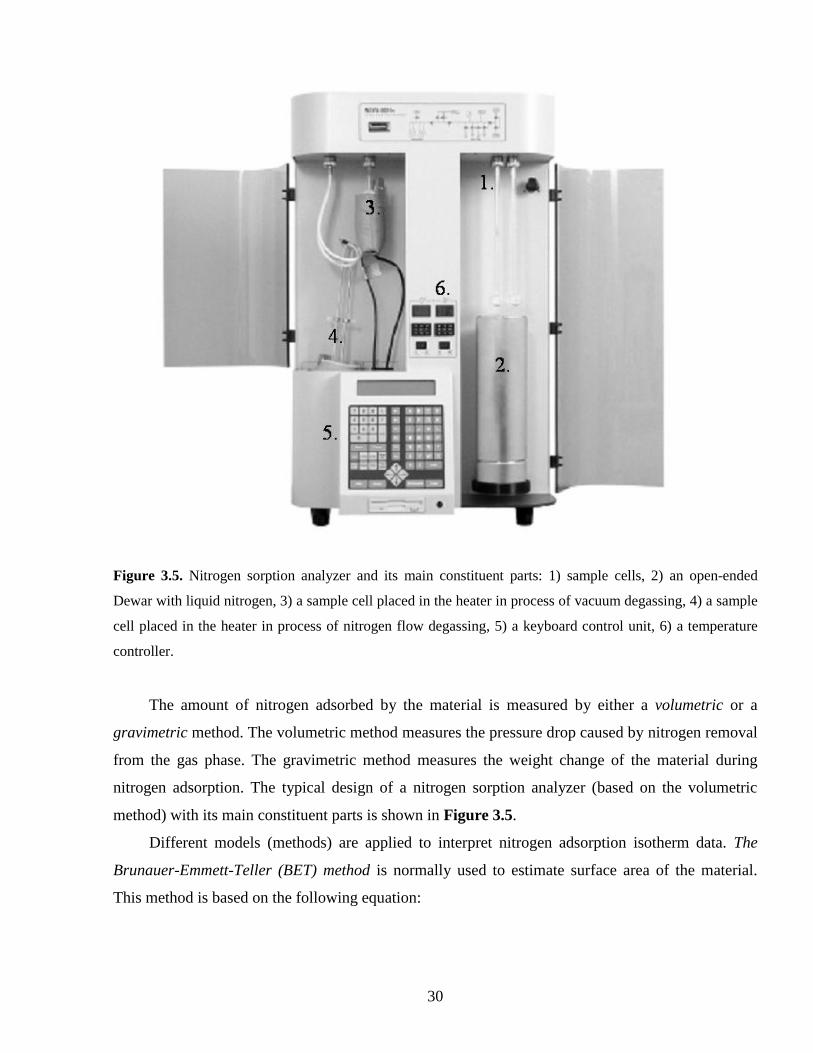
30
Figure 3.5. Nitrogen sorption analyzer and its main constituent parts: 1) sample cells, 2) an open-ended
Dewar with liquid nitrogen, 3) a sample cell placed in the heater in process of vacuum degassing, 4) a sample
cell placed in the heater in process of nitrogen flow degassing, 5) a keyboard control unit, 6) a temperature
controller.
The amount of nitrogen adsorbed by the material is measured by either a volumetric or a
gravimetric method. The volumetric method measures the pressure drop caused by nitrogen removal
from the gas phase. The gravimetric method measures the weight change of the material during
nitrogen adsorption. The typical design of a nitrogen sorption analyzer (based on the volumetric
method) with its main constituent parts is shown in Figure 3.5.
Different models (methods) are applied to interpret nitrogen adsorption isotherm data. The
Brunauer-Emmett-Teller (BET) method is normally used to estimate surface area of the material.
This method is based on the following equation:

31
0
0
1 1 1
1 m m
C p
n C n C ppn
p
(4),
where n is the amount of nitrogen adsorbed at pressure p, nm is the amount of nitrogen forming a
monolayer of surface coverage, and C is a constant which is related to the adsorption energy in the
first adsorbed monolayer (C50 – 250) . If one plots
0
1
1p
np
versus 0
p
p to get a slope
1
m
C
n C
and an intercept 1
mn C of the line one can calculate a nm parameter. The nm parameter can be then
converted into surface area S using the following equitation:
mA
r
nS N
M (5),
where Mr is a molecular weight of nitrogen, Na is the Avogadro constant, and is the nitrogen
cross-sectional area. The linearity range of the
0
1
( 1)p
np
vs. 0
p
p sequence is different for different
types of materials and should be carefully considered when calculating the nm value. The BET
isotherm linearity range differs from 0,05-0,30 for most mesoporous and macroporous materials
down to 10-3
- 10-4
for microporous materials.
Dubinin’s theory is commonly used to describe pore filling in microporous materials. This
theory is described by a general equation for fractional micropore filling:
2
0
A
bE
p
ne
n
(6)
where np is micropore volume, A is an expression for the “adsorption potential” (see Equation 7),
E0 is the “characteristic” energy for a standard vapor (normally benzene) and b is a constant149
.
0
lnp
A RTp
(7).
The main disadvantages of Dubinin’s method are that this method assumes a homogeneous surface
of the material and is not specific towards the pore shape. Other methods were developed which are
specific towards the pore geometry. For instance, the Horvath and Kowazoe method assumes slit-
like pores150
, the Saito and Foley method assumes cylindrical pores151
, and the Cheng and Yang
method assumes spherical pores152
.

32
Nitrogen sorption analysis also provides information about the pore size distribution in the
mesopore range if the model proposed by Barrett, Joyner, and Halenda (BJH) is applied to the
nitrogen adsorption data. This model is described by the modified version of the Kelvin equation153
:
0
2 lnM
k
pV
pr
RT
(7),
where rk is the Kelvin pore radius, is the surface tension of nitrogen at its boiling point, VM is the
molar volume of liquid nitrogen, T is the nitrogen boiling temperature, and 0
p
p is nitrogen relative
pressure. The equation describes successive emptying of pores with radius rk by lowering relative
pressure0
p
p.
However, the best results are achieved if Density Functional Theory (DFT) or methods of
molecular simulations (Monte Carlo simulation) are used for pore analysis154, 155
. Using molecular
calculations one can model nitrogen adsorption in a pore with a certain width. Summarizing results
of molecular simulations for nitrogen adsorption in pores with various widths and comparing it with
experimental data one could deduce the pore size distributions function. This approach is described
by a Generalized Adsorption Isotherm (GAI) equation:
max
min0 0
( ) ( ( , ) ( )W
W
p pN N W f W dW
p p (10),
where W is a pore width, 0
pN
p
represents the experimental sorption isotherm data, 0
,p
N Wp
represents a calculated sorption isotherm for the pore with width W, ( )f W is a pore size distribution
function, and pores which are considered for nitrogen adsorption have a width within the interval
(Wmin, Wmax).
All measurements in this thesis were performed by the Quantachrome Nova 1200e nitrogen
analyzer which is a volumetric instrument (see Figure 3.5). The pressure transducer is the main
factor limiting the width of micropores which can be measured by the volumetric instrument. The
Quantachrome Nova 1200e sorption analyzer allows to conduct measurements in the 0
p
p relative
pressure range of 10-3
– 1. Prior to the measurements all samples were degassed under the vacuum

33
(or under the nitrogen flow) and at appropriate temperatures. All calculations were performed using
the standard NOVAWin-P version 10.0+ software.
3.2.3 Rubotherm gravimetric system
Hydrogen adsorption measurements were performed using a Rubotherm gravimetric system
equipped with a magnetic suspension balance. The magnetic suspension balance measures in situ the
weight change of the sample. The sample is placed in a sample chamber which is isolated from the
external atmosphere. The sample weight is measured via interaction of a permanent magnet
(connected to the sample inside the sample chamber) with an electromagnet (located outside of the
sample chamber), see Figure 3.6. The sample chamber can be filled with different gases (e.g.
hydrogen, helium) and the sample weight can be measured at various temperatures and pressures.
The possibility to measure the sample weight at not-ambient conditions (atmosphere, temperature,
pressure) is the main advantage of the Rubotherm gravimetric balance compared to other
conventional gravimetric balances.
Figure 3.6. Schematic representation of the Rubotherm gravimetric balance: in the measuring mode (to the
left); in the taring and calibration mode (to the right). Reprinted from the” Rubotherm magnetic suspension
balances” brochure with permissions from Rubotherm GmbH.
Typical duration of a hydrogen adsorption experiment is about 1–3 days. The gravimetric
system provides possibility to make an internal calibration every 2-3 minutes which is extremely

34
important for long measurements (see Figure 3.6). The sample settles down on a support, and only
weight of the suspension magnet coupled with an empty balance pan is transmitted to the balance
(i.e. “zero point” position). The weight of the suspension magnet at the “zero point” position is used
for the internal calibration which is repeated throughout the entire experiment with automatic
corrections of the weight difference.
The gravimetric balance performs sample weight measurements (sample weights up to 10g)
with a resolution of 0,01mg and a reproducibility of 0,02mg. Sample weight measurements can be
performed at temperatures starting from -20ºC, which is achieved by cooling the sample cell down
by a remote thermostat, up to 450ºC, which is achieved by heating the sample cell by an external
electrical heater.
Figure 3.7. A typical example of the hydrogen adsorption experiment: red line – temperature; green line –
pressure; blue line - sample weight change; dark blue - “zero point” correction.
A typical hydrogen adsorption experiment consists of several major steps (see Figure 3.7):
Degassing of the sample cell at high vacuum conditions (10−6
- 10-7
bar) and at the
temperature selected according to the sample thermal stability data obtained by the thermo-
gravimetrical analysis. The degassing process is over when the sample weight becomes
stable.

35
Hydrogen adsorption measurements at constant temperature and with a step-wise pressure
increase (T= from -20°C to 20°C; PH2= up to 200bar) which are followed by desorption at
high vacuum conditions.
Determination of the sample total volume VHe (volume of the sample together with the
sample cell and the holder) which is performed by measuring the sample weight at different
helium pressures.
Calculation of hydrogen adsorption considering the buoyancy effect.
Hydrogen adsorption measurements are controlled by the software which plots in situ pressure in the
sample cell, temperature of the sample, the sample weight change, and a “zero-point” signal (see
Figure 3.7).
3.2.4 Thermogravimetric measurements
Thermogravimetric analysis (TGA) is performed by precise balances which measure the
sample weight as the sample is heated, cooled or kept at the constant temperature. In addition to
simple weight change measurements some balances measures the temperature difference between a
sample and a reference material (DTA method) or the heat flow in and out of a sample and a
reference material (DSC method). Many material properties can be studied using TGA or DSC/DTA
analyses (see Table 3.1).
TGA DSC
Adsorption and desorption of gases Melting
Quantitative content analysis Crystallization
Kinetics of decomposition process Polymorphism
Sublimation, evaporations and
vaporization
Phase diagrams
Thermal stability Glass transition
Oxidation stability Reaction kinetics
Identification of decomposition products Heat capacity
Sorption and desorption of moistures Reaction and transition enthalpy
Pseudopolymorphism
Determination of Curie temperatures
Table 3.1. Some material properties or thermal processes which could be detected by TGA/DSC.
The major parts of any TGA analyzer are high-precision balance connected to the sample
holder and thermocouples which control the temperature of the sample and the reference material. A
standard TGA experiment is performed by heating the sample in a certain atmosphere (i.e. ambient
air, nitrogen, argon etc are passed through the sample cell at different flow rates) and by recording
the sample weight change as a function of the temperature. TGA experiments in this thesis were
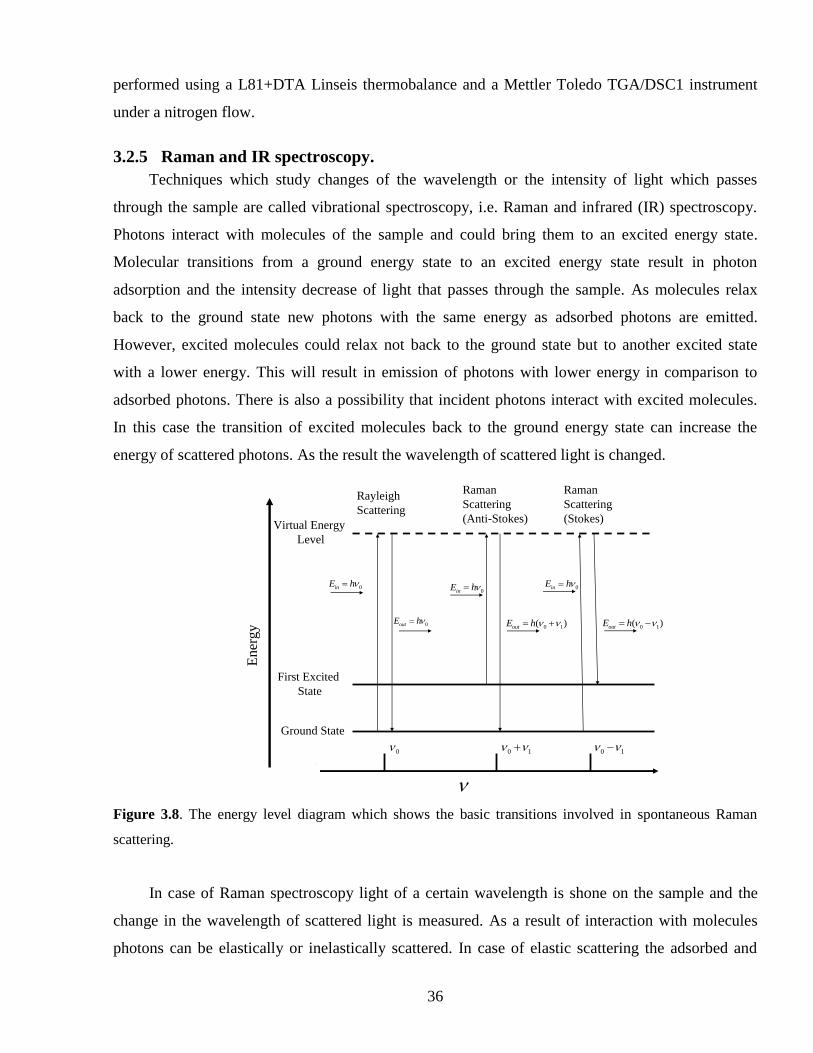
36
performed using a L81+DTA Linseis thermobalance and a Mettler Toledo TGA/DSC1 instrument
under a nitrogen flow.
3.2.5 Raman and IR spectroscopy.
Techniques which study changes of the wavelength or the intensity of light which passes
through the sample are called vibrational spectroscopy, i.e. Raman and infrared (IR) spectroscopy.
Photons interact with molecules of the sample and could bring them to an excited energy state.
Molecular transitions from a ground energy state to an excited energy state result in photon
adsorption and the intensity decrease of light that passes through the sample. As molecules relax
back to the ground state new photons with the same energy as adsorbed photons are emitted.
However, excited molecules could relax not back to the ground state but to another excited state
with a lower energy. This will result in emission of photons with lower energy in comparison to
adsorbed photons. There is also a possibility that incident photons interact with excited molecules.
In this case the transition of excited molecules back to the ground energy state can increase the
energy of scattered photons. As the result the wavelength of scattered light is changed.
Ener
gy
Ground State
First Excited
State
0inE h
0outE h
Rayleigh
Scattering
Virtual Energy
Level
0inE h
0 1( )outE h
0inE h
0 1( )outE h
Raman
Scattering
(Anti-Stokes)
Raman
Scattering
(Stokes)
0 0 1 0 1
Figure 3.8. The energy level diagram which shows the basic transitions involved in spontaneous Raman
scattering.
In case of Raman spectroscopy light of a certain wavelength is shone on the sample and the
change in the wavelength of scattered light is measured. As a result of interaction with molecules
photons can be elastically or inelastically scattered. In case of elastic scattering the adsorbed and

37
emitted photons have the same energy (Rayleigh scattering, see Figure 3.8). In case of inelastic
scattering emitted phonons can have either higher (anti-Stokes scattering) or lower (Stokes
scattering) energy in comparison to incident phonons. The probability of Stokes scattering is about
10-7
while anti-Stokes scattering has an even lower probability. Therefore, phonons scattered
according to the Stokes mechanism are normally used for the Raman spectroscopy analysis.
In case of IR spectroscopy the wavelength of the incident light is changed with time in order to
observe all the adsorption lines within a specific wavelength interval. IR spectra show absorbance
(or transmittance) of light at different wavelengths. Despite the fact that both IR and Raman
spectroscopy measure the vibrational energies of molecules they rely on different selection rules.
For instance, vibrations are IR active if they change the dipole moment of the molecule (it does not
imply that the molecule has a permanent dipole moment). Vibrations are Raman active if they
change the polarizability of the molecule. Due to those differences Raman and IR spectroscopy are
complementary techniques which are widely used to study vibrational and rotational modes of
various materials.
Figure 3.9.Schematic representation of the Raman spectrometer156
. Reprinted with permission from (Stackler
NAS Colloquium) Scientific Examination of Art: Modern Techniques in Conservation and Analysis, 2005,
by the National Academy of Science, Courtesy of the National Academies Press, Washington, D.C.
The Raman spectrometer used in this work was the Renishaw grating spectrometer with a
notch filter to remove the Rayleigh line, see Figure 3.9. A Peltier cooled CCD-detector was used to
detect Stokes and anti-Stokes lines. Helium-neon (He-Ne, an excitation wavelength of 633nm) and
argon-ion (Ar+ ion, 514nm) lasers were used to record spectra. The resolution of the Raman
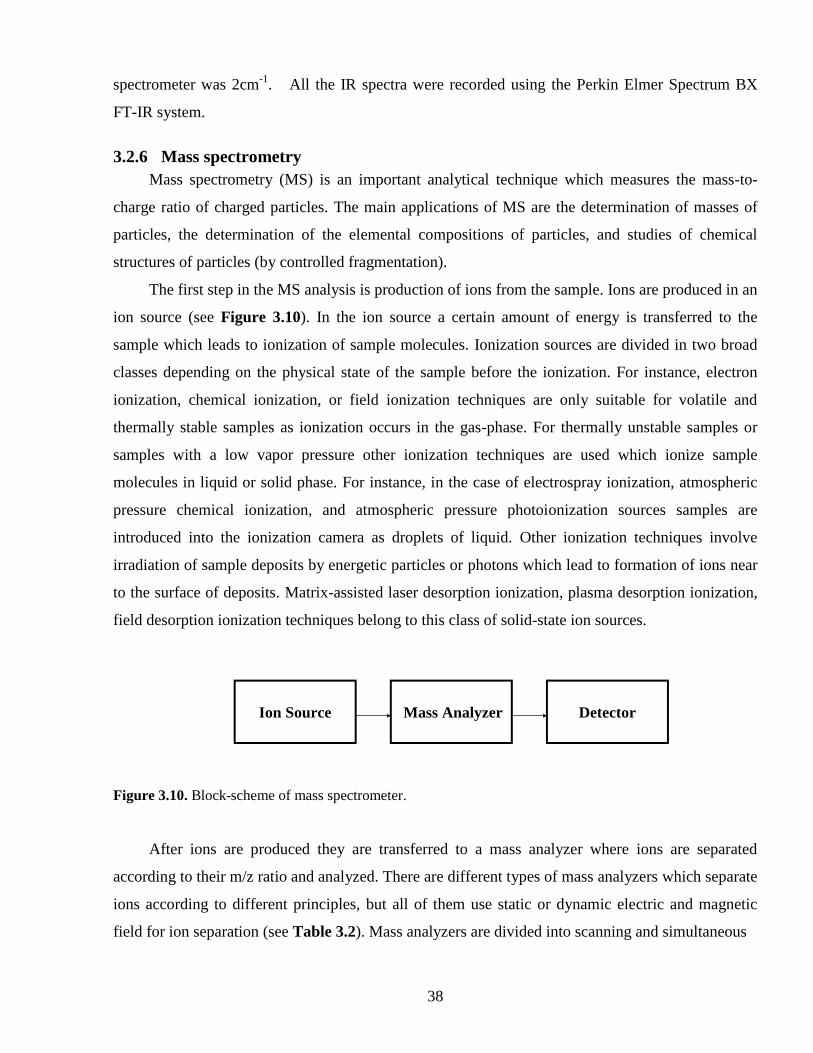
38
spectrometer was 2cm-1
. All the IR spectra were recorded using the Perkin Elmer Spectrum BX
FT-IR system.
3.2.6 Mass spectrometry
Mass spectrometry (MS) is an important analytical technique which measures the mass-to-
charge ratio of charged particles. The main applications of MS are the determination of masses of
particles, the determination of the elemental compositions of particles, and studies of chemical
structures of particles (by controlled fragmentation).
The first step in the MS analysis is production of ions from the sample. Ions are produced in an
ion source (see Figure 3.10). In the ion source a certain amount of energy is transferred to the
sample which leads to ionization of sample molecules. Ionization sources are divided in two broad
classes depending on the physical state of the sample before the ionization. For instance, electron
ionization, chemical ionization, or field ionization techniques are only suitable for volatile and
thermally stable samples as ionization occurs in the gas-phase. For thermally unstable samples or
samples with a low vapor pressure other ionization techniques are used which ionize sample
molecules in liquid or solid phase. For instance, in the case of electrospray ionization, atmospheric
pressure chemical ionization, and atmospheric pressure photoionization sources samples are
introduced into the ionization camera as droplets of liquid. Other ionization techniques involve
irradiation of sample deposits by energetic particles or photons which lead to formation of ions near
to the surface of deposits. Matrix-assisted laser desorption ionization, plasma desorption ionization,
field desorption ionization techniques belong to this class of solid-state ion sources.
Ion Source Mass Analyzer Detector
Figure 3.10. Block-scheme of mass spectrometer.
After ions are produced they are transferred to a mass analyzer where ions are separated
according to their m/z ratio and analyzed. There are different types of mass analyzers which separate
ions according to different principles, but all of them use static or dynamic electric and magnetic
field for ion separation (see Table 3.2). Mass analyzers are divided into scanning and simultaneous

39
Type of mass analyzer Principle of separation
Electric sector Kinetic energy
Magnetic sector Momentum
Quadrupole Trajectory stability
Ion trap Resonance frequency
Time-of-flight Flight time
Fourier transform ion cyclotron resonance Resonance frequency
Fourier transform orbitrap Resonance frequency
Table 3.2. Types of mass analyzers and principles of ion separation157
.
transmission classes. Scanning mass analyzers scan ion with different masses over a time scale. This
class of instruments includes magnetic sector mass analyzers with a flying tube in the magnetic field
or quadrupole mass analyzers. Other mass analyzers transmit all ions simultaneously. This class of
mass analyzers includes dispersive magnetic analyzers, time-of-flight analyzers, ion traps, ion
cyclotron resonance analyzers, and orbitraps.
After ions pass through the mass analyzer they are detected by detectors which generate an
electrical current proportional to ionic abundance. The detector selection for a particular instrument
depends on the instrument design. Some detectors count ions of a certain mass at a time (point ion
collectors) while other detectors detect ions of all masses simultaneously (photographic plates,
image current detectors etc).
All mass spectra in this thesis were recorded with a MALDI TOF mass spectrometer (Voyager
DE-STR, Applied Biosystems, USA) and with a high-resolution APPI FT-ICR mass spectrometer
(Thermo Scientific, Bremen, Germany). Prior to the MS analysis samples were dissolved in toluene.
For MALDI TOF MS toluene solutions of samples were mixed with a toluene solution of elemental
sulfur, which was used as matrix, in a volume ratio 1:15.

40
4 Results and discussion
4.1 Hydrogen storage in some Co- and Zn-based MOFs
MOFs is a rapidly growing new class of porous materials with hundreds of new structures
reported every year158, 159
. It is important to investigate new MOFs for hydrogen adsorption
properties, to reveal the most important parameters which control hydrogen storage in these
materials and, possibly, to use the accumulated knowledge for more targeted design of new MOFs
for hydrogen storage applications160
. Materials studied here were synthesized within a collaboration
with the group of Prof. H. Chun. They synthesized a set of new Zn- and Co-based MOFs which have
different pore geometries and surface areas (see Figure 4.1).
Among those materials we have studied four different Zn-based MOFs (ZBDt, ZBDh, ZID,
ZIDs, and [Zn4(O)(mip)3]) and one Co-based MOF (CND). ZBDt and ZBDh are two different
isomers of the same MOF (chemical formula: C22H20N2O8Zn2). ZBDt consists of square channels
with the size of 7,5Å*7,5Å, while ZBDh consists of triangle and hexagonal channels with a van der
Waals radius of the channels 4,5Å and 13,5-15Å correspondingly161, 162
. ZID, ZIDs, and
[Zn4(O)(mip)3] were synthesized by changing the organic ligands. ZID and ZIDs are the same
material (chemical formula: C38H32N2O18Zn4), but were synthesized by different methods: ZID is
synthesized by the diffusion method, while ZIDs are obtained by the solvothermal reaction163
. The
ZID structure shows three kinds of cage-like pores with diameters of 8-20Å. [Zn4(O)(mip)3]
(chemical formula: C42H55N5O19Zn4) consists of various pores with irregular shape which are less
than 10Å in diameter164
. CND (chemical formula: C73,5H66N2O12Co3) consists of triangular channels
with a van der Waals radius of 4,5Å165
.
Zn(NO3)2*6H20
ZID ZBDt
ZBDh
Zn4(O)(mip)32D- square grid with wide
open channels (7,5Å*7,5Å)
Triangular channels:
4,5Å (van der Waals radius)
Hexagonal channels:
13.5-15Å (van der Waals
radius)
Pores of varying sizes (<1nm)
and irregular shapes
Three kinds of cage-like
pores (with 8-20Å diameter)
+ terephthalic acid and dabco
+ m
ethyliso
phth
alate
+ iso
phth
alic acid an
d d
abco
Co(NO3)2*6H2O
CND
MOF-5
+ 2,6-naphtalenedicarboxylic acid,
dabco
Triangular channels:
4,5Å (van der Waals radius)
Zn(NO3)2*6H20+ terephthalic acid
van der Waals pore radius: 6Å
Figure 4.1. Various Zn- and Co-based MOFs studied for hydrogen adsorption at ambient temperatures.

41
Therefore, the samples provided to us for hydrogen adsorption experiments showed a broad
variation of the main parameters: surface area, pore size and geometry, two different metals in oxide
clusters and a variety of organic linker types. According to results previously published by the
group of Prof H.Chun, some of these MOFs showed hydrogen uptake values in the range of 1,5-
2,45wt.% at 1 bar of H2 pressure and T=77K161-165
which are comparable with best results reported
for MOFs at those conditions31
.
Hydrogen adsorption at temperature conditions close to ambient were measured in our study.
Hydrogen adsorption isotherms: effects of pressure and surface area. At ambient
temperatures the highest hydrogen uptake of 0,51wt.% was observed for ZBDh (p=120bar and
T=20°C), see Figure 4.2. After lowering the temperature down to -4°C hydrogen uptake in ZBDh
increased up to 0,63wt.% which agrees well with the fact that physisorption is a temperature
dependent process. As saturation was not achieved at 120bar for either of these temperatures,
pressure was further increased up to 175bar. At 175bar ZBDh adsorbed 0,75 wt.% of H2 (see Figure
4.2b), but even at that pressure the adsorption curve did not reach saturation. As expected for
physisorption, hydrogen adsorption was completely reversible and the equilibrium value of
hydrogen uptake was established every time within a few minutes after the hydrogen pressure was
stabilized. Using a Langmuir fit, the hydrogen adsorption saturation value for ZBDh was estimated
to be on the level of ~1,63wt.%, but according to this fit the saturation would be achieved at
extremely high pressure (4000-5000bar).
0 40 80 120 160
0.0
0.2
0.4
0.6
0.8ZBDh
T=20ºC
T=-4ºC
hyd
rog
en
up
take
, w
t.%
pressure, bar
Figure 4.2. a) Hydrogen adsorption isotherms recorded at T=20°C (-■- - ZBDh, -▲- - ZBDt, -◄- - CND, -
▼- ZID, -●- Zn4(O)(mip)3, -►- ZIDs, -♦- MOF-5). B) Hydrogen adsorption isotherm recorded for ZBDh at
temperatures T=20°C (-▲-) and T= -4°C (-■-).
0 40 80 120
0.0
0.2
0.4
0.6
ZBDh
ZBDt
CND
MOF-5
ZID
ZIDs
Zn4(O)(mip)3
hyd
rog
en
up
take
, w
t.%
pressure, bara) b)

42
Figure 4.3. The relation between hydrogen adsorption values and BET specific surface area measured for
different MOFs: ■- hydrogen adsorption at 120bar and room temperature with linear fit shown by black line,
▲- the saturation value of hydrogen adsorption obtained using Langmuir fit with linear fit shown by red line,
blue line- excess hydrogen adsorption measured on MOFs at -196ºC plotted versus BET surface area24
).
All MOFs studied in our project exhibited a hydrogen adsorption which was almost linearly
proportional to the BET surface area (see Figure 4.3 and Table 4.1). This result was in good
agreement with known trends observed for materials which store hydrogen by physisorption. The
correlation between hydrogen uptake and total pore volume was less pronounced which also agrees
well with literature. Surface area was reported to be the main factor influencing hydrogen adsorption
at ambient temperatures24
while pore volume was a more important parameter at cryogenic
temperatures41
.
Structural stability issues. The problem of poor structural stability is another issue which
must be carefully considered while designing MOFs for hydrogen adsorption. Hydrogen adsorption
measured for Zn4(O)(mip)3 was rather low, see Table 4.1. The reason for low hydrogen adsorption
for Zn4(O)(mip)3 became obvious after analysis of powder X-ray diffraction patterns recorded before
and after adsorption experiments (see Figure 4.4). It is obvious from Figure 4.4 that the
Zn4(O)(mip)3 structure collapsed during hydrogen adsorption measurements.
It should be noted that MOFs are rather fragile materials and are normally stored immersed
into some solvents which fills the large pores and stabilizes the structure164
. In principle, collapse of
the MOF structure might either occur in the process of vacuum degassing at elevated temperature or
be an effect of hydrogen pressure increase in the process of adsorption measurements. Most likely,
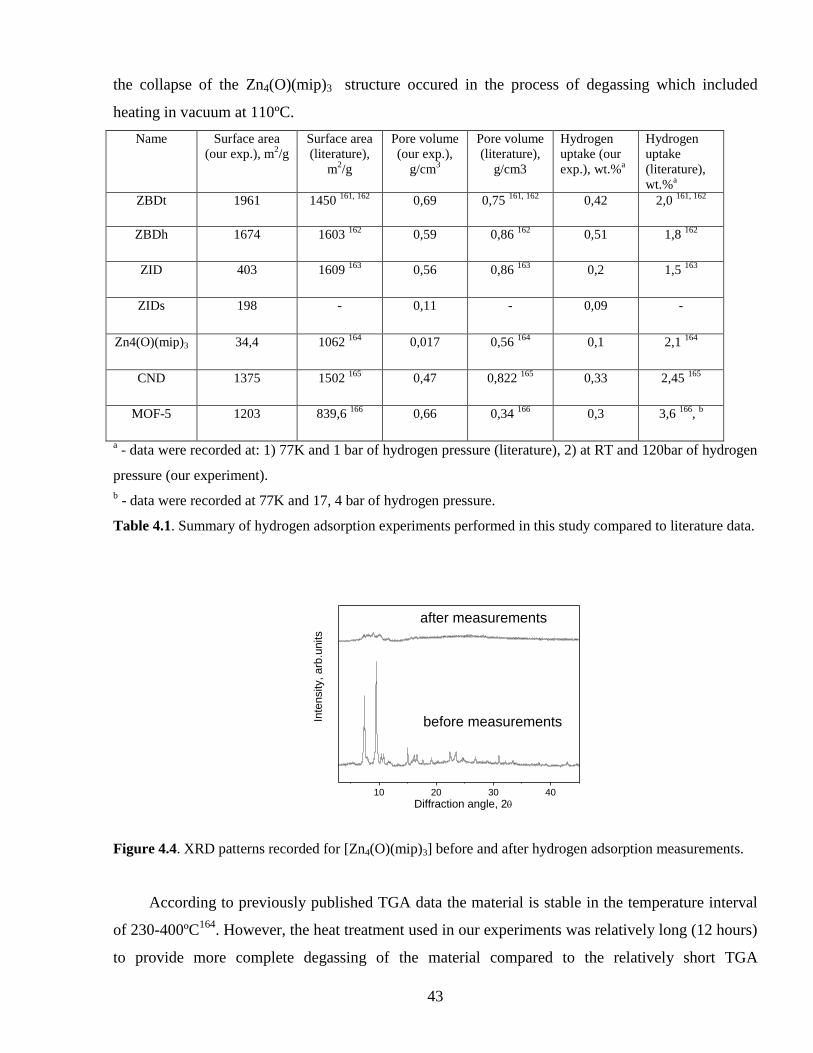
43
the collapse of the Zn4(O)(mip)3 structure occured in the process of degassing which included
heating in vacuum at 110ºC.
Name Surface area
(our exp.), m2/g
Surface area
(literature),
m2/g
Pore volume
(our exp.),
g/cm3
Pore volume
(literature),
g/cm3
Hydrogen
uptake (our
exp.), wt.%a
Hydrogen
uptake
(literature),
wt.%a
ZBDt 1961 1450 161, 162 0,69 0,75
161, 162 0,42 2,0
161, 162
ZBDh 1674 1603 162
0,59 0,86 162
0,51 1,8 162
ZID 403 1609 163
0,56 0,86 163
0,2 1,5 163
ZIDs 198 - 0,11 - 0,09 -
Zn4(O)(mip)3 34,4 1062 164
0,017 0,56 164
0,1 2,1 164
CND 1375 1502 165
0,47 0,822 165
0,33 2,45 165
MOF-5 1203 839,6 166
0,66 0,34 166
0,3 3,6 166
, b
a - data were recorded at: 1) 77K and 1 bar of hydrogen pressure (literature), 2) at RT and 120bar of hydrogen
pressure (our experiment).
b - data were recorded at 77K and 17, 4 bar of hydrogen pressure.
Table 4.1. Summary of hydrogen adsorption experiments performed in this study compared to literature data.
10 20 30 40
after measurements
I
nte
nsity,
arb
.un
its
Diffraction angle, 2
before measurements
Figure 4.4. XRD patterns recorded for [Zn4(O)(mip)3] before and after hydrogen adsorption measurements.
According to previously published TGA data the material is stable in the temperature interval
of 230-400ºC164
. However, the heat treatment used in our experiments was relatively long (12 hours)
to provide more complete degassing of the material compared to the relatively short TGA

44
experiments. The degassing temperature should be lowered or the degassing time should be reduced
in order to avoid structural decomposition of Zn4(O)(mip)3. However, in this case it could be rather
difficult to remove all solvent molecules from the Zn4(O)(mip)3 structure. Therefore, the relatively
weak structural stability of this material is the major obstacle for possible applications.
It can be concluded that the crystal structure of MOFs must be carefully examined after
hydrogen adsorption experiments in order to make sure that MOFs did not decompose during
hydrogen adsorption measurements. However, in many previously published studies the structural
characterization of samples was performed only before hydrogen adsorption measurements and
rarely after the experiment. Partial decomposition of the material during the experiment could be
one possible reason for the discrepancy in hydrogen adsorption capacities of some MOFs reported
by various groups166-168
.
Reference MOF-5 sample. Hydrogen adsorption measurements are a very delicate procedure,
and small mistakes could lead to huge overestimation of hydrogen adsorption20-22
. To validate our
data we performed test measurements on MOF-5 which is one of the most studied MOFs for
hydrogen adsorption. MOF-5 adsorbed 0,3wt.% of H2 at 120bar which is in a reasonable agreement
with results published for MOF-5 samples prepared and activated according to similar procedures166
.
Summarizing this chapter, hydrogen storage in MOFs is mainly governed by surface area at
ambient temperatures and pressures at least up to 120bar. Pore geometry is also an important factor
influencing hydrogen adsorption in MOFs, and therefore should be carefully considered while
designing new MOFs for hydrogen storage. The crystal structure of MOFs must be examined after
the experiment in order to verify their structural stability throughout degassing and hydrogen
adsorption measurements.
4.2 Hydrogen adsorption in MOF-5 doped/bridged with Pt-catalyst
As noted in the previous section, the MOF-5 material was synthesized first as a reference
sample to ensure correctness of hydrogen adsorption measurements. On the next stage of the project
this material was used to verify recent exciting reports published by the group of Prof. R.T. Yang
which claimed that hydrogen adsorption in MOF-5 can be significantly improved by doping with Pt-
catalyst66,59
.
Hydrogen adsorption in all MOFs studied in the previous chapter did not exceed 1wt.% at
ambient temperatures even if hydrogen pressure was increased up to 175bar. Therefore, new
methods to increase hydrogen uptake in MOFs are of significant importance. The methods of Pt

45
doping described in the literature are simple59, 66
and, if confirmed, could be further developed to
optimize hydrogen storage in MOF materials.
Therefore, we performed a set of experiments aimed at studying the effect of Pt catalyst on
hydrogen adsorption in MOF-5. The MOF-5 is a well-characterized material with known hydrogen
adsorption properties which makes it a good model material for studies of catalyst addition
effects167
.
Characterization of pristine MOF-5. Two sets of MOF-5, MOF-5_a and MOF-5_b, were
synthesized following a slightly modified procedure given in the literature. The difference is related
to removal of residual solvent from the pores of the structure166, 168
. Both samples showed the
expected FCC crystal structure (Fm-3m, a=25,8Å) which was in good agreement with previously
published results (see Figure 4.5)168
.
Nitrogen sorption analysis showed that the modified drying process slightly increased surface
area and total pore volume of MOF-5_b compared to MOF-5_a while both samples had the same
micropore volume (see Table 4.2). The increase of pore volume and surface area for MOF-5_b is
mainly contributed by pores in the range of 30-140Å which possibly represent cavities formed
between grains of MOF-5_b during the drying process.
Doping MOF-5 with Pt catalyst. A set of Pt-doped MOF-5 was prepared by mixing MOF-
5_a (or MOF-5_b) samples with Pt/AC catalysts (5wt.% or 10wt.% of Pt) in a weight ratio of 9:1. In
order to improve the contact between Pt catalyst particles and MOF-5 samples, MOF-5, Pt-catalysts,
and sucrose were thoroughly mixed together and subjected to heat treatment according to a slightly
modified protocol published elsewhere59
. After the heat treatment the sucrose carbonized, as was
confirmed by IR spectroscopy, supposedly forming carbon bridges between Pt catalyst particles and
MOF-5 (see Figure 4.6). Both “doped” and “bridged” MOF-5 samples retained their original crystal
structure without any visual changes observed in XRD patterns (see Figure 4.5). A slight decrease
of surface area and pore volume in the “bridged” samples can be explained by pore blockage by
carbonized sucrose and was also observed in the original claim about spillover in MOFs59
.
Prior to hydrogen adsorption measurements all samples were activated at 120ºC in vacuum
during 12 hours. The degassing temperature was chosen in agreement with literature169
. Removal of
solvent molecules from the MOF-5 structure was confirmed by IR spectroscopy. A broad peak at
1660cm-1
, which originated from the C=O band of DMF, disappeared from the IR spectra of
activated samples (see Figure 4.6)170
.

46
5 10 15 20 25 30 35 40
d
c
b
Re
lative
in
ten
sity,
arb
. u
nits
2, deg
a
Figure 4.5. X-ray diffraction patterns of a) as-synthesized MOF-5_a; b) MOF-5_a after hydrogen adsorption
measurements; c) MOF-5_a mixed with 5wt.% Pt/AC (after hydrogen adsorption measurement) d) MOF-5_a
bridged with 5wt.% Pt/AC (after hydrogen adsorption measurement).
BET,
m2/g
Langm.,
m2/g
Micropore volume,
cm3/g
Pore volume, cm3/g H2 uptake, wt.%
MOF-5_a 832 862 0,31 0,37 0,38
MOF-5_b 908 943 0,31 0,44 0,47
MOF-5_a Pt 5wt.%
“mixed” 759 789 0,29 0,37 0,43
MOF-5_b Pt 10wt.%
“mixed” 761 802 0,29 0,33 0,32
MOF-5_a Pt 5wt.%
“bridged” 618 652 0,23 0,31 0,27
MOF-5_b Pt10wt.%
“bridged” 441 451 0,16 0,18 0,27
Pt 5wt.% on AC 1183 1267 0,48 0,97 0,53
Pt 10wt.% on AC 595 612 0,24 0,45 0,39
MOF-5 59
1021 1355 0,39 0,68 0,4
MOF-5 Pt 5wt.%
“mixed” 59
n/a n/a n/a n/a ~1,6
MOF-5 Pt 5wt.%
“bridged” 66
890 n/a n/a 0,61 3,0
Table 4.2. Hydrogen/nitrogen adsorption data for samples of pristine MOF-5 samples, Pt catalysts and
MOF/Pt samples synthesized by “mixing” and “bridging. H2 uptake is for 120 Bar and 150C.
Hydrogen adsorption in Pt doped samples. Results of hydrogen adsorption measurements
are summarized in Table 4.2. Pristine MOF-5_a adsorbed 0,47 wt.% of hydrogen at 15°C and
120bar which is in a rather good agreement with literature (see Figure 4.7). In contrast to our
expectations, no Pt-doped or Pt-bridged samples showed any significant increase in hydrogen

47
Figure 4.6. IR spectra recorded for: a) sucrose; b) mixture of sucrose, MOF-5_ a, and 5wt.% Pt/AC catalyst
before the bridging process; c) mixture of sucrose, MOF-5_ a, and 5wt.% Pt/AC catalyst after the bridging
process; d) pristine MOF-5_a material.
0 20 40 60 80 100 120
0.0
0.1
0.2
0.3
0.4
0.5
0.6
hydro
gen u
pta
ke, w
t.%
pressure, bar
Figure 4.7. Hydrogen adsorption isotherms measured on: MOF-5_a (-■-), MOF-5_a mixed with 5wt.%
Pt/AC (-●-), MOF-5_a bridged with 5wt.% Pt/AC (-♦-), 5wt.% Pt/AC (-▲-).
adsorption capacity compared to pristine samples, and no specific features typically attributed to the
spillover effect were observed in our experiment (e.g. slow kinetics, linear pressure dependence of
adsorption values). Hydrogen adsorption was reversible, and the maximum was achieved in a few
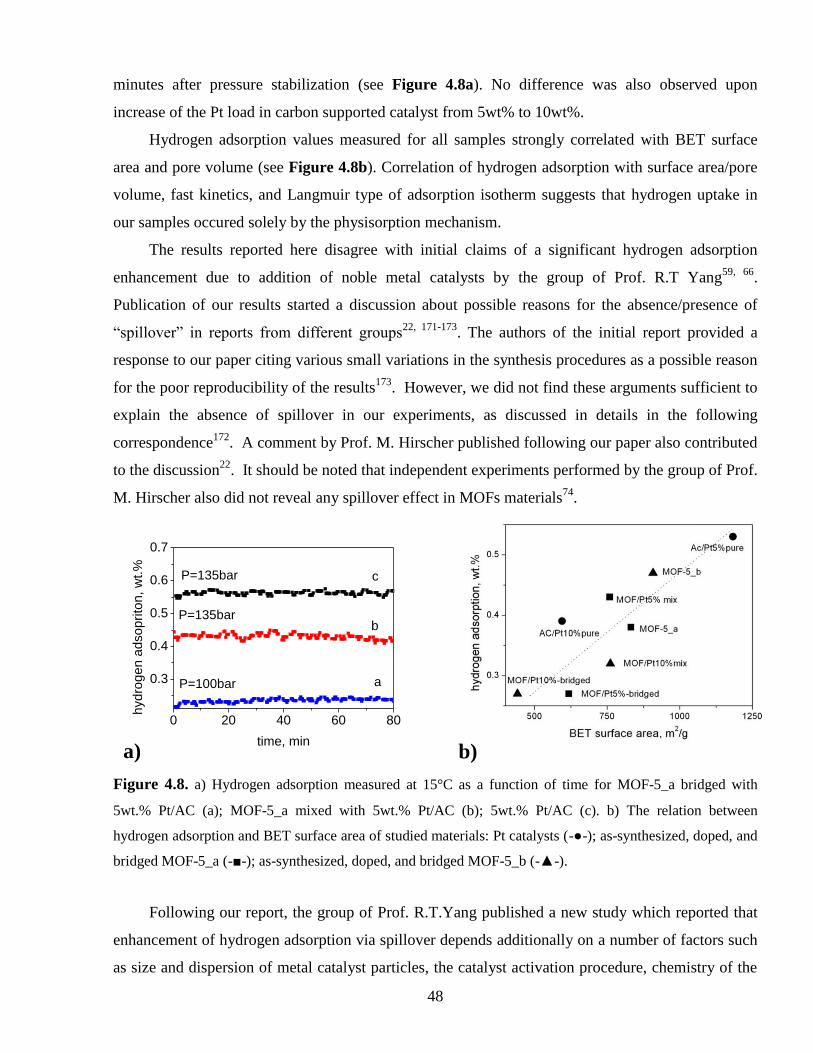
48
minutes after pressure stabilization (see Figure 4.8a). No difference was also observed upon
increase of the Pt load in carbon supported catalyst from 5wt% to 10wt%.
Hydrogen adsorption values measured for all samples strongly correlated with BET surface
area and pore volume (see Figure 4.8b). Correlation of hydrogen adsorption with surface area/pore
volume, fast kinetics, and Langmuir type of adsorption isotherm suggests that hydrogen uptake in
our samples occured solely by the physisorption mechanism.
The results reported here disagree with initial claims of a significant hydrogen adsorption
enhancement due to addition of noble metal catalysts by the group of Prof. R.T Yang59, 66
.
Publication of our results started a discussion about possible reasons for the absence/presence of
“spillover” in reports from different groups22, 171-173
. The authors of the initial report provided a
response to our paper citing various small variations in the synthesis procedures as a possible reason
for the poor reproducibility of the results173
. However, we did not find these arguments sufficient to
explain the absence of spillover in our experiments, as discussed in details in the following
correspondence172
. A comment by Prof. M. Hirscher published following our paper also contributed
to the discussion22
. It should be noted that independent experiments performed by the group of Prof.
M. Hirscher also did not reveal any spillover effect in MOFs materials74
.
0 20 40 60 80
0.3
0.4
0.5
0.6
0.7
P=135bar
P=135bar
c
b
hyd
rog
en
ad
so
pri
ton
, w
t.%
time, min
aP=100bar
Figure 4.8. a) Hydrogen adsorption measured at 15°C as a function of time for MOF-5_a bridged with
5wt.% Pt/AC (a); MOF-5_a mixed with 5wt.% Pt/AC (b); 5wt.% Pt/AC (c). b) The relation between
hydrogen adsorption and BET surface area of studied materials: Pt catalysts (-●-); as-synthesized, doped, and
bridged MOF-5_a (-■-); as-synthesized, doped, and bridged MOF-5_b (-▲-).
Following our report, the group of Prof. R.T.Yang published a new study which reported that
enhancement of hydrogen adsorption via spillover depends additionally on a number of factors such
as size and dispersion of metal catalyst particles, the catalyst activation procedure, chemistry of the
a) b)

49
adsorbent surface, and the number of defects induced in the adsorbent63, 67, 68, 174-177
. It is worth to
mention that none of those factors were considered in the original reports where a significant
enhancement of hydrogen adsorption was observed in MOF-5 “mixed” or “bridged” with Pt-
catalysts59, 66
. In our work “mixed” and “bridged” MOF-5 samples prepared according to a similar
synthesis procedure failed to show any signs of spillover. The absence of spillover in MOFs
mixed/bridged with Pt-catalyst was later independently confirmed by other research groups74, 75
.
It can be concluded that the methods proposed previously, e.g. a simple mechanical mixture of
Pt catalyst and MOFs powders, are not sufficient to provide room temperature spillover. The
discrepancy in hydrogen adsorption measurements performed on samples with seemingly very
similar structural properties can possibly be due to some unidentified additional factors or to errors
in hydrogen adsorption measurements.
4.3 Hydrogen storage in nanocarbon materials prepared by the cycloaddition
reaction of C60 with coronene and anthracene
In the solid state the C60 molecules are close packed forming the fullerite phase. The surface
area of the fullerite phase is negligible but, nevertheless, hydrogen is able to diffuse between C60
molecules and occupy interstitial sites. The fullerite phase contains two types of interstitial sites but
only one of them, the octahedral void, is sufficiently large to accommodate one hydrogen molecule.
Therefore, hydrogen storage in fullerene C60 is limited to ~0,28 wt.% at ambient temperatures and
moderate hydrogen pressures.
Functionalization of fullerene C60 aimed at synthesis of new hydrogen storage materials is
focused on a significant expansion of the structure, making interstitial sites sufficiently large to
accommodate more than one hydrogen molecule. Another goal would be to create some framework
materials with C60 molecules connected by some linkers into a 3D structure (similar to MOFs) thus
making all the surface area of the fullerene molecules available for hydrogen adsorption. The
project described here was aimed at verification of a possibility to functionalize C60 by a reaction
with various PAHs, e.g. coronene and anthracene.
We have studied the reaction between fullerene C60 and coronene in the temperature interval of
450-850ºC. The reaction resulted in expansion of the FCC fullerene C60 structure in the temperature
interval of 500-650ºC as shown in Figure 4.9. Higher temperatures of the reaction (700-850ºC)
resulted in amorphization of the C60 structure and formation of some nanostructured carbon
materials, as was confirmed by Raman spectroscopy23
. Reaction products with an increased cell
parameter were tested for hydrogen adsorption.
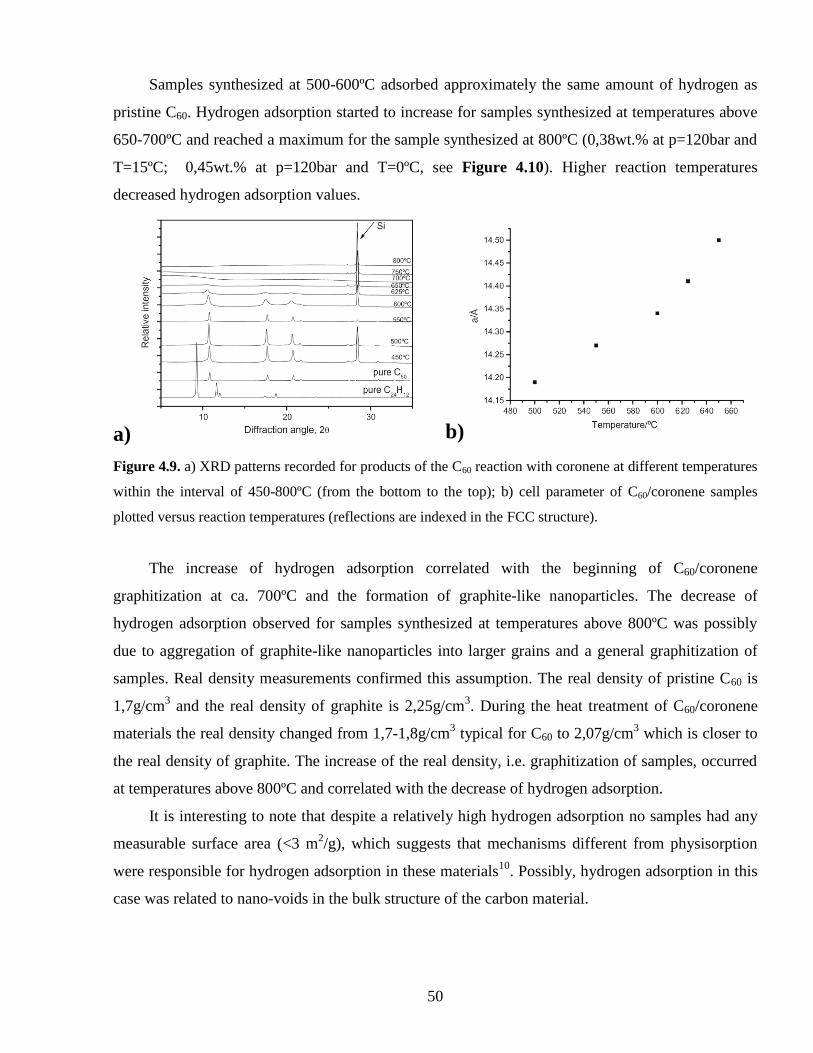
50
Samples synthesized at 500-600ºC adsorbed approximately the same amount of hydrogen as
pristine C60. Hydrogen adsorption started to increase for samples synthesized at temperatures above
650-700ºC and reached a maximum for the sample synthesized at 800ºC (0,38wt.% at p=120bar and
T=15ºC; 0,45wt.% at p=120bar and T=0ºC, see Figure 4.10). Higher reaction temperatures
decreased hydrogen adsorption values.
a) b)
Figure 4.9. a) XRD patterns recorded for products of the C60 reaction with coronene at different temperatures
within the interval of 450-800ºC (from the bottom to the top); b) cell parameter of C60/coronene samples
plotted versus reaction temperatures (reflections are indexed in the FCC structure).
The increase of hydrogen adsorption correlated with the beginning of C60/coronene
graphitization at ca. 700ºC and the formation of graphite-like nanoparticles. The decrease of
hydrogen adsorption observed for samples synthesized at temperatures above 800ºC was possibly
due to aggregation of graphite-like nanoparticles into larger grains and a general graphitization of
samples. Real density measurements confirmed this assumption. The real density of pristine C60 is
1,7g/cm3 and the real density of graphite is 2,25g/cm
3. During the heat treatment of C60/coronene
materials the real density changed from 1,7-1,8g/cm3 typical for C60 to 2,07g/cm
3 which is closer to
the real density of graphite. The increase of the real density, i.e. graphitization of samples, occurred
at temperatures above 800ºC and correlated with the decrease of hydrogen adsorption.
It is interesting to note that despite a relatively high hydrogen adsorption no samples had any
measurable surface area (<3 m2/g), which suggests that mechanisms different from physisorption
were responsible for hydrogen adsorption in these materials10
. Possibly, hydrogen adsorption in this
case was related to nano-voids in the bulk structure of the carbon material.
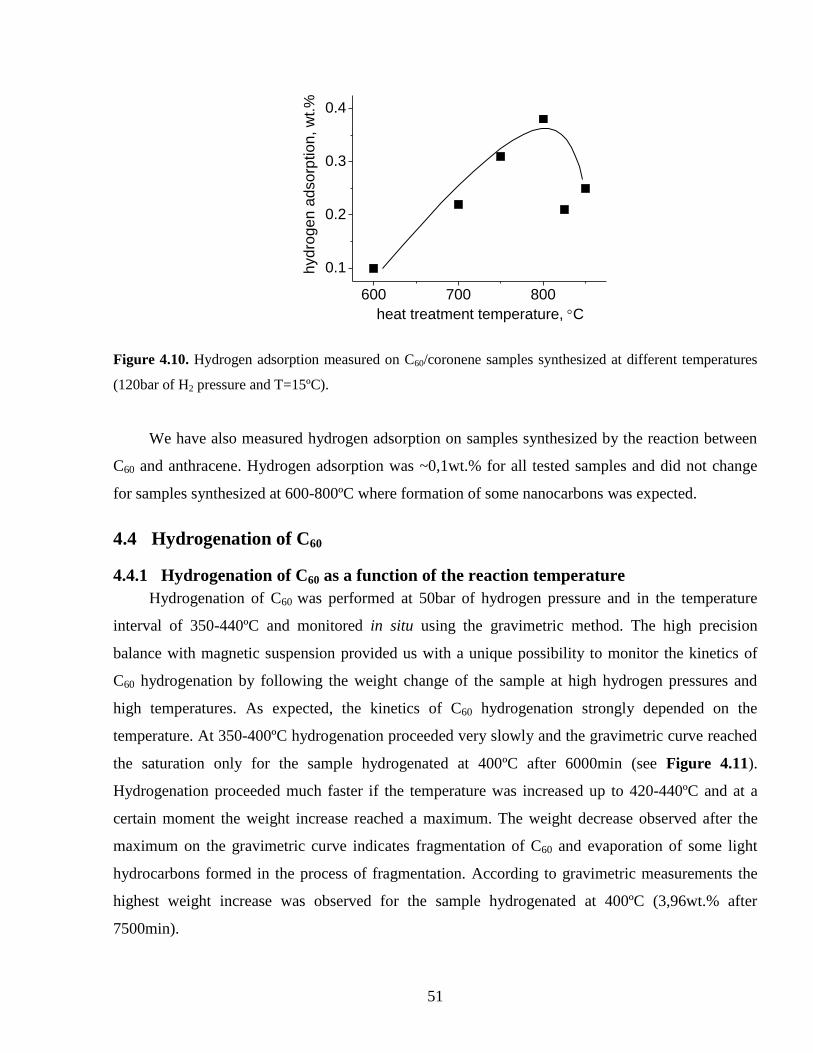
51
600 700 800
0.1
0.2
0.3
0.4
heat treatment temperature, Ch
yd
rog
en
ad
so
rptio
n,
wt.%
Figure 4.10. Hydrogen adsorption measured on C60/coronene samples synthesized at different temperatures
(120bar of H2 pressure and T=15ºC).
We have also measured hydrogen adsorption on samples synthesized by the reaction between
C60 and anthracene. Hydrogen adsorption was ~0,1wt.% for all tested samples and did not change
for samples synthesized at 600-800ºC where formation of some nanocarbons was expected.
4.4 Hydrogenation of C60
4.4.1 Hydrogenation of C60 as a function of the reaction temperature
Hydrogenation of C60 was performed at 50bar of hydrogen pressure and in the temperature
interval of 350-440ºC and monitored in situ using the gravimetric method. The high precision
balance with magnetic suspension provided us with a unique possibility to monitor the kinetics of
C60 hydrogenation by following the weight change of the sample at high hydrogen pressures and
high temperatures. As expected, the kinetics of C60 hydrogenation strongly depended on the
temperature. At 350-400ºC hydrogenation proceeded very slowly and the gravimetric curve reached
the saturation only for the sample hydrogenated at 400ºC after 6000min (see Figure 4.11).
Hydrogenation proceeded much faster if the temperature was increased up to 420-440ºC and at a
certain moment the weight increase reached a maximum. The weight decrease observed after the
maximum on the gravimetric curve indicates fragmentation of C60 and evaporation of some light
hydrocarbons formed in the process of fragmentation. According to gravimetric measurements the
highest weight increase was observed for the sample hydrogenated at 400ºC (3,96wt.% after
7500min).

52
0 2000 4000 6000 8000
-2
0
2
4
T=440C
T=420C
T=350C
T=370C
rela
tive
we
igh
t ch
an
ge
, w
t.%
hydrogenation time, min
T=400C
Figure 4.11. Weight change recorded in situ from C60 hydrogenated at different temperatures (p=50bar of
hydrogen).
Samples produced in the hydrogenation experiments shown in Figure 4.11 were extensively
studied ex situ. Analysis of XRD patterns recorded from these samples showed that reaction
products are different for experiments performed at different temperatures. Samples hydrogenated at
350-400ºC showed a FCC lattice with an increased cell parameter which is typical for hydrogenated
fullerenes. For instance, the sample hydrogenated at 375ºC showed a cell parameter of a=14,60Å
which is close to a=14,55Å previously reported for C60H18114
. Prolonged hydrogenation at 400-
440ºC resulted in material amorphization and disappearance of all reflections except the (111)
reflection from the XRD patterns.
The chemical composition of samples subjected to prolonged hydrogenation reactions at
different temperatures was determined using elemental analysis. Hydrogen content agreed very well
with the results of the gravimetric analysis for samples hydrogenated at 350-375ºC and is higher
than expected for samples hydrogenated at 400-440ºC. Samples hydrogenated at 420ºC and 440ºC
contained 4,9wt.% and 4,7wt.% of hydrogen correspondingly despite the negative total weight
change. A high hydrogen content together with a negative total weight change are expected if part of
the C60 molecules collapse during hydrogenation with formation of large hydrocarbon molecules
(fullerene fragments).
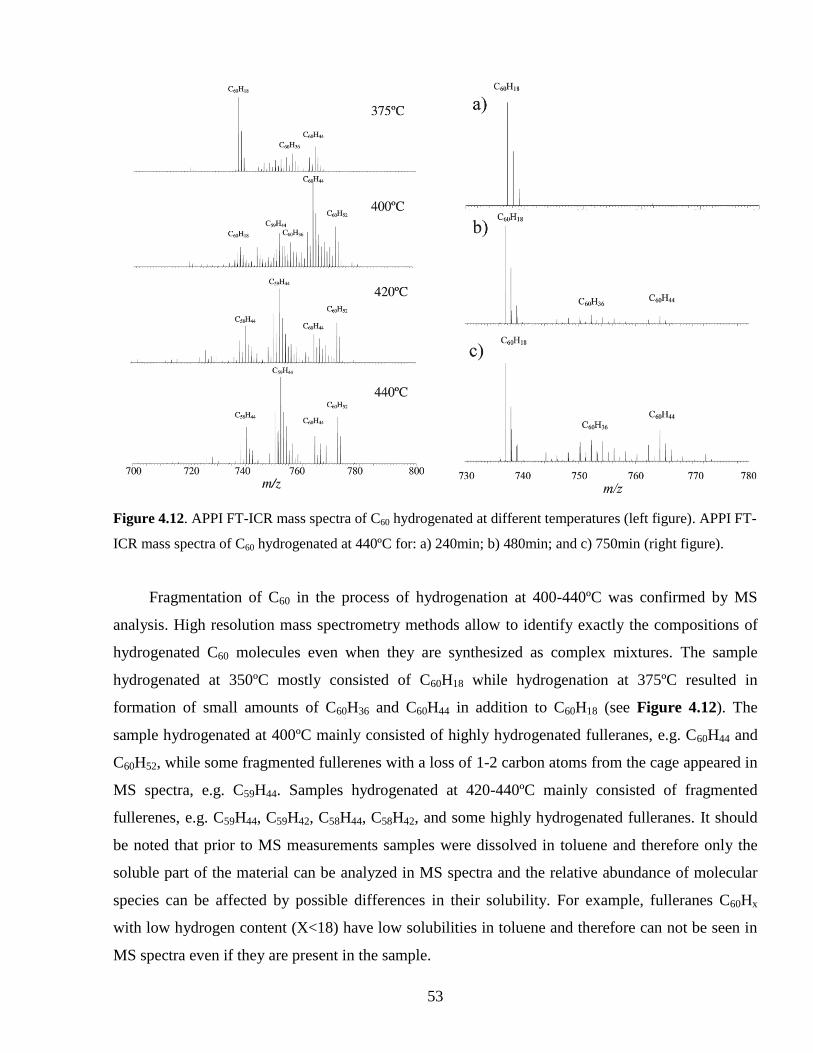
53
Figure 4.12. APPI FT-ICR mass spectra of C60 hydrogenated at different temperatures (left figure). APPI FT-
ICR mass spectra of C60 hydrogenated at 440ºC for: a) 240min; b) 480min; and c) 750min (right figure).
Fragmentation of C60 in the process of hydrogenation at 400-440ºC was confirmed by MS
analysis. High resolution mass spectrometry methods allow to identify exactly the compositions of
hydrogenated C60 molecules even when they are synthesized as complex mixtures. The sample
hydrogenated at 350ºC mostly consisted of C60H18 while hydrogenation at 375ºC resulted in
formation of small amounts of C60H36 and C60H44 in addition to C60H18 (see Figure 4.12). The
sample hydrogenated at 400ºC mainly consisted of highly hydrogenated fulleranes, e.g. C60H44 and
C60H52, while some fragmented fullerenes with a loss of 1-2 carbon atoms from the cage appeared in
MS spectra, e.g. C59H44. Samples hydrogenated at 420-440ºC mainly consisted of fragmented
fullerenes, e.g. C59H44, C59H42, C58H44, C58H42, and some highly hydrogenated fulleranes. It should
be noted that prior to MS measurements samples were dissolved in toluene and therefore only the
soluble part of the material can be analyzed in MS spectra and the relative abundance of molecular
species can be affected by possible differences in their solubility. For example, fulleranes C60Hx
with low hydrogen content (X<18) have low solubilities in toluene and therefore can not be seen in
MS spectra even if they are present in the sample.

54
4.4.2 Hydrogenation of C60 as a function of the reaction time
To gain a better understanding of C60 hydrogenation we prepared a set of samples
hydrogenated at 440ºC with different durations of the heat treatment: 240min, 480min, and 750min.
The sample hydrogenated for 240min, which corresponds to ~75% of the maximal weight gain
(hereafter 440ºC_75%), had a FCC cell parameter of 14,47Å and mostly consisted of C60H18
according to MS (see Figure 4.12). The samples hydrogenated during 480min (~85% of the
maximal weight gain, hereafter 440ºC_85%) and 750min (the maximal weight gain, hereafter
440ºC_100%) had larger FCC cell parameters, i.e. higher degrees of hydrogenation. According to
MS spectra those samples were mainly composed by C60H18, C60H36, and C60H44.
It is interesting to note that products of C60 hydrogenation at 440ºC with different durations of
hydrogenation are very similar to products of C60 hydrogenation at different temperatures (see the
previous section). We concluded that the C60 hydrogenation pathway is the same for different
hydrogenation temperatures and a similar set of C60Hx molecules is always formed. Higher
temperatures only lead to faster kinetics of hydrogenation.
4.4.3 C60 hydrogenation and fragmentation pathways
Hydrogenation of C60 occurs by addition of hydrogen pairs and, in principle, all theoretically
possible compositions with an even number of hydrogen atoms could be formed starting from C60H2
and finishing with C60H60. However, Figure 4.12 shows that some of the fulleranes are much more
abundant than others reflecting a more complex process which consists of certain steps. The
existence of these steps suggests that fulleranes with certain compositions are more stable than
others and that the kinetics of hydrogen addition varies very strongly for fulleranes with different
compositions.
The hydrogenation pathway of C60 can be summarized using the following main steps:
C60→C60H18→C60H36→C60H44→C60H52. We suggest that synthesis of C60H52 is the last step of
hydrogenation. Hydrogenated fullerenes with higher hydrogen content are either not formed or
extremely unstable and collapse in the process of reaction. This C60 hydrogenation pathway is in
agreement with earlier theoretical predictions by Zhao et al178
.
Further hydrogenation leads to formation of fragmented fullerenes. Fragmentation of C60
during hydrogenation is an undesirable process for hydrogen storage applications. On the other
hand, fragmentation of C60 could lead to synthesis of some new molecules and materials. Therefore,
it is important to understand fragmentation mechanisms in order to either avoid fragmentation or to
use it in a controlled way for synthesis of new materials.
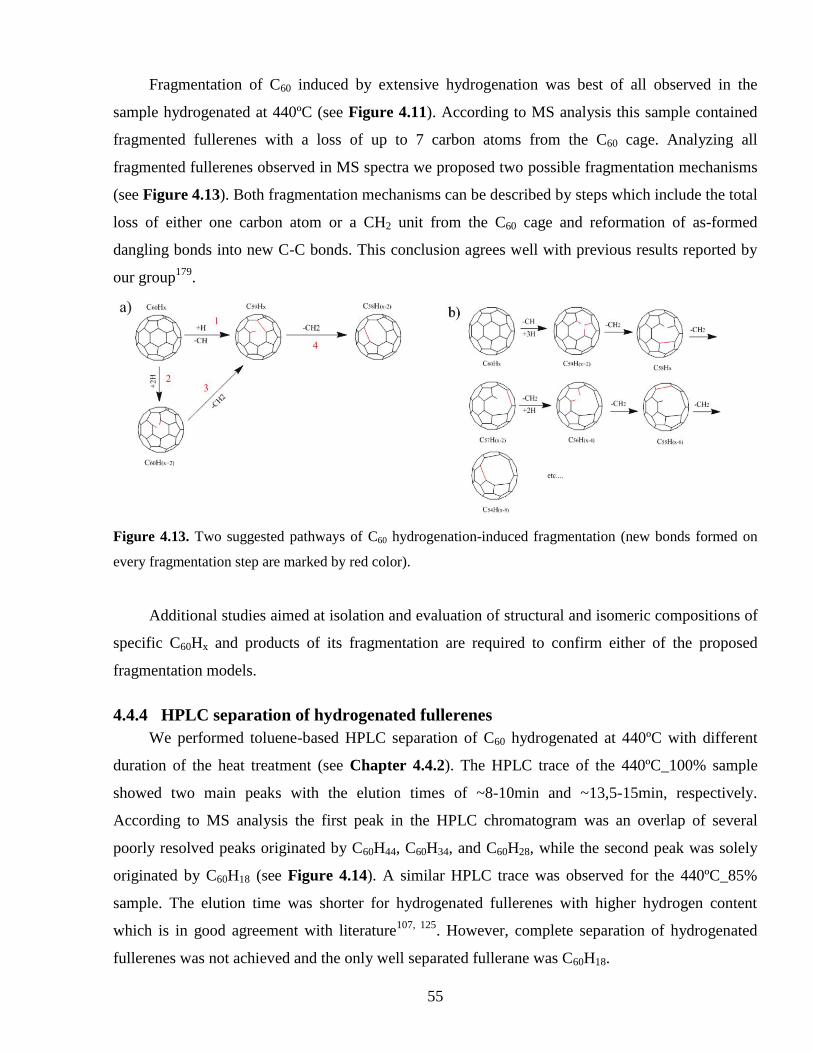
55
Fragmentation of C60 induced by extensive hydrogenation was best of all observed in the
sample hydrogenated at 440ºC (see Figure 4.11). According to MS analysis this sample contained
fragmented fullerenes with a loss of up to 7 carbon atoms from the C60 cage. Analyzing all
fragmented fullerenes observed in MS spectra we proposed two possible fragmentation mechanisms
(see Figure 4.13). Both fragmentation mechanisms can be described by steps which include the total
loss of either one carbon atom or a CH2 unit from the C60 cage and reformation of as-formed
dangling bonds into new C-C bonds. This conclusion agrees well with previous results reported by
our group179
.
Figure 4.13. Two suggested pathways of C60 hydrogenation-induced fragmentation (new bonds formed on
every fragmentation step are marked by red color).
Additional studies aimed at isolation and evaluation of structural and isomeric compositions of
specific C60Hx and products of its fragmentation are required to confirm either of the proposed
fragmentation models.
4.4.4 HPLC separation of hydrogenated fullerenes
We performed toluene-based HPLC separation of C60 hydrogenated at 440ºC with different
duration of the heat treatment (see Chapter 4.4.2). The HPLC trace of the 440ºC_100% sample
showed two main peaks with the elution times of ~8-10min and ~13,5-15min, respectively.
According to MS analysis the first peak in the HPLC chromatogram was an overlap of several
poorly resolved peaks originated by C60H44, C60H34, and C60H28, while the second peak was solely
originated by C60H18 (see Figure 4.14). A similar HPLC trace was observed for the 440ºC_85%
sample. The elution time was shorter for hydrogenated fullerenes with higher hydrogen content
which is in good agreement with literature107, 125
. However, complete separation of hydrogenated
fullerenes was not achieved and the only well separated fullerane was C60H18.

56
HPLC separation was also performed for the sample hydrogenated at 440ºC for a prolonged
period of time (3300min) aiming on separation of some fragmented fulleranes, e.g. C59H44 or
C58H44. However, it turned out that the HPLC column was not suitable for separation of fragmented
fulleranes. This column provided separation according to the number of hydrogen attached to the
C60 cage while some fragmented fulleranes have the same number of hydrogen atoms but with a loss
of 1-3 carbon atoms.
Figure 4.14. HPLC chromatogram of C60 hydrogenated at 440ºC for a) 750min (the maximal weight gain); b)
450min (85% of the maximal weight gain).
4.4.5 Hydrogenation of C60 with addition of metal catalysts
As was shown earlier (see Chapter 4.4.3) hydrogenation of C60 follows a certain pathway and,
in principle, at the certain stage of hydrogenation could result in conversion of all material into a
fullerane with high hydrogen content, e.g. C60H52. However, hydrogenation of C60 has slow kinetics,
and prolonged heating at reaction temperatures leads to fragmentation of some highly hydrogenated
fulleranes. Therefore, synthesis of highly hydrogenated C60 could be possible only if some methods
to suppress fragmentation and to accelerate hydrogenation kinetics are found. Hydrogenation of C60
with addition of metal catalysts has faster kinetics100, 180
and possibly will result in synthesis of
fulleranes with a lower degree of fragmentation compared to non-catalytic hydrogenation.
In this work we studied hydrogenation of C60 at 400ºC and 50bar of H2 pressure with addition
of Pt- and Ni-catalysts and compared it with non-catalytic hydrogenation. Non-catalytic
hydrogenation of C60 proceeds very slowly (see Figure 4.11), and the sample weight reaches
saturation only after 6000min. Addition of Pt catalyst significantly improved hydrogenation kinetics.
The maximum weight gain was achieved already after 500min while prolonged hydrogenation
resulted in a total weight decrease similar to that of catalyst free samples. Two samples with
hydrogenation times of 500min (hereafter, 400ºC_Pt) and 1700min (hereafter, 400ºC_Pt_long) were
analyzed in detail. Some experiments were also performed with Ni catalyst supported on carbon.
a) b)

57
The total weight of C60 hydrogenated with addition of Ni catalyst started to decrease already after
ca. 50min of hydrogenation. However, this effect is not due to fragmentation of C60. It should be
attributed to hydrogen reduction of Ni catalyst which prior to hydrogenation was stored in air and
oxidized.
Compositions of samples synthesized by catalytic and non-catalytic hydrogenation appeared to
be similar according to MS analysis (see Figure 4.15). It could be assumed that in both cases
hydrogenation follows the same hydrogenation pathway with sequential formation of C60H18,
C60H36, C60H44, and C60H52.
Surprisingly, XRD structural characterization showed remarkable structural differences in
samples synthesized by catalytic and non-catalytic hydrogenation. C60 hydrogenated at 400ºC
without addition of metal catalysts had the same FCC lattice as pristine C60 but with an increased
cell parameter (a=15,02Å compared to a=14,17Å for pristine C60). The 400ºC_Pt sample consisted
of two phases: a FCC phase with a=14,32Å and a body-centered cubic (BCC) phase with a=12,0Å.
Prolonged hydrogenation left the cell parameter of the BCC phase unchanged while the cell
parameter of the FCC phase increased up to 14,82Å (see Figure 4.16). The 400ºC_Ni sample also
consisted of FCC and BCC phases with cell parameters 14,74Å and 11,93Å correspondingly.
It can be suggested that catalytic hydrogenation of samples with addition of catalyst proceeds
in two steps. The first step is the same as for non-catalytic hydrogenation and begins with formation
of C60H18 with the FCC lattice. This was confirmed by NMR measurements on the 400ºC_Ni sample
which showed that it contained the C3v isomer of C60H18, the same C60H18 isomer as obtained by
non-catalytic hydrogenation of C60114
. In the next step hydrogenation proceeds by rapid formation of
the BCC phase while a part of the material still retains the original FCC lattice. Prolonged
hydrogenation results in conversion of more and more material into highly hydrogenated fulleranes
with the BCC lattice.
It can be suggested that even for the sample with added Pt we observed both catalytic and non-
catalytic hydrogenation, possibly due to inhomogeneous distribution of Pt particles in the samples.
In this case fulleranes with the FCC lattice were formed by non-catalytic hydrogenation and
fulleranes with the BCC lattice by catalytic hydrogenation. It should be noted that no fulleranes with
the BCC lattice were observed in any sample hydrogenated without addition of metal catalysts. Both
FCC and BCC phases possibly coexisted in the sample due to a large grain size of C60 or due to poor
contact with catalyst particles for some grains. Highly hydrogenated fulleranes with the BCC lattice
were quickly formed on C60 grain boundaries in the vicinity to Pt catalyst particles. Pt catalyst
particles served as centers for dissociation of molecular hydrogen into atomic hydrogen. Prolonged
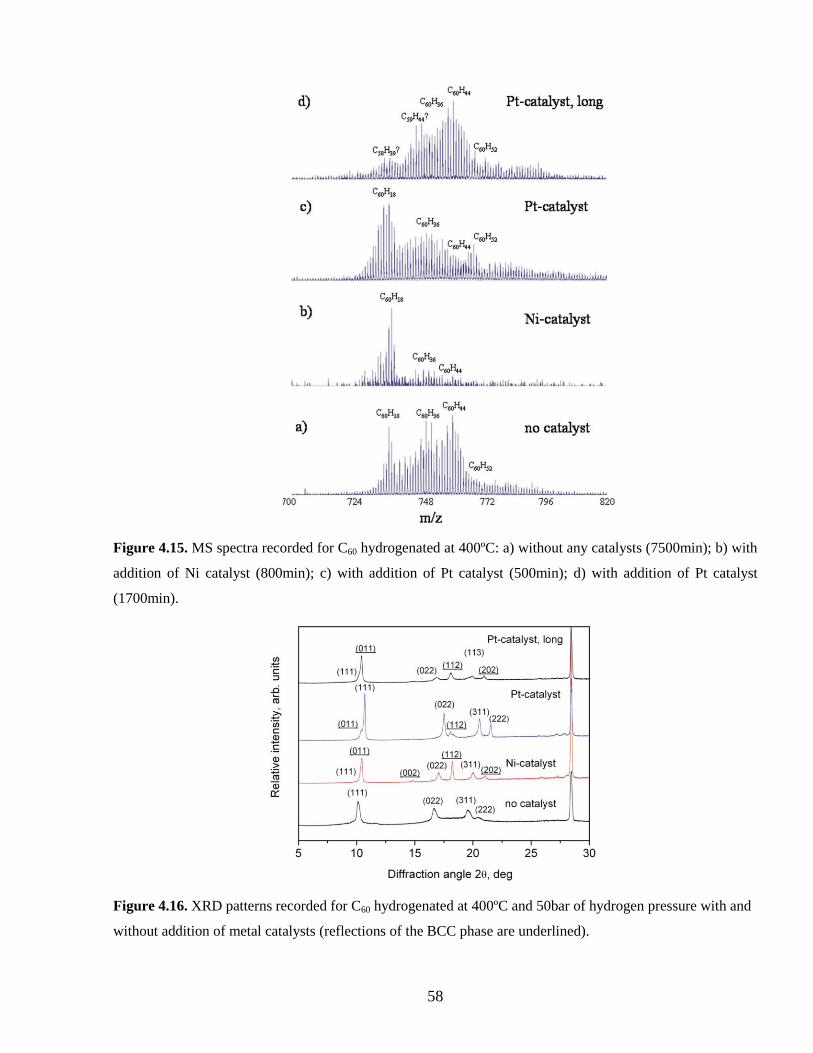
58
Figure 4.15. MS spectra recorded for C60 hydrogenated at 400ºC: a) without any catalysts (7500min); b) with
addition of Ni catalyst (800min); c) with addition of Pt catalyst (500min); d) with addition of Pt catalyst
(1700min).
Figure 4.16. XRD patterns recorded for C60 hydrogenated at 400ºC and 50bar of hydrogen pressure with and
without addition of metal catalysts (reflections of the BCC phase are underlined).

59
hydrogenation increased the fraction of hydrogenated fulleranes with the BCC lattice due to
migration of atomic hydrogen further away from catalyst particles. Synthesis of fulleranes with the
BCC lattice and similar cell parameters was earlier reported for C60 hydrogenated with atomic
hydrogen110, 181, 182
.
Further experiments are required to understand how different factors such as the catalyst
particle size or the contact between C60 and metal catalyst particles effect C60 hydrogenation. For
instance, hydrogenation should be tested for C60 with reduced grain size (e.g. by ball milling) and
for C60 mixed with different types of metal catalysts (e.g. varying catalyst dispersion or type of the
support material).
4.4.6 Reversibility of C60 hydrogenation
Fullerene C60 was considered as a promising material for hydrogen storage by chemisorption.
However, hydrogenation of C60 must be a reversible process to be useful for hydrogen storage. To
check the reversibility of C60 hydrogenation, we studied samples hydrogenated in the temperature
interval of 350-400ºC with or without addition of metal catalysts by TGA. Samples synthesized at
temperatures above 400ºC fragmented already during hydrogenation and therefore reversible
formation of C60 upon dehydrogenation was not expected for those samples.
C60 hydrogenation at 350ºC resulted in synthesis of mainly C60H18, according to MS
measurements (see Figure 4.17). During dehydrogenation the weight of the sample started to
decrease at ~450ºC and stabilized after 600-650ºC with a stepwise loss of ca. 2wt% (see Table 4.3).
A gradual decrease of the sample weight upon further heating could be explained by sublimation of
recovered C60. The weight loss obtained by TGA was similar to the hydrogen content estimated by
elemental analysis (1,7wt%). Therefore, the weight loss in the TGA experiment was mainly
attributed to hydrogen release. Products of dehydrogenation were studied by mass spectrometry and
XRD analysis. According to MS analysis the dehydrogenated sample consisted of C60 and no other
peaks were observed in MS spectra (see Figure 4.17). Similar results were obtained for samples
hydrogenated at 375ºC and 400ºC. Weight losses obtained by TGA analysis were higher than the
hydrogen content obtained from the elemental analysis which indicated partial decomposition of C60
upon hydrogen release (see Table 4.3)106
. According to MS spectra some C60 was partially
recovered upon dehydrogenation for both samples.
Upon hydrogenation the cell parameter of the C60 FCC structure expanded indicating that the
molecular diameter increased due to attached hydrogen atoms. After dehydrogenation the cell
parameter, i.e. the diameter of molecules, was expected to decrease. Surprisingly, after

60
dehydrogenation the cell parameter remained increased (a=14,40Å) and did not return back to the
value a=14,17Å reported for C60 (see Figure 4.18). The same result was obtained for the sample
synthesized at 375ºC while dehydrogenation of the sample synthesized at 400ºC resulted in sample
amorphization.
Figure 4.17. MS spectra recorded for the sample hydrogenated at 350ºC and 50bar of hydrogen pressure
(7500min): before (bottom spectrum) and after (top spectrum) dehydrogenation.
10 15 20 25 30
(112)(011)
(222)
(311)(022)(111)a=14.35Å-fcc
a=14.32Å-fcc
a=12.00Å-bcc
a=14.40Å-fcc
a=14.37Å-fcc
d)
a)
c)
b)
R
ela
tive
in
ten
sity, a
rb. u
nits
Diffraction angle 2, deg
Figure 4.18. XRD patterns recorded for a) the sample hydrogenated at 350ºC (7500min); b) the sample
hydrogenated at 350ºC after dehydrogenation; c) the sample hydrogenated at 400ºC with addition of Pt
catalyst (500min); d) the sample hydrogenated at 400ºC with addition of Pt catalyst after dehydrogenation.

61
Synthesis T, ºC C content, elemen.
analysis, wt.%
H content, elemen.
analysis, wt.%
H content, gravim.
analysis, wt.%
TGA weight loss,
wt.%
350 97,4 1,7 1,67 2,04
375 96,4 2,9 2,73 4,06
400 94,9 4,4 3,96 6,92
400_Pt* n/a n/a n/a 3,85
Table 4.3. Summary of the elemental analysis performed for samples hydrogenated at 350-400ºC and its
comparison with results of the TGA analysis.
*- the sample hydrogenated at 400ºC with addition of Pt catalyst (500min).
Interesting results were obtained for the sample hydrogenated with addition of Pt catalyst.
After hydrogenation at 400ºC for 500min the sample consisted of two fullerane phases: FCC phase
and BCC phase (see Chapter 4.4.5 and Figure 4.18). As suggested in Chapter 4.4.5 catalytic
hydrogenation started with synthesis of fulleranes with the FCC lattice (with an increased cell
parameter) and then the BCC phase was formed. After dehydrogenation the BCC phase was likely
converted back to the FCC phase with an increased cell parameter (no BCC reflections were
observed in XRD patterns after dehydrogenation). However, the cell parameter of the FCC phase
remained increased after dehydrogenation and did not go back to 14,17Å as reported for pristine C60.
As a hint for future research it would be interesting to check the reversibility of C60
hydrogenation when fulleranes with only the BCC lattice are formed. Fulleranes with the BCC
lattice could be synthesized by hydrogenation of C60 with atomic hydrogen181, 182
. Direct reaction of
C60 with hydrogen gas normally results in synthesis of either pure FCC fullerane phase or a mixture
of FCC and BCC fullerane phases100
. Synthesis of fulleranes with purely BCC lattice using direct
reaction of C60 with hydrogen gas could possibly be achieved by improving the dispersion of metal
catalyst particles and their contact with C60 grains.
It is also interesting to understand why the cell parameter of the FCC phase did not go back to
the original value of C60 after dehydrogenation of fulleranes. In order to answer this question we
synthesized a sample which contained 95% of the C60H18 C3v isomer (without addition of any metal
catalysts)114
and studied the products obtained by the heat treatment of this sample in the
temperature interval of 410-600ºC.
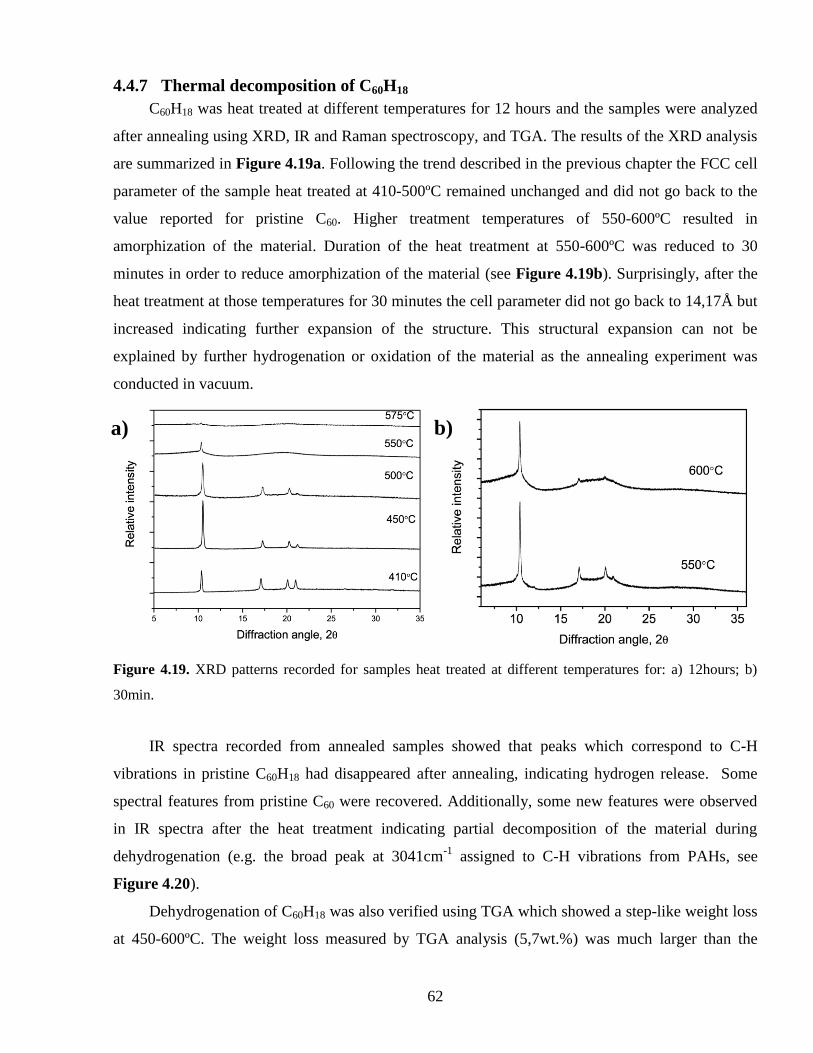
62
4.4.7 Thermal decomposition of C60H18
C60H18 was heat treated at different temperatures for 12 hours and the samples were analyzed
after annealing using XRD, IR and Raman spectroscopy, and TGA. The results of the XRD analysis
are summarized in Figure 4.19a. Following the trend described in the previous chapter the FCC cell
parameter of the sample heat treated at 410-500ºC remained unchanged and did not go back to the
value reported for pristine C60. Higher treatment temperatures of 550-600ºC resulted in
amorphization of the material. Duration of the heat treatment at 550-600ºC was reduced to 30
minutes in order to reduce amorphization of the material (see Figure 4.19b). Surprisingly, after the
heat treatment at those temperatures for 30 minutes the cell parameter did not go back to 14,17Å but
increased indicating further expansion of the structure. This structural expansion can not be
explained by further hydrogenation or oxidation of the material as the annealing experiment was
conducted in vacuum.
Figure 4.19. XRD patterns recorded for samples heat treated at different temperatures for: a) 12hours; b)
30min.
IR spectra recorded from annealed samples showed that peaks which correspond to C-H
vibrations in pristine C60H18 had disappeared after annealing, indicating hydrogen release. Some
spectral features from pristine C60 were recovered. Additionally, some new features were observed
in IR spectra after the heat treatment indicating partial decomposition of the material during
dehydrogenation (e.g. the broad peak at 3041cm-1
assigned to C-H vibrations from PAHs, see
Figure 4.20).
Dehydrogenation of C60H18 was also verified using TGA which showed a step-like weight loss
at 450-600ºC. The weight loss measured by TGA analysis (5,7wt.%) was much larger than the
a) b)
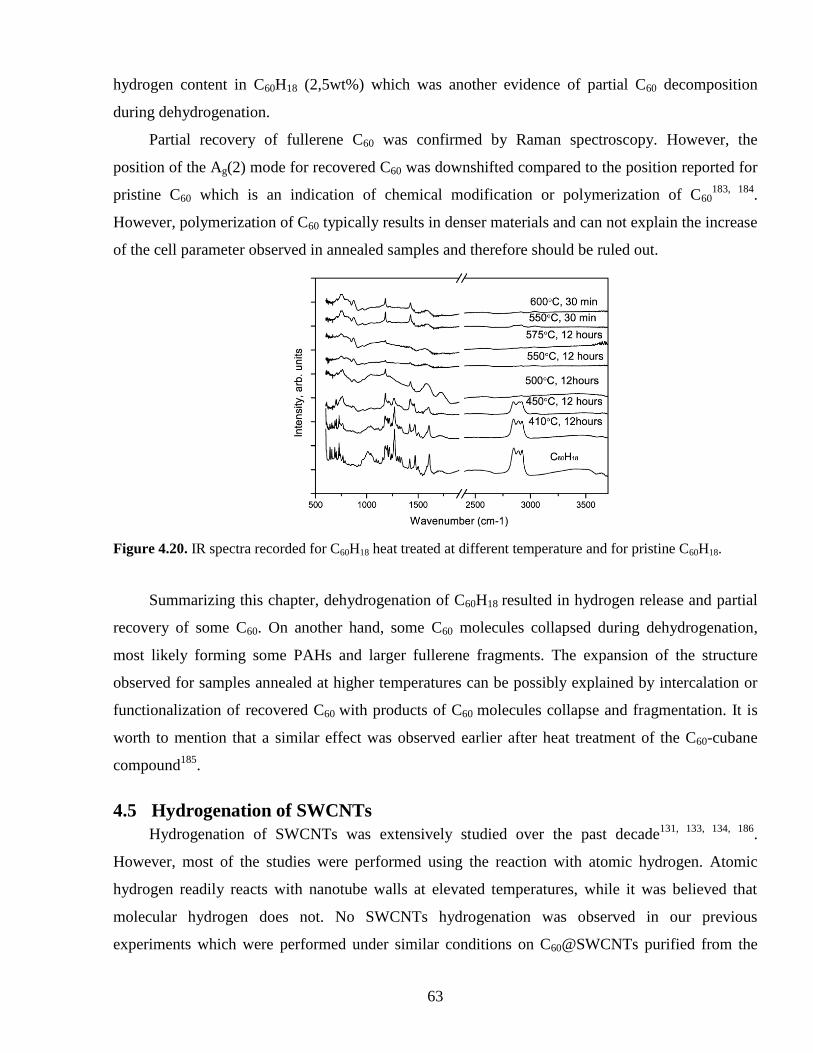
63
hydrogen content in C60H18 (2,5wt%) which was another evidence of partial C60 decomposition
during dehydrogenation.
Partial recovery of fullerene C60 was confirmed by Raman spectroscopy. However, the
position of the Ag(2) mode for recovered C60 was downshifted compared to the position reported for
pristine C60 which is an indication of chemical modification or polymerization of C60183, 184
.
However, polymerization of C60 typically results in denser materials and can not explain the increase
of the cell parameter observed in annealed samples and therefore should be ruled out.
Figure 4.20. IR spectra recorded for C60H18 heat treated at different temperature and for pristine C60H18.
Summarizing this chapter, dehydrogenation of C60H18 resulted in hydrogen release and partial
recovery of some C60. On another hand, some C60 molecules collapsed during dehydrogenation,
most likely forming some PAHs and larger fullerene fragments. The expansion of the structure
observed for samples annealed at higher temperatures can be possibly explained by intercalation or
functionalization of recovered C60 with products of C60 molecules collapse and fragmentation. It is
worth to mention that a similar effect was observed earlier after heat treatment of the C60-cubane
compound185
.
4.5 Hydrogenation of SWCNTs
Hydrogenation of SWCNTs was extensively studied over the past decade131, 133, 134, 186
.
However, most of the studies were performed using the reaction with atomic hydrogen. Atomic
hydrogen readily reacts with nanotube walls at elevated temperatures, while it was believed that
molecular hydrogen does not. No SWCNTs hydrogenation was observed in our previous
experiments which were performed under similar conditions on C60@SWCNTs purified from the

64
metal catalyst187
. Similarly, no hydrogenation was observed in this work for SWCNTs purified from
Fe-catalyst.
Experiments performed in this study demonstrated that SWNTs react with hydrogen gas if the
metallic catalysts which are typically used for synthesis of nanotubes (e.g. Fe) are not removed from
the samples. The catalytic effect of Fe particles is likely connected with dissociation of molecular
hydrogen into atomic species with subsequent migration of atomic hydrogen on SWNTs (spillover
effect). Thus, reaction of SWNTs with hydrogen gas becomes possible when atomic hydrogen is
produced on catalyst particles. The importance of metal catalysts for hydrogenation of CNTs was
also recently shown by Bhowmick et al who reported that SWCNTs doped with Pt-nanoparticles
can be hydrogenated with molecular hydrogen even at ambient tempeartures188
.
In this work we studied the reaction of hydrogen gas with SWCNTs in the temperature
interval of 400-550ºC and hydrogen pressure of 50bar. SWCNTs annealed in hydrogen at various
temperatures were analyzed ex situ by IR and Raman spectroscopy, scanning electron microscopy
(SEM) and transmission electron microscopy (TEM), and X-ray photoelectron spectroscopy (XPS)
analysis.
SWCNTs hydrogenation. SWCNTs did react with molecular hydrogen at 400-550ºC as was
confirmed by Raman spectroscopy, IR spectroscopy, and XPS analysis. The process of
hydrogenation depended on hydrogenation temperature. At T=400-450ºC hydrogenation proceeded
by side wall functionalization and formation of C-H covalent bonds which are stable at those
temperatures and resulted in a relatively high degree of SWCNTs hydrogenation. At T=550ºC,
which exceeds the stability limit of C-H bonds in hydrogenated SWCNTs, hydrogenation of
SWCNTs proceeded as etching. Etching of SWCNTs at 550ºC resulted in a relatively low degree of
hydrogenation and a large number of defects induced on nanotube walls.
Hydrogen annealing at 400-450ºC: side wall hydrogenation. After hydrogenation at 400-
450ºC Raman spectra of SWCNTs were substantially modified: some new peaks appeared in the
1100-1400cm-1
interval (not observed in the pristine material), the RBM mode was up-shifted, and
the G/D ratio decreased (see Figure 4.21). The shape of the G-band changed due to conversion of
some metallic SWCNTs into semiconducting SWCNTs. The metallic-semiconducting conversion of
hydrogenated SWCNTs was observed earlier as a result of hydrogenation by atomic hydrogen 189
.
Hydrogenation of SWCNTs was also confirmed by IR spectroscopy. After hydrogenation of
SWCNTs a set of strong peaks in the region of C-H vibrations appeared in IR spectra, i.e. peaks at
2851, 2920, and 2955cm-1
. XPS spectra were used to estimate the degree of SWCNT hydrogenation

65
(see Figure 4.22). According to XPS measurements ca. 36 9% of carbon atoms were hydrogenated
at 450ºC.
Figure 4.21. Raman spectra (514nm) recorded from SWCNTs hydrogenated at different temperatures. The
inset shows a zoomed-in region where new peaks appeared as the result of hydrogenation.
Hydrogen annealing at 550ºC: etching. After hydrogenation at 550ºC Raman spectra of
SWCNTs were different from both Raman spectra of pristine SWCNTs and Raman spectra of
SWCNTs after hydrogenation at 400-450ºC. Hydrogenation of SWCNTs at 550ºC resulted in an up-
shift of the RBM mode, in a modification of the G-band shape, and in a significant change of the
G/D ratio (by ~20 times) which was much stronger than after hydrogenation at 400-450ºC, see
Figure 4.21. According to XPS measurements the fraction of hydrogenated carbon atoms at 550ºC
did not exceed 6 3%, see Figure 4.22.
SWCNTs purification from the Fe catalyst SWCNTs samples are synthesized using a
reaction which includes a Fe catalyst and as a result, SWCNTs are contaminated by Fe
nanoparticles. These particles can not be removed by direct acid treatment of samples since they are
encapsulated into graphitic carbon shells. These shells also protect Fe nanoparticles against
oxidation. Fe nanoparticles remain unoxidized (as can be revealed e.g. by XPS) even after prolonged
exposure of samples to air. The standard procedure of Fe removal from SWCNT samples includes
an oxidation treatment at elevated temperatures to remove more reactive carbon shells and leaving
nanotubes intact. When protective carbon shells are removed the Fe particles can easily be removed
by acid treatment. Removal of carbon shells can also be easily verified by XPS since the catalyst
particles get oxidized after exposure to air.
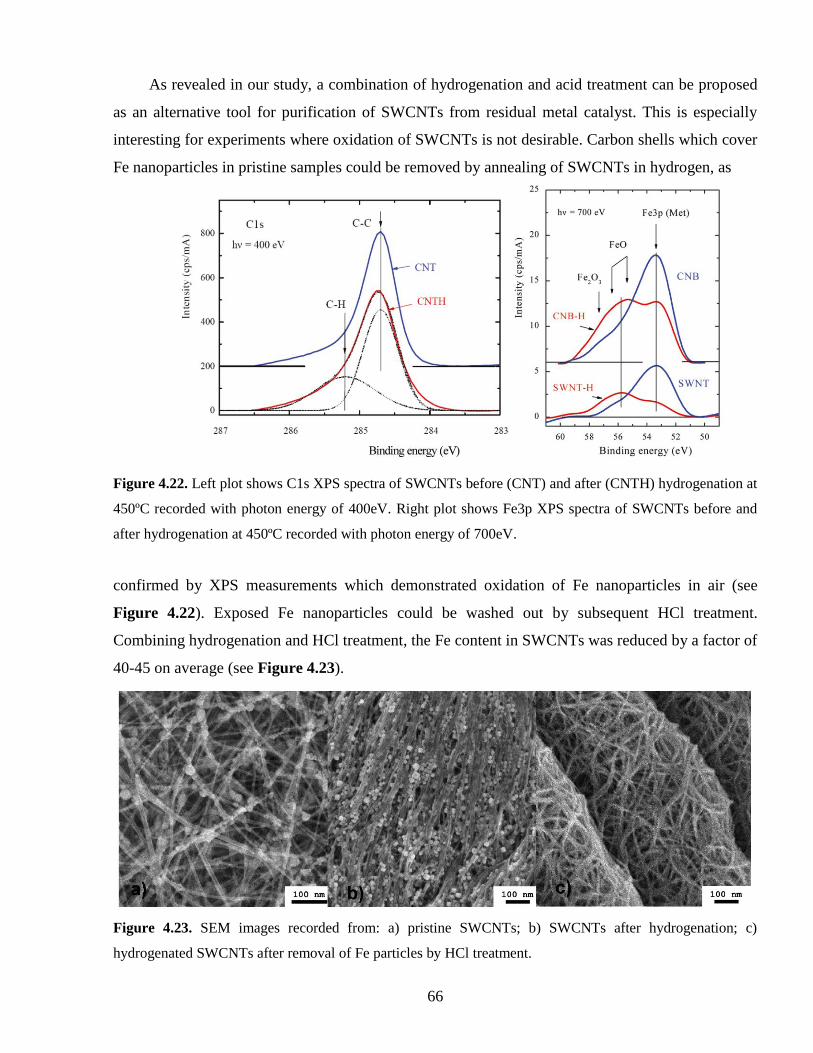
66
As revealed in our study, a combination of hydrogenation and acid treatment can be proposed
as an alternative tool for purification of SWCNTs from residual metal catalyst. This is especially
interesting for experiments where oxidation of SWCNTs is not desirable. Carbon shells which cover
Fe nanoparticles in pristine samples could be removed by annealing of SWCNTs in hydrogen, as
Figure 4.22. Left plot shows C1s XPS spectra of SWCNTs before (CNT) and after (CNTH) hydrogenation at
450ºC recorded with photon energy of 400eV. Right plot shows Fe3p XPS spectra of SWCNTs before and
after hydrogenation at 450ºC recorded with photon energy of 700eV.
confirmed by XPS measurements which demonstrated oxidation of Fe nanoparticles in air (see
Figure 4.22). Exposed Fe nanoparticles could be washed out by subsequent HCl treatment.
Combining hydrogenation and HCl treatment, the Fe content in SWCNTs was reduced by a factor of
40-45 on average (see Figure 4.23).
Figure 4.23. SEM images recorded from: a) pristine SWCNTs; b) SWCNTs after hydrogenation; c)
hydrogenated SWCNTs after removal of Fe particles by HCl treatment.

67
Opening and unzipping of SWCNTs by hydrogenation. Hydrogen annealing of SWCNTs
results in removal of fullerene-like cups from nanotube tips (nanotube opening) and partial
unzipping of nanotube walls along the tube axis. Fullerene-like cups were expected to react with
hydrogen to the point of complete removal at the conditions of our experiments, similar to reactions
of fullerene C60 described in Chapter 4.4 of this thesis. This effect was seen especially clearly for
hydrogenation experiments on carbon nanobuds, i.e. SWCNTs which have different fullerene-like
forms of carbon attached to the nanotube walls190
. Hydrogen annealing of carbon nanobuds resulted
in separation of some fullerenes from SWCNTs walls and their encapsulation into the inner space of
nanotubes which could be possible only if nanotubes become open as a result of hydrogenation.
Hydrogenation also resulted in unzipping of some SWCNTs. Cone- and balloon-like features
could be seen at the tips of SWCNTs after hydrogenation at 400-550ºC and are attributed to
unzipped parts of SWCNTs (see Figure 4.24). Some nanoribbons showed a very specific wave-like
shape of edges which are expected if nanoribbons are formed by SWCNTs rippling (see Figure
4.24). It is not clear at the moment why some SWCNTs were unzipped while other SWCNTs
remained intact at certain experimental conditions. Possibly, unzipping of SWCNTs somehow
depends on the properties of SWCNTs themselves (e.g. SWCNTs chirality) or on the position of Fe
particles. Fe particles are normally attached at SWCNTs end parts where unzipping was observed.
We believe that Fe particles serve as starting points for the unzipping of SWCNTs (see Figure
4.24).
Figure 4.24. TEM images recorded from SWCNTs after hydrogenation: a)SWCNTs and attached to them
graphene nanoribbons; b) another graphene nanoribbons; c) the same graphene nanoribbons as in (b) but
tilted by 20º.

68
4.6 Hydrogenation of fullerene C60 inside SWCNTs
As was discovered in earlier studies from our group, fullerene C60 reacts with molecular
hydrogen in the temperature interval of 350-450ºC and hydrogenation results in formation of
fulleranes C60Hx (with x up to 52)113
, see also Chapter 4.4 of this thesis. It is interesting to check
whether the same hydrogenation reaction of C60 will occur in peapods (i.e. C60@SWCNTs) where
C60 is confined within the internal 1D-space of SWCNTs. In this thesis we studied the reaction of
hydrogen with C60@SWCNTs in two temperature intervals. Temperature intervals were chosen
according to our knowledge about hydrogenation of bulk C60: 1) T=450ºC where C60 hydrogenates;
2) T=500-550ºC where C60 is expected to collapse and to form some large hydrocarbon molecules.
We compared hydrogenation of C60 confined within SWCNTs with hydrogenation of bulk C60. The
products of hydrogenation were studied with Raman spectroscopy and TEM microscopy.
C60@SWCNTs hydrogenation at 450ºC. Our experiments revealed that hydrogen is able to
penetrate into the inner space of SWCNTs even when SWCNTs are filled with C60. Hydrogenation
of C60@SWCNTs at 450ºC resulted in synthesis of hydrogenated C60Hx inside SWCNTs similarly to
hydrogenation of bulk C60.
After hydrogenation of C60@SWCNTs the Ag(2) mode of C60 disappeared from Raman
spectra (see Figure 4.25). The same result was earlier observed for hydrogenation of C60@SWCNTs
at 400ºC187
and was a sign of C60 hydrogenation. Similarly to bulk material, the C60 inside SWCNTs
was partially recovered during annealing of hydrogenated C60@SWCNTs at 950ºC in argon. The
fact of C60 hydrogenation was also explicitly proven by TEM analysis. Hydrogenated C60 molecules
with an increased diameter were observed inside of SWCNTs.
C60@SWCNTs hydrogenation at 500-550ºC. Reaction of hydrogen with C60@SWCNTs at
500-550ºC resulted in massive collapse of C60 inside SWCNTs and formation of a large variety of
unidentified hydrocarbon products (see Figure 4.26). While the major part of fullerene molecules
was transformed into carbon “debris”, a rather minor fraction of nanotubes appeared to be less
accessible to hydrogen and some intermediate reaction steps could also be studied. For example, a
TEM study revealed some C60 in the dimerized and polymerized states while some other images
revealed C60 fused into short nanotubes of irregular shapes. Formation of some helical objects which
visually resembled GNRs was also observed inside SWCNTs even though fusion of C60 fragments
into GNRs was not expected at the reaction conditions.
Collapse of C60 inside SWCNTs during hydrogenation at 500-550ºC was also confirmed by
Raman spectroscopy. Raman spectra of C60@SWCNTs hydrogenated at 500-550ºC showed a
number of new peaks with the most prominent peaks found at 1239 and 1272cm-1
(see Figure 4.25).

69
No fullerene C60 was recovered during annealing of hydrogenated C60@SWCNTs at 950ºC in argon.
New peaks in the Raman spectra of C60@SWCNTs after hydrogenation were similar to new peaks
observed in the products from hydrogenation of bulk C60. It is worth mentioning that products of
Figure 4.25. Raman spectra recorded from a) pristine C60@SWCNTs and C60@SWCNTs hydrogenated at
different temperatures. New peaks at 1239 and 1272cm-1
are marked with asterisks. b) Pristine
C60@SWCNTs and C60@SWCNTs hydrogenated at different temperatures after annealing in argon at 950ºC.
bulk C60 hydrogenation performed at the same temperature showed no hydrogenated fullerenes. C60
molecules completely collapsed in this control sample and only a broad range of hydrocarbons
(molecular weight of 250-400amu) was found in MALDI-TOF MS spectra recorded from the
toluene extract.
Figure 4.26. TEM images recorded from pristine peapods (left image) and peapods after hydrogenation at
550ºC (right image).
a) b)

70
To summarize this section, we found the first direct evidence of a surprising ability of
hydrogen to react with C60 molecules encapsulated inside SWCNTs. Hydrogen is likely to penetrate
into SWCNTs through the nanotube openings on the tips and through defects in nanotube walls.
Therefore, our study provides the first example of gas-molecule chemistry inside the 1D-space of
nanotubes. It opens a road for exploration of many other possible kinds of gas-molecule reactions in
the confined space of SWCNTs.
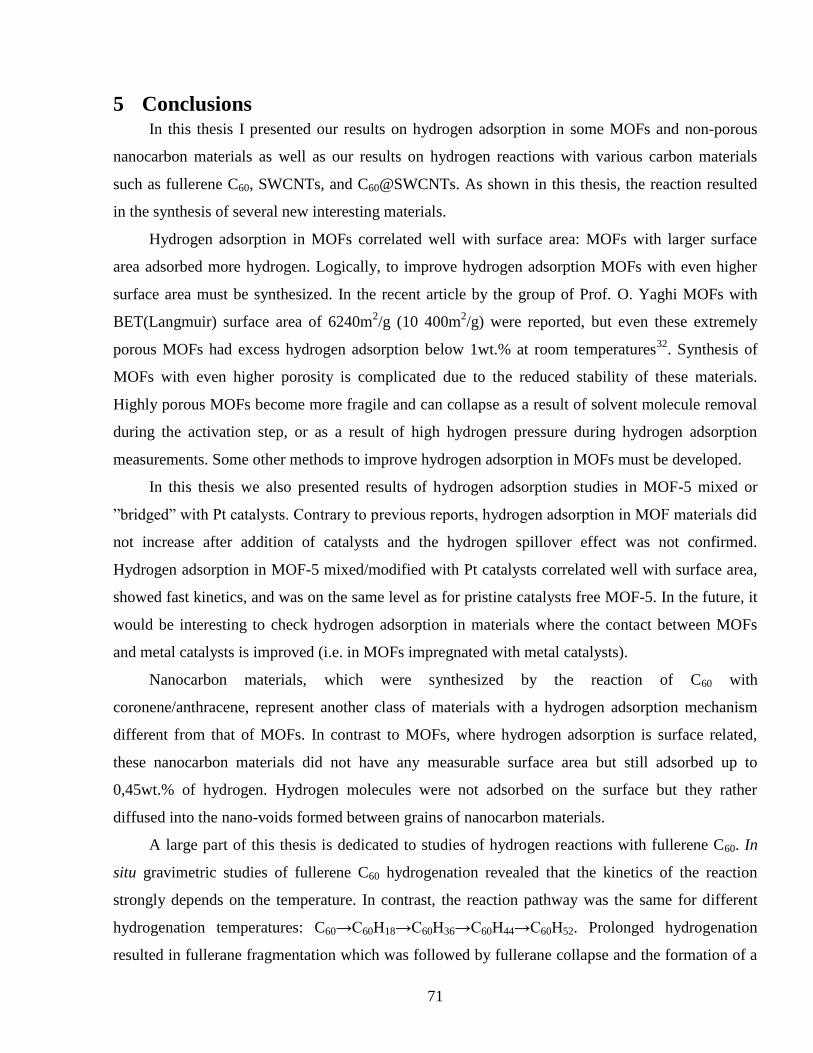
71
5 Conclusions In this thesis I presented our results on hydrogen adsorption in some MOFs and non-porous
nanocarbon materials as well as our results on hydrogen reactions with various carbon materials
such as fullerene C60, SWCNTs, and C60@SWCNTs. As shown in this thesis, the reaction resulted
in the synthesis of several new interesting materials.
Hydrogen adsorption in MOFs correlated well with surface area: MOFs with larger surface
area adsorbed more hydrogen. Logically, to improve hydrogen adsorption MOFs with even higher
surface area must be synthesized. In the recent article by the group of Prof. O. Yaghi MOFs with
BET(Langmuir) surface area of 6240m2/g (10 400m
2/g) were reported, but even these extremely
porous MOFs had excess hydrogen adsorption below 1wt.% at room temperatures32
. Synthesis of
MOFs with even higher porosity is complicated due to the reduced stability of these materials.
Highly porous MOFs become more fragile and can collapse as a result of solvent molecule removal
during the activation step, or as a result of high hydrogen pressure during hydrogen adsorption
measurements. Some other methods to improve hydrogen adsorption in MOFs must be developed.
In this thesis we also presented results of hydrogen adsorption studies in MOF-5 mixed or
”bridged” with Pt catalysts. Contrary to previous reports, hydrogen adsorption in MOF materials did
not increase after addition of catalysts and the hydrogen spillover effect was not confirmed.
Hydrogen adsorption in MOF-5 mixed/modified with Pt catalysts correlated well with surface area,
showed fast kinetics, and was on the same level as for pristine catalysts free MOF-5. In the future, it
would be interesting to check hydrogen adsorption in materials where the contact between MOFs
and metal catalysts is improved (i.e. in MOFs impregnated with metal catalysts).
Nanocarbon materials, which were synthesized by the reaction of C60 with
coronene/anthracene, represent another class of materials with a hydrogen adsorption mechanism
different from that of MOFs. In contrast to MOFs, where hydrogen adsorption is surface related,
these nanocarbon materials did not have any measurable surface area but still adsorbed up to
0,45wt.% of hydrogen. Hydrogen molecules were not adsorbed on the surface but they rather
diffused into the nano-voids formed between grains of nanocarbon materials.
A large part of this thesis is dedicated to studies of hydrogen reactions with fullerene C60. In
situ gravimetric studies of fullerene C60 hydrogenation revealed that the kinetics of the reaction
strongly depends on the temperature. In contrast, the reaction pathway was the same for different
hydrogenation temperatures: C60→C60H18→C60H36→C60H44→C60H52. Prolonged hydrogenation
resulted in fullerane fragmentation which was followed by fullerane collapse and the formation of a

72
large variety of PAHs. It was found that fulleranes are separated in the HPLC column according to
the number of hydrogen atoms, but complete isolation of new fulleranes or fragmented fulleranes
using the HPLC column was not achieved. Dehydrogenation of fulleranes resulted in hydrogen
release and partial recovery of fullerene C60 which, however, had an increased FCC cell parameter.
The expansion of the FCC fullerene structure upon dehydrogenation was explained by the “self-
doping” effect.
Addition of Pt or Ni metal catalysts significantly improved the kinetics of C60 hydrogenation.
Catalytic hydrogenation of C60 followed the same reaction pathway as for non-catalytic
hydrogenation, but resulted in synthesis of a mixture of fulleranes with FCC and BCC lattices. After
dehydrogenation fulleranes with the BCC lattice were not observed, and the only dehydrogenation
products were fullerene C60 with an expanded FCC lattice. In the future, it would be interesting to
check dehydrogenation of fulleranes with a pure BCC lattice. Such fulleranes can possibly be
synthesized choosing other catalysts, improving the dispersion of catalysts within fullerene C60, and
improving the contact between catalyst particles and fullerene C60.
The reaction of SWCNTs with hydrogen gas at elevated temperatures was strongly affected by
Fe catalyst nanoparticles. The reaction resulted in opening, purification, side-wall hydrogenation,
and partial unzipping of SWCNTs. Some GNRs were formed as the results of SWCNTs unzipping.
The reason for the selective unzipping of SWCNTs as well as the effect of various metal catalysts
and SWCNTs diameters/chiralities on the reaction process remain unclear. It would be interesting to
repeat these hydrogenation experiments for freestanding SWCNTs of different diameters/chiralities
and for SWCNTs synthesized or impregnated with different catalysts.
Studying the reaction of hydrogen with C60@SWCNTs we showed that hydrogen can
penetrate inside SWCNTs and react with encapsulated fullerene C60 at 450-550ºC. At 450ºC the
reaction resulted in the synthesis of hydrogenated fullerenes, similarly to the hydrogenation of bulk
C60, while at 500-550ºC the reaction resulted in massive collapse of C60 inside SWCNTs and
formation of large variety of products (i.e. dimerized and polymerized fullerenes, short nanotubes of
irregular shapes, and some helical objects visually resembling GNRs).

73
6 Summary of the included papers and my contribution to these
papers
6.1 Paper 1
In paper 1, “Thermal decomposition of C60H18”, we studied thermal decomposition of the pure
C3v isomer of C60H18 in the temperature interval of 410-600ºC. We found that fullerene C60 was
partially recovered upon heat treatment at 410-500ºC as evidenced by IR spectroscopy, Raman
spectroscopy, and X-ray diffraction measurements. Partial collapse of the fullerene C60 structure was
observed during the heat treatment at temperatures above 500ºC which correlated with a slight
structure expansion. Partial collapse of the fullerene structure was confirmed by TGA analysis, by
XRD measurements, and by Raman spectroscopy. The expansion of the FCC fullerene structure
upon dehydrogenation was explained by the “self-doping” effect.
My contribution: heat treatment of C60H18 at different temperatures; XRD measurements, IR
and Raman measurements; analysis of the data; writing the manuscript.
6.2 Paper 2
In paper 2, “Hydrogen storage in Co- and Zn-based metal-organic frameworks at ambient
temperature”, we studied hydrogen adsorption in some Co- and Zn-based MOFs. These MOFs have
different pore structures and surface areas and as a results have different hydrogen adsorption
properties. Hydrogen adsorption correlated almost linearly with BET surface area. The maximum
uptake of 0,75wt.% of hydrogen was measured for the ZBDh material (a Zn-based MOF which
consist of triangular and hexagonal channels). Structural stability of the materials upon activation
and hydrogen adsorption measurements was pointed out as an important factor which could limit the
application of certain MOFs as materials for hydrogen storage.
My contribution: hydrogen adsorption measurements; nitrogen adsorption measurements;
recording X-ray diffraction patterns; analysis of the data; writing the manuscript.
6.3 Paper 3
In paper 3, “High-temperature reactions of C60 with polycyclic aromatic hydrocarbons”, we
studied the reaction of C60 with polycyclic aromatic hydrocarbons (i.e. anthracene and coronene)
and measured hydrogen adsorption in nanocarbons synthesized by this reaction. The reaction
between C60 and anthracene at temperatures above 650ºC resulted in C60 collapse and formation of
some nanocarbons. Hydrogen adsorption in these nanocarbons did not exceed 0,1wt.% and was on
the same level as for pristine C60.

74
The reaction between C60 and coronene resulted in C60 structural expansion with the FCC cell
parameter increasing from a=14.17Å (for the reaction temperature of 500ºC) to a=14.50Å
(T=650ºC). The structural expansion correlates with collapse of some fraction of C60 molecules
induced by fusion and with carbonization of coronene molecules. Heat treatment of the
C60/coronene mixture above 6500C results in complete fullerene collapse and the formation of
nanocarbons. Hydrogen adsorption in these nanocarbons did not correlate with BET surface area
and a maximum hydrogen adsorption of 0,45wt% was measured for nanocarbons synthesized at
800ºC.
My contribution: hydrogen adsorption measurements; nitrogen adsorption measurements;
analysis of the data; discussion of the manuscript.
6.4 Paper 4
In paper 4, “Hydrogen adsorption in Pt-catalyst/MOF-5” materials”, we studied hydrogen
adsorption in MOFs doped/modified with Pt catalysts. We did not observe any features of hydrogen
“spillover” effect, the effect which according to some previous publications led to a tremendous
increase of hydrogen adsorption in MOF-5 doped/modified with Pt-catalysts59, 66
. On the contrary,
we showed that hydrogen adsorption in MOF-5 mixed/modified with Pt catalysts correlated well
with BET surface area of those materials and had very fast kinetics. The highest hydrogen
adsorption was measured for the Pt catalyst itself. None of the features attributed to the hydrogen
“spillover” effect were observed in this study (e.g. slow kinetics, absence of correlation with BET
surface area, linear pressure dependence of adsorption). This article initiated a discussion in the
literature regarding reasons behind the absence of “spillover”22, 172, 173
.
My contribution: synthesis of samples; hydrogen adsorption measurements; nitrogen
adsorption measurements; recording X-ray diffraction patterns; recording IR spectra; analysis of the
data; writing the manuscript.
6.5 Paper 5
In paper 5, “Reaction of C60 with Hydrogen Gas: In Situ Monitoring and Pathways”, we
studied hydrogenation of C60 at T=350-440ºC and a hydrogen pressure of 50bar. The weight change
of the sample during hydrogenation was monitored in situ using a gravimetric method and the
products of hydrogenation were studied by MS spectrometry and XRD analysis. Hydrogenation
kinetics depended strongly on the reaction temperature. At 350-400ºC hydrogenation proceeded
slowly and the sample weight saturated after days of hydrogenation. At 420-440ºC hydrogenation
proceeded with improved kinetics and after the initial increase the sample weight started to decrease

75
indicating C60 fragmentation and collapse. Independently of the reaction temperature hydrogenation
of C60 followed the same hydrogenation pathway: C60→C60H18→C60H36→C60H44→C60H52. Higher
reaction temperature resulted in a faster conversion rate of fulleranes with low hydrogen content
(e.g. C60H18) into fulleranes with a high hydrogen content (e.g. C60H44, C60H52). Prolonged
hydrogenation at 400-440ºC resulted in C60 fragmentation and synthesis of fragmented fullerenes
with loss of up to seven carbon atoms. Analyzing the products of C60 fragmentation we proposed
two possible fragmentation models. We performed HPLC experiments aiming at separation and
isolation of fulleranes with high hydrogen contents and fragmented fullerenes. Fulleranes were
eluted according to the number of hydrogen atoms attached to the C60 cage but the complete
isolation was not achieved due to the high complexity of the hydrogenation products. The only
isolated fullerane was C60H18.
My contribution: synthesis of hydrogenated and fragmented C60, participated in high resolution
MS measurements; XRD measurements; HPLC separation; analysis of the data; discussion of the
data; writing the manuscript.
6.6 Paper 6
In paper 7, “Hydrogenation, Purification, and Unzipping of Carbon Nanotubes by Reaction
with Molecular Hydrogen: Road to Graphane Nanoribbons”, we studied hydrogenation of
SWCNTs by the direct reaction with molecular hydrogen at 400-550ºC and 50bar of hydrogen
pressure. We found that SWCNTs hydrogenated at the conditions of the experiment and that the
mechanism of hydrogenation depended on the hydrogenation temperature. At 400-450ºC
hydrogenation occurred by formation of C-H covalent bonds and resulted in hydrogenation of ca.
36 9% of carbon atoms. At 550ºC hydrogenation occurred as etching and resulted in
hydrogenation of only ca. 6 3% of carbon atoms.
As a result of hydrogenation SWCNTs were opened and purified from other forms of carbon.
Hydrogenation also removed fullerene-like shells covering Fe catalyst particles. Exposed Fe catalyst
particles could be removed by the acid treatment, significantly reducing Fe content in SWCNTs.
Fe catalyst particles were very important for SWCNTs hydrogenation and no hydrogenation
was observed for catalyst-free SWCNTs. Hydrogenation also resulted in unzipping of SWCNTs
which supposedly started on Fe catalyst particles and progressed further along the tube axis.
My contribution: synthesis of hydrogenated SWCNTs; participating in discussion of the data.
76
6.7 Paper 7
In paper 7, “Effect of Catalysts on the Reaction of C60 with Hydrogen”, we studied
hydrogenation of C60 at T=400ºC and hydrogen pressure of 50bar with addition of metal catalysts
(e.g. Ni, Pt) and compared it with non-catalytic C60 hydrogenation. Addition of metal catalysts
significantly accelerated hydrogenation kinetics and resulted in synthesis of fulleranes with a
different crystal structure. Non-catalytic hydrogenation of C60 resulted in synthesis of fulleranes
with the FCC crystal structure while addition of metal catalysts resulted in synthesis of fullerane
mixtures consisting of FCC and BCC phases. Catalytic hydrogenation started with synthesis of C3v
isomer of C60H18, the same isomer as synthesized by non-catalytic hydrogenation, and proceeded by
formation of fulleranes with higher hydrogen content which had the BCC structure.
My contribution: synthesis of hydrogenated C60, MS measurements; XRD measurements;
analysis of the data; discussion of the data; writing the manuscript.
6.8 Paper 8
In paper 8, “Hydrogen-Driven Collapse of C60 Inside Single-Walled Carbon Nanotubes”, we
studied hydrogenation of C60 inserted inside SWCNTs (C60@SWCNTs) at 450-550ºC and 50bar of
hydrogen pressure. At 450ºC encapsulated C60 reacted with hydrogen forming fulleranes similarly to
bulk C60. Pristine C60 were partially recovered by annealing of C60@SWCNTs in argon at 950ºC. At
500-550ºC hydrogenation resulted in dimerization and polymerization of C60 molecules which was
followed by their collapse into some smaller molecules. Formation of only a few inner nanotubes
and graphene nanoribbons was observed in our experiments. We assume that after fragmentation,
C60 fragments were immediately terminated by hydrogen which prohibited their fusion into larger
structures.
My contribution: synthesis of hydrogenated C60@SWCNTs; participating in discussion of the
data.

77
7 Acknowledgements At the end of this thesis I would like to thank all people without whom this work would not be
done. First of all, I would like to thank my supervisors Alexandr Talyzin and Bertil Sundqvist for
their help during the PhD studies. Many hours of scientific discussions that I had with you are
priceless, and they made a huge impact on this Thesis.
During my PhD studies I was supervising lab courses for undergraduate students which was a
unique and unforgettable experience. I would like to thank Hans Forsman for giving me the
opportunity to teach and Leif Hassmyr for his help with all technical problems related to the lab
equipment. As the lab supervisor I had a pleasure to work with many interesting people who can not
be forgotten. I would like to thank to all my lab co-supervisors, namely to Mats Forsberg, Alberto
Cetoli, Junchun Yu, Mikhail Modestov, Dmitry Kobyakov, with whom I spent many hours in the lab
educating undergraduate students.
Of course, I would like to thank Katarina Hassler, Lena Burström, Jörgen Eriksson, and Ann-
Charlot Dalberg who solved all science not-related problems letting me concentrate on the research.
I would also like to thank Lena Åström and Thomas Gustafsson who were always ready to help if I
needed some help in the workshop. I would like to thank all employees at the department of physics
who created an inspiring and very positive working atmosphere. It was my pleasure to work with
you!
I would like to thank the J.C. Kempe Minnes foundation for providing the financial support.
I am very grateful to our collaborators: Prof. Y. Tsybin for his help with MS measurements,
Prof. H. Chun for providing us with MOFs, Prof. F. Cataldo for his help with TGA measurements,
Dr. A. Nasibulin and Dr. I. Anoshkin for providing us with SWCNTs and for their help with TEM
measurements. Special thank to Dr. T. Kieselbach for his very helpful introduction course into the
field of mass spectrometry and for letting me work with MALDI-TOF MS. I would like to thank Dr.
A. Gorzsas, who is a lab manager of the vibrational spectroscopy platform at KBC, for his help with
IR and Raman measurements.
I would like to thank all my friends and my girlfriend Elwira who were always supporting me
in a tough time and sharing my happiness in a good moment.
Finally, I would like to thank my parents, my grandparents, and my brother Andrey who are
the most important people in my life. Your love and your support mean a lot to me, and there are no
words which can help to express my deepest gratitude to you!
8 References 1. Schlapbach, L.; Zuttel, A., Hydrogen-storage materials for mobile applications. Nature 2001, 414, (6861), 353-358. 2. Schlapbach, L., Technology: Hydrogen-fuelled vehicles. Nature 2009, 460, (7257), 809-811. 3. http://www.mechanicalengineeringblog.com/wp-content/uploads/2011/03/01- fuelcell_vehicle-FCV-ultimate-Eco-car-Hybrid-technology.jpg. 4. http://green.autoblog.com/2007/04/11/first-fuel-cell-hybrid-bus-hits-the-road-in-connecticut/. 5. https://www1.eere.energy.gov/hydrogenandfuelcells/mypp/pdfs/storage.pdf. 6. Fierro, V.; Szczurek, A.; Zlotea, C.; Mareche, J. F.; Izquierdo, M. T.; Albiniak, A.; Latroche, M.; Furdin, G.; Celzard, A., Experimental evidence of an upper limit for hydrogen storage at 77 K on activated carbons. Carbon 2010, 48, (7), 1902-1911. 7. Jin, H.; Lee, Y. S.; Hong, I., Hydrogen adsorption characteristics of activated carbon. Catalysis Today 2007, 120, (3-4), 399-406. 8. Iijima, S., Helical Microtubules of Graphitic Carbon. Nature 1991, 354, (6348), 56-58. 9. Ye, Y.; Ahn, C. C.; Witham, C.; Fultz, B.; Liu, J.; Rinzler, A. G.; Colbert, D.; Smith, K. A.; Smalley, R. E., Hydrogen adsorption and cohesive energy of single-walled carbon nanotubes. Applied Physics Letters 1999, 74, (16), 2307-2309. 10. Xu, W. C.; Takahashi, K.; Matsuo, Y.; Hattori, Y.; Kumagai, M.; Ishiyama, S.; Kaneko, K.; Iijima, S., Investigation of hydrogen storage capacity of various carbon materials. International Journal of Hydrogen Energy 2007, 32, (13), 2504-2512. 11. Panella, B.; Hirscher, M.; Roth, S., Hydrogen adsorption in different carbon nanostructures. Carbon 2005, 43, (10), 2209-2214. 12. Zhang, X. R.; Cao, D. P.; Chen, J. F., Hydrogen adsorption storage on single-walled carbon nanotube arrays by a combination of classical potential and density functional theory. Journal of Physical Chemistry B 2003, 107, (21), 4942-4950. 13. Xia, Y. Y.; Zhu, J. Z. H.; Zhao, M. W.; Li, F.; Huang, B. D.; Ji, Y. J.; Liu, X. D.; Tan, Z. Y.; Song, C.; Yin, Y. Y., Enhancement of hydrogen physisorption on single-walled carbon nanotubes resulting from defects created by carbon bombardment. Physical Review B 2005, 71, (7), 075412 - 075412-8. 14. Chen, C. H.; Huang, C. C., Hydrogen adsorption in defective carbon nanotubes. Separation and Purification Technology 2009, 65, (3), 305-310. 15. Zhu, H. W.; Chen, A.; Mao, Z. Q.; Xu, C. L.; Xiao, X.; Wei, B. Q.; Liang, J.; Wu, D. H., The effect of surface treatments on hydrogen storage of carbon nanotubes. Journal of Materials Science Letters 2000, 19, (14), 1237-1239. 16. Liu, F.; Zhang, X. B.; Cheng, J. P.; Tu, J. P.; Kong, F. Z.; Huang, W. Z.; Chen, C. P., Preparation of short carbon nanotubes by mechanical ball milling and their hydrogen adsorption behavior. Carbon 2003, 41, (13), 2527-2532. 17. Mu, S. C.; Tang, H. L.; Qian, S. H.; Pan, M.; Yuan, R. Z., Hydrogen storage in carbon nanotubes modified by microwave plasma etching and Pd decoration. Carbon 2006, 44, (4), 762-767. 18. Lin, K. Y.; Chang, J. K.; Chen, C. Y.; Tsai, W. T., Effects of heat treatment on materials characteristics and hydrogen storage capability of multi-wall carbon nanotubes. Diamond and Related Materials 2009, 18, (2-3), 553-556. 19. Takagi, H.; Soneda, Y.; Hatori, H.; Zhu, Z. H.; Lu, G. Q., Effects of nitric acid and heat treatment on hydrogen adsorption of single-walled carbon nanotubes. Australian Journal of Chemistry 2007, 60, (7), 519-523. 20. Dillon, A. C.; Jones, K. M.; Bekkedahl, T. A.; Kiang, C. H.; Bethune, D. S.; Heben, M. J., Storage of hydrogen in single-walled carbon nanotubes. Nature 1997, 386, (6623), 377-379. 21. Chambers, A.; Park, C.; Baker, R. T. K.; Rodriguez, N. M., Hydrogen storage in graphite nanofibers. Journal of Physical Chemistry B 1998, 102, (22), 4253-4256. 22. Hirscher, M., Remarks about spillover and hydrogen adsorption - Comments on the contributions of AV Talyzin and RT Yang. Microporous and Mesoporous Materials 2010, 135, (1-3), 209-210. 23. Martin, N. M.; Luzan, S. M.; Talyzin, A. V., High-temperature reactions of C-60 with polycyclic aromatic hydrocarbons. Chemical Physics 2010, 368, (1-2), 49-57. 24. Zhao, D.; Yuan, D. Q.; Zhou, H. C., The current status of hydrogen storage in metal-organic frameworks. Energy & Environmental Science 2008, 1, (2), 222-235. 25. FitzGerald, S. A.; Yildirim, T.; Santodonato, L. J.; Neumann, D. A.; Copley, J. R. D.; Rush, J. J.; Trouw, F., Quantum dynamics of interstitial H-2 in solid C-60. Physical Review B 1999, 60, (9), 6439-6451. 26. FitzGerald, S. A.; Forth, S.; Rinkoski, M., Induced infrared absorption of molecular hydrogen in solid C-60. Physical Review B 2002, 65, (14), 140302 – 140302-4. 27. Talyzin, A. V.; Klyamkin, S., Hydrogen adsorption in C60 at pressures up to 2000 atm. Chemical Physics Letters 2004, 397, (1–3), 77-81.
78
28. Talyzin, A. V.; Jacob, A., Hydrogen adsorption by ball milled C-60. Journal of Alloys and Compounds 2005, 395, (1-2), 154-158. 29. Talyzin, A. V.; Szabo, T.; Dekany, I.; Langenhorst, F.; Sokolov, P. S.; Solozhenko, V. L., Nanocarbons by High-Temperature Decomposition of Graphite Oxide at Various Pressures. Journal of Physical Chemistry C 2009, 113, (26), 11279-11284. 30. Srinivas, G.; Zhu, Y. W.; Piner, R.; Skipper, N.; Ellerby, M.; Ruoff, R., Synthesis of graphene-like nanosheets and their hydrogen adsorption capacity. Carbon 2010, 48, (3), 630-635. 31. Murray, L. J.; Dinca, M.; Long, J. R., Hydrogen storage in metal-organic frameworks. Chemical Society Reviews 2009, 38, (5), 1294-1314. 32. Furukawa, H.; Ko, N.; Go, Y. B.; Aratani, N.; Choi, S. B.; Choi, E.; Yazaydin, A. O.; Snurr, R. Q.; O'Keeffe, M.; Kim, J.; Yaghi, O. M., Ultrahigh Porosity in Metal-Organic Frameworks. Science 2010, 329, (5990), 424-428. 33. Wang, Z. Q.; Cohen, S. M., Postsynthetic covalent modification of a neutral metal-organic framework. Journal of the American Chemical Society 2007, 129, (41), 12368-12369. 34. Song, Y. F.; Cronin, L., Postsynthetic covalent modification of metal-organic framework (MOF) materials. Angewandte Chemie-International Edition 2008, 47, (25), 4635-4637. 35. Hirscher, M., Hydrogen Storage by Cryoadsorption in Ultrahigh-Porosity Metal-Organic Frameworks. Angewandte Chemie-International Edition 2011, 50, (3), 581-582. 36. Perez, E. V.; Balkus, K. J.; Ferraris, J. P.; Musselman, I. H., Mixed-matrix membranes containing MOF-5 for gas separations. Journal of Membrane Science 2009, 328, (1-2), 165-173. 37. Saha, D.; Wei, Z. J.; Deng, S. G., Equilibrium, kinetics and enthalpy of hydrogen adsorption in MOF-177. International Journal of Hydrogen Energy 2008, 33, (24), 7479-7488. 38. Garrone, E.; Bonelli, B.; Arean, C. O., Enthalpy-entropy correlation for hydrogen adsorption on zeolites. Chemical Physics Letters 2008, 456, (1-3), 68-70. 39. Suh, M. P.; Park, H. J.; Prasad, T. K.; Lim, D. W., Hydrogen Storage in Metal-Organic Frameworks. Chemical Reviews 2012, 112, (2), 782-835. 40. Luzan, S. M.; Jung, H.; Chun, H.; Talyzin, A. V., Hydrogen storage in Co-and Zn-based metal-organic frameworks at ambient temperature. International Journal of Hydrogen Energy 2009, 34, (24), 9754-9759. 41. Frost, H.; Duren, T.; Snurr, R. Q., Effects of surface area, free volume, and heat of adsorption on hydrogen uptake in metal-organic frameworks. Journal of Physical Chemistry B 2006, 110, (19), 9565-9570. 42. Panella, B.; Hones, K.; Muller, U.; Trukhan, N.; Schubert, M.; Putter, H.; Hirscher, M., Desorption studies of hydrogen in metal-organic frameworks. Angewandte Chemie-International Edition 2008, 47, (11), 2138-2142. 43. Rowsell, J. L. C.; Yaghi, O. M., Effects of functionalization, catenation, and variation of the metal oxide and organic linking units on the low-pressure hydrogen adsorption properties of metal-organic frameworks. Journal of the American Chemical Society 2006, 128, (4), 1304-1315. 44. Rowsell, J. L. C.; Yaghi, O. M., Strategies for hydrogen storage in metal-organic frameworks. Angewandte Chemie-International Edition 2005, 44, (30), 4670-4679. 45. Frost, H.; Snurr, R. Q., Design requirements for metal-organic frameworks as hydrogen storage materials. Journal of Physical Chemistry C 2007, 111, (50), 18794-18803. 46. Thornton, A. W.; Nairn, K. M.; Hill, J. M.; Hill, A. J.; Hill, M. R., Metal-Organic Frameworks Impregnated with Magnesium-Decorated Fullerenes for Methane and Hydrogen Storage. Journal of the American Chemical Society 2009, 131, (30), 10662-10669. 47. Chae, H. K.; Siberio-Perez, D. Y.; Kim, J.; Go, Y.; Eddaoudi, M.; Matzger, A. J.; O'Keeffe, M.; Yaghi, O. M., A route to high surface area, porosity and inclusion of large molecules in crystals. Nature 2004, 427, (6974), 523-527. 48. Rowsell, J. L. C.; Eckert, J.; Yaghi, O. M., Characterization of H-2 binding sites in prototypical metal-organic frameworks by inelastic neutron scattering. Journal of the American Chemical Society 2005, 127, (42), 14904-14910. 49. Yildirim, T.; Hartman, M. R., Direct observation of hydrogen adsorption sites and nanocage formation in metal-organic frameworks. Physical Review Letters 2005, 95, (21), 215504 – 215504-4. 50. Hirscher, M.; Panella, B., Hydrogen storage in metal-organic frameworks. Scripta Materialia 2007, 56, (10), 809-812. 51. Botas, J. A.; Calleja, G.; Sanchez-Sanchez, M.; Orcajo, M. G., Cobalt Doping of the MOF-5 Framework and Its Effect on Gas-Adsorption Properties. Langmuir 2010, 26, (8), 5300-5303. 52. Dinca, M.; Han, W. S.; Liu, Y.; Dailly, A.; Brown, C. M.; Long, J. R., Observation of Cu2+-H-2 interactions in a fully desolvated sodalite-type metal-organic framework. Angewandte Chemie-International Edition 2007, 46, (9), 1419-1422. 53. Han, S. S.; Deng, W. Q.; Goddard, W. A., Improved designs of metal-organic frameworks for hydrogen storage. Angewandte Chemie-International Edition 2007, 46, (33), 6289-6292. 54. Mulder, F. M.; Dingemans, T. J.; Wagemaker, M.; Kearley, G. J., Modelling of hydrogen adsorption in the metal organic framework MOF5. Chemical Physics 2005, 317, (2-3), 113-118. 55. Conner, W. C.; Falconer, J. L., Spillover in Heterogeneous Catalysis. Chemical Reviews 1995, 95, (3), 759-788.
79

56. Contescu, C. I.; Brown, C. M.; Liu, Y.; Bhat, V. V.; Gallego, N. C., Detection of Hydrogen Spillover in Palladium-Modified Activated Carbon Fibers during Hydrogen Adsorption. Journal of Physical Chemistry C 2009, 113, (14), 5886-5890. 57. Sinfelt, J. H.; Lucchesi, P. J., Kinetic Evidence for Migration of Reactive Intermediates in Surface Catalysis. Journal of the American Chemical Society 1963, 85, (21), 3365-3367. 58. Robell, A. J.; Ballou, E. V.; Boudart, M., Surface Diffusion of Hydrogen on Carbon. Journal of Physical Chemistry 1964, 68, (10), 2748-2753. 59. Li, Y. W.; Yang, R. T., Hydrogen storage in metal-organic frameworks by bridged hydrogen spillover. Journal of the American Chemical Society 2006, 128, (25), 8136-8137. 60. Srinivas, S. T.; Rao, P. K., Direct Observation of Hydrogen Spillover on Carbon-Supported Platinum and Its Influence on the Hydrogenation of Benzene. Journal of Catalysis 1994, 148, (2), 470-477. 61. Braunschweig, T.; Roland, U.; Winkler, H., Electrical-Conductivity Study of Hydrogen Spillover on Tio2. Studies in Surface Science and Catalysis 1993, 77, 183-188. 62. Wang, L. F.; Yang, R. T., Hydrogen storage properties of carbons doped with ruthenium, platinum, and nickel nanoparticles. Journal of Physical Chemistry C 2008, 112, (32), 12486-12494. 63. Lachawiec, A. J.; Qi, G. S.; Yang, R. T., Hydrogen storage in nanostructured carbons by spillover: Bridge-building enhancement. Langmuir 2005, 21, (24), 11418-11424. 64. Li, Y. W.; Yang, R. T., Hydrogen storage in low silica type X zeolites. Journal of Physical Chemistry B 2006, 110, (34), 17175-17181. 65. Huang, C. C.; Pu, N. W.; Wang, C. A.; Huang, J. C.; Sung, Y.; Ger, M. D., Hydrogen storage in graphene decorated with Pd and Pt nano-particles using an electroless deposition technique. Separation and Purification Technology 2011, 82, 210-215. 66. Li, Y. W.; Yang, R. T., Significantly enhanced hydrogen storage in metal-organic frameworks via spillover. Journal of the American Chemical Society 2006, 128, (3), 726-727. 67. Stuckert, N. R.; Wang, L. F.; Yang, R. T., Characteristics of Hydrogen Storage by Spillover on Pt-Doped Carbon and Catalyst-Bridged Metal Organic Framework. Langmuir 2010, 26, (14), 11963-11971. 68. Tsao, C. S.; Yu, M. S.; Wang, C. Y.; Liao, P. Y.; Chen, H. L.; Jeng, U. S.; Tzeng, Y. R.; Chung, T. Y.; Wut, H. C., Nanostructure and Hydrogen Spillover of Bridged Metal-Organic Frameworks. Journal of the American Chemical Society 2009, 131, (4), 1404-1406. 69. Wang, L. F.; Stuckert, N. R.; Yang, R. T., Unique Hydrogen Adsorption Properties of Graphene. Aiche Journal 2011, 57, (10), 2902-2908. 70. Ma, L. P.; Wu, Z. S.; Li, J.; Wu, E. D.; Ren, W. C.; Cheng, H. M., Hydrogen adsorption behavior of graphene above critical temperature. International Journal of Hydrogen Energy 2009, 34, (5), 2329-2332. 71. Wang, C. Y.; Tsao, C. S.; Yu, M. S.; Liao, P. Y.; Chung, T. Y.; Wu, H. C.; Miller, M. A.; Tzeng, Y. R., Hydrogen storage measurement, synthesis and characterization of metal-organic frameworks via bridged spillover. Journal of Alloys and Compounds 2010, 492, (1-2), 88-94. 72. Lee, S. Y.; Park, S. J., Effect of platinum doping of activated carbon on hydrogen storage behaviors of metal-organic frameworks-5. International Journal of Hydrogen Energy 2011, 36, (14), 8381-8387. 73. Miller, M. A.; Wang, C. Y.; Merrill, G. N., Experimental and Theoretical Investigation Into Hydrogen Storage via Spillover in IRMOF-8. Journal of Physical Chemistry C 2009, 113, (8), 3222-3231. 74. Campesi, R.; Cuevas, F.; Latroche, M.; Hirscher, M., Hydrogen spillover measurements of unbridged and bridged metal-organic frameworks-revisited. Physical Chemistry Chemical Physics 2010, 12, (35), 10457-10459. 75. Ardelean, O.; Blanita, G.; Borodi, G.; Mihet, M.; Coros, M.; Lupu, D., On the enhancement of hydrogen uptake by IRMOF-8 composites with Pt/carbon catalyst. International Journal of Hydrogen Energy 2012, 37, (9), 7378-7384. 76. Li, Y. W.; Yang, F. H.; Yang, R. T., Kinetics and mechanistic model for hydrogen spillover on bridged metal-organic frameworks. Journal of Physical Chemistry C 2007, 111, (8), 3405-3411. 77. Campesi, R.; Cuevas, F.; Gadiou, R.; Leroy, E.; Hirscher, M.; Vix-Guterl, C.; Latroche, M., Hydrogen storage properties of Pd nanoparticle/carbon template composites. Carbon 2008, 46, (2), 206-214. 78. Li, Y. W.; Yang, F. H.; Yang, R. T., Reply to "Comment on 'Kinetics and Mechanistic Model for Hydrogen Spillover on Bridged Metal-Organic Frameworks"'. Journal of Physical Chemistry C 2008, 112, (8), 3155-3156. 79. Mavrandonakis, A.; Klopper, W., Comment on “Kinetics and Mechanistic Model for Hydrogen Spillover on Bridged Metal-Organic Frameworks”. The Journal of Physical Chemistry C 2008, 112, (8), 3152-3154. 80. Psofogiannakis, G. M.; Froudakis, G. E., DFT Study of the Hydrogen Spillover Mechanism on Pt-Doped Graphite. Journal of Physical Chemistry C 2009, 113, (33), 14908-14915. 81. Jain, P.; Fonseca, D. A.; Schaible, E.; Lueking, A. D., Hydrogen uptake of platinum-doped graphite nanoribers and stochastic analysis of hydrogen spillover. Journal of Physical Chemistry C 2007, 111, (4), 1788-1800. 82. Anson, A.; Lafuente, E.; Urriolabeitia, E.; Navarro, R.; Benito, A. M.; Maser, W. K.; Martinez, M. T., Hydrogen capacity of palladium-loaded carbon materials. Journal of Physical Chemistry B 2006, 110, (13), 6643-6648. 83. Prins, R., Hydrogen Spillover. Facts and Fiction. Chemical Reviews 2012, 112, (5), 2714-2738.
80

84. Zaluska, A.; Zaluski, L.; Strom-Olsen, J. O., Nanocrystalline magnesium for hydrogen storage. Journal of Alloys and Compounds 1999, 288, (1-2), 217-225. 85. Grochala, W.; Edwards, P. P., Thermal decomposition of the non-interstitial hydrides for the storage and production of hydrogen. Chemical Reviews 2004, 104, (3), 1283-1315. 86. Wagemans, R. W. P.; van Lenthe, J. H.; de Jongh, P. E.; van Dillen, A. J.; de Jong, K. P., Hydrogen storage in magnesium clusters: Quantum chemical study. Journal of the American Chemical Society 2005, 127, (47), 16675-16680. 87. Loutfy, R. O.; Wexler, E. M., Gas-phase hydrogenation of fullerenes. Perspectives of Fullerene Nanotechnology 2002, 281-287. 88. Loutfy, R. O.; Wexler, E. M., Hydrogenation of alkali metal-doped fullerenes. Perspectives of Fullerene Nanotechnology 2002, 289-292. 89. Kroto, H. W.; Heath, J. R.; Obrien, S. C.; Curl, R. F.; Smalley, R. E., C-60 - Buckminsterfullerene. Nature 1985, 318, (6042), 162-163. 90. Henderson, C. C.; Cahill, P. A., C60h2 - Synthesis of the Simplest C60 Hydrocarbon Derivative. Science 1993, 259, (5103), 1885-1887. 91. Ballenweg, S.; Gleiter, R.; Kratschmer, W., Hydrogenation of Buckminsterfullerene C-60 Via Hydrozirconation - a New Way to Organofullerenes. Tetrahedron Letters 1993, 34, (23), 3737-3740. 92. Ruchardt, C.; Gerst, M.; Ebenhoch, J.; Beckhaus, H. D.; Campbell, E. E. B.; Tellgmann, R.; Schwarz, H.; Weiske, T.; Pitter, S., Bimolecular Radical Formation through H-Transfer .3. Transfer Hydrogenation and Deuteration of Buckminsterfullerene C-60 by 9,10-Dihydroanthracene and 9,9',10,10'[D(4)]Dihydroanthracene. Angewandte Chemie-International Edition in English 1993, 32, (4), 584-586. 93. Cliffel, D. E.; Bard, A. J., Electrochemical Studies of the Protonation of C-60- and C-60(2-). Journal of Physical Chemistry 1994, 98, (33), 8140-8143. 94. Darwish, A. D.; Abdulsada, A. K.; Langley, G. J.; Kroto, H. W.; Taylor, R.; Walton, D. R. M., Polyhydrogenation of [60]-Fullerenes and [70]-Fullerenes. Journal of the Chemical Society-Perkin Transactions 2 1995, (12), 2359-2365. 95. Avent, A. G.; Darwish, A. D.; Heimbach, D. K.; Kroto, H. W.; Meidine, M. F.; Parsons, J. P.; Remars, C.; Roers, R.; Ohashi, O.; Taylor, R.; Walton, D. R. M., Formation of Hydrides of Fullerene-C-60 and Fullerene-C-70. Journal of the Chemical Society-Perkin Transactions 2 1994, (1), 15-22. 96. Attalla, M. I.; Vassallo, A. M.; Tattam, B. N.; Hanna, J. V., Preparation of Hydrofullerenes by Hydrogen Radical-Induced Hydrogenation. Journal of Physical Chemistry 1993, 97, (24), 6329-6331. 97. Fukuzumi, S.; Suenobu, T.; Kawamura, S.; Ishida, A.; Mikami, K., Selective two-electron reduction of C-60 by 10-methyl-9,10-dihydroacridine via photoinduced electron transfer. Chemical Communications 1997, (3), 291-292. 98. Jin, C. M.; Hettich, R.; Compton, R.; Joyce, D.; Blencoe, J.; Burch, T., Direct Solid-Phase Hydrogenation of Fullerenes. Journal of Physical Chemistry 1994, 98, (16), 4215-4217. 99. Petrie, S.; Javahery, G.; Wang, J.; Bohme, D. K., Derivatization of the Fullerene Dications C-60(2+) and C-70(2+) by Ion Molecule Reactions in the Gas-Phase. Journal of the American Chemical Society 1992, 114, (23), 9177-9181. 100. Talyzin, A. V.; Shulga, Y. M.; Jacob, A., Comparative study of hydrofullerides C60Hx synthesized by direct and catalytic hydrogenation. Applied Physics a-Materials Science & Processing 2004, 78, (7), 1005-1010. 101. Talyzin, A. V.; Tsybin, Y. O.; Peera, A. A.; Schaub, T. M.; Marshall, A. G.; Sundqvist, B.; Mauron, P.; Zuttel, A.; Billups, W. E., Synthesis of C59Hx and C58Hx fullerenes stabilized by hydrogen. Journal of Physical Chemistry B 2005, 109, (12), 5403-5405. 102. Talyzin, A. V.; Tsybin, Y. O.; Schaub, T. M.; Mauron, P.; Shulga, Y. M.; Zuttel, A.; Sundqvist, B.; Marshall, A. G., Composition of hydrofullerene mixtures produced by go reaction with hydrogen gas revealed by high-resolution mass spectrometry. Journal of Physical Chemistry B 2005, 109, (26), 12742-12747. 103. Talyzin, A. V.; Tsybin, Y. O.; Purcell, J. M.; Schaub, T. M.; Shulga, Y. M.; Noreus, D.; Sato, T.; Dzwilewski, A.; Sundqvist, B.; Marshall, A. G., Reaction of hydrogen gas with C-60 at elevated pressure and temperature: Hydrogenation and cage fragmentation. Journal of Physical Chemistry A 2006, 110, (27), 8528-8534. 104. Luzan, S. M.; Tsybin, Y. O.; Talyzin, A. V., Reaction of C(60) with Hydrogen Gas: In Situ Monitoring and Pathways. Journal of Physical Chemistry C 2011, 115, (23), 11484-11492. 105. Tarasov, B. P.; Shul'ga, Y. M.; Fokin, V. N.; Vasilets, V. N.; Shul'ga, N. Y.; Schur, D. V.; Yartys, V. A., Deuterofullerene C60D24 studied by XRD, IR and XPS. Journal of Alloys and Compounds 2001, 314, (1-2), 296-300. 106. Shul'ga, Y. M.; Tarasov, B. P.; Fokin, V. N.; Martynenko, V. M.; Schur, D. V.; Volkov, G. A.; Rubtsov, V. I.; Krasochka, G. A.; Chapusheva, N. V.; Shevchenko, V. V., Deuterofullerenes. Carbon 2003, 41, (7), 1365-1368. 107. Darwish, A. D.; Avent, A. G.; Taylor, R.; Walton, D. R. M., Structural characterisation of C60H18; a C-3v symmetry crown. Journal of the Chemical Society-Perkin Transactions 2 1996, (10), 2051-2054. 108. Cataldo, F., Iglesias-Groth, S., Fulleranes: The Hydrogenated Fullerenes. Springer 2010, ISSN 1875-0745.
81
109. Itaka, K.; Yamashiro, M.; Yamaguchi, J.; Haemori, M.; Yaginuma, S.; Matsumoto, Y.; Kondo, M.; Koinuma, H., High-mobility C-60 field-effect molecular-wetting controlled transistors fabricated on substrates. Advanced Materials 2006, 18, (13), 1713-1716. 110. Antonov, V. E.; Bashkin, I. O.; Khasanov, S. S.; Moravsky, A. P.; Morozov, Y. G.; Shulga, Y. M.; Ossipyan, Y. A.; Ponyatovsky, E. G., Magnetic ordering in hydrofullerite C60H24. Journal of Alloys and Compounds 2002, 330, 365-368. 111. Tarasov, B. P.; Fokin, V. N.; Moravskii, A. P.; Shulga, Y. M., Reactions of fullerenes with deuterium in the presence of palladium. Russian Chemical Bulletin 1996, 45, (7), 1778-1779. 112. Luzan, S. M.; Talyzin, A. V., Effect of Catalysts on the Reaction of C-60 with Hydrogen. Fullerenes Nanotubes and Carbon Nanostructures 2012, 20, (4-7), 319-323. 113. Luzan, S. M.; Tsybin, Y. O.; Talyzin, A. V., Reaction of C-60 with Hydrogen Gas: In Situ Monitoring and Pathways. Journal of Physical Chemistry C 2011, 115, (23), 11484-11492. 114. Wagberg, T.; Johnels, D.; Peera, A.; Hedenstrom, M.; Schulga, Y. M.; Tsybin, Y. O.; Purcell, J. M.; Marshall, A. G.; Noreus, D.; Sato, T.; Talyzin, A. V., Selective synthesis of the C-3v isomer of C60H18. Organic Letters 2005, 7, (25), 5557-5560. 115. Hall, L. E.; Mckenzie, D. R.; Attalla, M. I.; Vassallo, A. M.; Davis, R. L.; Dunlop, J. B.; Cockayne, D. J. H., The Structure of C60h36. Journal of Physical Chemistry 1993, 97, (21), 5741-5744. 116. Schur, D. V.; Zaginaichenko, S. Y.; Savenko, A. F.; Bogolepov, V. A.; Anikina, N. S.; Zolotarenko, A. D.; Matysina, Z. A.; Veziroglu, T. N.; Skryabina, N. E., Experimental evaluation of total hydrogen capacity for fullerite C(60). International Journal of Hydrogen Energy 2011, 36, (1), 1143-1151. 117. Peera, A. A.; Alemany, L. B.; Billups, W. E., Hydrogen storage in hydrofullerides. Applied Physics a-Materials Science & Processing 2004, 78, (7), 995-1000. 118. Teprovich, J. A.; Wellons, M. S.; Lascola, R.; Hwang, S. J.; Ward, P. A.; Compton, R. N.; Zidan, R., Synthesis and Characterization of a Lithium-Doped Fullerane (Li-x-C-60-H-y) for Reversible Hydrogen Storage. Nano Letters 2012, 12, (2), 582-589. 119. Nossal, J.; Saini, R. K.; Alemany, L. B.; Meier, M.; Billups, W. E., The synthesis and characterization of fullerene hydrides. European Journal of Organic Chemistry 2001, (22), 4167-4180. 120. Haufler, R. E.; Conceicao, J.; Chibante, L. P. F.; Chai, Y.; Byrne, N. E.; Flanagan, S.; Haley, M. M.; Obrien, S. C.; Pan, C.; Xiao, Z.; Billups, W. E.; Ciufolini, M. A.; Hauge, R. H.; Margrave, J. L.; Wilson, L. J.; Curl, R. F.; Smalley, R. E., Efficient Production of C60 (Buckminsterfullerene), C60h36, and the Solvated Buckide Ion. Journal of Physical Chemistry 1990, 94, (24), 8634-8636. 121. Popov, A. A.; Senyavin, V. V.; Granovsky, A. A.; Lobach, A. S., Vibrational spectra and molecular structure of the hydrofullerenes C60H18, C60D18, and C60H36 as studied by IR and Raman spectroscopy and first-principle calculations. Hydrogen Materials Science and Chemistry of Carbon Nanomaterials 2004, 172, 347-356. 122. Balasubramanian, K., Enumeration of Isomers of Polysubstituted C60 and Application to Nmr. Chemical Physics Letters 1991, 182, (3-4), 257-262. 123. Clare, B. W.; Kepert, D. L., The structures of C60F36 and new possible structures for C60H36. Journal of Molecular Structure-Theochem 1999, 466, 177-186. 124. Nossal, J.; Saini, R. K.; Sadana, A. K.; Bettinger, H. F.; Alemany, L. B.; Scuseria, G. E.; Billups, W. E.; Saunders, M.; Khong, A.; Weisemann, R., Formation, isolation, spectroscopic properties, and calculated properties of some isomers of C60H36. Journal of the American Chemical Society 2001, 123, (35), 8482-8495. 125. Bucsi, I.; Szabo, P.; Aniszfeld, R.; Prakash, G. K. S.; Olah, G. A., HPLC separation of hydrogenated derivatives of buckminsterfullerene. Chromatographia 1998, 48, (1-2), 59-64. 126. Talyzin, A. V.; Sundqvist, B.; Shulga, Y. M.; Peera, A. A.; Imus, P.; Billups, W. E., Gentle fragmentation of C-60 by strong hydrogenation: a route to synthesizing new materials. Chemical Physics Letters 2004, 400, (1-3), 112-116. 127. Sakurai, H.; Daiko, T.; Hirao, T., A synthesis of sumanene, a fullerene fragment. Science 2003, 301, (5641), 1878-1878. 128. Steinberg, B. D.; Jackson, E. A.; Filatov, A. S.; Wakamiya, A.; Petrukhina, M. A.; Scott, L. T., Aromatic pi-Systems More Curved Than C(60). The Complete Family of All Indenocorannulenes Synthesized by Iterative Microwave-Assisted Intramolecular Arylations. Journal of the American Chemical Society 2009, 131, (30), 10537-10545. 129. Wu, T. C.; Hsin, H. J.; Kuo, M. Y.; Li, C. H.; Wu, Y. T., Synthesis and Structural Analysis of a Highly Curved Buckybowl Containing Corannulene and Sumanene Fragments. Journal of the American Chemical Society 2011, 133, (41), 16319-16321. 130. Wu, Y. T.; Siegel, J. S., Aromatic molecular-bowl hydrocarbons: Synthetic derivatives, their structures, and physical properties. Chemical Reviews 2006, 106, (12), 4843-4867. 131. Miller, G. P.; Kintigh, J.; Kim, E.; Weck, P. F.; Berber, S.; Tomanek, D., Hydrogenation of single-wall carbon nanotubes using polyamine reagents: Combined experimental and theoretical study. Journal of the American Chemical Society 2008, 130, (7), 2296-2303.
82

132. Zhang, G. Y.; Qi, P. F.; Wang, X. R.; Lu, Y. R.; Mann, D.; Li, X. L.; Dai, H. J., Hydrogenation and hydrocarbonation and etching of single-walled carbon nanotubes. Journal of the American Chemical Society 2006, 128, (18), 6026-6027. 133. Nikitin, A.; Ogasawara, H.; Mann, D.; Denecke, R.; Zhang, Z.; Dai, H.; Cho, K.; Nilsson, A., Hydrogenation of single-walled carbon nanotubes. Physical Review Letters 2005, 95, (22), 225507 – 225507-4. 134. Nikitin, A.; Li, X. L.; Zhang, Z. Y.; Ogasawara, H.; Dai, H. J.; Nilsson, A., Hydrogen storage in carbon nanotubes through the formation of stable C-H bonds. Nano Letters 2008, 8, (1), 162-167. 135. Kosynkin, D. V.; Higginbotham, A. L.; Sinitskii, A.; Lomeda, J. R.; Dimiev, A.; Price, B. K.; Tour, J. M., Longitudinal unzipping of carbon nanotubes to form graphene nanoribbons. Nature 2009, 458, (7240), 872-876. 136. Cataldo, F.; Compagnini, G.; Patane, G.; Ursini, O.; Angelini, G.; Ribic, P. R.; Margaritondo, G.; Cricenti, A.; Palleschi, G.; Valentini, F., Graphene nanoribbons produced by the oxidative unzipping of single-wall carbon nanotubes. Carbon 2010, 48, (9), 2596-2602. 137. Kosynkin, D. V.; Lu, W.; Sinitskii, A.; Pera, G.; Sun, Z. Z.; Tour, J. M., Highly Conductive Graphene Nanoribbons by Longitudinal Splitting of Carbon Nanotubes Using Potassium Vapor. Acs Nano 2011, 5, (2), 968-974. 138. Jiao, L. Y.; Zhang, L.; Wang, X. R.; Diankov, G.; Dai, H. J., Narrow graphene nanoribbons from carbon nanotubes. Nature 2009, 458, (7240), 877-880. 139. Zhao, N. Q.; He, C. N.; Li, J. J.; Jiang, Z. Y.; Li, Y. D., Study on purification and tip-opening of CNTs fabricated by CVD. Materials Research Bulletin 2006, 41, (12), 2204-2209. 140. Okazaki, T.; Iizumi, Y.; Okubo, S.; Kataura, H.; Liu, Z.; Suenaga, K.; Tahara, Y.; Yudasaka, M.; Okada, S.; Iijima, S., Coaxially Stacked Coronene Columns inside Single-Walled Carbon Nanotubes. Angewandte Chemie-International Edition 2011, 50, (21), 4853-4857. 141. Takenobu, T.; Takano, T.; Shiraishi, M.; Murakami, Y.; Ata, M.; Kataura, H.; Achiba, Y.; Iwasa, Y., Stable and controlled amphoteric doping by encapsulation of organic molecules inside carbon nanotubes. Nature Materials 2003, 2, (10), 683-688. 142. Guan, L. H.; Shi, Z. J.; Li, M. X.; Gu, Z. N., Ferrocene-filled single-walled carbon nanotubes. Carbon 2005, 43, (13), 2780-2785. 143. Yao, M. G.; Stenmark, P.; Abou-Hamad, E.; Nitze, F.; Qin, J. A.; Goze-Bac, C.; Wagberg, T., Confined adamantane molecules assembled to one dimension in carbon nanotubes. Carbon 2011, 49, (4), 1159-1166. 144. Talyzin, A. V.; Anoshkin, I. V.; Krasheninnikov, A. V.; Nieminen, R. M.; Nasibulin, A. G.; Jiang, H.; Kauppinen, E. I., Synthesis of Graphene Nanoribbons Encapsulated in Single-Walled Carbon Nanotubes. Nano Letters 2011, 11, (10), 4352-4356. 145. Abou-Hamad, E.; Kim, Y.; Talyzin, A. V.; Goze-Bac, C.; Luzzi, D. E.; Rubio, A.; Wagberg, T., Hydrogenation of C(60) in Peapods: Physical Chemistry in Nano Vessels. Journal of Physical Chemistry C 2009, 113, (20), 8583-8587. 146. Moisala, A.; Nasibulin, A. G.; Brown, D. P.; Jiang, H.; Khriachtchev, L.; Kauppinen, E. I., Single-walled carbon nanotube synthesis using ferrocene and iron pentacarbonyl in a laminar flow reactor. Chemical Engineering Science 2006, 61, (13), 4393-4402. 147. Kataura, H.; Maniwa, Y.; Kodama, T.; Kikuchi, K.; Hirahara, K.; Iijima, S.; Suzuki, S.; Kratschmer, W.; Achiba, Y., Fullerene-peapods: Synthesis, structure, and Raman spectroscopy. Electronic Properties of Molecular Nanostructures 2001, 591, 251-255. 148. Sing, K. S. W.; Everett, D. H.; Haul, R. A. W.; Moscou, L.; Pierotti, R. A.; Rouquerol, J.; Siemieniewska, T., Reporting Physisorption Data for Gas Solid Systems with Special Reference to the Determination of Surface-Area and Porosity (Recommendations 1984). Pure and Applied Chemistry 1985, 57, (4), 603-619. 149. Dubinin, M. M., The Potential Theory of Adsorption of Gases and Vapors for Adsorbents with Energetically Nonuniform Surfaces. Chemical Reviews 1960, 60, (2), 235-241. 150. Horvath, G.; Kawazoe, K., Method for the Calculation of Effective Pore-Size Distribution in Molecular-Sieve Carbon. Journal of Chemical Engineering of Japan 1983, 16, (6), 470-475. 151. Saito, A.; Foley, H. C., Curvature and Parametric Sensitivity in Models for Adsorption in Micropores. Aiche Journal 1991, 37, (3), 429-436. 152. Cheng, L. S.; Yang, R. T., Improved Horvath-Kawazoe Equations Including Spherical Pore Models for Calculating Micropore Size Distribution. Chemical Engineering Science 1994, 49, (16), 2599-2609. 153. Barrett, E. P.; Joyner, L. G.; Halenda, P. P., The Determination of Pore Volume and Area Distributions in Porous Substances .1. Computations from Nitrogen Isotherms. Journal of the American Chemical Society 1951, 73, (1), 373-380. 154. Ravikovitch, P. I.; Vishnyakov, A.; Russo, R.; Neimark, A. V., Unified approach to pore size characterization of microporous carbonaceous materials from N-2, Ar, and CO2 adsorption isotherms. Langmuir 2000, 16, (5), 2311-2320. 155. Tarazona, P., Free-Energy Density Functional for Hard-Spheres. Physical Review A 1985, 31, (4), 2672-2679. 156. (Sackler NAS Colloquium) Scientific Examination of Art: Modern Techniques in Conservation and Analysis. The National Academies Press: 2005.
83

157. Stroobant, E. H. V., Mass Spectrometry Principles and Applications. ISBN 978-0-470-03311-1 - John Wiley & Sons 2008, (Third Edition). 158. Xuan, W. M.; Zhu, C. F.; Liu, Y.; Cui, Y., Mesoporous metal-organic framework materials. Chemical Society Reviews 2012, 41, (5), 1677-1695. 159. Meek, S. T.; Greathouse, J. A.; Allendorf, M. D., Metal-Organic Frameworks: A Rapidly Growing Class of Versatile Nanoporous Materials. Advanced Materials 2011, 23, (2), 249-267. 160. Sculley, J.; Yuan, D. Q.; Zhou, H. C., The current status of hydrogen storage in metal-organic frameworks-updated. Energy & Environmental Science 2011, 4, (8), 2721-2735. 161. Dybtsev, D. N.; Chun, H.; Kim, K., Rigid and flexible: A highly porous metal-organic framework with unusual guest-dependent dynamic behavior. Angewandte Chemie-International Edition 2004, 43, (38), 5033-5036. 162. Chun, H.; Moon, J., Discovery, synthesis, and characterization of an isomeric coordination polymer with pillared kagome net topology. Inorganic Chemistry 2007, 46, (11), 4371-4373. 163. Chun, H.; Jung, H. J.; Seo, J. W., Isoreticular Metal-Organic Polyhedral Networks Based on 5-Connecting Paddlewheel Motifs. Inorganic Chemistry 2009, 48, (5), 2043-2047. 164. Chun, H.; Jung, H., Targeted Synthesis of a prototype MOF Based on Zn-4(O)(O2C)(6) Units and a Nonlinear Dicarboxylate Ligand. Inorganic Chemistry 2009, 48, (2), 417-419. 165. Chun, H.; Jung, H.; Koo, G.; Jeong, H.; Kim, D. K., Efficient hydrogen sorption in 8-connected MOFs based on trinuclear pinwheel motifs. Inorganic Chemistry 2008, 47, (12), 5355-5359. 166. Li, J. P.; Cheng, S. J.; Zhao, Q.; Long, P. P.; Dong, J. X., Synthesis and hydrogen-storage behavior of metal-organic framework MOF-5. International Journal of Hydrogen Energy 2009, 34, (3), 1377-1382. 167. Li, H.; Eddaoudi, M.; O'Keeffe, M.; Yaghi, O. M., Design and synthesis of an exceptionally stable and highly porous metal-organic framework. Nature 1999, 402, (6759), 276-279. 168. Panella, B.; Hirscher, M., Hydrogen physisorption in metal-organic porous crystals. Advanced Materials 2005, 17, (5), 538-541. 169. Saha, D. P. D.; Deng, S. G.; Yang, Z. G., Hydrogen adsorption on metal-organic framework (MOF-5) synthesized by DMF approach. Journal of Porous Materials 2009, 16, (2), 141-149. 170. Biliskov, N.; Baranovic, G., Infrared spectroscopy of liquid water-N,N-dimethylformamide mixtures. Journal of Molecular Liquids 2009, 144, (3), 155-162. 171. Luzan, S. M.; Talyzin, A. V., Hydrogen adsorption in Pt catalyst/MOF-5 materials. Microporous and Mesoporous Materials 2010, 135, (1-3), 201-205. 172. Luzan, S. M.; Talyzin, A. V., Comment to the "Response to "Hydrogen adsorption in Pt catalyst/MOF-5 materials"" by Li et al. [1]. Microporous and Mesoporous Materials 2011, 139, (1-3), 216-218. 173. Li, Y. W.; Wang, L. F.; Yang, R. T., Response to "hydrogen adsorption in Pt catalyst/MOF-5 materials" by Luzan and Talyzin. Microporous and Mesoporous Materials 2010, 135, (1-3), 206-208. 174. Wang, L. F.; Stuckert, N. R.; Chen, H.; Yang, R. T., Effects of Pt Particle Size on Hydrogen Storage on Pt-Doped Metal-Organic Framework IRMOF-8. Journal of Physical Chemistry C 2011, 115, (11), 4793-4799. 175. Wang, L.; Yang, R. T., Hydrogen Storage Properties of Carbons Doped with Ruthenium, Platinum, and Nickel Nanoparticles. The Journal of Physical Chemistry C 2008, 112, (32), 12486-12494. 176. Wang, L. F.; Yang, F. H.; Yang, R. T.; Miller, M. A., Effect of Surface Oxygen Groups in Carbons on Hydrogen Storage by Spillover. Industrial & Engineering Chemistry Research 2009, 48, (6), 2920-2926. 177. Liu, Y. Y.; Ju-Lan, Z.; Jian, Z.; Xu, F.; Sun, L. X., Improved hydrogen storage in the modified metal-organic frameworks by hydrogen spillover effect. International Journal of Hydrogen Energy 2007, 32, (16), 4005-4010. 178. Zhao, Y. F.; Heben, M. J.; Dillon, A. C.; Simpson, L. J.; Blackburn, J. L.; Dorn, H. C.; Zhang, S. B. B., Nontrivial tuning of the hydrogen-binding energy to fullerenes with endohedral metal dopants. Journal of Physical Chemistry C 2007, 111, (35), 13275-13279. 179. Talyzin, A. V.; Tsybin, Y. O.; Purcell, J. M.; Schaub, T. M.; Shulga, Y. M.; Noréus, D.; Sato, T.; Dzwilewski, A.; Sundqvist, B.; Marshall, A. G., Reaction of Hydrogen Gas with C60 at Elevated Pressure and Temperature:� Hydrogenation and Cage Fragmentation†. The Journal of Physical Chemistry A 2006, 110, (27), 8528-8534. 180. Lobach, A. S.; Tarasov, B. P.; Shulga, Y. M.; Perov, A. A.; Stepanov, A. N., Reaction of D-2 with palladium fulleride C60Pd4.9. Russian Chemical Bulletin 1996, 45, (2), 464-465. 181. Meletov, K. P.; Kourouklis, G. A., High-pressure hydrogenated fullerenes: Optical spectra and stability of C60H36 at high pressure. Journal of Experimental and Theoretical Physics 2005, 100, (4), 760-774. 182. Talyzin, A.; Dzwilewski, A.; Sundqvist, B.; Tsybin, Y. O.; Purcell, J. M.; Marshall, A. G.; Shulga, Y. M.; McCammon, C.; Dubrovinsky, L., Hydrogenation Of C-60 at 2 GPa pressure and high temperature. Chemical Physics 2006, 325, (2), 445-451. 183. Talyzin, A. V.; Dzwilewski, A.; Pudelko, M., Formation of palladium fullerides and their thermal decomposition into palladium nanoparticles. Carbon 2007, 45, (13), 2564-2569. 184. Talyzin, A. V.; Dubrovinsky, L. S.; Le Bihan, T.; Jansson, U., Pressure-induced polymerization of C-60 at high temperatures: An in situ Raman study. Physical Review B 2002, 65, (24), 245413 – 245413-10.
84
185. Pekker, S.; Kovats, E.; Oszlanyi, G.; Benyei, G.; Klupp, G.; Bortel, G.; Jalsovszky, I.; Jakab, E.; Borondics, F.; Kamaras, K.; Bokor, M.; Kriza, G.; Tompa, K.; Faigel, G., Rotor-stator molecular crystals of fullerenes with cubane. Nature Materials 2005, 4, (10), 764-767. 186. Pekker, S.; Salvetat, J. P.; Jakab, E.; Bonard, J. M.; Forro, L., Hydrogenation of carbon nanotubes and graphite in liquid ammonia. Journal of Physical Chemistry B 2001, 105, (33), 7938-7943. 187. Abou-Hamad, E.; Kim, Y.; Talyzin, A. V.; Goze-Bac, C.; Luzzi, D. E.; Rubio, A.; Wagberg, T., Hydrogenation of C-60 in Peapods: Physical Chemistry in Nano Vessels. Journal of Physical Chemistry C 2009, 113, (20), 8583-8587. 188. Bhowmick, R.; Rajasekaran, S.; Friebel, D.; Beasley, C.; Jiao, L. Y.; Ogasawara, H.; Dai, H. J.; Clemens, B.; Nilsson, A., Hydrogen Spillover in Pt-Single-Walled Carbon Nanotube Composites: Formation of Stable C-H Bonds. Journal of the American Chemical Society 2011, 133, (14), 5580-5586. 189. Kim, K. S.; Park, K. A.; Kim, H. J.; Bae, D. J.; Lim, S. C.; Lee, Y. H., Band gap modulation of a carbon nanotube by hydrogen functionalization. Journal of the Korean Physical Society 2003, 42, S137-S142. 190. Nasibulin, A. G.; Pikhitsa, P. V.; Jiang, H.; Brown, D. P.; Krasheninnikov, A. V.; Anisimov, A. S.; Queipo, P.; Moisala, A.; Gonzalez, D.; Lientschnig, G.; Hassanien, A.; Shandakov, S. D.; Lolli, G.; Resasco, D. E.; Choi, M.; Tomanek, D.; Kauppinen, E. I., A novel hybrid carbon material. Nature Nanotechnology 2007, 2, (3), 156-161.
85