MATERIALS AND METHODS - Shodhganga : a reservoir of...
40
Chapter 3 MATERIALS AND METHODS 3.1 SCREENING OF PLANTS FOR PROTEASE INHIBITOR 3.1.1 Plants for the study Plants, which are locally available, and belonging to the families of Leguminosae, Malvaceae, Graminae, Rutaceae and Guttiferae were used as the source material to screen for protease inhibitory activity. Different plant parts including seeds, leaves, flowers and bark were used for the study. 3.1.2 Extraction and recovery of protease inhibitor Plant materials for the study were washed thoroughly in distilled water and air-dried. A buffer extract was prepared in a 500 ml conical flask by homogenizing 25 g of plant materials in 100 ml of 0.1M phosphate buffer with pH 7.0 in an electrical blender. The homogenate was further mixedthoroughly by incubating the contents at room temperature in a rotary shaker for 30 minutes at 150 rpm. The slurry was then filtered through cheesecloth and the filtrate was centrifuged at 10,000 rpm for 15 minutes at 4°C for removing any cell debris that remains in the preparation (Pichare and Kachole, 1996). The clear supernatant obtained represented the crude extract, and was assayed for protease inhibitory activity and protein content as described in section 3.1.3.1 and 3.1.3.3 respectively.
Transcript of MATERIALS AND METHODS - Shodhganga : a reservoir of...

Chapter 3
MATERIALS AND METHODS
3.1 SCREENING OF PLANTS FOR PROTEASE INHIBITOR
3.1.1 Plants for the study
Plants, which are locally available, and belonging to the families of
Leguminosae, Malvaceae, Graminae, Rutaceae and Guttiferae were used as
the source material to screen for protease inhibitory activity. Different plant
parts including seeds, leaves, flowers and bark were used for the study.
3.1.2 Extraction and recovery of protease inhibitor
Plant materials for the study were washed thoroughly in distilled
water and air-dried. A buffer extract was prepared in a 500 ml conical flask
by homogenizing 25 g of plant materials in 100 ml of 0.1M phosphate
buffer with pH 7.0 in an electrical blender. The homogenate was further
mixed thoroughly by incubating the contents at room temperature in a rotary
shaker for 30 minutes at 150 rpm. The slurry was then filtered through
cheesecloth and the filtrate was centrifuged at 10,000 rpm for 15 minutes at
4°C for removing any cell debris that remains in the preparation (Pichare
and Kachole, 1996). The clear supernatant obtained represented the crude
extract, and was assayed for protease inhibitory activity and protein content
as described in section 3.1.3.1 and 3.1.3.3 respectively.
1%0.44M in Distilled WaterO.lM
Chapter 3
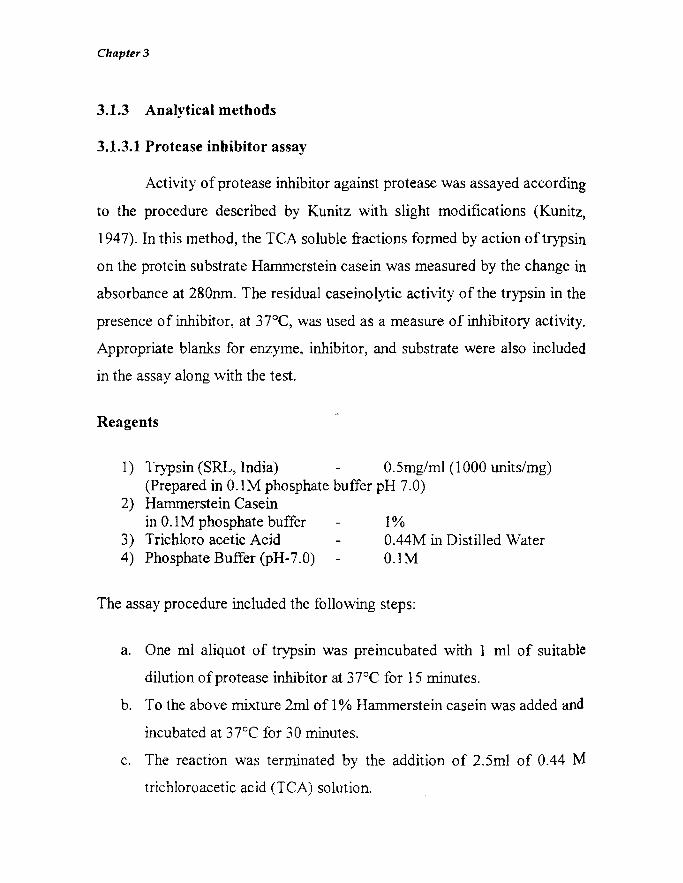
3.1.3 Analytical methods
3.1.3.1 Protease inhibitor assay
Activity of protease inhibitor against protease was assayed according
to the procedure described by Kunitz with slight modifications (Kunitz,
1947). In this method, the TCA soluble fractions formed by action of trypsin
on the protein substrate Hammerstein casein was measured by the change in
absorbance at 280nm. The residual caseinolytic activity of the trypsin in the
presence of inhibitor, at 37°C, was used as a measure of inhibitory activity,
Appropriate blanks for enzyme, inhibitor, and substrate were also included
in the assay along with the test.
Reagents
1) Trypsin (SRL, India) O.5mg/ml (1000 units/mg)(Prepared in O.lM phosphate buffer pH 7.0)
2) Harnmerstein Caseinin O.lM phosphate buffer
3) Trichloro acetic Acid4) Phosphate Buffer (pH-7.0)
The assay procedure included the following steps:
a. One ml aliquot of trypsin was preincubated with 1 ml of suitable
dilution of protease inhibitor at 37°C for IS minutes.
b. To the above mixture 2ml of 1% Hammerstein casein was added and
incubated at 37°C for 30 minutes.
c. The reaction was terminated by the addition of 2.Sml of 0.44 :M
trichloroacetic acid (TCA) solution.
Materials and Methods
d. The reaction mixture was transferred to centrifuge tube and the
precipitated protein was removed by centrifugation, at IO,OOOrpm
for 15 minutes (Sigma, Germany).
The absorbance of the clear supematant was measured at 280nm ine.
DV-Visible spectrophotometer (Shirnadzu, Japan) against
appropriate blanks. The TCA soluble peptide fractions of casein
formed by the action of trypsin in the presence and absence of
inhibitor was quantified by comparing with tyrosine as standard.
f One unit of trypsin activity was defined as the amount of enzyme
that liberated I ug of tyrosine per milliliter of the reaction mixture
per minute under the assay conditions.
g. One unit of inhibitor activity was defined as the decrease by one unit
of absorbance of TCA soluble casein hydrolysis product liberated
by trypsin action at 280nm per minute at 37°C in the given assay
volume.
The protease inhibitory activity was expressed in terms of percent
inhibition and it was calculated as
Amount of tyrosine released without inhibitor
- Amount of tyrosine released with inhibitor
Inhibitory activity (%) = X 100
Amount of tyrosine released without inhibitor
3.1.3.2 Residual inhibitory activity
Residual inhibitory activity is the percent inhibitory activity of the
sample with respect to the percent inhibitory activity of the control.
Residual Inhibitory Activity = Inhibitory Activity of the sample (%/ml) X 100
Inhibitory Activity of the control (%/ml)

Chapter 3
3.1.3.3 Protein
Protein content was determined according to the method of Lowry et
al., (1951) using Bovine Serum Albumin (BSA) as the standard and the
concentration was expressed in milligram per milliliter (mg/ml).
Reagents
a) Solution I: A stock solution containing 2% (w/v) sodium carbonate
(w/v) in 0.1 N sodium hydroxide in distilled water.
b) Solution Il: A stock solution of 0.5 % (w/v) cupric sulphate III
distilled water.
c) Solution Ill: A stock solution of 1% (w/v) sodium potassium
tartarate in distilled water.
d) Solution IV: Working reagent: To 100 ml of solution (I), 1 ml each
of solution (Il) and solution (UI) was added and mixed well.
e) Solution V: 1:1 Folin and Ciocalteau's phenol reagent diluted with
distilled water was prepared fresh just before use.
Estimation
The sample was made up to 500 ul with distilled water and added
with 2 ml freshly prepared working reagent (Solution IV), mixed
thoroughly, and incubated for 10 minutes. Later, 250fil of solution (V) was
added, incubated for 30 minutes and the absorbance was measured at 750nm
in a Uv-Visible spectrophotometer (Shimadzu, Japan).
60
3.1.3.4 Specific activ
Specific acti
percent inhibitory ac
percent specific activ
Specific activ
3.2 SELECTIm
OFPROTEJ
Those protei
precipitated by ammr
and selection of pote
plant samples with IT
crude protein inhibit
sections.
3.2.1 Extraction a
The crude bi
described under sec
inhibitory activity ai
3.1.3.1 and 3.1.3.3 re
I'
Materials and Methods
3.1.3.4 Specific activity
o the method of Lowry et
as the standard and the
liter (mg/ml).
Specific activity of the sample was calculated by dividing the
percent inhibitory activity with the protein content and was expressed as
percent specific activity/mg protein.
SELECTION OF POTENTIAL SOURCE AND ISOLATION
OF PROTEASE INHIBITOR FROM MORINGA OLEIFERA
o(w/v) sodium carbonate
d water.
(w/v) cupric sulphate m
3.2
Specific activity = Inhibitory activity (%)
Protein (mg/ml)
:w/v) sodium potassium
of solution (I), I ml each
and mixed well.
enol reagent diluted with
'e use.
Iistilled water and added
(Solution IV), mixed
:50fll of solution (V) was
~ was measured at 750nm
an).
Those protease inhibitors from various sources that could be
precipitated by ammonium sulphate salts were selected for further screening
and selection of potential source. For this, the strategy adopted was that the
plant samples with more than 60% protease inhibition were selected and the
crude protein inhibitor extract was prepared as described in the following
sections.
3.2.1 Extraction and recovery of protease inhibitor
The crude buffer extract from the selected plants was prepared as
described under section 3.1.2. The samples were assayed for protease
inhibitory activity and protein content as described earlier under sections
3.1.3.1 and 3.1.3.3 respectively.
61

Chapter 3
3.2.2 Ammonium sulphate precipitation
Ammonium sulphate precipitation of the prepared sample was done
according to the method described by Englard and Seifter (1990). The
fractionation using ammonium sulphate precipitation has the advantage of
intermediate removal of unwanted proteins and simultaneously the protein
of interest could be concentrated. Ammonium sulphate (SRL, India)
required to precipitate the protease inhibitor was optimized by adding
varying concentrations (30%, 60% and 90%) to the crude extract as detailed
below.
I) To precipitate the protein, ammonium sulphate was slowly added
initially at 30% (w/v) saturation to the crude extract while keeping
in ice with gentle stirring.
2) After complete dissolution of ammonium sulphate, the solution
was kept at 4"C for over night precipitation.
3) Protein precipitated was collected by centrifugation at 10,000 rpm
for 15 minutes at 4"C.
4) To the supernatant, required ammonium sulphate for next level of
saturation was added and the procedure mentioned above was
repeated. The precipitation was continued up to 90% (w/v) of
ammonium sulphate saturation.
3.2.3 Dialysis
The precipitate obtained after ammonium sulphate precipitation was
further dialyzed against a.OIM phosphate buffer (pH 7.0), in order to
remove the ammonium sulphate from the precipitate- as detailed below.

Materials and Methods
3.2.3.1 Pretreatment of dialysis tube
Dialysis tube (Sigma-Aldrich) was treated to remove the humectants
and protectants like glycerin and sulfur compounds present in it, and to
make the pores of the tube more clear. The treated tube retain most of the
proteins of molecular weight 12 kDa or greater. The method followed for
the treatment of the dialysis tube was as follows.
a) Washed the tube in running water for 3-4 hrs.
b) Rinsed in 0.3% (w/v) solution of sodium sulfide, at 80°C for 1
minute.
c) Washed with hot water (60°C) for 2 minutes.
d) Acidified with 0.2% (v Iv) sulphuric acid.
e) Rinsed with hot water (60°C).
3.2.3.2 Dialysis procedure
a) The precipitated protein was resuspended in minimum quantity of
O.lMphosphate buffer (pH 7.0).
b) The solution was taken in the pretreated dialysis tube (Section
3.2.3.1) (Sigma-Aldrich, cut off value 12 kDa) against O.OIM
solution of phosphate buffer pH 7.0 for 24 hrs, at 4°C with
frequent changes of buffer and assayed for protease inhibitory
activity, protein content and specific activity as described under
sections 3.1.3.1, 3.1.3.3 and 3.1.3.4 respectively.

Chapter 3
3.2.4 Distribution of protease inhibitor in different plant parts of
Moringa oleifera
Distribution of protease inhibitor in various parts of the mature plant
was evaluated by preparing buffer extracts of seeds, leaf, flower, root and
bark. Buffer extracts were prepared as described in section 3.1.2 and were
assayed for protease inhibitory activity, protein content and specific activity
as described under section 3.1.3.1,3.1.3.3 and 3.1.3.4 respectively.
3.2.5 Selection of suitable solvent for extraction of protease inhibitor
from Moringa oleifera.
Ideal solution that enables maximal extraction of the protease
inhibitor from the sample was optimized by preparing crude extract of
leaves with different solutions. 25 g of fresh leaves, from the mature plant
was dissolved in 100 ml each of sodium chloride 15% (w/v) (Wu and
Whitaker, 1990), sodium hydroxide 0.2% (w/v), hydrochloric acid 0.05M
(Tawde, 1961), phosphate buffer O.lM (pH 7.0) (Wu and Whitaker, 1990)
and distilled water as described in section 3.1.2. The extracts thus prepared
were assayed for protease inhibitory activity, protein content and specific
activity as described in section 3.1.3.1, 3.1.3.3 and 3.1.3.4 respectively.
3.3 PROTEASE INHIBITOR PURIFICATION
Protease inhibitor, proteinaceous in nature, isolated from Moringa
oleifera was purified by standard protein purification methods which
included ammonium sulphate precipitation, followed by dialysis, Ion
exchange chromatography and preparative ;'vlyacrylamide gel

Materials and Methods
electrophoresis as detailed below. All purification steps were carried out at
40C unless otherwise mentioned.
3.3.1 Ammonium sulphate precipitation
Ammonium sulphate precipitation (Englard and Seifter, 1990) was
done as described earlier under section 3.2.2.
3.3.2 Dialysis
The precipitate obtained after ammonium sulphate precipitation was
further dialyzed against O.OIM-phosphate buffer (pH 7.0) as described
previously under section 3.2.3.
3.3.3 Ion exchange chromatography
The active protease inhibitor fraction obtained after the dialysis of
ammonium sulphate precipitation was further purified by Ion exchange
chromatography, using DEAE cellulose as the anion exchanger
(Rossomando, 1990). Proteins, due to surface charge, bind to ion
exchangers. These reversibly adsorbed proteins were eluted out either using
a pH or a salt gradient.
3.3.3.1 Activation of DEAE Cellulose
The anion exchanger, DEAE Cellulose was activated as described
below.
Chapter 3
1. Ten gram of DEAE Cellulose (SRL, India) was soaked in citrate
buffer (pH 3.0, O.OIM), allowed to settle, and the [me particles
were removed by decanting.
n. It was then suspended in IM NaCI for overnight.
Ill. Decanted the sodium chloride solution and washed several times
with distilled water in sintered glass funnel using vacuum
filtration, until the pH ofthe washings became neutral.
IV. Equilibrated the resin in appropriate buffer by repeated washing
with the same buffer.
3.3.3.2 Standardization of binding pH of protease inhibitor to DEAE
Cellulose
The pH at which the protease inhibitor binds at its maximum to the
anion exchanger was determined by eluting the protease inhibitor solution
after incubating with DEAE Cellulose equilibrated to different pH. DEAE
Cellulose was activated as per the method described under section 3.3.3.1.
The resin was resuspended in deionised water and equilibrated separately in
0.01 M glycine-HCl buffer (pH 2.0-2.5), citrate buffer (pH 3.0-5.5),
phosphate buffer (pH 6.0-8.0), and carbonate-bicarbonate buffer (pH 9.0
10.5). One milliliter of diluted sample of ammonium sulphate precipitated
fraction dialysed in the above buffers was mixed with 2 ml slurry of DEAf
Cellulose equilibrated in each pH buffer. Incubated at 4°C for overnight,
and the supernatant was collected by decanting without disturbing the
DEAE particles. Washed with appropriate buffer, added 2 ml of 0.4 M
NaCI, and incubated overnight to get eluted the bound proteins from the
DEAE Cellulose. Supernatant collected was centrifuged at 10,000 rpm for

Materials and Methods
15 minutes to remove fme particles and assayed for protease inhibitory
activity and protein content as described under sections 3.1.3.1 and 3.1.3.3
respectively.
3.3.3.3 purification using DEAE Cellulose column
DEAE Cellulose, activated as described under section 3.3.3.1, was
carefullypacked in XKI6/26 column (30cm height) (Amersham Pharmacia)
without any air bubble and the column was equilibrated with citrate buffer
(O.DIM) pH 3.0 overnight.
Fifteen milliliter of dialyzed sample, prepared as mentioned in
section 3.3.2, with a protein content of 3.5 mg/ml was applied to the pre
equilibrated DEAE Cellulose column. After the complete entry of sample
into the column, the column was connected to the reservoir containing the
above said buffer (citrate buffer O.OIM, pH 3.0) with a flow rate of
2 ml/ minute. The unbound proteins were washed out until the absorbance at
280nm reached near to zero. Elution was done at a flow rate of 2ml/minute
using stepwise gradients of sodium chloride ranging from 0.1, 0.2, 0.3, 0.4
and 0.5 M, prepared in citrate buffer (O.OIM) pH 3.0. Five milliliter
fractions were collected and the protein content of each fraction was
estimated by measuring the absorbance at 280nm. Peak fractions from the
column were pooled and dialyzed against the phosphate buffer (O.OIM) pH
7.0 as described under section 3.2.3. The dialyzed fractions were assayed for
protease inhibitory activity, protein content and specific activity as
described under sections 3.1.3.1, 3.1.3.3 and 3.1.3.4 respectively. The yield
and fold ofpurifications was calculated as described below.
Chapter 3
Calculation of yield of protein, yield of protease inhibitor activity and
fold of purification
Yield of protein and yield of protease inhibitory activity of each
fraction during purification is the percent activity obtained by dividing the
total protein content or activity ofthat fraction with the total protein content
or activity of the crude extract as the case may be. Fold of purification in
each step was calculated by dividing the specific activity of the respective
fraction with that of the crude extract.
Yield of protein
Yield of activity
Fold of purification =
Total protein content of the purified fraction X 100
Total protein content of the crude extract
Total activity of the purified fraction X 100
Total activity of the crude extract
Specific activity of the purified fraction X 100
Specific activity of the crude extract
3.3.4 Preparative polyacrylamide gel electrophoresis
Active fractions pooled from ion exchange chromatography were
lyophilized in 1ml aliquot and resuspended in 0.1ml of sample buffer
(0.0625M Tris-HC1, 2% SDS, 10% sucrose, 0.01% bromophenol blue, pH
6.8). Aliquots of three tubes were loaded on to a polyacrylamide gel
prepared as described under section 3.4.1.3.2 and subjected to
electrophoresis (Tarsons Dual mini vertical electophoretic unit). Low
molecular weight markers of Amersham Pharmacia were used as standard.
After electrophoresis, a portion of the gel with marker was stained, and
Materials and Methods
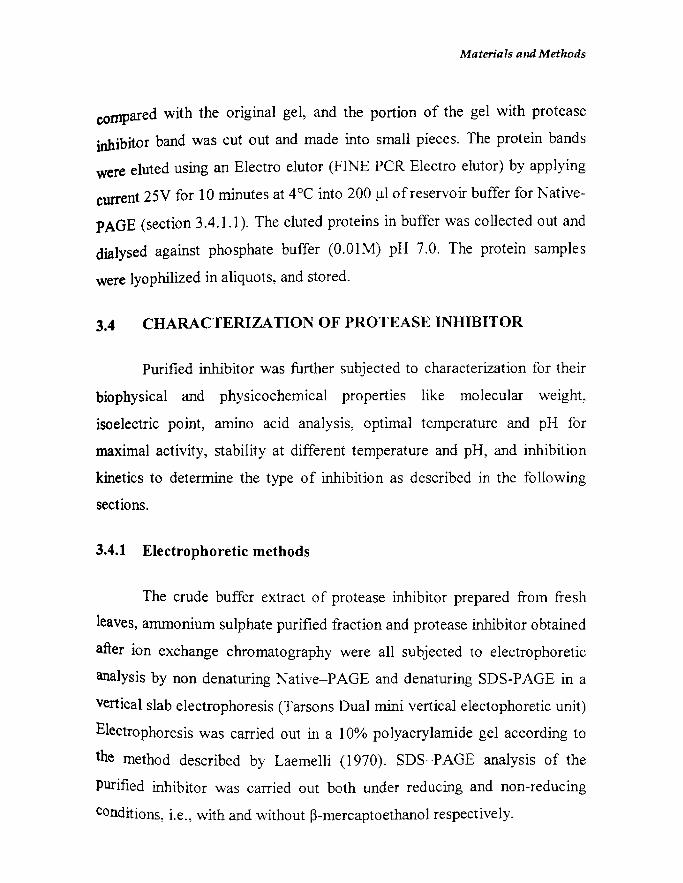
compared with the original gel, and the portion of the gel with protease
inhibitor band was cut out and made into small pieces. The protein bands
were eluted using an Electra elutor (FINE PCR Electro elutor) by applying
current 25V for 10 minutes at 4°C into 200 ul of reservoir buffer for Native
PAGE (section 3.4.1.1). The eluted proteins in buffer was eolIected out and
dialysed against phosphate buffer (0.01M) pH 7.0. The protein samples
were lyophilized in aliquots, and stored.
3.4 CHARACTERIZATION OF PROTEASE INHIBITOR
Purified inhibitor was further subjected to characterization for their
biophysical and physicochemical properties like molecular weight,
isoelectric point, amino acid analysis, optimal temperature and pH for
maximal activity, stability at different temperature and pH, and inhibition
kinetics to determine the type of inhibition as described in the following
sections.
3.4.1 Electrophoretic methods
The crude buffer extract of protease inhibitor prepared from fresh
leaves, ammonium sulphate purified fraction and protease inhibitor obtained
after ion exchange chromatography were all subjected to electrophoretic
analysis by non denaturing Native-PAGE and denaturing SDS-PAGE in a
vertical slab electrophoresis (Tarsons Dual mini vertical electophoretic unit)
Electrophoresis was carried out in a 10% polyacrylamide gel according to
the method described by Laemelli (1970). SDS~PAGE analysis of the
Purified inhibitor was carried out both under reducing and non-reducing
conditions, i.e., with and without ~-mercaptoethanol respectively.
Chapter 3
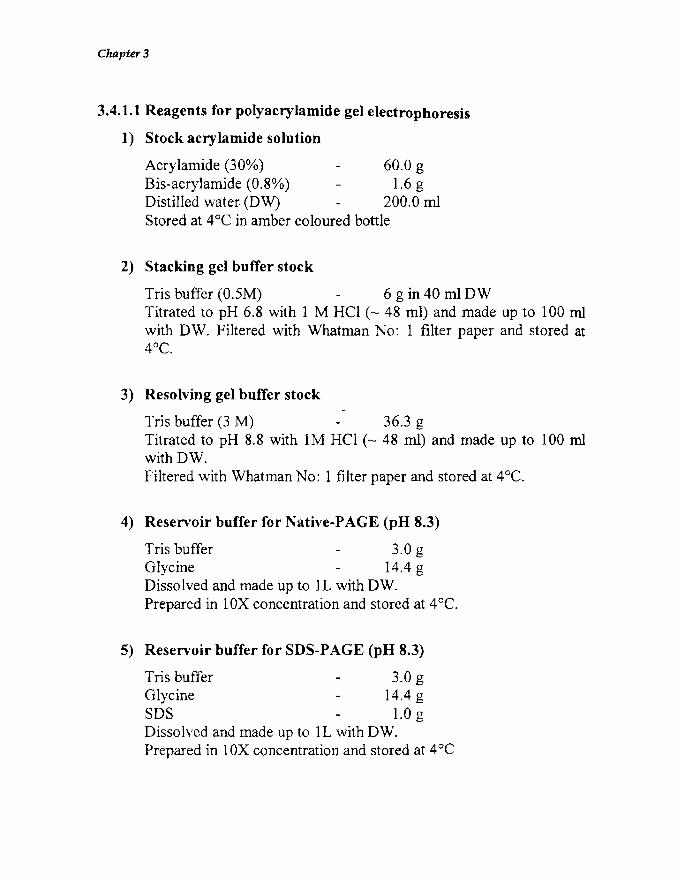
3.4.1.1 Reagents for polyacrylamide gel electrophoresis
1) Stock acrylamide solution
Acrylamide (30%) 60.0 gBis-acrylarnide (0.8%) 1.6 gDistilled water (DW) 200.0 mlStored at 4°C in amber coloured bottle
2) Stacking gel buffer stock
Tris buffer (0.5M) 6 g in 40 ml DWTitrated to pH 6.8 with 1 M HCI (- 48 ml) and made up to 100 m1with DW. Filtered with Whatman No: 1 filter paper and stored at4°C.
3) Resolving gel buffer stock
Tris buffer (3 M) 36.3 gTitrated to pH 8.8 with IM HCI (- 48 ml) and made up to lOO m1with DW.Filtered with Whatman No: 1 filter paper and stored at 4°C.
4) Reservoir buffer for Native-PAGE (pH 8.3)
Iris buffer 3.0 gGlycine 14.4 gDissolved and made up to lL with DW.Prepared in 10X concentration and stored at 4°C.
5) Reservoir buffer for SDS-PAGE (pH 8.3)
Iris buffer 3.0 gGlycine 14.4 gSDS 1.0 gDissolved and made up to 1L with DW.Prepared in IOX concentration and stored at 4°C

Materials and Methods
6) Sample buffer for Native-PAGE
Tris·HCI (pH 6.8) 0.0625 MGlycerol (optional) 10% (v/v)Bromophenol blue 0.01 %Prepared in 2X concentrations and stored at 4
QC.
7) Sample buffer for Reductive SDS-PAGE
Tris·HCI (pH 6.8) 0.0625 MGlycerol (optional) 10% (v/v)SDS 2% (w/v)Dithiothreitol 0.1MBromophenol blue 0.01 %Prepared in 2X concentrations and stored at 4QC
8) Sample buffer for Non-reductive SDS-PAGE
Tris-HCI (pH 6.8) 0.0625 MGlycerol (optional) 10% (v/v)SDS 2% (w/v)Bromophenol blue 0.01 %Prepared in 2X concentrations and stored at 4QC
9) SDS (10%)
10) Sucrose (50%)
11) Protein staining solution
Coomassie brilliantblue (0.1%)Methano1(40%)Glacial acetic acid (10%)DW
1 gin 10 ml DW
5 gin 10 mI DW(autoclaved at 121QC for15 minutes and stored at 4
QC.)
100 mg
40 mI10 mJ50 m1

Chapter 3
12) Destaining solution
Methanol (40%)Glacial acetic acid (10%)DW
40ml10 ml50 ml
13) Protein markers for Native~PAGE
Separate markers from Sigma-Aldrich were used
Components Volume MW (Md
Bovine Serum Albumin 10 III 66,000
Chickalbumin 10 III 45,000
Carbonic anhydrase 5 III 29,000
Lactalbumine 10 III 14,200
Markers were prepared in Native IX sample buffer, and 30 III of
marker mix was loaded to the gel.
14) Protein Markers for SDS-PAGE
Low molecular weight marker mix of Amersham Pharmacia was
used. Lyophilized marker mix was reconstituted in IX sample buffer
for reductive SDS-PAGE, boiled for 5 minutes, and 5111 of marker
was loaded on to the gel The composition of the marker mix is as
given below.
Components
Phosphorylase b
Bovine Serum Albumin
Ovalbumin
Carbonic anhydrase
Trypsin inhibitor
a-Lactalbumin
MW (Mrl
97,000
66,000
45,000
29,000
20,100
14,400

Materials and Methods
3.4.1.2 Native polyacrylamide gel electrophoresis
3.4.1.2.1 Gel preparation
Resolving gel (10%)
Acrylamide: bis-acrylamide (30:0.8)Resolving gel buffer stockAmmonium persulphate (APS)WaterTEMED
Stacking Gel (2.5%)
Acrylamide: bis-acrylamide (30:0.8)Stacking gel buffer stockAmmonium persulphate (APS)WaterTEMED
Sample buffer (1X)
Native-PAGE sample buffer (2X)50% SucroseDW
Sample preparation
10.00 ml3.75 ml
a pinch16.25 ml15.00 Jll
2.5 ml5.0 ml
a pinch12.5 ml15.0 III
1.0 ml0.4 ml0.6 ml
Added 100 III of IX sample buffer to lyophilized sample, mixed
well and 25111 sample and 5 III marker mix was loaded to the gel.
Procedure
(a) Cleaned and assembled the gel plates.
(b) Resolving gel- Added all the components except APS in to
a beaker, mixed gently and finally added APS. hrunediately
poured the mixture into the cast and poured a layer of butanol
over the gel and allowed to polymerize at least for one hour.

CPlapl2i3 .
(c) Stacking gel - Added the components of stacking gel except
APS into a beaker, mixed gently and finally added APS. Poured
the contents into the cast above the resolving gel and
immediately inserted the comb between the glass plates. Allowed
to polymerize at least for I hour.
(d) Gel was placed in the electrophoresis apparatus, and upper
and lower reservoir was filled with reservoir buffer for Native-
PAGE.
(e) The gel was pre run for I hr at 80 V.
(f) Loaded the gel with the protein sample.
(g) The gel was run at 80V till the sample entered the resolving
gel.
(h) When the dye front entered the resolving gel, increased the
current to 1OOV.
(i) The run was stopped when the dye front reached I cm above
the lower end of the glass plate.
(j) Removed the gel from cast and stained for at least one hr in
the staining solution.
(k) Destained the gel till the bands became clear and observed
the protein bands under a transilluminator.
3.4.1.3 Sodium dodecyl sulphate polyacrylamide gel electrophoresis
(SDS-PAGE)
The purified inhibitor protein was subjected to reductive and non
reductive SDS-PAGE for evaluating the nature of polypeptide. Low

Materials andMethods
lIJOlecular weight marker of Amersham Pharmacia was used as standard and
JJlOlecular weight of protease inhibitor was determined using Quantity One
Software from Biorad.
3.4.1.3.1 Reductive SDS -PAGE
Gel preparation
Resolving gel (10%)
Stock Acrylamide solutionResolving gel buffer stock10% SDSAmmonium persulphate (APS)WaterTEMED
Stacking Gel (2.5%)
Stock Acrylamide solutionStacking gel buffer stock10% SDSAmmonium persulphate (APS)WaterTEMED
Sample buffer(lX)
SDS-PAGE sample buffer (2X)50% SucroseDW
10.00 ml3.75 ml0.3 ml
a pinch15.95 ml15.0 ,.d
2.5 ml5.0 ml0.2 ml
a pinch12.3 ml15.0 I-ll
1.0 ml0.4 ml0.6 ml
Sample preparation
Added 100 I-ll of IX sample buffer to pure lyophilized
sample, mixed well, boiled for 5 minutes in a water bath, cooled

Chapter 3
to room temperature, and 25 JlI sample and 5 ul low molecular
weight marker mix was loaded to the gel.
Procedure
Procedure followed for SDS polyacrylamide gel
electrophoresis was essentially the same as that of Native-PAGE
which was described under section 3.4.1.2 with the exception
that the reservoir buffer used was that ofSDS-PAGE.
3.4.1.3.2 Non-reductive SDS-PAGE
Gel preparation
Resolving and stacking gel was prepared as described under
section 3.4.1.3.1.
Sample buffer (IX)
Sample buffer for Non-reductiveSDS-PAGE (2X)50% SucroseDW
Sample preparation
1.0 ml
0.4 ml0.6 ml
Added 100 III of IX sample buffer to pure lyophilized
sample, mixed well, and 25 ul sample and Sul low molecular
weight marker mix was loaded to the gel.
Procedure
Procedure followed for SDS-pc·:yacrylamide gel
electrophoresis was essentially same the as that ofNative-PAGE

Materials and Methods
which was described under section 3.4.1.2 with the exception
that the reservoir buffer used was that of SDS-PAGE.
3.4.1.4 Analysis of protease inhibitor by Dot - Blot method
The purified fraction collected from ion exchange chromatography,
was analyzed for its protease inhibitory activity according to the method of
Veerappa et al., (2002) as described below.
I. 3~.d of protease inhibitor was mixed with 3111 trypsin (0.5mg/ml)
and spotted on to a strip of X-ray film.
Il. 3III of trypsin was mixed with 3III phosphate buffer O.lM (pH 7.0)
as the control and spotted on to the X-ray film.
Ill. Incubated the X-ray film at 37°C for 10 minutes.
IV. Washed the film under tap water till the zone of gelatin hydrolysis
by trypsin was visualized.
V. Where the inhibitor is present, the trypsin does not degrade the
gelatin on the x-ray film. If the inhibitor is absent, a clear zone is
formed at the site of sample application on the X-ray film.
3.4.1.5 Reverse zymography
Protease inhibitory activity of the purified protein was further
confirmed by Reverse Zymogram on Gelatin-PAGE, performed by adding
gelatin (0.1% final concentration) to the polyacrylamide prepared according
to the method of Felicioli et al. (1997).
Chapter 3
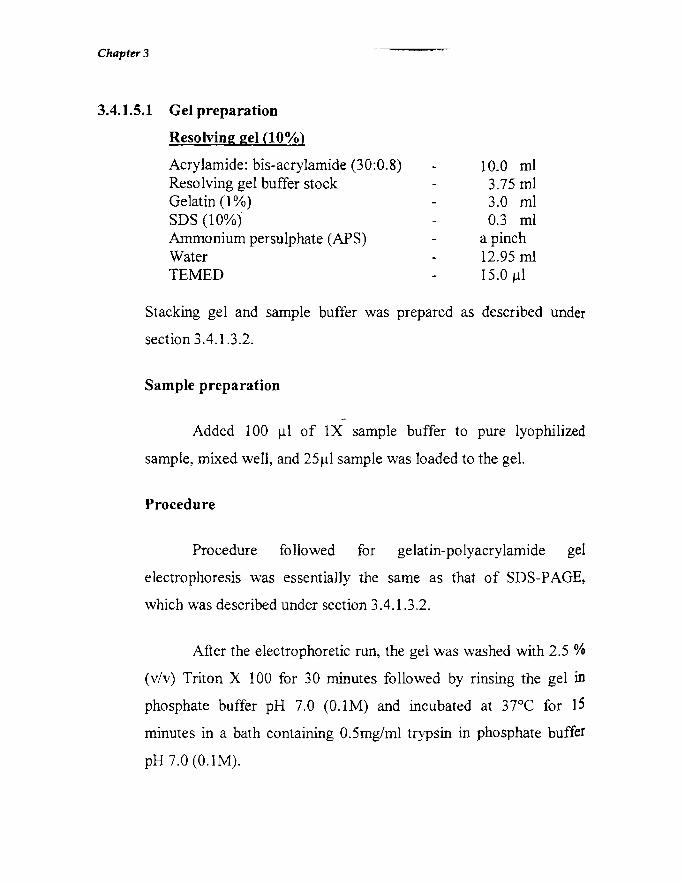
3.4.1.5.1 Gel preparation
Resolving gel (10%)
Acrylamide: bis-acrylamide (30:0.8)Resolving gel buffer stockGelatin (1%)SDS (10%)Ammonium persulphate (APS)WaterTEMED
10.0 ml3.75 ml3.0 ml0.3 ml
a pinch12.95 rnl15.0 ~l
Stacking gel and sample buffer was prepared as described under
section 3.4.1.3.2.
Sample preparation
Added 100 ul of IX sample buffer to pure lyophilized
sample, mixed well, and 25~1 sample was loaded to the gel.
Procedure
Procedure followed for gelatin-polyacrylamide gel
electrophoresis was essentially the same as that of SDS-PAGE,
which was described under section 3.4.1.3.2.
After the electrophoretic run, the gel was washed with 2.5 %
(v/v) Triton X 100 for 30 minutes followed by rinsing the gel in
phosphate buffer pH 7.0 (O.lM) and incubated at 37°C for 15
minutes in a bath containing 0.5mg/ml trypsin in phosphate buffer
pH 7.0 (O.IM).

Materials Q1tdMethods
After the gelatin hydrolysis, the gel was washed with
distilled water, stained with the Coomassie Brilliant Blue (Sigma
Aldrich) for 1 hr and destained.
3.4.2 Molecular weight determination of protease inhibitor by gel
filtration chromatography on Sephadex G75
Gel filtration chromatography was performed for the ammonium
sulphate precipitated fraction of crude protease inhibitor using Sephadex
075 (Sigma Aldrich) in order to determine the molecular weight ofprotease
inhibitor.
3.4.2.1 Preparation of column
a) 23g of Sephadex G75 (Sigma Aldrich) was suspended in distilled
water and allowed to hydrate for 3 hrs at 100DC in a water bath, and
fine particles were removed by decantation.
b) Hydrated gel suspension was degassed under vacuum to remove
the air bubbles.
c) Filled the column with distilled water or eluent without arr
bubble. Gel suspension was carefully poured into the column
(Amersham Pharmacia XK 26/70 column) without air bubbles and
allowed to settle under gravity while maintaining a slow flow rate
through the column.
d) Column was stabilized by allowing two times the bed volumes of
eluent (0.1 M phosphate buffer, pH 7.0) to pass through the column
bed in a descending eluent flow.

Chapter 3
e) The position of the flow adapters are re-adjusted as required to
maintain contact of the plungers with the gel bed.
3.4.2.2 Sample preparation and application
Two milliliter of dialyzed sample, prepared as described under
section 3.3.2, with a protein content of 18.6 mg/ml was applied to the
column. Care was taken to make sure that the sample was completely free of
undissolved substances. After the complete entry of sample to the column,
the proteins were eluted using 0.1M phosphate buffer pH 7.0, with a flow
rate of 1mllminute. One millilter fractions were collected and the protein
content was estimated by measuring the absorbance at 280nm in a UV
visible spectrophotometer (Shirnadzu, Japan). Peak fractions from the
column were pooled and assayed for protease inhibitory activity and protein
content as described under sections 3.1.3.1 and 3.1.3.3 respectively.
3.4.2.3 Calculation of molecular weight
The molecular weights of the eluted proteins were calculated by
calibrating the column with low molecular weight gel filtration protein
markers from Arnersham Pharmacia.
3.4.2.3.1 Column calibration
The gel filtration column prepared by Sephadex G 75 was calibrated
with low molecular weight gel filtration protein markers from Amersham
Pharmacia.
Materials and Methods
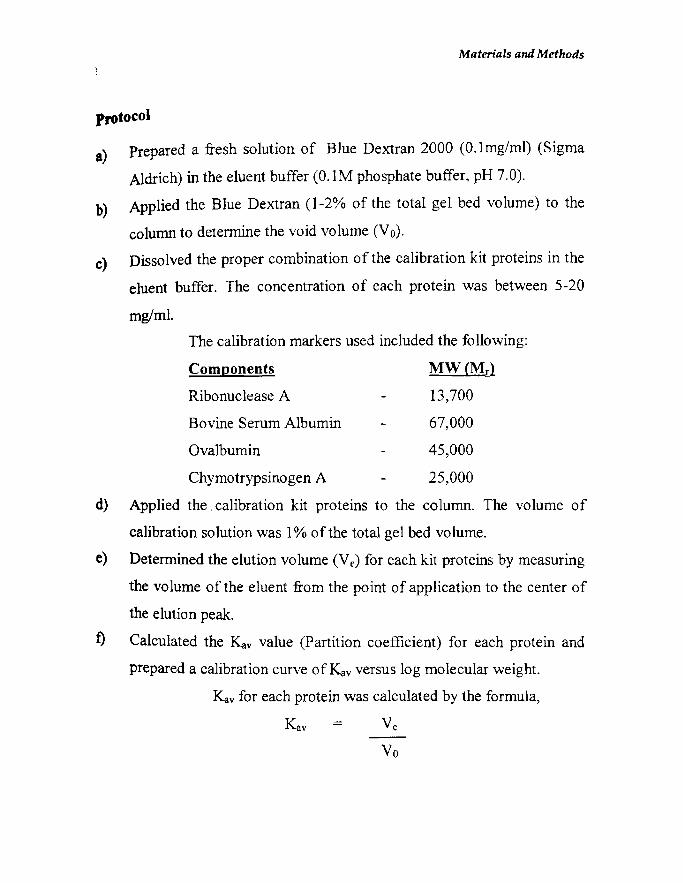
protocol
a) Prepared a fresh solution of Blue Dextran 2000 (0.1mg/ml) (Sigma
Aldrich) in the eluent buffer (0.1M phosphate buffer, pH 7.0).
b) Applied the Blue Dextran (1-2% of the total gel bed volume) to the
column to determine the void volume (Vo).
c) Dissolved the proper combination of the calibration kit proteins in the
eluent buffer. The concentration of each protein was between 5-20
mg/ml.
The calibration markers used included the following:
Components MW (Md
Ribonuclease A 13,700
Bovine Serum Albumin 67,000
Ovalbumin 45,000
Chymotrypsinogen A 25,000
d) Applied the, calibration kit proteins to the column. The volume of
calibration solution was 1% of the total gel bed volume.
e) Determined the elution volume (Ve) for each kit proteins by measuring
the volume of the eluent from the point of application to the center of
the elution peak.
t) Calculated the !<.ay value (Partition coefficient) for each protein and
prepared a calibration curve of Kay versus log molecular weight.
!<.ay for each protein was calculated by the formula,
Kav ;:= Ve
Vo

Chapter 3
where Ve is the elution volume of each protein and Vo is void
volume of the column, which was calculated by running the column
with Blue Dextran 2000.
Molecular weight of the protease inhibitor was calculated from the
calibration curve prepared using the calibration kit proteins.
3.4.3 Amino acid analysis
Amino acid analysis of the purified inhibitor protein sample was
done using Shimadzu High-Performance liquid chromatography (Le - 4A)
"Amino Acid Analysis System" (Arnmu et al., 2001) at Central Institute of
Fisheries Technology (CIFT), Kochi. -
3.4.4 Optimal pH for protease inhibitor activity
Optimum pH for the maximal activity of the protease inhibitor was
determined by performing protease inhibitor assay at different pH ranging
from 2.0-12.0 as described under section 3.1.3.1 with minor modifications.
The substrate 1% casein was prepared in the respective buffer for each pH.
The buffer systems used were, glycine-HCl Buffer (pH 2-3.5), citrate buffer
(pH 4-6), phosphate buffer (pH 6-8), Tris-HCl buffer (pH 8-9), carbonate
bicarbonate buffer (pH 9.5-10.5), boric acid/potassium chloride/ sodium
hydroxide (pH 11.0), disodium hydrogen phosphate/sodium hydroxide (pH
12.0). Protease inhibitory activity was calculated as described under section
3.1.3.1.

Materials a,1dMethods
3.4.5 Stability of protease inhibitor at different pH
The stability ofprotease inhibitor over a range ofpH was determined
by evaluating the inhibitor activity at pH 7.0, after incubating the purified
protease inhibitor in different buffers of pH ranging from 2.0-12.0 for 24
hrs, at 4°C. 1.2 ml of purified inhibitor was incubated with 10.8 ml 0 f
different buffer systems, which included, glycine-HCl buffer (pH 2-3.5),
citrate buffer (pH 4-6), phosphate buffer (pH 6-8), Tris-HCl buffer (pH 8-9),
carbonate-bicarbonate buffer (pH 9.5-10.5), boric acid/potassium chloride/
sodium hydroxide (pH 11.0) and disodium hydrogen phosphate/sodium
hydroxide (pH ] 2.0). After incubation, ] ml of sample was assayed for
protease inhibitory activity as described under section 3.1.3.1 and was
expressed as percent inhibition of protease activity.
3.4.6 Optimal temperature for protease inhibitor activity
Optimum temperature for the maximal activity of protease inhibitor
was determined by assaying the inhibitor activity at different temperatures
ranging from lOoe-80°C. The assay method followed was essentially the
same as that described under section 3.1.3.1.
3.4.7 Stability of protease inhibitor at different temperatures
Temperature stability of purified inhibitor at different temperatures
was evaluated by incubating 1.2 ml of purified protease inhibitor at different
temperatures ranging from 30QC-70QC. The sample was drawn at different
time intervals: 30 minutes, lhr, 2hrs, 4hrs, 8hrs and 12hrs, and was further
lI1cubated at 4QC for 15 minutes. The protease inhibitory activity of each

Chapter 3
sample was assessed by conducting the assay as described under section
3.1.3.1.
3.4.8 Effect of stabilizers on thermal stability of protease inhibitor
Effect of stabilizers on protease inhibitor against thermo inactivation
was determined at 500 and 60°C, respectively, at which they were found to
loose activity. The effect of various additives on the thermal stability was
determined by incubating the inhibitor in the presence of an additive at the
desired temperature for a stipulated period of time. Sample was drawn at
different time intervals of 1hr, 2hrs, 4hrs and 8 hrs. At the end of incubation,
the inhibitor was further incubated on ice for 15 min and the residual
activity was determined. Stabilizers added included glycine (1M), cysteine
hydrochloride (l0lTh.\1), PEG 8000 (lOrnM), glycerol (lO%), sorbitol (10%),
casein (1%), CaCh (lOmM), urea (lOrnM), sucrose, BSA and starch (at 1%
level). Protease inhibitor assay was carried out as described under section
3.1.3.1.
3.4.9 Effect of various metal ions on protease inhibitor activity
Effect of various metal ions on activity of protease inhibitor was
evaluated by incubating the protease inhibitor along with different
concentrations of various metals ions in the inhibitor solution for 30 minutes
followed by measuring the protease inhibitory activity as described under
section 3.1.3.2. The metals studied included sodium chloride, calcium
chloride, magnesium sulphate, cupric sulphate, sodium molybdate, zinc
sulphate, ferric chloride, manganese chloride, nickel chloride, mercury
chloride, barium chloride, cadmium sulphate, and aluminum sulphate which

Materials and Methods
. he metal i N + 2+ 2+ 2+ C 2+ F 3+ Mn2+ N' 2+contnbutes t e meta IOns, a, Ca , Mg , Zn , u , e, ,I,
Hg:2+. Ba2+, Cd2+, M06+ and At3+ each at 1 and 10 mM final concentrations
respectively.
3.4.10 Metal chelation of protease inhibitor using EDTA
The metal ion concentration of purified protease inhibitor and its
effect on inhibitory properties in its native state was determined by metal
chelation using 30mM EDTA (SRL, India) according to the method
described by Jack et al. (2004). Purified protease inhibitor (2.7mg/ml) was
dialyzed extensively against 30m.\1 EDTA for over night at 4°C for
chelation of metal ions. The EDTA was removed further by dialyzing over
night with frequent changes of deionised water. The inhibitory activity of
the demetallized protease inhibitor was determined by conducting protease
inhibitor assay as described in section 3.1.3.2.
3.4.11 Metal ion concentration of protease inhibitor
Metal ion (Ca2+, Mg2+ and Zn2+) concentrations of the protease
inhibitor was determined as follows:
1. An aliquot of protease inhibitor was dialyzed extensively against
distilled water and was used for mineral analysis by Inductively
Coupled Plasma Atomic Emission Spectroscopy (ICP-AES).
1I. Another aliquot of protease inhibitor (2.7mg/ml) was dialyzed
extensively against deionised water and was used for mineral
analysis by ICP-AES.
Ill. A third aliquot was dialyzed extensively against 30JTh\1 EDTA for
over night at 4°C for chelation of metal ions and then the EDTA
was removed by dialyzing against deionised water over night with
frequent changes in deionised water. The mineral concentration of
dialyzed sample was also determined by ICP-AES.
3.4.12 Effect of additional supplementation of Zn 2+, Ca 2+ & Mg2
+ to
demetallized protease inhibitor
Impact of additional supplementation of different concentrations of
metals to the demetallized protease inhibitor, in order to contribute Zn2+,
Ca2+ & Mg2
+ metal ions towards regaining its inhibitory property was
evaluated. One and 10mM final concentrations of calcium chloride,
magnesium sulphate and zinc sulphate was incubated along with protease
inhibitor for 30 minutes, followed by measuring the residual protease
inhibitory activity as described under section 3.1.3.2.
3.4.13 Effect of various detergents on protease inhibitory activity
Effect of various non-ionic and ionic detergents such as Triton X
100, SDS, Tween-80, Tween-20, and Brij-35 (l % each w/v) on protease
inhibitory activity was determined by incubating the protease inhibitor in
each detergents for 30 minutes, dialyzed against O.OlM phosphate buffer pH
7.0 and estimated the residual inhibitory activity as described under section
3.1.3.2.
Matenals aiUl Metho'ils
>~4.14 Effect of oxidizing agents on protease inhibitory activity
Impact of oxidizing agents on the activity of protease inhibitor was
studied by incubating the protease inhibitor with 1, 2, 3, 4 & 5 % (v/v) of
hydrogen peroxide and dimethyl sulfoxide for 30 minutes and measuring the
residual inhibitory activity as described under section 3.1.3.2.
3.4.15 Effect of reducing agents
The effect of reducing agents on the activity of protease inhibitor
was studied by incubating the protease inhibitor with 0.2, 004, 0.6, 0.8 and
1% (v/v) of dithiothretol, p-mercaptoethanol and sodium thioglycolate for
30 minutes and measuring the residual inhibitory activity as described under
section 3.1.3.2.
3.4.16 Chemical modifications of amino acids in protease inhibitor
To determine the impact of chemical structure of the amino acids at
the reactive sites of inhibitor molecule on its inhibitory activity, selected
amino acids of the inhibitor molecules were chemically modified. Thus five
different amino acids were individually modified using specific chemical
modifiers and the effect of modifiers on the anti proteolytic activity of the
inhibitor molecule was determined. Chemical modifications of amino acids
of purified inhibitor was carried out using different chemical modifiers
under their respective reaction conditions. 2 ml of purified inhibitor
(2.7mg/ml) was used for this study. After the incubation with different
Concentrations ranging from 5, 10, 15, 20 and 25 mM of each modifier, the

Chapter 3
sample was dialyzed against phosphate buffer and the residual protease
inhibitory activity was estimated as described under section 3.1.3.2.
Chemical modifier Amino acid Reaction conditionsModified
N-Ethylmaleimide Cysteine 30 DC O.lM Tris/HCl buffer
(pH-7.0) for 60 min
(Colman & Chu, 1970)
Succinic anhydride Lysine 30DC 0.] M Sodium carbonate
buffer (pl1-8.0) for 120
min (Habeeb etal., 1958)
Diethyl pyrocarbonate Histidine 30°C 0.] M TrislHCI buffer
(pH-7.0) for 30 min
(Ovaldi et al., 1967)
PMSF Serine 25DC O.05M Tris/HCl buffer
(pH-7.8) for 120 min
(Gold & Farney, 1964)
N- Bromosuccinamide Tryptophan 30 DC 0.01 M TrislHCI buffer
(pH-7.0) for 30 min
(Spande & Witkop, 1967)
3.4.17 Effect of acid treatment on protease inhibitor
Sensitivity of protease inhibitor in an acidic environment was
evaluated by incubating purified protease inhibitor with different
r Materials and Methods
concentrations of HCI ranging from 0.02, 0.04, 0.06, 0.08 & IM (pH 2.0)
for 30 minutes. After the incubation, the pH was neutralized with 1 m1 of
O.lM Tris-HCl buffer pH 9.0. The residual protease inhibitory activity was
estimated as described under section 3.1.3.2.
3.4.18 Effect of protease treatment on protease inhibitor
Sensitivity of protease inhibitor to gastric enzymes like trypsin was
assessed by incubating the purified protease inhibitor with different
concentrations of trypsin (from Bovine pancreas, SRL, India) ranging from
0.2, 0.4, 0.6, 0.8 and 1% for 30 minutes at 37°C. The residual protease
inhibitoryactivity was estimated as described under section 3.1.3.2.
3.4.19 Stoichiometry of protease-protease inhibitor interaction
The molar concentration of the purified protease inhibitor for the
complete inactivation of the trypsin was determined by preincubating I nM
trypsin (based on Mr23,800) in 100/-11 ofO.1M phosphate buffer pH 7.0 with
different amounts of chromatographically purified protease inhibitor (0.25
2.0 nM, based on M, 23,600) at 37°C for 60 minutes. The long incubation
time was necessary to ensure that the reaction was complete. The remaining
activity of the trypsin was determined by the addition of I% casein,
followed by incubation and spectroscopic examination according to Kunitz
method as described under section 3.1.3.1.
Chapter 3
3.4.20 ICsovalue of protease inhibition
The amount of protease inhibitor needed for 50% inhibition of
protease activity was determined by conducting the assay as described under
section 3.1.3.1.
3.4.21 Kinetic studies of inhibition of trypsin by protease inhibitor
Using the enzyme rate data a double reciprocal-plot was prepared
and analyzed to determine whether the nature of protease inhibition is
competitive, uncompetitive or non competitive. Protease inhibition kinetics
was studied using various concentrations of substrate ranging from
O.OOlmM - 2.0mM. The assay was.carried out (Erlanger et aI., 1961), as
detailed below:
a) 500111 of one nM trypsin was preincubated in 0.1M phosphate buffer
alone for 20 minutes at 37°C.
b) 500111 of different concentrations of purified protease inhibitor
(4, 6 & 8 nlvl) was preincubated with 100111 of one nM trypsin for 20
minutes at 37°C.
c) The pre-incubated mixtures were then added separately to the
substrate solution 0.001mM-2.0 mlvl Nc-Benzoyal-Arginine-l
nitroanilide (BAPNA) (Sigma Aldrich) at 3re for 10 minutes.
d) The reaction was arrested by adding 200/1] of30% (v/v) acetic acid.
e) The liberated p-nitro aniline was measured at 410 nm in a DV
visible spectrophotometer (Schimadzu, Japan).
f) One protease unit was defmed as the amount of enzyme that
increased absorbance by 1 Ofr/min and one protease inhibitory unit
is defmed as the amount of protease inhibitor that inhibited one unit
of protease activity and was expressed as percent inhibition as
described under section 3.1.3.1.
The velocity of the enzymatic reaction (v) based on the rate of
change in absorbance (A4IO) of the reaction mixture was determined for each
concentrations ofBAPNA used.
The initial velocity data was plotted as the function of the
concentration of substrate by the linear transformation of the Michaelis
Menten Equation and usual non-linear curve fitting of the Michaelis-Menten
equation for the calculation of Km and Vmax of the reaction.
A Lineweaver-Burk curve, l/v versus 1/[s] was plotted and the
dissociation constant (KD and maximum Velocity (Vmax) were calculated
(Dixon, 1953).
3.5 APPLICA'"(ION STUDIES
3.5.1 Specificity with different pharmaceutically important proteases
The affmity of purified inhibitor with different classes of proteases
having roles in much pharmaceutical and agricultural industry was tested.
The proteases tested were, Cathepsin-B (Sigma Aldrich), Thrombin (Sigma
Aldrich), Elastase (Sigma Aldrich), Chymotrypsin (Sigma Aldrich),
Collagenase (Sigma Aldrich) and Papain (Sisco Research Laboratories Pvt.
Ltd, India).
Chapfer3
3.5.1.1 Assay of Cathepsin-B inhibitory activity
Cathespin-B inhibitory activity was assayed using a solution
containing 1.25-2.5 units/ml of Cathepsin B (Sigma Aldrich) in cold
deionised water described by Barrett (l981a). 25Jll of Cathepsin B Was
preincubated with 25JlI of purified inhibitor solution (0.27mg/ml) at 300efor 10 minutes. After the incubation, added 200 III of 20 mM N-Succinyl
Ala-Ala-Pro-Phe-P-Nitroanilide in dimethyl sulphoxide and incubated at
30°C for 5 minutes. One unit of enzyme will release one micromole of
p-nitro aniline per minute from N-Succinyl-Ala-Ala-Pro-Phe-P-Nitroanilide
at pH 7.0 at 30DC and one cathepsin inhibitory unit is defined as the amount
of protease inhibitor that inhibited one unit of cathepsin activity and was
expressed in percent inhibition as described under section 3.1.3.1.
3.5.1.2 Assay of thrombin inhibitory activity
The thrombin inhibitory activity of protease inhibitor was evaluated.
Prepared a stock solution containing 1mg/ml thrombin (Sigma Aldrich) in
O.lM Tris-HCl buffer pH 7.5, and 100 JlI of 1oug/ml solution was
preincubated with 1001-11 of purified inhibitor solution (0.27mg/ml) at 37°C
for 10 minutes. Added 200Jll of 1% casein to the mixture and incubated at
37°C for 30 minutes. The thrombin inhibitory activity of purified protease
inhibitor was measured as described under section 3.1.3.1.
3.5.1.3 Assay of elastase inhibitory activity
The elastase inhibitory activity was tested with l Oug/ml elastase
(Sigrna Aldrich) solution with O.27mg/ml purified protease inhibitor
according to Kunitz caseinolytic (Kunitz, 1947) method as described under
section 3.1.3.1.
3.5.1.4 Assay of collagenase inhibitory activity
The collagenase inhibitory activity of purified protease inhibitor was
checked by using I% gelatin as substrate according to lan (2001). lmg/ml
collagenase (Sigma Aldrich) was prepared in cold deionised water prior to
assay. Preincubated one millilitre of collagenase with 0.27mg/ml purified
inhibitor at 37°C for 10 minutes. Added 2ml of 1% gelatin to the reaction
mixture and further incubated for 30 minutes at 37°C. The reaction was
terminated using 0.44M TCA and the released amount of peptides were
measured as described under section 3.1.3.1.
3.5.1.5 Assay of papain inhibitory activity
Papain inhibitory activity was evaluated by Caseinolytic method
according to Murachi (1970). Prepared 6mg/ml solution papain, and
preincubated 0.1 ml 0 f papain with 0.1 ml purified inhibitor solution at 37°C
for 10 minutes. After incubation, 0.5 m1 of casein solution (1%) was added
to the solution and the reaction mixture was incubated for 10 minutes at
37°C.The reaction was interrupted by adding 1.5 milliliter of trichloroacetic
acid (5%) (w/v). The precipitate was removed by centrifugation at 10,000
rpm for 15 minutes and the released amount of tyrosine was estimated as
described under section 3.1.3.1.
Chapter 3
3.5.1.6 Assay of chymotrypsin inhibitory activity
Chymotrypsin inhibitory activity was assayed according to the
modified method of Fritz et al (1966). Chymotrypsin from Bovine pancreas
(Sigma Aldrich) was prepared by dissolving freeze dried material in O.OOIM
HCl at a concentration of Img/rnl. Standard assay mixture contained 0.05 M
Tris-HCI buffer, pH 7.6, 20mM peptide substrate, N-Suc-Ala-Ala-Pro-Phe_
p-nitroanilide, 0.27 mg/ml inhibitor solution and chymotrypsin (lO!lg/ml).
One unit of enzyme is defined as the amount of enzyme that induces the
conversion of I umol substrate/min. One chymotrypsin inhibitory unit is
defmed as the amount of protease inhibitor that inhibited one unit of
chymotrypsin activity and was expressed in percent inhibition as described
under section 3.1.3.1.
3.5.2 Activity spectrum of purified protease inhibitor towards
commercially important proteases
The activity spectrum of purified protease inhibitor with different
commercially available proteases from different sources were tested. All the
enzymes were purchased from Sigma Aldrich. One rnilliliter of proper
dilutions of each enzyme was incubated with one milliliter of protease
inhibitor (0.27mglml) to check the affmity of the inhibitor with the
proteases and the assay for protease inhibition was carried out as described
under section 3.1.3.1.
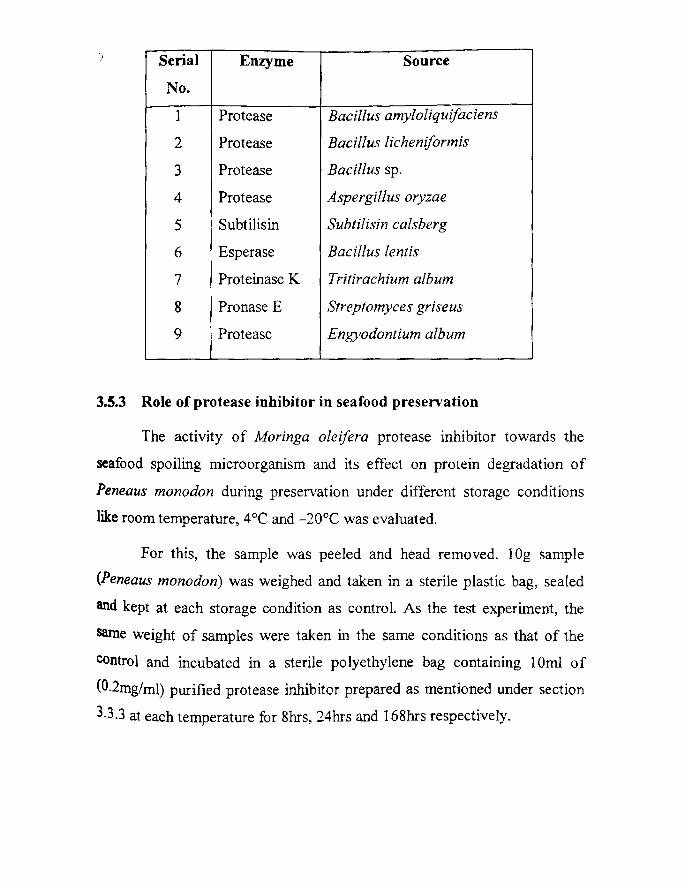
Serial Enzyme Source
No.
1 Protease Bacillus amyloliquifaciens
2 Protease Bacillus licheniformis
3 Protease Bacillus sp.
4 Protease Aspergillus oryzae
5 Subtilisin Subtilisin calsberg
6 Esperase Bacillus lentis
7 Proteinase K Tritirachium album
8 Pronase E Streptomyces griseus
9 Protease Engyodontium album
3.5.3 Role of protease inhibitor in seafood preservation
The activity of Moringa oleifera protease inhibitor towards the
seafood spoiling microorganism and its effect on protein degradation of
Peneaus rnonodon during preservation under different storage conditions
like room temperature, 4°C and -20°C was evaluated.
For this, the sample was peeled and head removed. 109 sample
(Peneaus monodon) was weighed and taken in a sterile plastic bag, sealed
and kept at each storage condition as control. As the test experiment, the
same weight of samples were taken in the same conditions as that of the
COntrol and incubated in a sterile polyethylene bag containing 10ml of
(O.2mg/ml) purified protease inhibitor prepared as mentioned under section
3.3.3 at each temperature for 8hrs, 24hrs and 168hrs respectively.
After incubation, the sample was drawn and extract was prepared by
homogenizing the samples in sterile distilled water using a mortar and pestle
under sterile conditions and kept in a rotary shaker for 30 minutes at
l50rpm. One milliliter of extract was taken under sterile condition, and
serially diluted the sample in physiological saline and the total microbial
population of each sample was analyzed by pour plating the samples on
Casein agar plates prepared by incorporating 1% casein in Nutrient agar
medium.
The complete protein of the samples were extracted using 5% NaCl
in 0.02M sodium bicarbonate according to Chandrasekaran (1985) and the
cell pellet were removed by centrifugation at 10,000 rpm for 15 minutes at
4cc. The clear supernatant was assayed for total protein content as
described in section 3.1.3.3.