Materials and Metho,dsshodhganga.inflibnet.ac.in/bitstream/10603/3501/8/08_chapter 2.pdf ·...
14
Materials and Metho,ds The materials used and the experimental methods adopted in the present work are given in this chapter. 2.1 Materials used a) Polypropylene homopolymer (PP) REPOL H200MH, Melt Flow Index of 20g/10 min, was supplied by Reliance Industries Ltd., Mumbai, India. b) Polystyrene (PS) PS grade LOO 104, Melt Flow Index of 18g/min, was supplied by LG Plastics. c) Sodium Silicate Solution of Sodium silicate (60%) obtained from MlS Minnar Chemicals,Kochi was used. d) Hydrochloric acid AR Hydrochloric acid manufactured by M/S Loba chemicals with an acidimetric assay of 35-38% was used. e) Ammonia AR grade ammonia manufactured by M/S Spectrum chemicals, Kochi with an assay of about 25% ammonia and specific gravity of 0.91 was used.
-
Upload
nguyendien -
Category
Documents
-
view
219 -
download
3
Transcript of Materials and Metho,dsshodhganga.inflibnet.ac.in/bitstream/10603/3501/8/08_chapter 2.pdf ·...

cR~ Materials and Metho,ds
The materials used and the experimental methods
adopted in the present work are given in this chapter.
2.1 Materials used
a) Polypropylene homopolymer (PP)
REPOL H200MH, Melt Flow Index of 20g/10 min, was supplied by
Reliance Industries Ltd., Mumbai, India.
b) Polystyrene (PS)
PS grade LOO 104, Melt Flow Index of 18g/min, was supplied by LG
Plastics.
c) Sodium Silicate
Solution of Sodium silicate (60%) obtained from MlS Minnar
Chemicals,Kochi was used.
d) Hydrochloric acid
AR Hydrochloric acid manufactured by M/S Loba chemicals with an
acidimetric assay of 35-38% was used.
e) Ammonia
AR grade ammonia manufactured by M/S Spectrum chemicals, Kochi
with an assay of about 25% ammonia and specific gravity of 0.91 was used.
t) Poly Vinyl Alcohol
Poly Vinyl Alcohol manufactured by M/S Polex Laboratories was used.
g) Vinyl triethoxy silane (98%) was supplied by Lancaster east gate,
England was used.
2.2 Preparation of nanocomposites
Traditional routes to prepare nanocomposites are
• In-Situ polymerization
• Solution casting
• Melt mixing
In this study melt mixing method was used, because it has the
following advantages.
• An environmentally benign one
• All types of polymers can be used
• Compatible with practicing polymer processing operations
• Most popular method for industrial applications
2.2.1 Melt mixing
A Thermo Haake Rheometer (Rheocord 600p) was used for melt
compounding [1-3]. Torque rheometers are well suited for formulating
various polymer systems and studying the flow behaviour, thermal
sensitivity, shear sensitivity and batch compounding. The mixing chamber
has a volumetric capacity of 69cm3 and was fitted with roller type rotors for
mixing. The rotors rotate in opposite directions in order to effect a shearing
action on the material mostly by shearing the material against the walls of the
58

;MaterialS and ;Method's
mixing chamber. The rotors have chevrons which perform additional mixing
by churning the material and moving it back and forth through the mixing
chamber. The granules in the desired proportion are fed to the mixing
chamber through a vertical chute with a ram. There is a small clearance
between the rotors which rotate at different speeds at the chamber wall. In
these clearances dispersive mixing takes place. The shape and motion of
rotors ensure that all particles undergo high intensive shearing tlow in the
clearances.
The mixer consists of three sections and each section is heated
and controlled by its own heater and temperature controller. It is designed to
maintain accurate and uniform temperature profiles throughout the mixer.
Since mechanical dissipation heat is developed in the small gap between
rotors and chamber, the heat conducts to the centre bowl and raises the set
temperature. In this case, the heater and the centre bowl is automatically shut
off and circulation of cooling air is activated.
To make a composite material the pure material is ted into the mixing
chamber first and mixing is done with a constant rotor speed for 3min. Then
the weighed silica particles are ted into the chamber and the mixing is
continued for another 5min.The temperature selected depends on the
material. In all cases the torque stabilized to constant value in the selected
'!1 ixing conditions. The rpm and temperature arc automatically controlled at
the set values and the torque and energy required for blending are recorded as
a function of time.
59
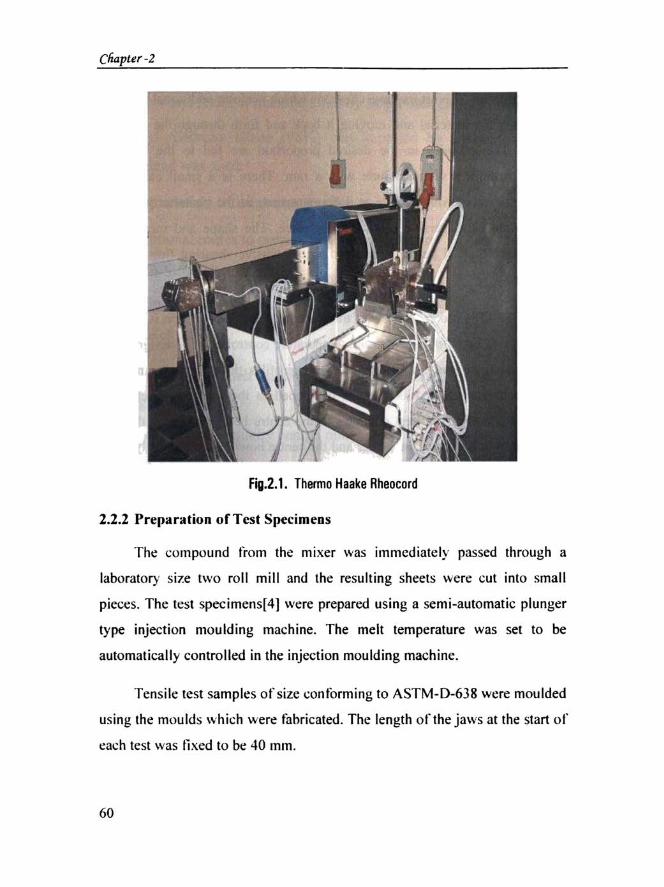
Cfiapter -Z
Fig.2.1. Thermo Haake Rheocord
2.2.2 Prepantion of Test SpecimeDs
The compound from the mixer was immediately passed through a
laboratory size two roll mill and the resulting sheets were cut into small
pieces. The test specimens[4] were prepared using a semi-automatic plunger
type injection moulding machine. The melt temperature was set to be
automatica lly controlled in the injection moulding machine.
Tensile test samples of size conforming to ASTM-D-638 were moulded
using the moulds which were fabricated. The length orthe jaws at the start of
each test was fixed to be 40 mm.
60

Specimens were moulded at identical conditions and the properties
were taken as the average property of six test samples. The temperatures were
set according to the melt temperatures of the material and the injection
pressure and holding time were adjusted to get the best properties.
~
n )
j \.. h~ )
Fia.2.2 Mould for preparing tensile test samples
2.3 Determination of mechanical properties
2.3.1 Tensile properties
c I
c:
Mechanical properties of the injection moulded samples of both pp
silica and PS-Silica nanocomposites were studied using a Universal Testing
Machine (UTM, Shimadzu, model AG-I) with a load cell of IOkN capacity.
The specimens used were dumb-bell shaped. The gauge length between the
jaws at the start of each test was adjusted to 40mm and the measurements
were ,carried out at a crosshead speed of 5 OmmJrnin. A verage of at least six
sample measurements were taken to represent each data point.
2.3.2 Flexural properties
The flexural properties of the nanocomposites were measured by a
three point loading system using universal testing machine as per ASTM-D-
790. Rectangular shaped specimens were used for the flcxural test and testing
was done at a crosshead speed of 5 mm/min.
1':1

'CliaptEr -2
The flexural strength is detennined using the relation
S ~ 3PLl2bd'
where S is the flexural strength, P is the maximum load at the moment of
break, b~ width of the specimen, L~ length of the span and d = thickness of
the specimen. The flexural modulus is calculated from the slope of the initial
portion of the stress-strain curve(5].
rIQ.2.3 Universal Testing Machine
!Materia!r all£:Metlioas
2.3.3 Impact strength
The impact properties of polymeric materials are directly related to the
overall toughness of the material. Toughness is detined as the ability of the
polymer to absorb applied energy. The area under the stress strain curve is
directly proportional to the toughness of the material. Impact strength is a
measure of toughness. The higher the impact strength of the material, the
higher the toughness and vice versa. Impact resistance is the ability of the
material to resist breaking under a shock loading or the ability to resist
fracture under stress applied at high speed.
Several methods are used to measure the impact resistance of plastics
lzod. charpy, Gardner, tensile impact. and many others. The lzod impact
strength is the most common test for impact strength measurement.
The Izod impact strength of the injection moulded samples was
determined as per ASTM-D-256 The samples were rectangular strips of
dimensions 12x IOx3 mm. The dimensions of an impact specimen are shown
in the fig.2.4.
r I.
1 Fig.2.4 Impact test specimen
63

Clio.pter-2
The izod impact strength of cast specimens was detennined usmg
impact testing machine model RESIL IMPACTOR. The striking velocity and
capacity of the hammer was 3.46m1s and 1.037J respectively. It is shown in
the fig.2.S.
Fig.2.5 Impact testing machine
A pendulum swings on its track and strike the sample. The energy lost
as the pendulum continues on its path was measured from the distance of its
follow through. The impact energy and striking load was directly read from
the tester.
Impact strength "" Impact cncrgy(J) I Thickncss{m)
64
~aterials aruf~etfiodS
2.4 Dynamic Mechanical Analysis
Dynamic Mechanical Analysis involves the detennination of dynamic
mechanical properties of polymers and their assemblies. In order to determine
the dynamical properties such as dynamic modulus E' and the loss modulus
E" and the damping or internal friction tan 0 = E"I E'. The response of the
material to periodic forces is measured [6]. Generally the dynamic
measurements are carried out over a frequency range at a constant
temperature or over a temperature range at constant frequency. The
commonly used temperature range for DMA of polymeric materials is from
10-2 to 1 06 Hz[7].
Dynamic Mechanical Analyzer (DMA Q-800, TA instruments) was used
to study the effect of silica nanoparticles on the viscoelastic properties of both pp
and PS. Rectangular shaped specimens of dimension3Smmx4mrnx2mm were
used. DMA tests were conducted at a constant frequency of IHz.A temperature
ramp was run from 30°C to 120°C at 2.SoC/min to get an overview of the thermo
mechanical behaviour of the samples. At each temperature the material was
deformed at constant amplitude of lOIJ.l11 over a frequency of 1 Hz. The dynamic
storage modulus, loss modulus and tan 0 (loss modulus/storage modulus) were
measured.
2.5 Thermo Gravimetric Analysis (TGA)
Thermogravimetric analysis is a technique by which the mass of the
sample is monitored as a function of temperature or time, while the substance
is subjected to a controlled temperature programme[7].
Thermal stability of the polymer-Silica composites were analyzed using
TGA Q-SO of TA instruments. Approximately Smg of the samples were
heated at a rate of 20°C/min from ambient temperature to 800°C. The
chamber was continuously swept with N2 at a rate of90 mllmin.
2.6 Water absorption characteristics
I
Water absorption characteristics of plastics depend largely up on the
basic type and functional composition of a material. These characteristics can
be altered by the addition of additives such as fillers, glass, fibers and
plasticizers. The specimens (-25mm x 25mm) were conditioned in an oven
for 24 hr at 50°C and weighed, and then the long term immersion procedure
outlined in ASTM D 1895 was followed. The specimens were immersed in
water and the wet weight was determined at specified intervals until it
become saturated. The percentage water absorption was calculated with the
following equation
0/ W ak Final weight -Initial weight 100 /0 ater upt e= x
Initial weight
The results reported are average of six measurements.
2.7 Differential Scanning Colorimetry
Differential scanning colorimetry is a technique in which the difference
in energy inputs into a substance and a reference material is measured as a
function of temperature whilst the substance and the reference material are
subjected to controlled temperature program.
It is one of the most widely accepted techniques of thermal analysis for
studying the crystallization characteristics of polymers and their
composites[8-1 0]. The materials, as they undergo changes in chemical and
physical properties, which are detected by transducers, which the changes
66

:MateriaCr and :MetliodS
into electrical signals that are collected and analyzed to !,J]ve therrnograms. In
DSC, the crystallization characterizations are studied from the heat flows
associated with the corresponding transitions as a function of temperature.
2.8 Melt Rheology
Meltjlow measurements using Haake Rheocord
The rheological measurements were measured using Haake rheocord
since it represents the real processing equipment. This is widely used in
characterizing the polymer flow behaviour by measuring viscosity related
torque caused by the resistance of the material to the shearing action of the
plasticizing process.
The Rheomix mixer was calibrated to obtain flow curves from the
torque C and rotor speed values N by using the calculation method of Blyler
and Daane [11 ].Goodrich and Porter [12] succeeded in converting the torque
rheometer data into fundamental rheological units for materials that exhibit
Newtonian behaviour. Based on this Blyler and Daane developed the I
following equation for Non-Newtonian mateials,
M=C(n) KSn
where M is the torque, K and n are famous parameters of the Power law
equation, S is the rpm and C(n) is a characteristic constant which is
determinable but depends on other constants.
't"= Kyn
where K is a parameter which depends on temperature and is given by,
K = Ko e -tlE/RT
~E is the activation energy. R is the gas constant and Ko is a constant.

Bousmina et al.[ 13] who assume that the flow in the Rheomix device is
the same in a double Couette system. It leads to the following equations:
y = 0.45N and 't =7500.C
where 't is the shear rate (S-I), N the rotation speed (rpm), 1. the shear stress
(Pa), C the torque (N.m).
Lee and Purdon in their work derived an equation identical to that
derived by Blyler and Daane. They predicted that constant C(n) was related
to two experimental constants and can be detennined experimentally[14].
The relation between rheocord torque and rotor speed were separately related
to the shear stress and shear strain of the polymer melt in the rheocord. Thus
these data can be used for both Newtonian and Non-Newtonian materials as
per the following procedure.
68
a) A plot of log M Vs log S at constant temperature is made for a
polymer melt using the measurements from Haake. This is identical to
the plot of log 't vs log 'Y .Consequently the power law index is
obtained from the slope.
b) The Haake Rheocord can be calibrated using melts of known K and n
to detennine C(n) and can be used to characterize a polymer.
c) The energy required to plasticize a polymer for a given time can also
be detennined from the area under the torque-time curve at a preset
temperature for the specified period of time as per the following
relation,
ps
where W is the energy, n is the number of revolutions of the rotor per minute,
tl and h are the initial and final time respectively and M is the torque in Nm.
2.9 Morphological studies- Scanning Electron Microscopy
Scanning electron microscope (JEOL JSM 840 A) was used to
investigate the morphology of the fractured surfaces [15].ln this technique, an
electron beam is scanned across the specimen resulting in back scattering of
electrons of high energy, secondary electrons of low energy and X-rays.
These signals are monitored by detectors (photo multiplier tube) and
magnified. An image of the investigated microscopic region of the specimen
is thus observed in a cathode ray tube and photographed using black and
white film. The SEM observations reported in the present study were made
on the fracture surfaces of the tensile specimens. Thin specimens were
prepared and mounted on a metallic stub with the help of a silver tape and
conducting paint in the upright position, the stub with the sample was placed
in an E-IO I ion-sputtering unit for gold coating of the sample to make it
conducting. The gold-coated sample was used for SEM analyses.
References
[IJ Bauer F, Decker U, Ernst H, Findeisn M, Langguth H, Mehnert R, Sauerland V,Hinterwaldner R., International Journal of adhesion and adhesives, 2006,26 ,7,567.
[2] Wei S, Shiyi G, Changshui F, Dong X, Quan R. J Mater Sci 1999,34, 5995.
[3] R.A. Vaia,H. Ishii, and E.P. Gianellis,Chem. Mater.,5,1993,1694-1696.
[4] Vishu H. Shah, Handbook of Plastic testing Technology, John Wiley & Sons, New York, 1984.
[5] Gottfried W. Ehrentein, Polymeric Materials - Structure-PropertiesApplications, Hanser Publishers, Munich.
c..;napr;er-~
[6] Takayuki Murayama, Dynamic Mechanical Analysis of Polymeric Materials, Elselviour Publishing company, Amsterdam, 1978.
[7] McNeil C. In: Allen G, editor. Comprehensive polymer science, vo1.5 New York: Pergamon Press 1989: chapter 15.
[8] Busigin C, Lahtinern R, Thomas G, Woodharms R.T, Polym Eng Sci ,1984,24: 169.
[9] Zhu W.P.; Zhang, G.P.;Yu, J. y';Dai, G.J Appl Polym Sci 2004, 91,431.
[10] Labour, T.; Vigier, G.; Segeula, R.;Gauthier, C.; Orange, O.;Bomal, Y.J Polym Sci Part B : Polym Phys 2002, 40, 31.
[11] Blyler L.L., Daane J. H., Poly Eng Sci.,1967,7,178.
[12] Goodrich J.B., Porter R.S., Poly Eng Sci.,1967, 7,45.
[13] M. Bousmina, A. Ait-Kadi, J.B. Faisant, J. Rheol., 1999,43,415 - 433
[14] O.C.N.Lee and J.R. Purdon, Polym Eng & Sci, 1969,9,360.
[15] Arthur. E. Woodward, Atlas of polmer Morphology, Hanser,New York,1989.