Material Market Study print - Domicology
30
Structural Material Reuse and Recycling Market Study By Josh Weidenaar Shelby Kurland Rex L. LaMore, Director
Transcript of Material Market Study print - Domicology

Structural Material Reuse and Recycling Market Study
By Josh Weidenaar Shelby Kurland
Rex L. LaMore, Director

1
2
Table of Contents Michigan State University Center for Community and Economic Development ............................................................. 3
Acknowledgments ............................................................................................................................................................. 4
Introduction ....................................................................................................................................................................... 5
Structural Reuse and Recycling Supply Chain .................................................................................................................. 6
Methods ............................................................................................................................................................................. 7
Quantitative Analysis ........................................................................................................................................................ 8
Spatial Analysis ............................................................................................................................................................... 12
Employment and Industry Growth .................................................................................................................................. 17
Findings ........................................................................................................................................................................... 18
Recommendations ........................................................................................................................................................... 21
Conclusions ..................................................................................................................................................................... 21
Appendix A: NAICS Codes & Descriptions ................................................................................................................... 22
Appendix B: Limitations to Study ................................................................................................................................... 25
Appendix C: Keywords ................................................................................................................................................... 27
Appendix D: Advisory Board .......................................................................................................................................... 27
References ....................................................................................................................................................................... 28
The statements, findings, conclusions and recommendations contained within this work are solely those of the authors and do not necessarily reflect the views of Michigan State University.

3
Michigan State University Center for Community and Economic Development
Michigan State University is the nation’s premiere land-grant university. The Michigan State University Center for Community and Economic Development is celebrating its 50th year developing and applying knowledge to address the needs of contemporary society. Our mission is to advance MSU's land-grant mission by creating, applying, and disseminating valued knowledge through responsive engagement, strategic partnerships, and collaborative learning. We are dedicated to empowering communities to create sustainable prosperity and an equitable -economy.
Since its establishment in downtown Lansing, Michigan, in 1969, CCED, in partnership with public and private organizations, has developed and conducted numerous innovative programs that address local concerns while building the capacity of students, scholars and communities to address future challenges. Student, faculty, and community involvement is a crucial element of the CCED's mission. The CCED focuses its resources on the unique challenges of distressed communities throughout the state of Michigan.
In carrying out the mission of the CCED:
• Create and support an innovative learning environment for collaborative learning in community and economic development
• Provide training and direct assistance designed to increase the capabilities of community-based organizations, private enterprises and public institutions
• Conduct research that assists in the development and implementation of effective problem-solving strategies
• Provide a multidisciplinary capacity to respond to the complex, interrelated issues of distressed communities
• Promote and expand MSU's capacity to provide needed training, direct assistance, and research to address the issues of communities
Contact the Center for Community and Economic Development at (517)353-9555 or visit our website at: http://ced.msu.edu/

4
Acknowledgments The MSU Center for Community and Economic Development would like to thank all those that contributed in small and large ways to the success of this study. Thanks to all those that involved themselves in this process.
Principal Authors
This market study was authored by Joshua Weidenaar, Rex LaMore PhD, & Shelby Kurland, and is the result of the hard work of many individuals including our principal authors and editors, as well as the inspiring team at the Center for Community and Economic Development. Thanks to those who gave their guidance and expertise in our Structural Material Advisory Committee (see Appendix D).
Principal Editors
Editing contributions credits are graciously given to Lauren Ross, Heather Mahoney, & Nathaniel Hooper. Quantitative data analysis would not have been possible without the gracious time and effort made by Dr. John Schweitzer. Spatial analysis was made feasible by the gracious gift of the facilities and technology offered to us by Dr. Yue Cui and her highly skilled and even more helpful research team over at Michigan State’s Land Policy Institute.
Organizations
The advice and counsel of the advisory committee and other individuals throughout organizations involved in this industry or another who were integral in the success of this piece, deserve our thanks. To see a full list of names and organization affiliation see Appendix D.

5
Introduction In early 2017, the Michigan State University Center for Community and Economic Development published the, “Muskegon Michigan Deconstruction Economic Cluster Feasibility Study.” Conclusions from the Muskegon Study identified a weak, underdeveloped supply chain for the reuse of structural material, among other barriers to Muskegon’s immediate success as a reuse hub (Jordan, LaMore et al., 2017). This weak, underdeveloped supply chain in Michigan is a major impediment to creating a circular economy[1] in the built environment. The envisioning of a circular economy around the built environment is but one principle of a broader field of study, Domicology, which is defined as the study of the economic, social, and environmental characteristics relating to the life cycle of the built environment. This is a domicological analysis that provides an overview of the current structural material reuse and salvage industry in Michigan, with its overall intent being that of identifying opportunities to strengthen this emerging sector.
Study Objectives
The objectives of this study are to identify Michigan businesses involved in the: 1) handling of material derivatives of structural demolition and deconstruction; and 2) processing these derivatives in a way that reuses, recycles, and/or repurposes the material.
Utilizing available data sources, data including annual sales volume, number of workers employed, capacity for sales volume growth, business location and other metrics were gathered. These metrics are used to suggest opportunities for strategic actions that may grow this industry.
The statements, findings, conclusions and recommendations are solely those of the authors and do not necessarily reflect the views of Michigan State University.
1 A circular economy is a regenerative system in which resource input and waste, emission, and energy leakage are minimized by slowing, closing, and narrowing energy and material loops.

Structural Reuse and Recycling Supply Chain
To help visualize and understand the life cycle of structural material slated for reuse, the research team developed a schematic. When viewing Figure 1. Notice the three separate paths structural material may follow: re-use, recycle, or repurpose. Currently approximately 14% (Grether, 2017) of landfill waste is made up of structural material, [Figure 1] outlines a more circular use of this material and identifies possible businesses that support these innovative material pathways.
FIGURE 1. GRAPHIC REPRESENTATION OF INDUSTRY PROFILE (STRUCTURAL MATERIAL INDUSTRY, FOCUS: POST FIRST USEFUL LIFE).
6
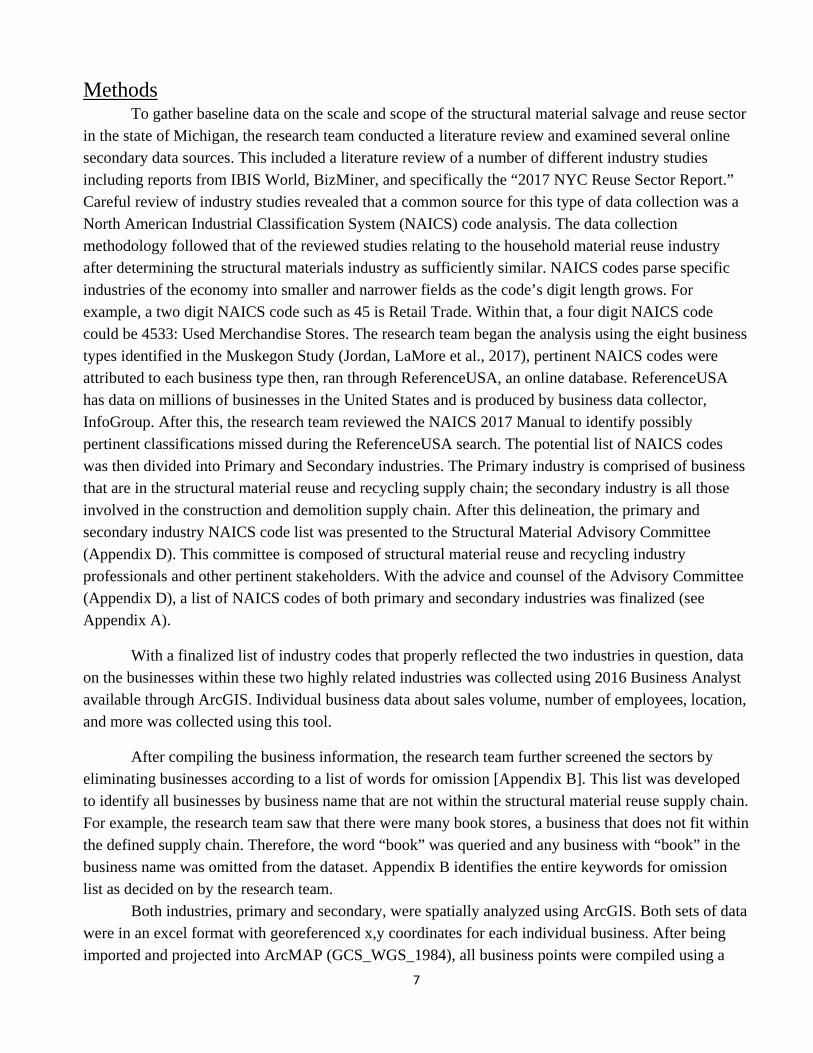
Methods
7
Methods To gather baseline data on the scale and scope of the structural material salvage and reuse sector
in the state of Michigan, the research team conducted a literature review and examined several online secondary data sources. This included a literature review of a number of different industry studies including reports from IBIS World, BizMiner, and specifically the “2017 NYC Reuse Sector Report.” Careful review of industry studies revealed that a common source for this type of data collection was a North American Industrial Classification System (NAICS) code analysis. The data collection methodology followed that of the reviewed studies relating to the household material reuse industry after determining the structural materials industry as sufficiently similar. NAICS codes parse specific industries of the economy into smaller and narrower fields as the code’s digit length grows. For example, a two digit NAICS code such as 45 is Retail Trade. Within that, a four digit NAICS code could be 4533: Used Merchandise Stores. The research team began the analysis using the eight business types identified in the Muskegon Study (Jordan, LaMore et al., 2017), pertinent NAICS codes were attributed to each business type then, ran through ReferenceUSA, an online database. ReferenceUSA has data on millions of businesses in the United States and is produced by business data collector, InfoGroup. After this, the research team reviewed the NAICS 2017 Manual to identify possibly pertinent classifications missed during the ReferenceUSA search. The potential list of NAICS codes was then divided into Primary and Secondary industries. The Primary industry is comprised of business that are in the structural material reuse and recycling supply chain; the secondary industry is all those involved in the construction and demolition supply chain. After this delineation, the primary and secondary industry NAICS code list was presented to the Structural Material Advisory Committee (Appendix D). This committee is composed of structural material reuse and recycling industry professionals and other pertinent stakeholders. With the advice and counsel of the Advisory Committee (Appendix D), a list of NAICS codes of both primary and secondary industries was finalized (see Appendix A).
With a finalized list of industry codes that properly reflected the two industries in question, data on the businesses within these two highly related industries was collected using 2016 Business Analyst available through ArcGIS. Individual business data about sales volume, number of employees, location, and more was collected using this tool.
After compiling the business information, the research team further screened the sectors by eliminating businesses according to a list of words for omission [Appendix B]. This list was developed to identify all businesses by business name that are not within the structural material reuse supply chain. For example, the research team saw that there were many book stores, a business that does not fit within the defined supply chain. Therefore, the word “book” was queried and any business with “book” in the business name was omitted from the dataset. Appendix B identifies the entire keywords for omission list as decided on by the research team.
Both industries, primary and secondary, were spatially analyzed using ArcGIS. Both sets of data were in an excel format with georeferenced x,y coordinates for each individual business. After being imported and projected into ArcMAP (GCS_WGS_1984), all business points were compiled using a

8
spatial join feature to the census tract in which they were located. The different attribute fields of both the primary and secondary industry profiles were counted and summed, in order to aggregate the individual business activity happening within any given census tract. The end result gives the user attribute fields, such as SUM_Sales_Vol, of both industries, This took all the business sales volumes that lay within the census tracts and aggregated them. It also counted the number of businesses from both the primary and secondary industries that fell within its borders, ranging from 0 to 88 businesses for the secondary industry and from 0-14 businesses for the primary industry. From this, maps were created using the graduated colors section in the quantiles tab of the symbology window in the shapefiles properties section. The research team created the choropleth maps (figure’s 6-15) with five classes, using the Natural Breaks (Jenks) classification method. Figure 16 and 17 were created using excel selected data to display the 90th percentile and above businesses by importing the data points into ArcMap. This analysis served as the basis for the findings and conclusions presented in this study on the current state of the structural reuse and recycling industry and possible future actions.
Quantitative Analysis
FIGURE 2 TYPE OF BUSINESSES WITHIN PRIMARY AND SECONDARY INDUSTRIES SEPARATED ACCORDING TO NAICS CO
DE (DATA SOURCE: 2016 BUSINESS ANALYST).
The research team discovered that the primary industry in Michigan has 2,756 businesses or organizations in 2016. Of the primary industry businesses identified, 53% (Figure 2) fall under the “Used Merchandise Stores” NAICS code. This includes, but is not limited to, architectural salvage warehouses, antique stores, and thrift stores. The average annual sales volume was found to be
9
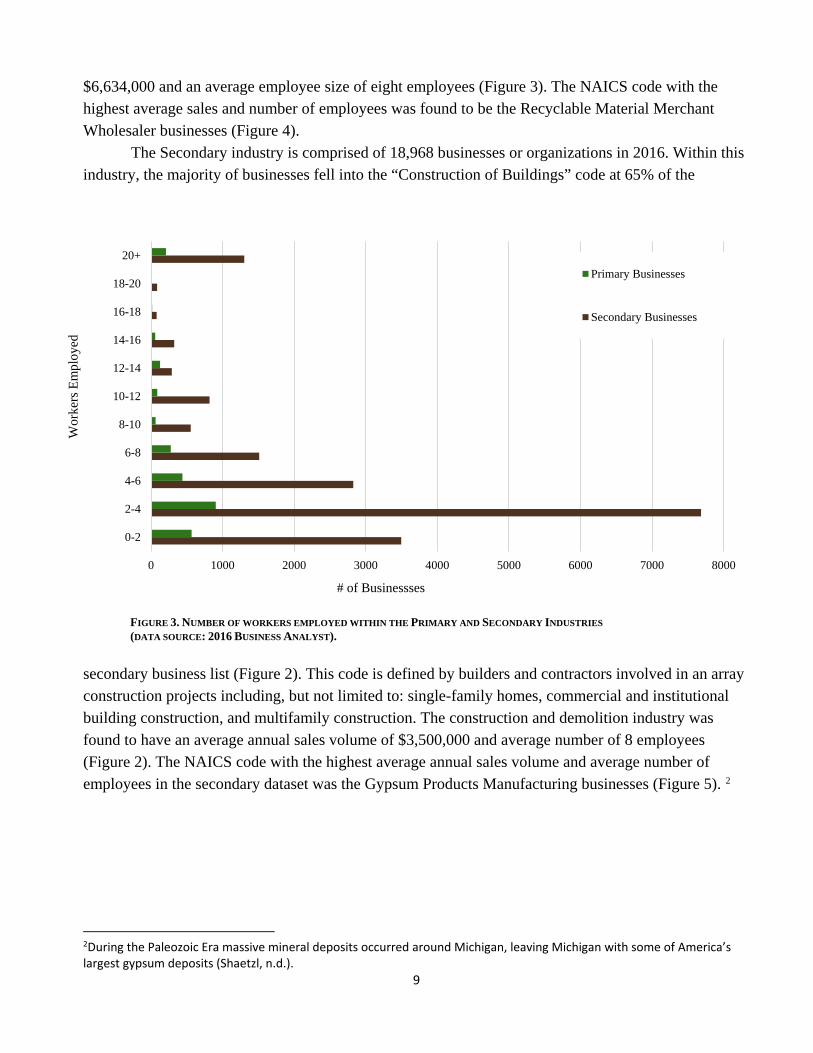
$6,634,000 and an average employee size of eight employees (Figure 3). The NAICS code with the highest average sales and number of employees was found to be the Recyclable Material Merchant Wholesaler businesses (Figure 4). The Secondary industry is comprised of 18,968 businesses or organizations in 2016. Within this industry, the majority of businesses fell into the “Construction of Buildings” code at 65% of the
Workers Employed by Primary and Secondary Industries
secondary business list (Figure 2). This code is defined by builders and contractors involved in an array construction projects including, but not limited to: single-family homes, commercial and institutional building construction, and multifamily construction. The construction and demolition industry was found to have an average annual sales volume of $3,500,000 and average number of 8 employees (Figure 2). The NAICS code with the highest average annual sales volume and average number of employees in the secondary dataset was the Gypsum Products Manufacturing businesses (Figure 5). 2
2During the Paleozoic Era massive mineral deposits occurred around Michigan, leaving Michigan with some of America’s largest gypsum deposits (Shaetzl, n.d.).
0 1000 2000 3000 4000 5000 6000 7000 8000
0-2
2-4
4-6
6-8
8-10
10-12
12-14
14-16
16-18
18-20
20+
# of Businessses
Wor
kers
Em
ploy
ed
Primary Businesses
Secondary Businesses
FIGURE 3. NUMBER OF WORKERS EMPLOYED WITHIN THE PRIMARY AND SECONDARY INDUSTRIES (DATA SOURCE: 2016 BUSINESS ANALYST).
10
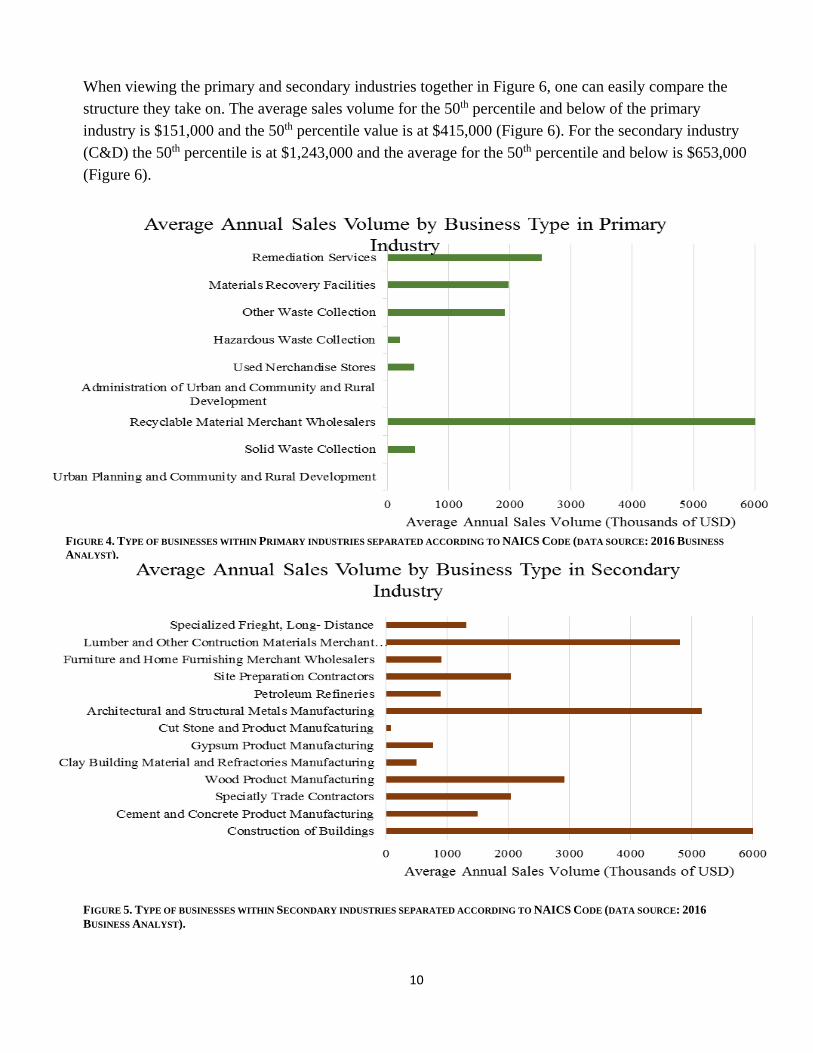
When viewing the primary and secondary industries together in Figure 6, one can easily compare the structure they take on. The average sales volume for the 50th percentile and below of the primary industry is $151,000 and the 50th percentile value is at $415,000 (Figure 6). For the secondary industry (C&D) the 50th percentile is at $1,243,000 and the average for the 50th percentile and below is $653,000 (Figure 6).
FIGURE 5. TYPE OF BUSINESSES WITHIN SECONDARY INDUSTRIES SEPARATED ACCORDING TO NAICS CODE (DATA SOURCE: 2016 BUSINESS ANALYST).
FIGURE 4. TYPE OF BUSINESSES WITHIN PRIMARY INDUSTRIES SEPARATED ACCORDING TO NAICS CODE (DATA SOURCE: 2016 BUSINESS ANALYST).
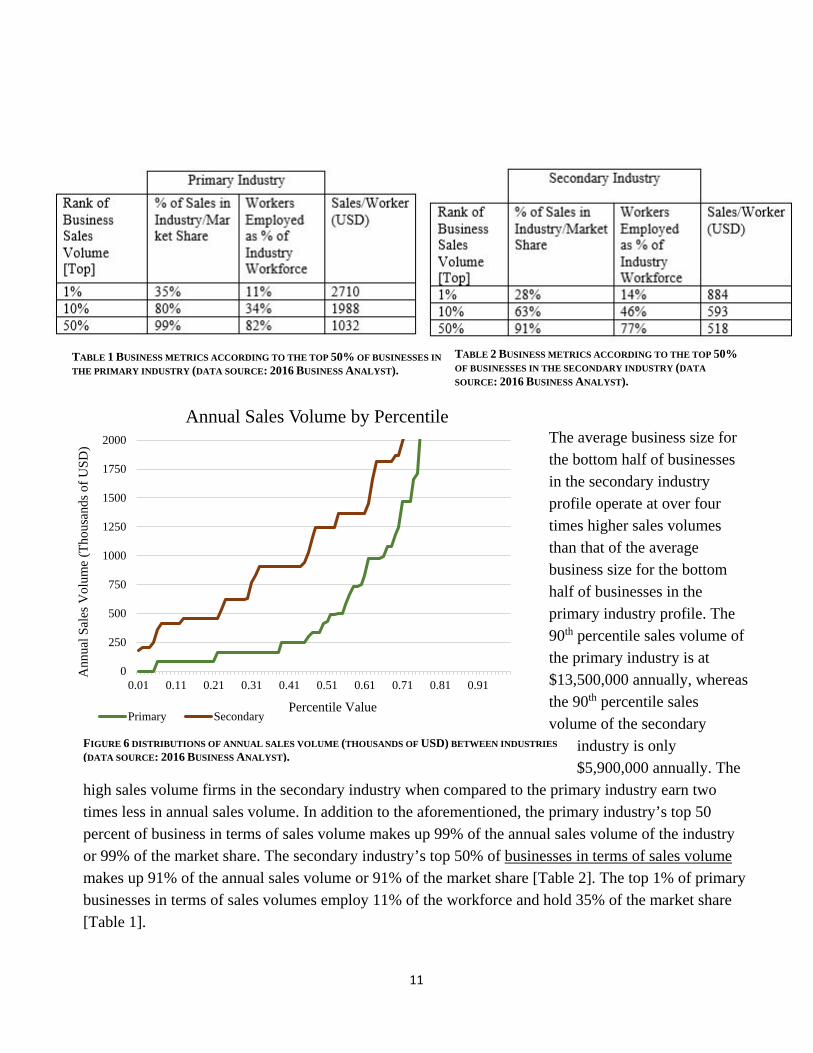
The average business size for the bottom half of businesses in the secondary industry profile operate at over four times higher sales volumes than that of the average business size for the bottom half of businesses in the primary industry profile. The 90th percentile sales volume of the primary industry is at $13,500,000 annually, whereas the 90th percentile sales volume of the secondary
industry is only $5,900,000 annually. The
high sales volume firms in the secondary industry when compared to the primary industry earn two times less in annual sales volume. In addition to the aforementioned, the primary industry’s top 50 percent of business in terms of sales volume makes up 99% of the annual sales volume of the industry or 99% of the market share. The secondary industry’s top 50% of businesses in terms of sales volume makes up 91% of the annual sales volume or 91% of the market share [Table 2]. The top 1% of primary businesses in terms of sales volumes employ 11% of the workforce and hold 35% of the market share [Table 1].
11
0
250
500
750
1000
1250
1500
1750
2000
0.01 0.11 0.21 0.31 0.41 0.51 0.61 0.71 0.81 0.91
Ann
ual S
ales
Vol
ume
(Tho
usan
ds o
f USD
)
Percentile Value
Annual Sales Volume by Percentile
Primary Secondary
TABLE 1 BUSINESS METRICS ACCORDING TO THE TOP 50% OF BUSINESSES IN THE PRIMARY INDUSTRY (DATA SOURCE: 2016 BUSINESS ANALYST).
TABLE 2 BUSINESS METRICS ACCORDING TO THE TOP 50% OF BUSINESSES IN THE SECONDARY INDUSTRY (DATA SOURCE: 2016 BUSINESS ANALYST).
FIGURE 6 DISTRIBUTIONS OF ANNUAL SALES VOLUME (THOUSANDS OF USD) BETWEEN INDUSTRIES (DATA SOURCE: 2016 BUSINESS ANALYST).

12
Spatial Analysis
Figure 7 shows all the census tracts in Michigan in a color corresponding to the amount of reuse businesses that lay within its borders. Five classes highlight the different ranges of market presence in a geographic extent, zero being the lowest class and 10-14 being the highest class. When viewing the full extent of Michigan, much of the state has zero reuse businesses within its geographic extent. This is true for 1,403 of the 2,773 census tracts in Michigan.
FIGURE 7. SPATIAL REPRESENTATION OF PRIMARY INDUSTRY PRESENCE IN MICHIGAN ACCORDING TO CENSUS TRACT (DATA SOURCE: 2016 BUSINESS ANALYST).
13
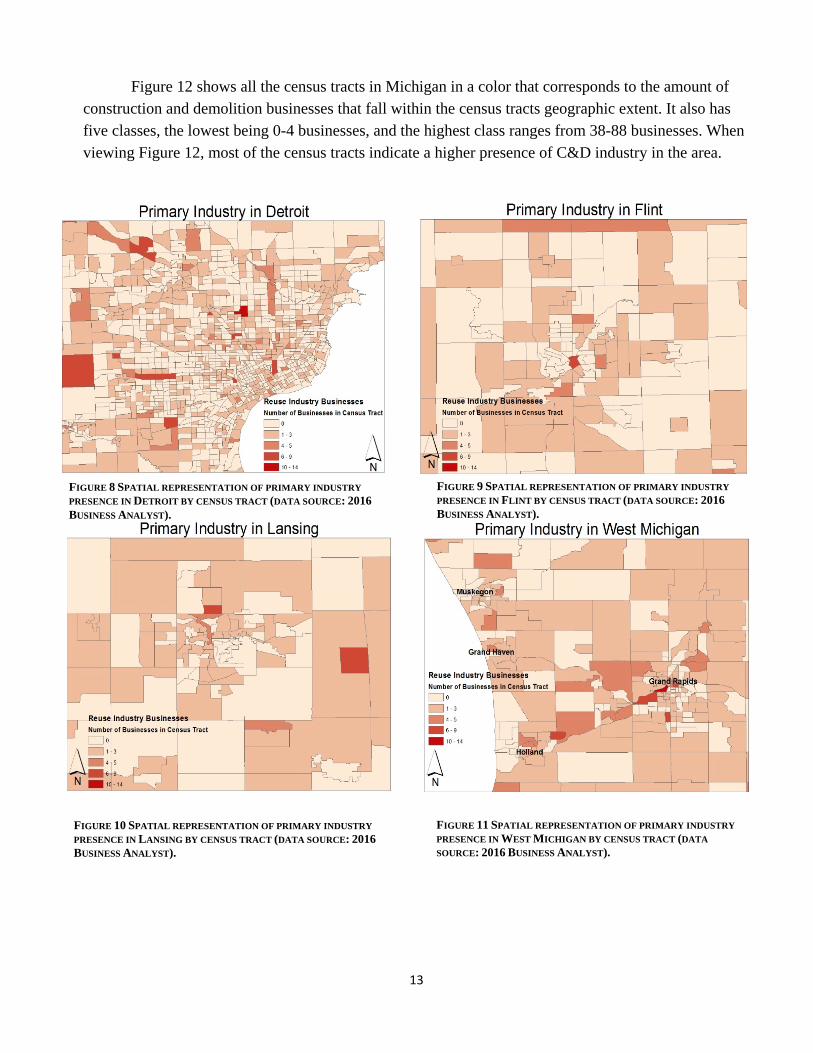
Figure 12 shows all the census tracts in Michigan in a color that corresponds to the amount of construction and demolition businesses that fall within the census tracts geographic extent. It also has five classes, the lowest being 0-4 businesses, and the highest class ranges from 38-88 businesses. When viewing Figure 12, most of the census tracts indicate a higher presence of C&D industry in the area.
FIGURE 8 SPATIAL REPRESENTATION OF PRIMARY INDUSTRY PRESENCE IN DETROIT BY CENSUS TRACT (DATA SOURCE: 2016 BUSINESS ANALYST).
FIGURE 9 SPATIAL REPRESENTATION OF PRIMARY INDUSTRY PRESENCE IN FLINT BY CENSUS TRACT (DATA SOURCE: 2016 BUSINESS ANALYST).
FIGURE 11 SPATIAL REPRESENTATION OF PRIMARY INDUSTRY PRESENCE IN WEST MICHIGAN BY CENSUS TRACT (DATA SOURCE: 2016 BUSINESS ANALYST).
FIGURE 10 SPATIAL REPRESENTATION OF PRIMARY INDUSTRY PRESENCE IN LANSING BY CENSUS TRACT (DATA SOURCE: 2016 BUSINESS ANALYST).

14
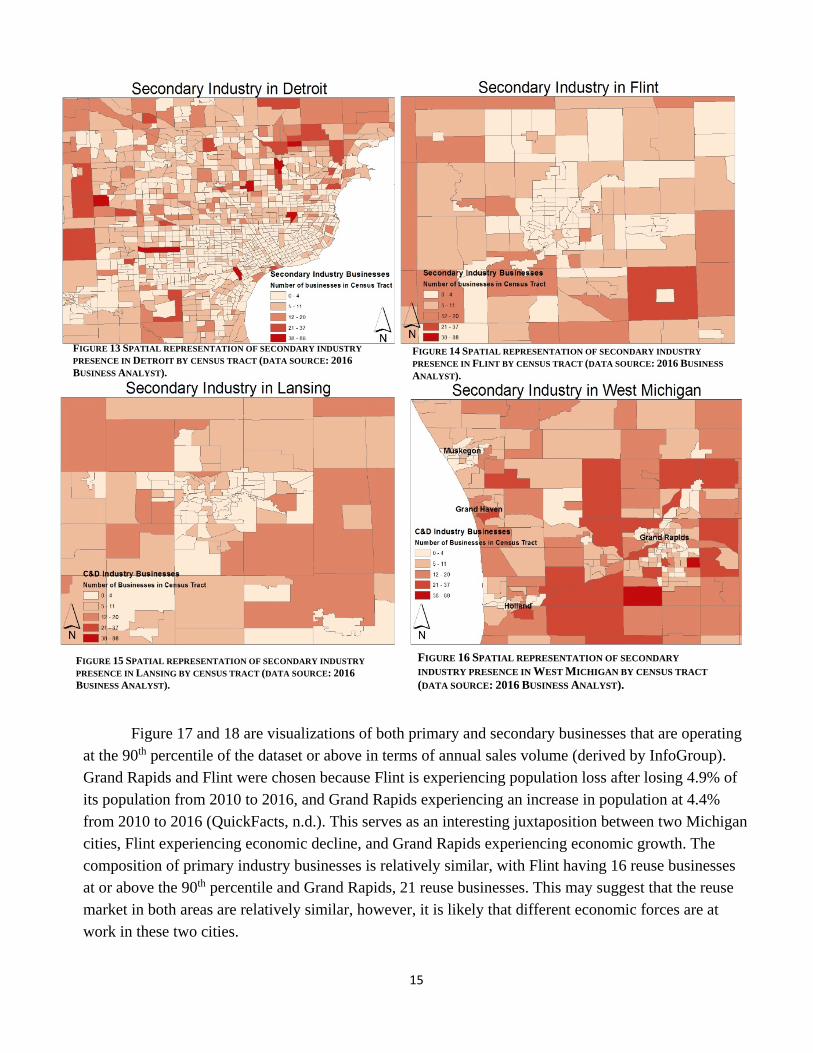
Only 227 census tracts statewide have no C&D industry presence. When viewing the urban area maps of the selected urban centers throughout Michigan, including Flint, West Michigan, Detroit, and Lansing, we make the following observations. When examining the spatial distribution and density of primary industries throughout the state [Figure 7] and in specific localities such as Flint [Figure 9], Detroit [Figure 8], West Michigan [Figure 11], and Lansing [Figure 10] we observe a broad distribution with some elements of concentration in select urban census tracts. When observing the secondary industries spatial distribution throughout the state [Figure 12], and in selected urban centers including Flint [Figure 14], Detroit [Figure 13], Lansing [Figure 15], and West Michigan [Figure 16], we note a widely distributed pattern of density with often lesser density in core metro areas.
Throughout all two thousand plus census tracts in Michigan, the average number of businesses in a census tract is seven businesses for the secondary industry, and one business for the primary industry. The average number of employees throughout all census tracts in Michigan for the secondary industry was 55 employees, and eight employees for the primary industry. Average aggregated sales volume within a census tract for secondary was $24,604,000 and $6,584,000 for the primary industry.
FIGURE 12. SPATIAL REPRESENTATION OF SECONDARY INDUSTRY PRESENCE IN MICHIGAN ACCORDING TO CENSUS TRACT (DATA SOURCE: 2016 BUSINESS ANALYST).
15
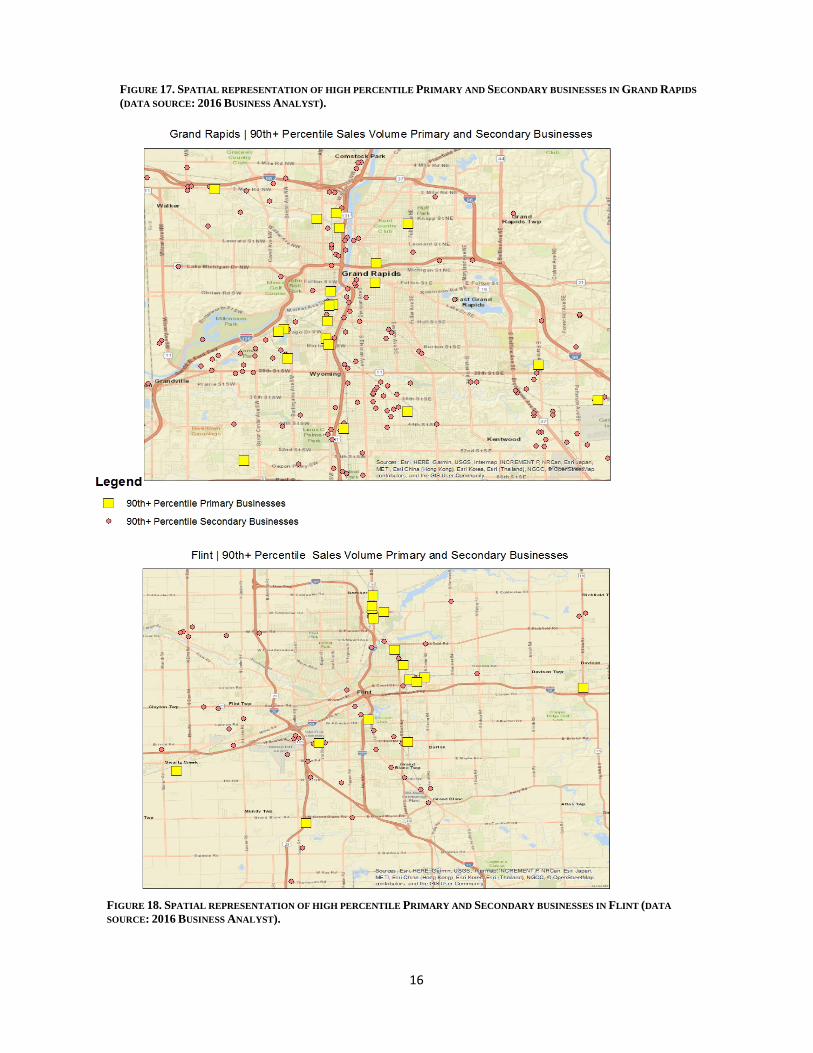
Figure 17 and 18 are visualizations of both primary and secondary businesses that are operating
at the 90th percentile of the dataset or above in terms of annual sales volume (derived by InfoGroup). Grand Rapids and Flint were chosen because Flint is experiencing population loss after losing 4.9% of its population from 2010 to 2016, and Grand Rapids experiencing an increase in population at 4.4% from 2010 to 2016 (QuickFacts, n.d.). This serves as an interesting juxtaposition between two Michigan cities, Flint experiencing economic decline, and Grand Rapids experiencing economic growth. The composition of primary industry businesses is relatively similar, with Flint having 16 reuse businesses at or above the 90th percentile and Grand Rapids, 21 reuse businesses. This may suggest that the reuse market in both areas are relatively similar, however, it is likely that different economic forces are at work in these two cities.
FIGURE 13 SPATIAL REPRESENTATION OF SECONDARY INDUSTRY PRESENCE IN DETROIT BY CENSUS TRACT (DATA SOURCE: 2016 BUSINESS ANALYST).
FIGURE 16 SPATIAL REPRESENTATION OF SECONDARY INDUSTRY PRESENCE IN WEST MICHIGAN BY CENSUS TRACT (DATA SOURCE: 2016 BUSINESS ANALYST).
FIGURE 15 SPATIAL REPRESENTATION OF SECONDARY INDUSTRY PRESENCE IN LANSING BY CENSUS TRACT (DATA SOURCE: 2016 BUSINESS ANALYST).
FIGURE 14 SPATIAL REPRESENTATION OF SECONDARY INDUSTRY PRESENCE IN FLINT BY CENSUS TRACT (DATA SOURCE: 2016 BUSINESS ANALYST).
16
FIGURE 18. SPATIAL REPRESENTATION OF HIGH PERCENTILE PRIMARY AND SECONDARY BUSINESSES IN FLINT (DATA SOURCE: 2016 BUSINESS ANALYST).
FIGURE 17. SPATIAL REPRESENTATION OF HIGH PERCENTILE PRIMARY AND SECONDARY BUSINESSES IN GRAND RAPIDS (DATA SOURCE: 2016 BUSINESS ANALYST).

Employment and Industry Growth
%∆ in # of Businesses (2007- %∆ in sales volume and Industry | Sub-Sector 2012) receipts (2007-2012) Reuse Industry | Recyclable Material Merchant Wholesalers -0.75% 10.04% Reuse Industry | Remediation Services 13.86% 16.18% C&D Industry | Construction of Buildings -14.91% -2.92% C&D Industry | Wood Product Manufacturing -7.18% -11.85% TABLE 3 THIS TABLE IDENTIFIES THE PERCENT CHANGE IN BOTH NUMBER OF BUSINESSES AND PERCENT CHANGE IN SALES VOLUME AND RECEIPTS FOR SELECTED SUB-SECTORS OF BOTH THE PRIMARY AND SECONDARY INDUSTRIES (DATA SOURCE: ECONOMIC CENSUS DATA FROM 2007 AND 2012).
To further understand the nuances of the primary and secondary industries, three occupational
fields were examined to determine their employment patterns, these occupation fields were chosen based on their pertinence to these industries. U.S Census data was also obtained to identify past industry growth as a projection of future industry growth, within three NAICS codes identified as integral to a successful circular economy around the built environment.
First, the research team examined the Standard Occupational Classification3 of recycling and
reclamation workers. This occupation is primarily made up of those who have a high school degree or equivalent, their median wage as of 2016 is $13.83 hourly, and $28,770 annually. In the state of Michigan, this field is projected to grow by 12% from 2016 to 2026 (ONET, n.d.).
Another occupational field the research team analyzed is Construction Laborers. This
occupation is also primarily made up of those who have a high school degree or equivalent, their median wage as of 2016 is $16.07 hourly and $33,430 annually. In the state of Michigan, this field is projected to grow by 10-14% by 2026 (ONET, n.d.).
Lastly, the research team examined the growth, and potential growth, of Brownfield
Redevelopment Specialists. This occupation is primarily made up of those who have a bachelor’s degree. Their median wage as of 2014 is $50.47 hourly or $104,970 annually. In the state of Michigan, this field is projected to grow by 6% by 2024 (ONET, n.d.).
According to Economic Census data, the Recyclable Material Merchant Wholesaler and the
Remediation Services business types both experienced growth between 2007 and 2012. In 2007 there were 664 recyclable material merchant wholesaler employer and non-employer establishments, and in 2012 there were 659, a .75% decrease. Sales volumes and receipts, increased in the Recyclable Material Merchant Wholesaler business type by 10.04% between 2007 and 2012. Additionally in 2007, the Remediation Services business type had 101 employer and non-employer establishments and in 2012 there were 115, a 13.86% increase. Sales volumes and receipts also increased for the Remediation 3 The Standard Occupational classification system is a US Government system of classifying occupations by field to collect, analyze, and disseminate data. https://www.bls.gov/soc/
17

18
Services business type by 16.18% between 2007 and 2012 (Table 3). These metrics indicate that reuse centered businesses and environmentally focused businesses have experienced growth through a period of economic decline.
Business growth data for the Secondary industry shows a decline for the period of 2007 to 2012.
The NAICS codes 236, Construction of buildings and 321, Wood Product Manufacturing, were the focus area for growth or decline from the secondary industry. These two subsets of the secondary industry were considered to be integral to the success of adopting closed loop business practices in the future. In 2007 there were 31,658 employer & non-employer establishments in the Construction of buildings businesses in Michigan. In 2012 there were 26,938. This is a 14.9% reduction in industry size. When looking at sales volume, between 2007 and 2012, construction of buildings experienced 12.8% reduction in all sales, employer and non-employer. These reductions in part, can be reasonably attributed to the housing crisis of 2007. The other business type analyzed for growth was Wood Product Manufacturing, This industry went from 1,573 employer and non-employer businesses in Michigan to 1,460, a 7.2% reduction in industry size. When analyzing sales metrics, between 2007 and 2012, there was a 13.9% reduction in sales, both employer and non-employer combined.
Overall, the three occupations that are closely associated with domicological practices are
projected to grow. It is also evident that these occupations are based in technical skills training. The industries examined experienced both growth and decline. Our reuse businesses showed limited growth, and our construction and demolition business sector (secondary 321& 236 NAICS) showed a substantial decrease in number of businesses and revenue. This slow growth in the reuse sector and significant loss in the C&D industry, raises the question, what economic forces drive or motivate a strong reuse economy? In this case, the Great Recession didn’t seem to have as large of an effect on the facets of the reuse industry as compared to the negative effect on the construction and demolition industry. The economic drivers behind strong reuse economies deserves further consideration.
Findings When comparing figures 7 and 12, there are a few interesting differences between the
geographic distributions of the primary and secondary industries. Compared to the construction and demolition industries, the Reuse industry is not as heavily concentrated in metropolitan areas and has a relatively even distribution throughout Michigan with a smaller market presence in most census tracts. The complex distribution of the reuse market highlights the need for enhanced supply chain logistics for this market to properly coordinate blight elimination and circular economy efforts in strategic areas where abandonment may be high. The Great Recession, and the collapse of the housing market, coupled with long-term disinvestment, contributed to blight and abandonment in legacy cities. According to Table 3, 2007 through 2012, spanning the Great Recession, the reuse industry exhibited modest growth while the construction and demolition industry experienced drastic reductions. During a period of economic decline, the reuse economy remained resilient and experienced some growth. This observation,
19
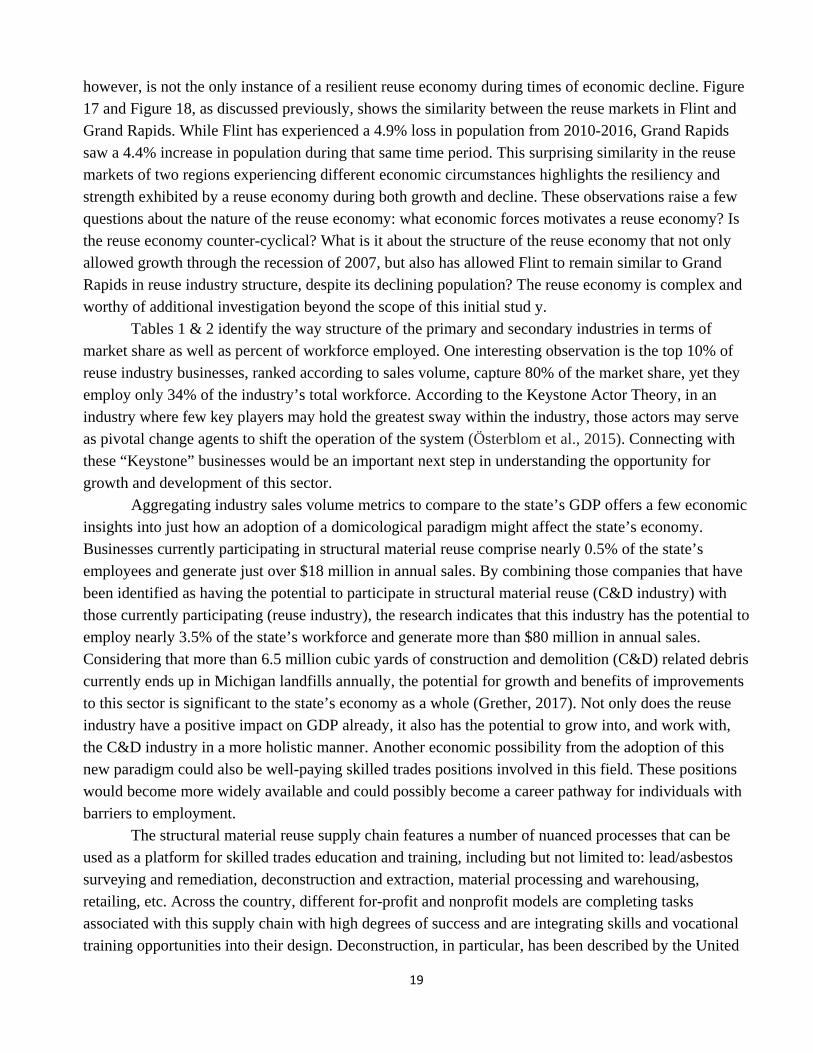
however, is not the only instance of a resilient reuse economy during times of economic decline. Figure 17 and Figure 18, as discussed previously, shows the similarity between the reuse markets in Flint and Grand Rapids. While Flint has experienced a 4.9% loss in population from 2010-2016, Grand Rapids saw a 4.4% increase in population during that same time period. This surprising similarity in the reuse markets of two regions experiencing different economic circumstances highlights the resiliency and strength exhibited by a reuse economy during both growth and decline. These observations raise a few questions about the nature of the reuse economy: what economic forces motivates a reuse economy? Is the reuse economy counter-cyclical? What is it about the structure of the reuse economy that not only allowed growth through the recession of 2007, but also has allowed Flint to remain similar to Grand Rapids in reuse industry structure, despite its declining population? The reuse economy is complex and worthy of additional investigation beyond the scope of this initial stud y. Tables 1 & 2 identify the way structure of the primary and secondary industries in terms of market share as well as percent of workforce employed. One interesting observation is the top 10% of reuse industry businesses, ranked according to sales volume, capture 80% of the market share, yet they employ only 34% of the industry’s total workforce. According to the Keystone Actor Theory, in an industry where few key players may hold the greatest sway within the industry, those actors may serve as pivotal change agents to shift the operation of the system (Österblom et al., 2015). Connecting with these “Keystone” businesses would be an important next step in understanding the opportunity for growth and development of this sector. Aggregating industry sales volume metrics to compare to the state’s GDP offers a few economic insights into just how an adoption of a domicological paradigm might affect the state’s economy. Businesses currently participating in structural material reuse comprise nearly 0.5% of the state’s employees and generate just over $18 million in annual sales. By combining those companies that have been identified as having the potential to participate in structural material reuse (C&D industry) with those currently participating (reuse industry), the research indicates that this industry has the potential to employ nearly 3.5% of the state’s workforce and generate more than $80 million in annual sales. Considering that more than 6.5 million cubic yards of construction and demolition (C&D) related debris currently ends up in Michigan landfills annually, the potential for growth and benefits of improvements to this sector is significant to the state’s economy as a whole (Grether, 2017). Not only does the reuse industry have a positive impact on GDP already, it also has the potential to grow into, and work with, the C&D industry in a more holistic manner. Another economic possibility from the adoption of this new paradigm could also be well-paying skilled trades positions involved in this field. These positions would become more widely available and could possibly become a career pathway for individuals with barriers to employment.
The structural material reuse supply chain features a number of nuanced processes that can be used as a platform for skilled trades education and training, including but not limited to: lead/asbestos surveying and remediation, deconstruction and extraction, material processing and warehousing, retailing, etc. Across the country, different for-profit and nonprofit models are completing tasks associated with this supply chain with high degrees of success and are integrating skills and vocational training opportunities into their design. Deconstruction, in particular, has been described by the United
20
States Home Builders Association (HBA) as “well-suited for training youth and low-skill workers interested in entering into skilled building trades.” (1997)
The skilled trades sector is experiencing a ‘gap’ in the availability of qualified applicants. Some studies have shown that up to 62% of firms are struggling to fill important skilled trade positions, and that this trend is predicted to continue for years to come (Skilled Trades, 2018). It is estimated that there are 5 million unfilled construction/extraction jobs and an additional 2 million unfilled jobs in related professions such as: welding, pipefitting, electricians, machinists. (Skilled Trades, 2018) Some models predict that 31 million skilled jobs will be left vacant by 2020, due to ‘baby boomer’ retirement. (Skilled Trades, 2018). With an identified need for skilled construction tradesmen and deconstruction training being an easy way to begin learning and developing the skilled trades needed for these construction jobs, the deconstruction training programs in existence may see a drastic increase in demand, and new programs could possibly sprout up throughout the nation. This would mean the beginning and continuation of a domicologically minded vocational skills training programs that would teach those who work this industry to think of structural material and the built environment in a more holistic and inclusive manner. This type of labor gap/opportunity suite those with barriers to employment well and could possibly offer them a career pathway rich with opportunity and capacity for self-realized growth. This industry has great potential to help mitigate environmental impacts across the state of Michigan. Ecologically, Michigan is home to the diverse ecosystem of the Great Lakes. Throughout the fiscal year of 2016, the state has took in over forty million cubic yards of solid waste (Grether, 2017). This landfill waste creates environmental challenges such as the discharge of greenhouse gases into the atmosphere, and the formulation of leachate which risks damaging soils and ground water resources (El-Fadel, Findikakis, & Leckie, 1997). In 2016, Construction and Demolition waste is estimated to have been 13.4% of total landfill waste (Grether, 2017). Thus, there is room to help reduce this input’s presence in the waste stream by using Domicological practices that encourage reuse and recycling of salvage structural waste materials.
21
Recommendations
In conducting this analysis, the following recommendations may be considered to facilitate the growth and development of this circular economy:
• Create a statewide coalition of industry leaders in the salvage and reuse sectors. • Conduct an in depth survey of the identified businesses to understand, in detail, the structural
material reuse industry at an even deeper level. • Examine financial incentives for improving the supply chain logistics of structural reuse and
salvage in co-ordination with blight removal efforts to effectively source and distribute this material.
• Examine new material processes that salvage structural material in new and innovative ways, leading to the creation of more sustainable products.
• Identify programs and policies that encourage the reuse of salvaged materials in construction.
• Identify workforce development policies and practices that improve the efficiency of the salvage industry workforce and/or have the potential to increase the number of workers in this sector and lead to a sustainable living wage.
Conclusions
Michigan is in a unique position to provide leadership in transforming our current built environment challenge of structural blight and abandonment into a 21st century circular economy model. Our ability to create value in the materials we currently throw away in to useful goods will challenge our industrial creative capacity and the skills of our talented workforce. This analysis provides us a basic understanding of this reuse sector and can provide a guide for future strategic activities in this area that can create jobs, environmental wellbeing and preserve valuable resources for future generations. It is the research teams hope that the research helps all interested along this path.
22
Appendix A: NAICS Codes & Descriptions Primary Codes & Descriptions 562111 Solid Waste Collection This U.S. industry comprises establishments primarily engaged in one or more of the following: (1) collecting and/or hauling nonhazardous solid waste (i.e., garbage) within a local area; (2) operating nonhazardous solid waste transfer stations; and (3) collecting and/or hauling mixed recyclable materials within a local area. 562112 Hazardous Waste Collection This U.S. industry comprises establishments primarily engaged in collecting and/or hauling hazardous waste within a local area and/or operating hazardous waste transfer stations. Hazardous waste collection establishments may be responsible for the identification, treatment, packaging, and labeling of waste for the purposes of transport. 562119 Other Waste Collection This U.S. industry comprises establishments primarily engaged in collecting and/or hauling waste (except nonhazardous solid waste and hazardous waste) within a local area. Establishments engaged in brush or rubble removal services are included in this industry. 423930 Recyclable Material Merchant Wholesalers This industry comprises establishments primarily engaged in the merchant wholesale distribution of automotive scrap, industrial scrap, and other recyclable materials. Included in this industry are auto wreckers primarily engaged in dismantling motor vehicles for the purpose of wholesaling scrap. Administration of Urban Planning and Community and Rural Development This industry comprises government establishments primarily engaged in the administration and planning of the development of urban and rural areas. Included in this industry are government zoning boards and commissions. 453310 Used Merchandise Stores This industry comprises establishments primarily engaged in retailing used merchandise, antiques, and secondhand goods (except motor vehicles, such as automobiles, RVs, motorcycles, and boats; motor vehicle parts; tires; and mobile homes). 562920 Materials Recovery Facilities This industry comprises establishments primarily engaged in (1) operating facilities for separating and sorting recyclable materials from nonhazardous waste streams (i.e., garbage) and/or (2) operating facilities where commingled recyclable materials, such as paper, plastics, used beverage cans, and metals, are sorted into distinct categories. 562910 Remediation Services This industry comprises establishments primarily engaged in one or more of the following: (1) remediation and cleanup of contaminated buildings, mine sites, soil, or ground water; (2) integrated mine reclamation activities, including demolition, soil remediation, waste water treatment, hazardous
23
material removal, contouring land, and revegetation; and (3) asbestos, lead paint, and other toxic material abatement. Secondary Codes & Descriptions 236 Construction of Buildings The Construction of Buildings subsector comprises establishments primarily responsible for the construction of buildings. The work performed may include new work, additions, alterations, or maintenance and repairs. The on-site assembly of precut, panelized, and prefabricated buildings and construction of temporary buildings are included in this subsector. Part or all of the production work for which the establishments in this subsector have responsibility may be subcontracted to other construction establishments--usually specialty trade contractors. Establishments in this subsector are classified based on the types of buildings they construct. This classification reflects variations in the requirements of the underlying production processes. 238 Specialty Trade Contractors The Specialty Trade Contractors subsector comprises establishments whose primary activity is performing specific activities (e.g., pouring concrete, site preparation, plumbing, painting, and electrical work) involved in building construction or other activities that are similar for all types of construction, but that are not responsible for the entire project. The work performed may include new work, additions, alterations, maintenance, and repairs. The production work performed by establishments in this subsector is usually subcontracted from establishments of the general contractor type or for-sale builders, but especially in remodeling and repair construction, work also may be done directly for the owner of the property. Specialty trade contractors usually perform most of their work at the construction site, although they may have shops where they perform prefabrication and other work. Establishments primarily engaged in preparing sites for new construction are also included in this subsector. 321 Wood Product Manufacturing Establishments in the Wood Product Manufacturing subsector manufacture wood products, such as lumber, plywood, veneers, wood containers, wood flooring, wood trusses, manufactured homes (i.e., mobile homes), and prefabricated wood buildings. The production processes of the Wood Product Manufacturing subsector include sawing, planing, shaping, laminating, and assembling wood products starting from logs that are cut into bolts, or lumber that then may be further cut, or shaped by lathes or other shaping tools. The lumber or other transformed wood shapes may also be subsequently planed or smoothed, and assembled into finished products, such as wood containers. The Wood Product Manufacturing subsector includes establishments that make wood products from logs and bolts that are sawed and shaped, and establishments that purchase sawed lumber and make wood products. With the exception of sawmills and wood preservation establishments, the establishments are grouped into industries mainly based on the specific products manufactured. 327120 Clay Building Material and Refractories Manufacturing This industry comprises establishments primarily engaged in shaping, molding, baking, burning, or hardening clay refractories, nonclay refractories, ceramic tile, structural clay tile, brick, and other structural clay building materials. A refractory is a material that will retain its shape and chemical identity when subjected to high temperatures and is used in applications that require extreme resistance to heat, such as furnace linings. 3273 Cement and Concrete Product Manufacturing
24
This industry group comprises establishments primarily engaged in one of the following: (1) manufacturing portland, natural, masonry, pozzolanic, and other hydraulic cements; (2) acting as batch or mixing plants, manufacturing concrete delivered to a purchaser in a plastic and unhardened state; (3) manufacturing concrete pipe, brick, and block; or (4) manufacturing other concrete products (except block, brick, and pipe). 327420 Gypsum Product Manufacturing This industry comprises establishments primarily engaged in manufacturing gypsum products, such as wallboard, plaster, plasterboard, molding, ornamental moldings, statuary, and architectural plaster work. Gypsum product manufacturing establishments may mine, quarry, or purchase gypsum. 327991 Cut Stone and Stone Product Manufacturing This U.S. industry comprises establishments primarily engaged in cutting, shaping, and finishing granite, marble, limestone, slate, and other stone for building and miscellaneous uses. Stone product manufacturing establishments may mine, quarry, or purchase stone. 3323 Architectural and Structural Metals Manufacturing This industry group comprises establishments primarily engaged in manufacturing one or more of the following: (1) prefabricated metal buildings, panels and sections; (2) structural metal products; (3) metal plate work products; (4) metal framed windows (i.e., typically using purchased glass) and metal doors; (5) sheet metal work; and (6) ornamental and architectural metal products. 4232 Furniture and Home Furnishing Merchant Wholesalers This industry group comprises establishments primarily engaged in the merchant wholesale distribution of furniture (except hospital beds, medical furniture, and drafting tables), home furnishings, and/or housewares. 4233 Lumber and Other Construction Materials Merchant Wholesalers This industry group comprises establishments primarily engaged in the merchant wholesale distribution of lumber, plywood, millwork, and wood panels; brick, stone, and related construction materials; roofing, siding, and insulation materials; and other construction materials, including manufactured homes (i.e., mobile homes) and/or prefabricated buildings 484230 Specialized Freight (except Used Goods) Trucking, Long-Distance This industry comprises establishments primarily engaged in providing long-distance specialized trucking. These establishments provide trucking between metropolitan areas that may cross North American country borders.
25
Appendix B: Limitations to Study
Our analysis has certain limitations that should be stated for clarity in this report. The statements are made so as to not overstate our findings in a way that creates any misunderstanding. Our concern is that the methods used may overstate the reuse and recycling of structural materials in Michigan. Our methodology of data collection and analysis was using an ArcGis Software called 2016 Business Analyst to collect all of the Michigan businesses currently involved at some capacity in the reuse/recycling or reprocessing of structural material. We have created two data sets, the first being our primary NAICS data set, which include all businesses in Michigan currently involved in a Domicological practice at some capacity. The Secondary data set includes all the Michigan businesses that could be involved anywhere within the cradle to grave supply chain in a Domicological practice given a widespread adoption of this new paradigm. An example of what a secondary industry business might look like would be a demolition company currently not involved in any deconstruction practices however given a rise in demand for salvaged materials might implement deconstruction practices. Both industries present different challenges and limitations. First a comment on the nature of NAICS codes and the inherent limitations a NAICS code analysis presents.
The North American Industrial Classification System (NAICS) originated in 1997, replacing the Standard Industrial Classification (SIC) which had been in operation for many years prior. Though NAICS and SIC are the most commonly used, they are not the only industrial classification systems around, by any means. Industrial Classification systems can be separated into two categories, production oriented systems and market oriented systems (Phillips 5). For the purpose of the Structural Material Reuse Study, and its aim at identifying the Michigan businesses involved in this supply chain a market oriented system of classification would fit nicely. The analysis was however done with a production oriented classification system because NAICS codes are most common in business information databases and goes down to a scale that best captures the niche nature of the structural material reuse industry. NAICS codes are a production oriented classification system, this highlights the inherent limitation of using NAICS due to the fact that the team chose to use a production oriented classification system.
Another limitation of NAICS analysis is that it inherently lags behind entrepreneurial innovation. As new products and services are created in the marketplace, the ability of NAICS to recognize and account for these unique industries becomes limited. Identifying all businesses involved in this exorbitantly niche industry is difficult, understanding this helps realize that NAICS code analysis is limited when researching a pioneering industry such as this one. With consideration to the innovative spirit behind businesses involved in Domicological practices these classification systems would naturally be behind the industry we are analyzing. One
26
alternative classification system, GICS, is a market oriented system that would be more in line with this study but has a very broad classification system, at its deepest level 156 sub-industries, not detailed enough for the scope of this study. NAICS codes are generally classified by businesses who collect business information and from that information give a specific company a NAICS code and aggregate data to make business/market research databases. There are limitations in our analysis due to the proprietary nature of these database company’s decision making process.
Diana Hicks at the Georgia Institute of Technology tested both NAICS and GICS to see how accurate they categorized the ever-changing structure of today’s economy and the emerging industries in it. Most of the industry tests against NAICS showed NAICS inability to be dynamic and representative of the changing structure of the modern American economy.
“NAICS classifications obtained from databases are assigned by employees somewhere in the database companies (Compustat, Moody’s etc.) using principles not divulged. The quality of this work will depend on training and time allocated, which in turn depend on the importance of the field to the database. The amount of inconsistency and error I found in these classifications suggests that assigning NAICS codes is not a high priority task in database companies.” (Hicks 5)
“There were also examples of vital industries exploiting relatively newly emerging
technological opportunity that were completely invisible in both schemes – gaming machines, photonics and imaging and display.” (Hicks 18)
The research team gathered data that was collected by InfoGroup, which delineates NAICS from the 6-digit lowest official classification level to a proprietary 8-digit classification level. The definition of these 8-digit NAICS codes is sometimes not clear however, the furthest we used for collection was 6-digit, rendering that limitation relatively moot, since we are catching all businesses under that 6-digit code so the 8-digit definitions are moot. Infogroup give a number of different metrics available to us for analysis however, these metrics do have some limitations stated here. The sales volumes received are derived from employee data other economic factors. The number of employees is however obtained directly from the individual businesses by Infogroup. This could have implications on the accuracy of the graphics derived from our datasets, due to the derivation of sales volume metrics as opposed to the actual collection of sales volume metrics. A final limitation to make clear regarding our primary industry is a business identified in this primary dataset is not assumed to have a 100% of business activity devoted to the reuse of structural material, and the reuse/recycling of structural material within these businesses is not known. We do however note that the primary dataset is meant to indicate those that are at the very least involved in this supply chain in the current reuse/recycling market at some capacity

27
even if it is a small % of total business activity. Further research efforts may attempt to understand what % of business activity of the identified businesses is devoted to the reuse of structural material, however that was not within the scale and scope of this study. [The research team did not have access to data that would permit the researchers to delineate the portion of a primary businesses sales that may be attributed to non-structural materials recycling or reuse. As a result annual sales volume estimates may include non-structural materials.]
Our secondary data set is meant to indicate the size of the construction and demolition supply chain from cradle to grave. These businesses generally exist within an industry much more established and accepted within the framework of NAICS codes, which produces a more confident assumption of higher % of business activity devoted to the C+D industry.
Appendix C: Keywords List of key words we used to remove irrelevant businesses from our data set using business name: Farm Logistics Auto Book Motorcycle Consignment (kept ones that gave the Tire connotation of being a furniture Cloth consignment) Welding Thrift Sign Cab Sand FashionFood
Appendix D: Advisory Board
Amy Lafferty, Michigan Department of Environmental QualityMatt Fletcher, Market Development Specialist, Michigan Department of Environmental Quality Dr. Yue Cui, Assistant Professor, Michigan State University School of Planning, Design, and Construction George Berghorn, Assistant Professor, Michigan State University School of Planning, Design, and Construction Kristopher Jolley, Manager, Michigan State University Surplus & Recycling Matt Syal, Professor, Michigan State University School of Planning, Design, and Construction Jessica Simmons, Verdant Stewardship/Urban Wood Network Jim Frey, co-founder and CEO, RRS Kerrin O’Brien, Executive Director, Michigan Recycling Coalition Bill Stough, CEO, Sustainable Research Group Stephen Carlson, Senior Planner, West Michigan Shoreline Regional Development Commission Jeremy Haines, Founder and CEO, Reclaim Detroit Ted Reiff, President, The Reuse People
28
References Bureau of Economic Analysis Michigan Facts. (2018, March). Retrieved from
https://bea.gov/regional/bearfacts/pdf.cfm?fips=26000&areatype=STATE&geotype=3 BizMiner (2017). Industry Financial Report State of Michigan Salvage & Surplus Merchandise
Stores, Camp Hill, Pennsylvania
Boettcher, J. (1999). Challenges and Opportunities Presented by NAICS. Journal of Business & Finance Librarianship, 5(2), 3-23. doi:10.1300/j109v05n02_02
Department of Sanitation, NYC Gov. (2017). 2017 Reuse Sector Report (1st ed.), New York,
New York.www1.nyc.gov/assets/dsny/docs/2017-NYC-Reuse-Sector-Report-Final El-Fadel, M., Findikakis, A. N., & Leckie, J. O. (1997). Environmental Impacts of Solid Waste
Landfilling. Journal of Environmental Management, 50(1), 1-25. doi:10.1006/jema.1995.0131
Erica Raleigh & George Galster (2015) Neighborhood Disinvestment, Abandonment, and Crime
Dynamics, Journal of Urban Affairs, 37:4, 367-396, DOI: 10.1111/ juaf.12102 Feser, E.J., & Bergman, E.M. (2000). National Industry Cluster Templates: A Framework for
Applied Regional Cluster Analysis. Regional Studies, 34 (1), 1-19. doi: 10.1080/00343400050005844
Grether, H. C. (2017, February 17). Report of Solid Waste Landfilled in Michigan (Michigan,
Department of Environmental Quality, Waste Management and Radiological Protection Division).
Hicks, D. (2011). Structural change and industrial classification. Structural Change and Economic Dynamics, 22(2), 93-105. doi: 10.1016/j.strueco.2011.03.001 IBISWorld. (2017). IBISWorld Industry Report 45331 Used Goods Stores in the US, Los
Angeles, California: Meghan Guattery IBISWorld (2017). IBISWorld Industry Report OD5535 Thrift Stores in the US, Los Angeles,
California: Madeline Hurley
Kelton, C.M., Pasquale, M.K., & Rebelein, R.P. (2008). Using the North American Industry Classification System (NAICS) to Identify National Industry Cluster Templates for Applied Regional Analysis. Regional Studies, 42(3), 305-321. doi: 10.1080/00343400701288316
Michigan. (n.d.). Retrieved from https://www.bls.gov/regions/midwest/michigan.htm#eag
29
Michigan State University Center for Community and Economic Development & West Michigan Shoreline Regional Development Commission. (2017). Muskegon, Michigan Deconstruction Economic Cluster Feasibility Study, Lansing, Michigan: Adrianna Jordan, Rex Lamore.
North American Industrial Classification System Manual 2017. (2017). In census.gov. Retrieved
From https://www.census.gov/eos/www/naics/2017NAICS/2017_NAICS_Manual.pdf O*NET (n.d.) U.S. Department of Labor. Retrieved from O*NET Online:
https://ww.onetonline.org
Österblom, H., Folke, C., Crona, B., Troell, M., Merrie, A., & Rockström, J. (2015, May 27). Transnational Corporations as 'Keystone Actors' in Marine Ecosystems. Retrieved August 22, 18, from http://journals.plos.org/plosone/article?id=10.1371/journal.pone.0127533
Phillips, R.L. & Ormsby, R. (2016). Industry classification schemes: An analysis and review.
Journal of Business & Finance Librarianship, 21(1), 1-25. doi:10.1080/08963568.2015.1110229
QuickFacts [.com]. (n.d.). United States Census Bureau. Retrieved from,
https://www.census.gov/quickfacts/fact/table/grandrapidscitymichigan,flintcitymichigan,US/PST045217
Resource Recycling Systems. (2016, September). Michigan recycling end-use market survey and
recommendations. In Michigan.gov Retrieved from https://www.michigan.gov/documents/deq/deq-wmrpd-Updated_End_Use_Market_Analysis_Report_v12_-_030517_555772_7.pdf
Shaetzl, R. (n.d.). Gypsum. Retrieved from http://geo.msu.edu/extra/geogmich/gypsummining.html
Skilled Trades in Demand (Infographic). (2018, May). Retrieved from
https://www.adeccousa.com/employers/resources/skilled-trades-in-demand/