MATEJ, ANDREW, M.A. Examining the Utility of Using ...
60
MATEJ, ANDREW, M.A. Examining the Utility of Using Multiple, Co–Occurring Tree Species to Increase Climate Sensitivity in Dendrochronology. (2019) Directed by Dr. Paul Knapp. 61 pp Dendrochronological studies have traditionally centered around the analysis of one tree species from either one location or from multiple locations. Recently, there has been an emergence of multiple species analysis from one location or more that seeks to establish a chronology that crosses the species boundary, as well as the hardwood and softwood divide. The goal of this research is to determine the dendroclimatic benefit of using of multiple, co–occurring tree species collected from a single site. This paper examines the correlation of climactic variables to multiple species of trees sampled from a 0.84 square kilometer mixed-growth forest in the Uwharrie Mountain foothills known as the Margaret J. Nichols Piedmont Longleaf Pine Preserve (hereafter Nichols Tract). Two species of softwood (Pinus palustris and Pinus echinata) were dendrochronologically sampled along with one species of hardwood (Quercus stellata). Using a sample size of n =90 during the period 1935–2016, I evaluate the compatibility of these three species in analyzing climate trends to determine if there is an increase in climatic sensitivity when combining ring–width data from all species. I also address if climatic sensitivity is temporally dependent and why.
Transcript of MATEJ, ANDREW, M.A. Examining the Utility of Using ...

MATEJ, ANDREW, M.A. Examining the Utility of Using Multiple, Co–Occurring Tree Species to Increase Climate Sensitivity in Dendrochronology. (2019) Directed by Dr. Paul Knapp. 61 pp
Dendrochronological studies have traditionally centered around the analysis of
one tree species from either one location or from multiple locations. Recently, there has
been an emergence of multiple species analysis from one location or more that seeks to
establish a chronology that crosses the species boundary, as well as the hardwood and
softwood divide. The goal of this research is to determine the dendroclimatic benefit of
using of multiple, co–occurring tree species collected from a single site. This paper
examines the correlation of climactic variables to multiple species of trees sampled from
a 0.84 square kilometer mixed-growth forest in the Uwharrie Mountain foothills known
as the Margaret J. Nichols Piedmont Longleaf Pine Preserve (hereafter Nichols Tract).
Two species of softwood (Pinus palustris and Pinus echinata) were
dendrochronologically sampled along with one species of hardwood (Quercus stellata).
Using a sample size of n =90 during the period 1935–2016, I evaluate the compatibility
of these three species in analyzing climate trends to determine if there is an increase in
climatic sensitivity when combining ring–width data from all species. I also address if
climatic sensitivity is temporally dependent and why.

EXAMINING THE UTILITY OF USING MULTIPLE, CO–OCCURRING TREE
SPECIES TO INCREASE CLIMATE SENSITIVITY
IN DENDROCHRONOLOGY
by
Andrew Matej
A Thesis Submitted to the Faculty of The Graduate School at
The University of North Carolina at Greensboro in Partial Fulfillment
of the Requirements for the Degree Master of Arts
Greensboro 2019
Approved by
______________________________ Committee Chair

ii
APPROVAL PAGE
This thesis written by Andrew Matej has been approved by the following
committee of the Faculty of The Graduate School at The University of North Carolina at
Greensboro.
Committee Chair _________________________________
Committee Members _________________________________
_________________________________
_________________________________
____________________________ Date of Acceptance by Committee
_________________________ Date of Final Oral Examination

iii
ACKNOWLEDGEMENTS
There are many people I would like to thank for helping me in the successful
completion of this project. First, I am thankful for my advisor and committee chair Dr.
Paul Knapp for the time, advice, direction and support throughout the duration of this
project. I also thank my committee members Dr. Royall, and Dr. Patterson for their
guidance and edits along the way. I want to thank Dr. Patterson for the use of his
collected data. I am thankful to Nell Allen and the North Carolina Zoo for access to the
site and permission to core. I appreciate the assistance I have received from my fellow lab
members, Tyler Mitchell and Jeffy Summers, for their time spent out in the field
gathering cores with me and for being a sounding board for both my triumphs and my
failures. Finally, I want to thank my family, Elizabeth Matej, Candace Carley and Caden
Carley for the many hiking trips with me, help with taking measurements, mounting
cores, and finally for the emotional support that got me through.

iv
TABLE OF CONTENTS
Page
LIST OF TABLES .................................................................................................................................... v
LIST OF FIGURES .................................................................................................................................vi
CHAPTER
I. INTRODUCTION AND RESEARCH OBJECTIVES ................................................. 1
Introduction ..................................................................................................................... 1 Research Objectives ..................................................................................................... 9
II. MANUSCRIPT ....................................................................................................................... 10
Introduction ................................................................................................................... 10 Methodology ................................................................................................................ 12 Results ............................................................................................................................ 18
III. DISCUSSION .......................................................................................................................... 39
Hypothesis 1 ................................................................................................................. 40 Hypothesis 2 ................................................................................................................. 41 Hypothesis 3 ................................................................................................................. 42
IV. CONCLUSIONS ..................................................................................................................... 44
REFERENCES ......................................................................................................................................... 46
v
LIST OF TABLES
Page
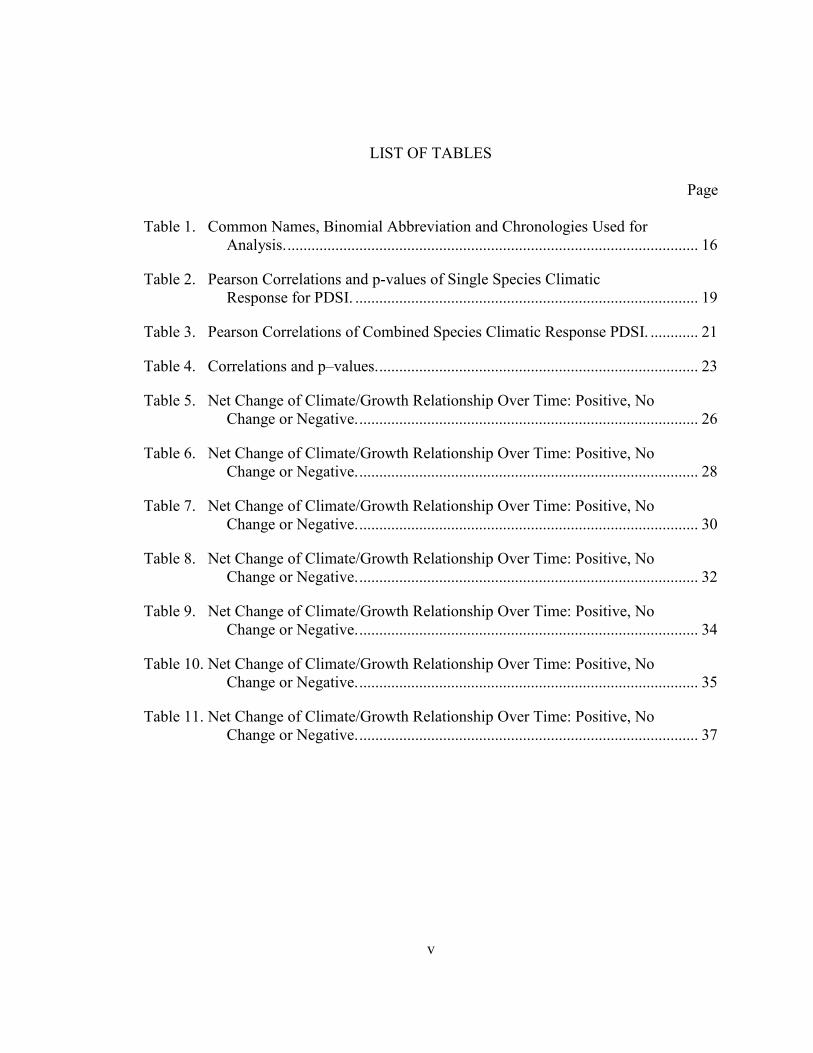
Table 1. Common Names, Binomial Abbreviation and Chronologies Used for Analysis. ....................................................................................................... 16
Table 2. Pearson Correlations and p-values of Single Species Climatic Response for PDSI. ...................................................................................... 19
Table 3. Pearson Correlations of Combined Species Climatic Response PDSI. ............ 21
Table 4. Correlations and p–values. ................................................................................ 23
Table 5. Net Change of Climate/Growth Relationship Over Time: Positive, No Change or Negative. ..................................................................................... 26
Table 6. Net Change of Climate/Growth Relationship Over Time: Positive, No Change or Negative. ..................................................................................... 28
Table 7. Net Change of Climate/Growth Relationship Over Time: Positive, No Change or Negative. ..................................................................................... 30
Table 8. Net Change of Climate/Growth Relationship Over Time: Positive, No Change or Negative. ..................................................................................... 32
Table 9. Net Change of Climate/Growth Relationship Over Time: Positive, No Change or Negative. ..................................................................................... 34
Table 10. Net Change of Climate/Growth Relationship Over Time: Positive, No Change or Negative. ..................................................................................... 35
Table 11. Net Change of Climate/Growth Relationship Over Time: Positive, No Change or Negative. ..................................................................................... 37

vi
LIST OF FIGURES
Page
Figure 1. Historical Range (L) and Current Range (R) of the Longleaf Pine Ecosystem Including Areas where Restoration Activities are Occurring (Little 1971 and Scott et al. 1977). .............................................. 3
Figure 2. Current Range of Shortleaf Pine (Source: Little 1971). .................................... 5
Figure 3. Native Range of Post Oak (Little 1971). ........................................................... 7
Figure 4. Nichols Tract (outlined in red) 1950. .............................................................. 14
Figure 5. Geographical Location of the Nichols Tract Forest. ....................................... 14
Figure 6. Haglof Increment Borer Used to Collect Core Samples. ................................ 15
Figure 7. 30–year Running Window for the Longleaf Pine............................................ 27
Figure 8. 30–year Running Window for the Shortleaf Pine. .......................................... 29
Figure 9. 30–year Running Window for the Post Oak Series ......................................... 31
Figure 10. 30–year Running Window for the PINES Series. ........................................... 33
Figure 11. 30–year Running Window for the Longleaf Pine and Post Oak Series. ......... 34
Figure 12. 30–year Running Window for the Shortleaf Pine and Post Oak Series.. .......................................................................................................... 36
Figure 13. 30–year Running Window for the COMBO Series. ........................................ 38
1
CHAPTER I
INTRODUCTION AND RESEARCH OBJECTIVES
Introduction
Dendrochronological studies have traditionally centered on the analysis of one
tree species from either one location (e.g., Guyette and Dey 1997, Rubino and McCarthy
2000, Stambaugh and Guyette 2004, Harley et al. 2011, Knapp et al. 2016) or from
multiple locations (Salzer and Hughes 2006, Salzer et al. 2009, LeBlanc and Terrell
2011, Knapp et al. 2014). Recently, several studies (e.g., Maxwell et al. 2011, Maxwell et
al. 2014, LeBlanc and Stahle 2015, Maxwell and Harley 2017) have attempted to
improve climate/radial growth relationships by using multiple–species combinations of
hardwoods and softwoods (Estes 1970, García–Suárez et al. 2001, Fraver and White
2005). Collecting from multiple species is more labor intensive due to the need to create
additional chronologies and meet the minimum statistical threshold of n = 30. Maxwell et
al. (2014) successfully used multiple species to increase the sensitivity of the
climate/growth relationship. This thesis examines several climactic indices and the
correlation between those indices and radial growth for multiple species of trees sampled
from an 83.8 ha stand of mixed coniferous/hardwood forest in the Uwharrie Mountain
foothills known as the Nichols Tract. Two species of softwood— longleaf pine (Pinus
palustris Mill.) and shortleaf pine (Pinus echinata Mill.) were dendrochronologically
sampled along with one hardwood species, post oak (Quercus stellata Ashe). Here, I seek

2
to determine the viability of using these three species in analyzing climate trends to
determine if there is an increase in climatic sensitivity when combining ring–width data
from all species during 1935–2017. If an increase in climatic sensitivity is determined, I
then address if this sensitivity is time dependent.
Hard Wood and Soft Wood
This study centers around two gymnosperm softwood trees, the longleaf pine
(Pinus palustris Mill.) and shortleaf pine (Pinus echinata Mill.) and one angiosperm
hardwood species, post oak (Quercus stellata Ashe). Gymnosperm trees have an internal
wood structure that is simpler and homogenous in nature. Gymnosperms lack the vessels
found in angiosperm trees and is non-porous. Unlike the angiosperms which transport
water up the tree in vessels and are porous in nature.
Background on the Longleaf Pine
The historical longleaf pine range covered 33 million ha, extending principally
along the Coastal Plains from eastern Texas, to southeastern Virginia (Way 2011).
Extensive populations in the Piedmont region also existed including “montane” forests in
the Ridge and Valley region of Georgia and Alabama and the Uwharrie Mountains of
North Carolina (Landers et al. 1995, Davis 1996, Van Lear 2005, Patterson and Knapp
2016). Extensive anthropological disturbance, including logging, poor fire–management
regimes, clear–cutting and domestic livestock overgrazing reduced the longleaf pine
range to less than 4% of its previous habitat (Brockway and Outcalt, 1998, Jose et al.
2006).

3
Figure 1. Historical Range (L) and Current Range (R) of the Longleaf Pine Ecosystem Including Areas where Restoration Activities are Occurring (Little 1971 and Scott et al. 1977). Ecological Importance of Longleaf Pine
Longleaf pine is a keystone species currently providing habitat for over a 100
endangered species including the red cockaded woodpecker (Leuconotopicus borealis),
the gopher tortoise (Gopherus polyphemus), the eastern indigo snake (Drymarchon
couperi), fox squirrel (Sciurus niger), Bachman’s sparrow (Aimophila aestivalis), brown–
headed nuthatch (Sitta pusilla), eastern diamondback rattlesnake (Crotalus adamanteus),
and flatwoods salamander (Ambystoma cingulatum) (Kantola and Humphrey 1990,
Engstrom 1993, Guyer and Bailey 1993, Crofton 2001, Brockway and Lewis 2003,
Kirkman, et al. 2004 ). Pre–colonial longleaf pine savannas provided habitat for over 640
species endemic to longleaf pine–dominated ecosystems (Walker 1998).
Dendroclimatological Importance of the Longleaf Pine
Longleaf pine characteristics include high sensitivity to summer precipitation
(Ginter et al. 1979, Ramsey et al. 2003, Henderson and Grissino–Mayer 2009, Knapp et

4
al. 2016) and great longevity (e.g., > 500 years, Brockway et al. 2005), which makes it an
excellent species for dendroclimatic studies. Despite a significant reduction in geographic
extent, several stands of old–growth longleaf exist (Frost 1993, Landers et al 1995,
Brockway et al. 1998, Drew et al. 1998) with some trees exceeding > 400 years age. Old
trees coupled with rainfall sensitivity provide an opportunity to establish an accurate
precipitation dating to the time of Colonial America. Additionally, dendrochronologists
have been able to extend longleaf pine chronologies by crossdating beams from pre–civil
war historic buildings (Grissino–Mayer and van de Gevel, 2007), 19th–century crib dams
(van de Gevel et al. 2009), 16th–century canoes (Pickard et al. 2010) and slabs obtained
from remnant (i.e., > 100 years old) longleaf pine stumps (McBride 1983).
Background on Shortleaf Pine
Shortleaf pine has the widest geographic range of any pine species in the
southeastern United States (Lawson 1990). The current range covers approximately 114
million ha, across 22 states in the eastern U.S. (Figure 2). The current range is partially
due to the economic value of the shortleaf pine as it is cultivated in part for a wide variety
of commercial products including lumber, plywood and pulpwood.

5
Figure 2. Current Range of Shortleaf Pine (Source: Little 1971).
Ecological Importance of Shortleaf Pine
Because the current habitat ranges of the shortleaf pine and the historical range of
longleaf pine overlap, many species have developed adaptations to live within the
mixture of the two–pine species. Shortleaf pine seeds provide an alternate source of food
for many of the birds and small animals (Hall 1977) and shortleaf pine boles provide a
secondary refuge to the red cockaded woodpecker, though the red cockaded woodpecker
needs a mature tree specimen that suffers from heart rot (Scott et al. 1977). Like the
longleaf pine, shortleaf pines are also resistant to surface fires (Guyette and Dey 1993).
The pine needles dropped contribute to low–intensity (i.e., “cool”) fires that help clear the
local area of invasive species yet cause minimal damage to the tree bole and cambium
(Sparks et al. 2002).
6
Dendroclimatological Importance of the Shortleaf Pine
Longleaf pine and shortleaf pine are genetically similar (Burns et al. 1990), thus
shortleaf pine has similar responses to climatic responses as the longleaf pine and cross
applications in dendrochronology exist (Schweingruber 1988). Studies of shortleaf pine
have contributed to the dating of historic buildings (Stahle 1979, Wight 2004), fire
chronologies (Guyette and Dey 1997) climate reconstructions that analyzed the
climate/growth relationship (Schulman 1942, Estes 1970, Grissino-Mayer and Butler
1993) and response to anthropogenic disturbance (Watkins et al. 2018). Across all the
studies cited, shortleaf pine was an excellent species regarding climate sensitivity. When
examining master databases between shortleaf pine tree stands—some more than 500 km
away—the climate signal persisted throughout both chronologies. Additionally, shortleaf
pines that were growing in xeric (dry) habitats were more climatically responsive than
samples taken from mesic (wet) habitats.
Background on Post Oak
The native range of the post oak occurs throughout the eastern two–thirds of the
continental United States except for the New England states of Vermont, New
Hampshire, and Maine and the North Central states of Wisconsin, Minnesota, North
Dakota and South Dakota (Little 1971 (Figure 3). The post oak has a variety of
commercial applications due to its resistance to decay. Commercially classified as white
oak, this tree is used for railroad ties, lathing, siding, planks, construction timbers, mine
timbers, trim molding, stair risers and treads, flooring, fence posts, pulp, veneer, and

7
particle board (Guyette and Dey 1997). White oak bark also provides tannin, decorative
and protective mulch for landscaping, and fuel (Guyette and Dey 1997).
Figure 3. Native Range of Post Oak (Little 1971).
Ecological Importance of the Post Oak
Post oak is an integral contributor to wildlife stability in the southeastern United
States. Post oak acorns provide an important food source for wild turkey, white–tailed
deer, and squirrel as well as more than 100 other vertebrate species (Hall 1977). During
the late fall and early winter more than 75 percent of a white–tailed deer diet is composed
of acorns dropped by oak trees. The acorns dropped by the post oak have short
hibernation periods and as a result are the main food source for local wildlife until late
winter and early spring. The leaves provide nesting material for birds, squirrels and

8
raccoons and cavities within the tree provide nesting locations for a wider variety of other
birds and animals (Martin 1951).
Dendroclimatological Importance of the Post Oak
Like longleaf pine and shortleaf pine, the climate sensitivity and non-commercial
viability of post oak makes it an ideal dendrochronological species. (Rossen 1994,
Therrell and Stahle 1998, and DeSantis 2010) The annual dormancy of the tree creates
distinct annual markers, which results in this species lack of false rings occurrences and
high correlation. These markers are absent in longleaf pine and shortleaf pine due to the
year-round nature of their growth. Yearly growth of the post oak is measured from the
outer bark growth to the boundary between large and small xylem conduits. Large xylem
conduits indicate the beginning of growth as well as sufficient water availability. As the
year progresses the xylem conduits shrink in diameter until there is a year boundary
indicating hibernation for the winter (Sperry 1994). The geographical distribution of the
post oak (Quercus stellata Ashe) makes it an excellent tool for creating expansive
chronologies of a specific region or a large multi–state area (Stahle and Hehr 1984,
Shumway et al. 2001, and White et al. 2011). Use of post oak chronologies have helped
create timelines for prescribed burns (Guyette, R.P and Cutter 1991, DeSantis et al. 2010)
and to date historical buildings such as Reynolds Homestead Research Center (Mann
2002). Post oak is a ring–porous species with larger pores forming in the early portion of
the growing season (earlywood) and smaller pores during the latter portion of the
growing season (latewood) creating a pattern that results in few observed missing or false
rings (Sperry et al. 1994).

9
Research Objectives
The goal of this research is to determine the dendroclimatic benefit of using of
multiple, co–occurring tree species collected from a single site. Specifically, I determine
the climatic sensitivity of each species during the warm season (May–October) by
examining latewood ring–width variability correlations with climate data. I also
determine if combining tree–ring data from multiple species produces a stronger
climate/growth signal than individual species chronologies, thereby improving the
climatic reconstructions. By taking samples from three chosen tree species I seek to
answer the following hypothesis:
• H1 There is no difference in climatic sensitivity between co–occurring
multiple species.
• H2 There is no improvement in climate sensitivity using multiple species.
• H3 Climatic sensitivity among the three species remains temporally consistent
during the study period.

10
CHAPTER II
MANUSCRIPT
Introduction
Dendrochronological studies have traditionally centered on the analysis of one
tree species from either one location (e.g., Guyette and Dey 1997, Rubino and McCarthy
2000, Stambaugh and Guyette 2004, Harley et al. 2011, Knapp et al. 2016) or from
multiple locations (Salzer and Hughes 2006, Salzer et al. 2009, Knapp et al. 2014).
Recently, several studies (e.g., Maxwell et al. 2011, Maxwell et al. 2014, LeBlanc and
Stahle 2015, Maxwell and Harley 2017) have attempted to improve climate/radial growth
relationships by using multiple–species chronologies comprised of hardwoods and
softwoods (Estes 1970, García–Suárez et al. 2001, Fraver and White 2005). This study
examines the benefit of using multiple species from a geographically limited location to
determine the utility of using multiple co-occurring species in climactic reconstructions.
Hardwood trees are angiosperm broad–leaved trees with most midlatitude species
being deciduous. Softwoods are gymnosperms with most species being evergreen,
coniferous trees. In many midlatitude locations, hardwoods and softwoods co–occur, thus
providing a potential opportunity to develop a statistically relevant mixed species
chronology with a strong climate/growth signature. Several of these studies (García–
Suárez et al. 2001, Fraver and White 2005) examined the mechanisms by which both
angiosperm and gymnosperm trees react to the precipitation changes throughout the year.

11
While the mechanisms that spur growth differ between angiosperms and gymnosperms,
García–Suárez et al. (2001) showed that both tree groups show detectable reactions to
anthropogenic climate change.
Here I examine the correlation between different climactic variables with multiple
species of trees sampled from an 83.8 ha old–growth stand of mixed
coniferous/hardwood forest in the Uwharrie Mountain foothills known as the Nichols
Tract. Two softwood species— longleaf pine (Pinus palustris Mill.) and shortleaf pine
(Pinus echinata Mill.) were dendrochronologically sampled along with one hardwood
species, post oak (Quercus stellata Ashe). Each of the three species has been used
extensively in dendrochronological studies, yet to my knowledge not as a combined
dataset.
Analysis of population growth and decline is fundamental to the study of an
ecology. (Cole 1954, and Slobodkin 1964) The longleaf pine and shortleaf pine are
important resources in the sourtheastern United States and could be impacted by
increasing changes to the global climate. (Iverson et al. 1999 and Bhuta et al. 2009) To
understand the changing response of the trees that form the base of the ecology in the
Nichols Tract, this study will examine change in the climate/growth relationship over
time. Identifying the change in the climate/growth relationship over time can help
identify changes in the local environment that can impact the ecology of the area.
(Francis et al. 1998)
Given the potential value of working with multiple species to develop a better
climate/radial growth response helpful for climatic reconstructions, in this research I

12
evaluate the viability of using these three species to determine: 1) which species has the
best climatic sensitivity; 2) if climatic sensitivity increases when individual chronologies
are combined; and, 3) if this climatic sensitivity is temporally variable over the study
period of 1935–2017.
Methodology
Site Selection
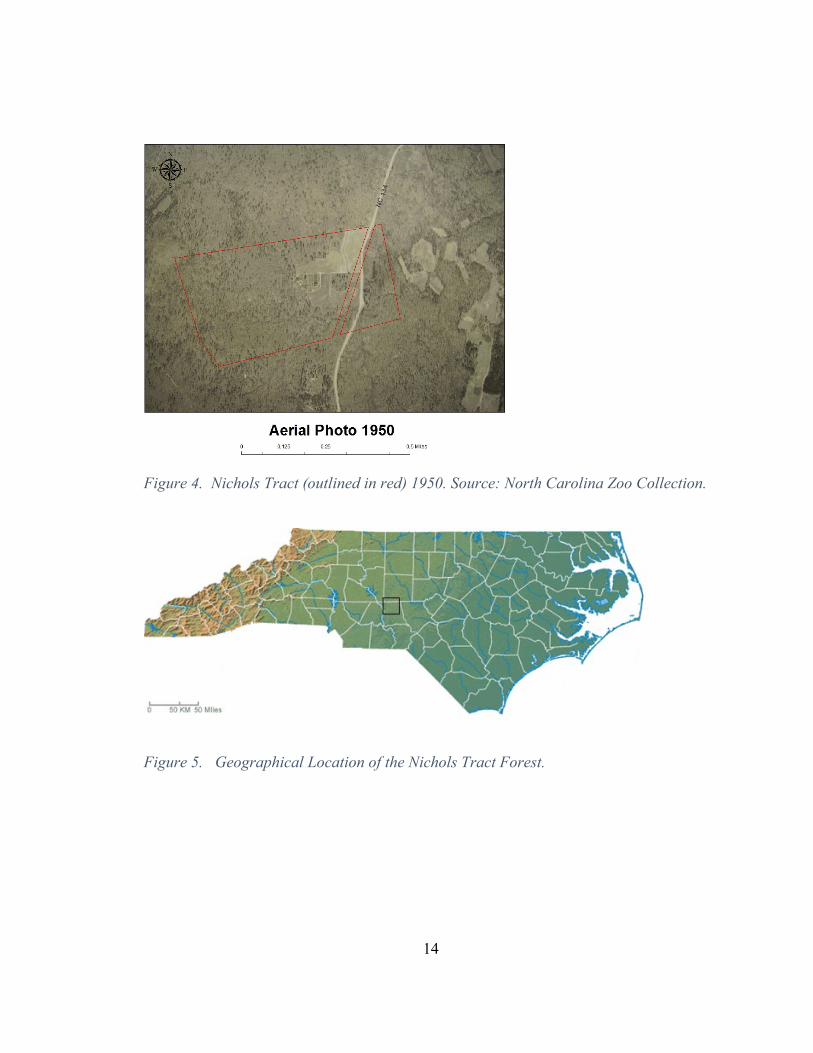
Tree–ring data were collected from the Nichols Tract, (35.458126, –79.870586) in
central North Carolina 11.91 km north of Troy (Figure 4). The Nichols Tract is .838 km2
located in the Piedmont Province (Figure 5). Elevation of the site ranges between to 175
m to 200 m. The site was selected based on the presence of native old–growth post oak,
longleaf pine and shortleaf pine trees. The soil composition of the site is a mixture of
Georgia silt loams (51.9%), Herndon silt loams (45.2%) and Biscoe-Secrest complex
(2.9%) (Soil Survey Staff 2018). The site is currently maintained by the North Carolina
Zoo and has been undergone prescribed burns for the last 10 years. Prior to the North
Carolina Zoo’s conservatorship, the Nichols Tract was the homestead of the Nichols
family, who maintained a farm on the land prior to the transfer of ownership to the North
Carolina Zoo.
A minimum of fifteen trees for each species were selected based on older–age
characteristics with two samples from each tree collected. These samples were combined
with previous samples collected from this site. Collection indicates that tree age is species
specific, with shortleaf pine trees not exceeding 100 years due to selective logging. Due
to this selective logging the shortleaf pine trees were sampled indiscriminately.

13
Conversely, approximately one–third (36%) of the post oak and longleaf pine individuals
exceed 130 years. Samples were selected from between twenty to thirty visibly healthy
trees. Trees that exhibited turpentine scars, visible rot or fire damage above sampling
height were avoided. For each tree, basal diameter (cm) was taken at chest height using a
DBH tape. Tree height (m) was measured with a laser range finder. Each tree’s location
was recorded using a handheld Global Positioning System. Two samples were taken from
each tree where possible from the opposite sides. Cores were extracted using a 5.15–mm
diameter Haglof increment borer (Figure 6). For results to be considered “significant” for
this study the p-value for a correlation between growth/climate must have been less than
0.05.
14
Figure 4. Nichols Tract (outlined in red) 1950. Source: North Carolina Zoo Collection.
Figure 5. Geographical Location of the Nichols Tract Forest.

15
Figure 6. Haglof Increment Borer Used to Collect Core Samples.
Processing
All samples were dried a minimum of 24 hours before mounted into wooden
bases and sanded with progressively finer grit from 100 um to 1000 um sandpaper until
cell structure became visible to assist with accurate measurements. Once samples were
sanded, they were crossdated using the list method (Yamaguchi 1990) and compared with
a local established chronology of the same species.
Following initial crossdating, the samples were scanned into WINDENDRO™, a
program used to analyze annual tree–ring width, at a minimum resolution of 1,800 dpi
(EPSON, Expression 10000XL) and digitally crossdated. Measurements of latewood
obtained from WINDENDRO™ were then processed through the program COFECHA
(Holmes 1983, Grissino–Mayer 2001) to verify crossdating accuracy. When COFECHA
flagged cores indicating a potential crossdating errors, those samples were manually
checked and adjusted as appropriate. COFECHA produces an interseries correlation

16
value that represents the extent of crossdating agreement between samples (i.e., cores),
with higher values indicating higher agreement and a minimum acceptable interseries
correlation of 0.50 (Schweingruber 1988). Each of the chronologies exceeded the
minimum threshold and were individually standardized with ARSTAN before combined
datasets were created for a total of seven raw ring–width chronologies (Table 1).
Table 1. Common Names, Binomial Abbreviation and Chronologies Used for Analysis.
Common name Chronology name Groupings Longleaf pine PIPA PIPA Shortleaf pine PIEC PIEC Post oak QUST QUST Longleaf and shortleaf PIPA x PIEC PINES Longleaf and post oak PIPA x QUST PIPA_QUST Shortleaf and post oak PIEC x QUST PIEC_QUST Longleaf, shortleaf, and post oak PIPA x PIEC x QUST COMBO
Standardizing and Statistical Analysis
In comparison to totalwood and earlywood, latewood (ring growth that is
principally formed during June–August) is more sensitive to changes in seasonal climate
and is increasingly utilized in dendroclimatic studies (Meko and Baisan 2001). Coile
(1936), Devall et al. (1991), and Henderson and Grissino-Mayer (2009) found latewood
to exhibit greater climate sensitivity. This analysis was used at the Nichols Tract,
preliminary results, and later results confirmed that latewood crossdated better than
earlywood or total wood. Thus, my analysis was based on latewood growth/climate
responses during the warm season months, May–October. These months were chosen to

17
evaluate the impact on correlations between the growth/climate signal while using
multiple co-occurring tree species outside the standard analysis timeframe.
To determine the most climate–sensitive chronologies, I examined three
standardized versions of each chronologies, produced by ARSTAN, (STD, RES and
ARS) as produced by five detrending options (Friedman’s Super Smoother, Negative
Exponential, Cubic Spline 33%, Cubic Spline 50% and Cubic Spline 66%). Each
detrending option use slightly difference weighting procedures to produce a chronology
that best reflects the local environmental characteristics such as tree density and
disturbance frequency. Each of the three latewood chronologies generated by the five
standardizing methods (n= 15) were then correlated (Pearson’s r) against monthly PDSI,
PHDI, and Palmer “Z” indices, monthly precipitation, and monthly minimum
temperature and maximum temperature data from North Carolina Divisions 4 and 5
(NCDC 2018) as the Nichols Tract is located in climate division 5, but near climate
division 4. The resulting three latewood chronologies (PIPA, PIEC, and QUST) used for
further analysis were from the STD output generated using Cubic Spline 50%, detrending
using PDSI data as the climate variable. This combination produced the strongest
preliminary climactic correlations. Since PDSI is an index that measures the relative
moisture content of the soil (Palmer 1965, Alley 1984) this study uses the PDSI index as
a climate proxy.
Standardized values of each species chronology were also combined (Table 1) to
determine if merged chronologies exhibited greater climate sensitivity than single
chronologies. For this study I found stronger correlations using an average of
18
standardized values as established by Patterson (2011) and thus, analysis of
climate/growth responses for the combined chronology followed this methodology, as
opposed to than merging the raw data. I also evaluated the subsample single strength for
each chronology, a measure of when sample size is sufficient to analyze (Wigley et al.
1984) for the three species. While both post oak and longleaf pine had longer periods of
significant sample depth dating to the 1800s, most shortleaf pine trees did not exceed 100
years due to selective logging. The EPS values indicated sufficient correlations between
climate and growth starting in the mid 1930’s, thus, all analyses were based on the period
1935–2017.
Seven chronologies (Table 1) were evaluated to establish how the relationship
between ring–width growth and PDSI has evolved through time, the standardized data
were correlated in R, using the TreeCLIM package to create a 30–year moving window
selecting the previous January through December PDSI data along with the current–year
PDSI data. The 30–year window was selected to meet the minimum statistical threshold
of n = 30 and was a compromise between creating a window that resulted in meaningful
correlations and the ability to have a sufficient number of windows to illustrate any
change detectable (Lloyd and Bunn 2007).
Results
Descriptive Statistics of Individual Species
Longleaf PINE (PIPA)
Latewood PIPA correlations with PDSI (Table 2) were significant (p < 0.05) for
this site during August (0.270), September (0.245) and October (0.220) with p–values of

19
0.013, 0.026 and 0.045 respectively. The PIPA correlations measured by this paper
paralleled other analysis done at this site (Patterson et al. 2016) and support notion that
latewood growth is dependent on late–summer PDSI.
Table 2. Pearson Correlations and p-values of Single Species Climatic Response for PDSI.
Trees Analysis MAY JUN JUL AUG SEP OCT
PIPA Pearson Correlation 0.168 0.027 0.209 *0.270 *0.245 *0.220
Sig. (2–tailed) 0.129 0.809 0.058 0.013 0.026 0.045
PIEC Pearson Correlation 0.174 0.071 0.197 *0.273 *0.261 *0.260
Sig. (2–tailed) 0.115 0.525 0.075 0.013 0.017 0.018
QUST Pearson Correlation **0.369 **0.539 **0.512 **0.436 *0.275 0.118
Sig. (2–tailed) 0.001 0 0 0 0.012 0.286
* Indicates confidence levels of ≤ 1% ** Indicates confidence levels of ≤ 1%
This chronology also supports the results of Henderson and Mayer (2009) in that
both studies have similar interseries correlations, average mean sensitivity, and high
correlations between longleaf pine growth and PDSI from same year spring and summer.
Shortleaf Pine (PIEC)
Shortleaf pine correlations (Table 2) were significant during August (0.273),
September (0.261) and October (0.260) with p–values of 0.013, 0.017 and 0.018
respectively. The PIEC correlations measured by this paper reflect that latewood growth
is dependent on summer PDSI similar to PIPA. Given the similarity of these two species,
this result is expected. The results from this study are not consistent with the findings of

20
Grissino–Mayer and Butler (1993) who examined shortleaf pine climate reconstructions.
Grissino–Mayer and Butler (1993) showed the strongest climate/growth correlations
starting in May and ending in July. This study indicates that the climate/growth
relationship is starting later, according to this study as late as August and extending into
October.
Post Oak (QUST)
Latewood QUST correlations (Table 2) were statistically significant for this site
during the warm months of May (0.369), June (0.539), July (0.512), August (0.436), and
September (0.275) with p–values of 0.001, <0.001, <0.001, <0.001, and 0.012
respectively. The results of the individual species chronology QUST, supports the results
by White et al. (2011). Preliminary analysis of this species for this project revealed a high
interseries correlation (r > 0.6) on first dating indicating the sample trees all reflected the
same environmental stresses. (Speer et al 2002, White et al. 2011) This formed the initial
comparison database by which all other species were cross–referenced for dating
accuracy.
Descriptive Statistics of Combined Species
The combined groupings, except for the PINES chronology, showed significant
correlations during the months of May through October for the datasets evaluating PIPA
with QUST and the three–species dataset (Table 3).

21
Table 3. Pearson Correlations of Combined Species Climatic Response PDSI.
Trees Analysis MAY JUN JUL AUG SEP OCT
PINES Pearson Correlation 0.18 0.051 0.214 **0.286 *0.267 *0.253
Sig. (2–tailed) 0.103 0.646 0.052 0.009 0.015 0.021
PIPA_QUST Pearson Correlation *0.277 0.199 **0.362 **0.396 **0.320 .246*
Sig. (2–tailed) 0.011 0.071 0.001 0 0.003 0.025
PIEC_QUST Pearson Correlation **0.284 *0.244 **0.352 **0.398 **0.334 .281*
Sig. (2–tailed) 0.009 0.026 0.001 0 0.002 0.01
COMBO Pearson Correlation *0.243 0.147 **0.302 **0.359 **0.311 .269*
Sig. (2–tailed) 0.027 0.185 0.006 0.001 0.004 0.014
* Indicates confidence levels of ≤ 1% ** Indicates confidence levels of ≤ 1%
The PINES chronology achieved significance during the months of August
(0.286), September (0.267) and October (0.253). with only October having a higher
correlation value than the QUST chronology (Tables 3 and 4). The PIEC with QUST
chronology achieved significance for the months of May through October 0.284, 0.244,
0.352, 0.398, 0.334, 0.281 respectively. Though only the months of May and October
showed an increase in sensitivity above what could already be established by the QUST
chronology alone (Table 3 and 4).
Longleaf Pine and Shortleaf Pine
The ability to for PIPA and PIEC to hybridize (Cotton et al. 1975) makes this
combination intuitive. Richter et al. (1991) found that for pine species found in close
proximity of each other can be treated as a single species. Throughout the year, the
correlations for these species (Table 3) maintained a difference that no greater than .04, in

22
most months the correlations were the same value. When this study compared p–values
of the PINES chronology to the p-values of the PIPA and PIEC chronologies the months
where significant correlations were found, the p–values achieved in the combined
chronology were smaller. This indicates a stronger dataset and a reduced chance that the
correlations were spurious. The PINES chronology also performed better than either of
the individual species (PIPA and PIEC) performed independently. Like Maxell et al.
(2011) who found better correlations with similar species groupings, the combined
groupings in this study found marginally higher correlation values with the combined
PINES chronology as compared to the individual chronologies. The correlations in the
PIPA or PIEC chronologies achieved significance starting in August, September and
October, similar to the PINES chronology, but correlations were higher, and p-values
were lower in the PINES chronology, indicating a better climate/growth signal.
Longleaf Pine and Post Oak
One of the combinations examined was PIPA and QUST (Table 3). The combined
datasets (PIPA_QUST) were analyzed and compared against the individual dataset
correlations. For most of the year correlation values dropped; the exception being
October (0.246). The correlations for the month of June dropped below the level
considered to be significant. In contrast to the combined correlations for the year, the
months of September and October show higher correlations than either the PIPA or the
QUST independently. This increased correlation occurs only during these two months
and can help to extend the growth–climate relationship later into the year where it was
not possible prior to grouping.

23
Table 4. Correlations and p–values.
Correlations p–values Tree SEP OCT SEP OCT PIPA 0.245* 0.220* 0.026 0.045 PIEC 0.261* 0.260* 0.017 0.018 SPO 0.275* 0.118 0.012 0.286 PINES 0.267* 0.253* 0.015 0.021 PIPA_SPO 0.320** 0.246* 0.003 0.025 PIEC_SPO 0.334** 0.281* 0.002 0.01 COMBINED 0.311** 0.269* 0.004 0.014
* Indicates confidence levels of ≤ 1% ** Indicates confidence levels of ≤ 1%
Evaluating p–values for the combined dataset against the p–values for the
independent species, the confidence only improves for the months of September and
October (Table 4). The combined p–values for September was 0.003, compared to a
PIPA p–value of 0.026 and a QUST p–value of 0.012. October p–values offer better
confidence in climate–growth correlations, as the QUST had a p–value of 0.286, outside
the point at which correlations are considered significant. The PIPA p–value for October
was 0.220 and is significant. When the combined dataset is evaluated the p–value for
October is 0.025 which shows that combining PIPA and QUST can not only help
evaluate PDSI related growth during these months but also to increase the confidence
level in those results.
Shortleaf Pine and Post Oak
When the combination of PIEC with QUST was analyzed (Table 3) a similar
trend was found as the combination of PIPA and QUST. The only relevant months that

24
showed an increase in correlations and confidence were September and October (Table
4). Correlation measurements for PIEC for September and October were 0.261 and 0.260
respectively. The QUST correlations for September and October were 0.275 and 0.118.
Combined correlations for September and October were 0.334 and 0.281.
P–values for these months (Table 4) also reflect a higher confidence level when
compared against individual species p–values. Comparing the PIEC p–values of 0.017
and 0.018 for September and October and the QUST p–values of .012 and .0286 against
the combined dataset showed p–values for September and October of 0.002 and 0.01.
This indicates a higher confidence for the later months correlations between growth and
PDSI.
Longleaf Pine, Shortleaf Pine and Post Oak
When the combination of PIPA, PIEC and QUST were analyzed (Table 3), a
similar trend was found as the two previous combinations of PIPA and QUST, PIEC, and
QUST. The only relevant months that showed an increase in correlations and confidence
were September and October (Table 4). Correlations measurements for the combined
dataset for September and October were 0.311 and 0.269, compared with the PIPA
chronology correlations of September and October of 0.245 and 0.220, the PIEC
chronology correlations 0.261 and 0.260 and the QUST chronology correlations of 0.275
and 0.118. This is in keeping with García–Suárez et al. (2009) who found that when
comparing combined chronologies there was an overall reduction in correlation with
PDSI for the months August–November as compared with the single species chronology,
the only notable exceptions being September and October. The correlations in this study

25
are similar to the correlations found in that study until the early 1990s, however, the
study window for García–Suárez ended in 1992, this study shows a reduction in the
climate/growth relationship after this time period.
P–values for these months also reflect a higher confidence level when compared
against individual species p–values (Table 4). Comparing September and October PIPA
chronology p–values of 0.025 and 0.045, PIEC chronology p–values of 0.017 and 0.018
and QUST chronology p–values of .012 and .0286 against the COMBO chronology
showed p–values for September and October of 0.004 and 0.014. This supports the
indication that a higher confidence for the later month’s correlations between growth and
PDSI is observed.
Descriptive Statistics of Temporally Consistency Analysis
To examine the changing nature of each species sensitivity to climate trends over
time, each species chronology was run through a thirty–year moving window using the
statistical package TreeCLIM within R. Starting at 1935, the starting year for this study,
correlations were analyzed in thirty–year segments moving forward each year until 2017,
the last year of the study. The correlation values were illustrated in a chromatic moving
window that allows for visual interpretation of the change over time. Correlations that
meet the minimal confidence level (p <0.05) are notated with an asterisk.
Longleaf Pine
The analysis of the PIPA series in the 30–year moving (Figure 7) window shows
correlations between PDSI and latewood growth. Growth and Climate correlations from

26
the first window, 1935–1965, show different responsiveness to seasonal growth as
compared to the last window, 1988–2017 (Table 5).
Table 5. Net Change of Climate/Growth Relationship Over Time: Positive, No Change or Negative.
PIPA May Positive June NC July NC August NC September Negative October Negative
Though most months showed no significant changes over the span of the analysis,
only September and October had values that were significant at the early period and lost
that significance by the late period. September and October correlations with PDSI
started positive and ended lower, resulting in an overall negative trend. There is an
observable trend, starting in the 1960’s, that shows correlations increasing over time,
these correlations do not reach the level needed to be considered significant, and the trend
of stronger correlations fades over the second half of the timespan.

27
Figure 7. 30–year Running Window for the Longleaf Pine. The initial period is 1935–1964 and the last period is 1988–2017 (n=53). “PDSI-curr.” indicates current year PDSI values of the month mentioned.
This indicates that the growth climate relationship is malleable and becoming
weaker over the length of this study for this species, this supports the García–Suárez et al.
(2009) study which took place in Ireland. Like that study these changes reflect possible
changes in sample size variations, changing climate patterns, or changing CO2 levels,
though further studies will be needed to confirm the impacts of these factors. This
analysis only examined current year PDSI impacts.

28
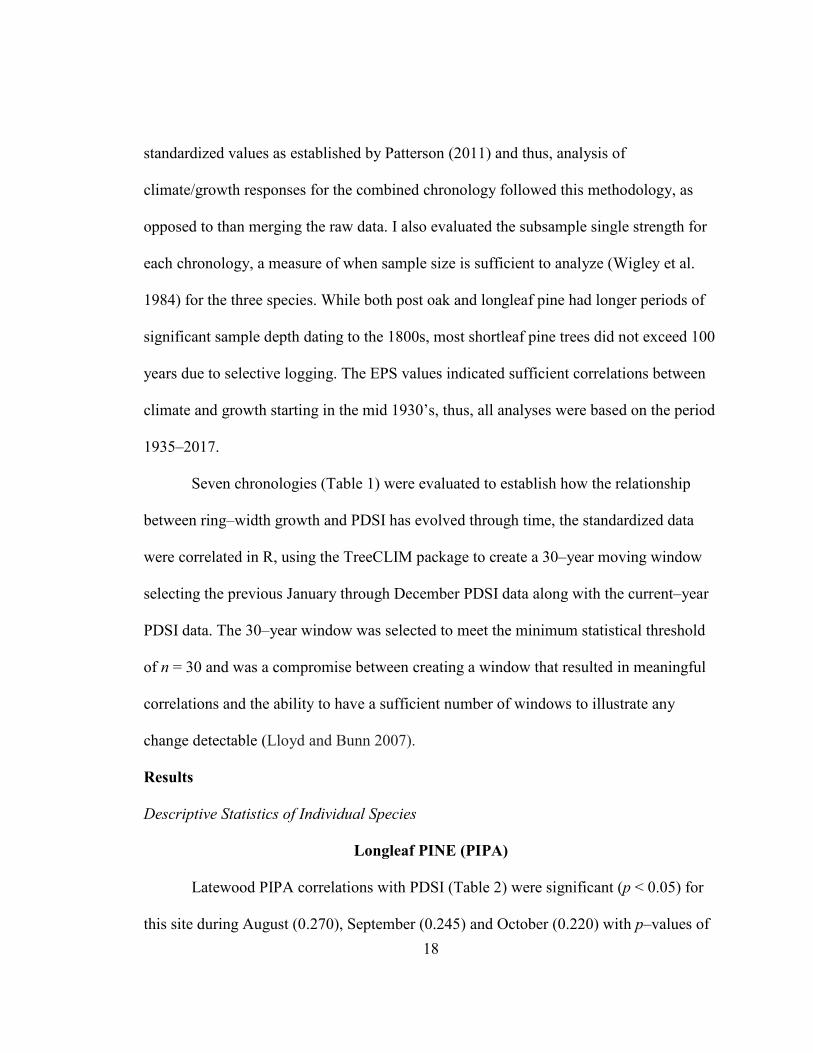
Shortleaf Pine
Correlations across time (Figure 8) for the PIEC were stronger than the PIPA. The
analysis of the PIEC series in the 30–year moving window show a series wide positive
correlation between PDSI and latewood growth during the months of September, and
October when correlated with PDSI. Though most months showed changes over the span
of the analysis, only September and October had values that were significant at the early
periods (1935-1964) and lost that significance by the late periods (1988-2017). (Table 6)
September and October correlations started positive and ended lower, resulting in a net
negative trend.
Table 6. Net Change of Climate/Growth Relationship Over Time: Positive, No Change or Negative.
SLP May NC June NC July NC August NC September Negative October Negative
Like the PIPA this indicates that the climate/growth relationship is weakening.
This also supports the García–Suárez et al. (2009) study who found similar results in
scots pine (Pinus sylvestris).
29
Figure 8. 30–year Running Window for the Shortleaf Pine. The initial period is 1935–1964 and the last period is 1988–2017 (n=53).
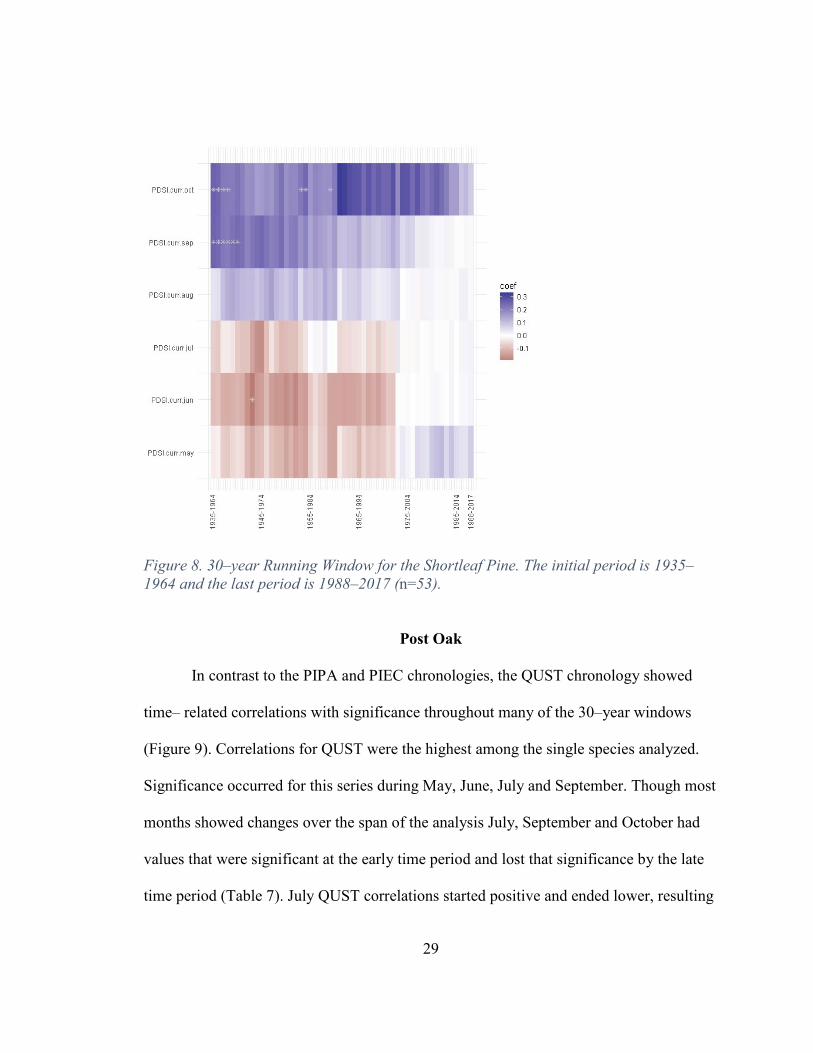
Post Oak
In contrast to the PIPA and PIEC chronologies, the QUST chronology showed
time– related correlations with significance throughout many of the 30–year windows
(Figure 9). Correlations for QUST were the highest among the single species analyzed.
Significance occurred for this series during May, June, July and September. Though most
months showed changes over the span of the analysis July, September and October had
values that were significant at the early time period and lost that significance by the late
time period (Table 7). July QUST correlations started positive and ended lower, resulting

30
in an overall negative trend. September and October in contrast started out with
significant negative correlations and lost that significance, resulting in a positive trend.
August had early correlations that lacked significance that became significant in the later
period. The QUST chronology indicates that the post oak is the most sensitive to the
climate/growth relationship as established by the PDSI values in this study. From early to
late this study found that August has gained sensitivity in the later period and September
and October lost sensitivity, indicating a longer growing season for the QUST. This
contrasts with what Rubino and McCarthy (2000) found. This could be due to either the
selection of 30 years for analysis of the moving window, or due to correlations for this
species occurring in the timeframe after the Rubino and McCarthy (2000) study.
Table 7. Net Change of Climate/Growth Relationship Over Time: Positive, No Change or Negative.
SPO May NC June NC July Negative August NC September Positive October Positive

31
Figure 9. 30–year Running Window for the Post Oak Series. The initial period is 1935–1964 and the last period is 1988–2017 (n=53).
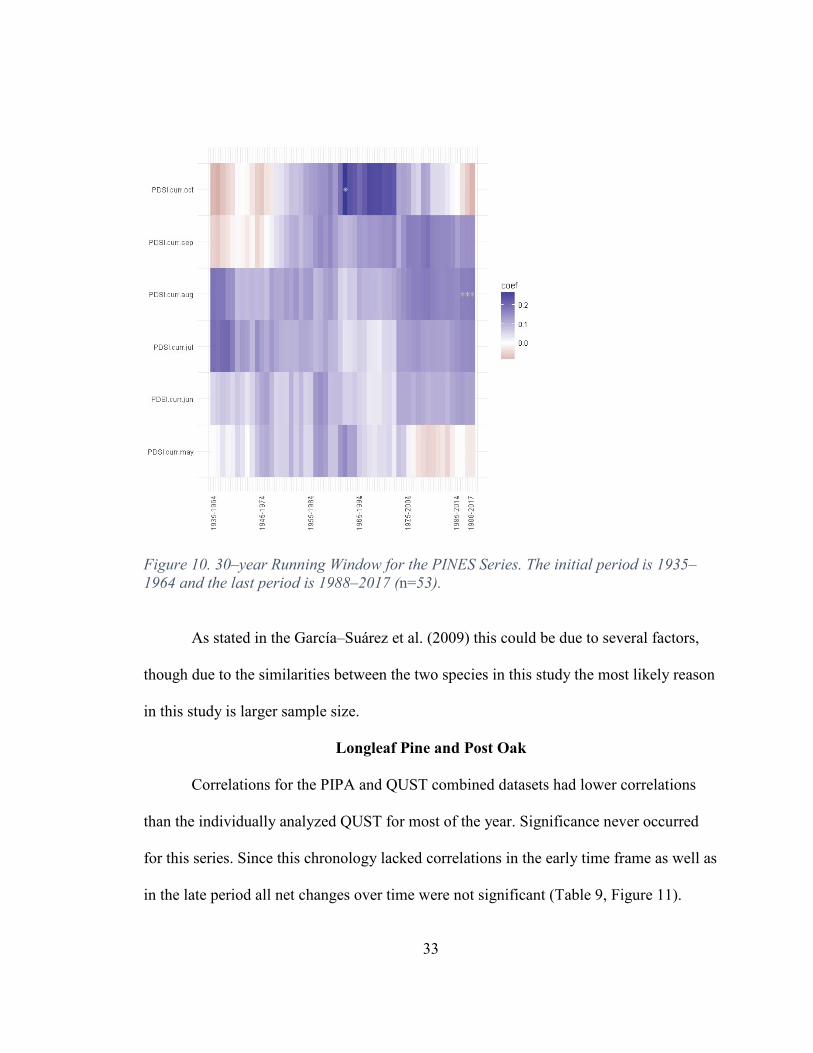
Longleaf Pine and Shortleaf Pine
Correlations for the PIPA and PIEC combined datasets (Figure 10) were the better
than either of the single species analyzed independently. Significance occurred for this
series during July and August. Early time frames for August had no significance and later
gained significance resulting in a net positive trend in correlations for the month of
August. (Table 8) The PINES chronology reflected a similar trend as is found in the
QUST chronology in that sensitivity is gained in August when multiple species are

32
combined, which supports the conclusion that adding multiple species can increase the
sensitivity in establishing a climate/growth relationship.
Table 8. Net Change of Climate/Growth Relationship Over Time: Positive, No Change or Negative.
PINES May NC June NC July NC August NC September NC October NC
33
Figure 10. 30–year Running Window for the PINES Series. The initial period is 1935–1964 and the last period is 1988–2017 (n=53).
As stated in the García–Suárez et al. (2009) this could be due to several factors,
though due to the similarities between the two species in this study the most likely reason
in this study is larger sample size.
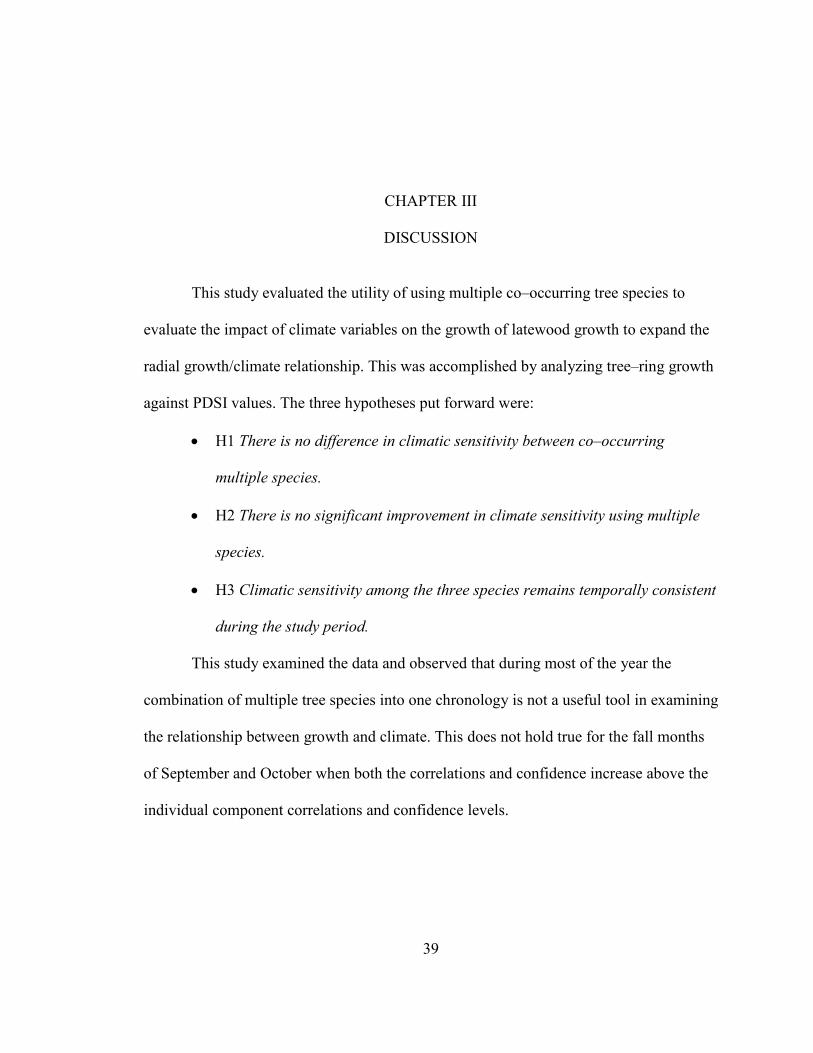
Longleaf Pine and Post Oak
Correlations for the PIPA and QUST combined datasets had lower correlations
than the individually analyzed QUST for most of the year. Significance never occurred
for this series. Since this chronology lacked correlations in the early time frame as well as
in the late period all net changes over time were not significant (Table 9, Figure 11).

34
Table 9. Net Change of Climate/Growth Relationship Over Time: Positive, No Change or Negative.
LLP_SPO May NC June NC July NC August NC September NC October NC
Figure 11. 30–year Running Window for the Longleaf Pine and Post Oak Series. The initial period is 1935–1964 and the last period is 1988–2017 (n=53).

35
Shortleaf Pine and Post Oak
Correlations for the PIEC and QUST combined datasets (Figure 12) had higher
correlations than the PIPA and QUST for most of the year. PDSI showed growth and
climate correlations with significance occurring for this series during August and
October. Early timeframes for August had no significance and later gained significance.
Thus, this chronology showed a net positive trend in correlations for the month of
August. (Table 10) The PIEC_QUST chronology and the PINES chronology reflect
similar changes in sensitivity across the timespan of this study; these changes are not
found in the PIPA_QUST chronology. This indicates that the increase in sensitivity found
in combining chronologies is due to the addition of the PIEC species.
Table 10. Net Change of Climate/Growth Relationship Over Time: Positive, No Change or Negative.
4SLP_SPO May NC June NC July NC August Positive September NC October NC

36
Figure 12. 30–year Running Window for the Shortleaf Pine and Post Oak Series. The initial period is 1935–1964 and the last period is 1988–2017 (n=53).
Longleaf Pine, Shortleaf Pine and Post Oak
The analysis of the COMBO series in the thirty–year moving window shows
correlations between latewood growth and PDSI (Figure 12). However, the only
correlations showing significance were September and October. The correlations for the
COMBO chronology were smaller than correlations produced by the PIEC_QUST
chronology. Growth and climate correlations from the first window, 1935–1965, show
different responsiveness to seasonal growth as compared to the last window, 1988–2017.
Early timeframes for September and October had correlations with significance and later

37
lost that significance. Thus, this chronology showed a net negative trend in correlations
for the months of September and October. (Table 11) This indicates that the COMBO
chronology reflects overall losses in sensitivity in the climate/growth relationship.
Table 11. Net Change of Climate/Growth Relationship Over Time: Positive, No Change or Negative.
COMBO May NC June NC July NC August NC September Negative October Negative

38
Figure 13. 30–year Running Window for the COMBO Series. The initial period is 1935–1964 and the last period is 1988–2017 (n=53).
39
CHAPTER III
DISCUSSION
This study evaluated the utility of using multiple co–occurring tree species to
evaluate the impact of climate variables on the growth of latewood growth to expand the
radial growth/climate relationship. This was accomplished by analyzing tree–ring growth
against PDSI values. The three hypotheses put forward were:
• H1 There is no difference in climatic sensitivity between co–occurring
multiple species.
• H2 There is no significant improvement in climate sensitivity using multiple
species.
• H3 Climatic sensitivity among the three species remains temporally consistent
during the study period.
This study examined the data and observed that during most of the year the
combination of multiple tree species into one chronology is not a useful tool in examining
the relationship between growth and climate. This does not hold true for the fall months
of September and October when both the correlations and confidence increase above the
individual component correlations and confidence levels.

40
Hypothesis 1
The first hypothesis tested in this study is to determine if there is a difference in
climatic sensitivity between chronologies created from a single species of tree as
compared to chronologies created from multiple co–occurring tree species. To evaluate
differences between chronologies, this study considered months in which an individual
species reflected no significant correlations for a given month in the climate/growth
relationship as reflected in p-values and compared it against combined chronologies. If,
in the combined chronology, stronger correlations were found, these months were
considered to negate the hypothesis that there is no difference in climate sensitivity
between co-occurring species. In evaluating individual species, the species that had the
highest interseries correlations was post oak. When compared to longleaf pine and
shortleaf pine, post oak interseries correlations were stronger overall. In addition to
higher correlations post oak also had lower p–values, and fewer flagged cores during
initial crossdating. The correlations for post oak thus became the baseline to determine if
a higher correlation could be achieved by combining the species. Hypothesis 1 is
determined to be false. For most of the warm season post oak correlations are higher than
combined correlations, however, with the addition of shortleaf pine, sensitivity for the
months of September and October increased, thus indicating that there is a difference in
climate sensitivity when using multiple tree species to evaluate climate change. Both pine
species reflected a higher growth/climate relationship when paired with the post oak,
however the younger shortleaf pines increased the climate signal more than the older
longleaf pines, this contrasts with Vieira et al. (2009), whom found that younger trees,

41
similar to the shortleaf pine trees that make up the PIEC chronology, tend to reflect
climactic stresses in earlywood rather than latewood, as is observed by older trees. The
results in this study support studies from that indicate it is the size of the tree, rather than
age that is relevant (Mencuccini et al. 2005; Peñuelas 2005).
Maxwell et al (2015), found significant improvements when using multiple
species to create a chronology for the area, this study also increases the climate signal
when using multiple species in a single chronology. Maxwell et al (2015) used principal
component analysis to combine datasets, while this study used the Patterson et al (2014)
method of averaging standardized datasets. Though the increases in climate signal
expands the window by adding September and October rather than increase the
established years signal as found by Maxwell et al (2015). This is of limited utility as
most studies focus on June, July and August precipitation values. This study expands that
timeframe to include September and October.
Hypothesis 2
The second hypothesis tested in this study was that there is no improvement in
climate sensitivity using multiple species. Richter et al (1991) found that pine species,
located near each other, can be treated as a single species. The PINES chronology is
composed of two pine species that fit this description. Increased interseries correlations
are observed in all combination chronologies. However, when all three species are
combined, stronger correlations are observed as compared to individual species only for
the months of September and October. Comparisons made between the three species
combined datasets (COMBO) against the two species datasets (PINES, PIPA_QUST

42
AND PIEC_QUST) it is observed that the best correlations for a climate relationship
occurred with the combination of shortleaf pine and post oak. Comparing climate growth
correlations found in the PINES chronology (to account for sample size variation) to the
climate growth correlations found in the PIEC_QUST this combination indicates that
hypothesis 2 is false as the combination of shortleaf pine and post oak proved not only to
provided stronger correlations but confidence levels were also higher due to the lower p–
values, furthermore the increased sensitivity can be attributed to the presence of the
hardwood angiosperm post oak. Maxwell et al. (2015) used two species of oak, Q. alba
and Q. rubra, and one species of tulip, L. tulipifera, to evaluate co-occurring tree species,
this study used only one. For that species, confidence and correlation values are similar to
Maxwell et al. (2015) until the species are combined. Maxwell et al. (2015) used
principal component analysis to achieve better correlations, and according to Maxwell are
due to the different species climate/growth responses being combined to give a better
overall analysis of the climate signals. The departure in results occurs in September and
October with the addition of either pine species, shortleaf pine being the preferred
species. The use of principal component analysis by Maxwell et al. (2015) does provide a
higher magnitude for correlations inherent in the climate/growth across the JJA
timeframe, but the Patterson et al. (2014) method extends the climate/growth relationship
laterally throughout the year, the JJASO timeframe.
Hypothesis 3
The change in the climate/growth relationship has been used for paleo-
environmental studies and climate reconstructions, (Mann et al. 1998, Esper et al. 2002)

43
as well providing the initial guideline information to predict local ecological changing
dynamics related to the climate change. (Rathgeber et al. 2000 and Beniston 2002) The
third hypothesis tested was to determine if climatic sensitivity among the three species
remains temporally consistent during the study period. All chronologies reflected a
change in the climate/growth relationship, thus this hypothesis is null.
The longleaf pine chronology and the shortleaf pine chronology both showed
similar responses across the period of September and October. Both species had
significant correlations that were lost as the 30–year window moved through time. The
post oak chronology showed three months where significance was lost moving from the
early period to the late period, the months being July, September and October. The post
oak also gained and lost statistically significant correlations in between the starting and
ending period of this study. This chronology also gained significance moving from the
early time frame to the later timeframe during the month of August. This chronology did
show that there was a period during the moving window where significance was gained
and then lost. The analysis of the data in this study negates the hypothesis that climatic
sensitivity among the three–species studied remains temporally consistent. The reduction
in temporal stability is consistent with what Maxwell et al. (2015) found.
44
CHAPTER IV
CONCLUSIONS Several findings emerge from these analyses. First is that when available, post oak
should be considered the primary source for late–season drought reconstruction studies in
central North Carolina and potentially elsewhere. The post oak, across all datasets,
showed the best correlations to PDSI in this study, when evaluating the entirety of the
QUST chronology. Correlations of the post oak were only superseded with the addition
either the longleaf pine or the shortleaf pine species, with shortleaf pine having the bigger
impact on correlations and p–values and only during September and October. Second,
stronger correlations were present during September and October. These months show
declining correlations among the single species correlations, so for studies that wish to
extend growth and climate correlations outside the summer season the use of a
chronology with both post oak and shortleaf pine provide the best correlations and p–
values. Third, combining multiple species to enhance climate/growth responses may not
be an effective method in this mixed forest conditions of central NC.
Finally, caution must be placed on assuming climate/growth relationships remain
temporally stable. My results suggest considerable fluctuations since 1935 suggesting
that other exogeneous factors (e.g., fire, elevated atmospheric CO2, selective logging)

45
also are critically important to the climate/growth relationship and that this relationship is
changing over time similar to the findings of Rubino and McCarthy (2000).
46
REFERENCES
Alley, W.M. 1984, The Palmer Drought Severity Index: limitations and assumptions. Journal of Climate and Applied Meteorology, 23: 1100–1109.
Beniston M. 2002, Climate modelling at various spatial and temporal scales: where can dendrochronology help? Dendrochronologia 20:117–132.
Black, B. A., Boehlert, G. W., and Yoklavich, M. M. 2008, Establishing climate–growth relationships for yelloweye rockfish (Sebastes ruberrimus) in the northeast Pacific using a dendrochronological approach. Fisheries Oceanography, 17:5, 368-379.
Bortolot, Z.J., Copenheaver, C.A., Longe, R.L., Van Aardt, J.A.N. 2001. Development of a white oak chronology using live trees and a post–Civil War cabin in south–central Virginia. Tree–Ring Research 57:2, 197–203.
Brockway, D.G., Outcalt K.W., Tomczak DJ., and Johnson E.E. 2005, Restoration of longleaf pine ecosystems, United States Department of Agriculture, General Technical Report SRS–83.
Brockway,D.G., Outcalt K.W. and Wilkins R.N. 1998, Restoring longleaf pine wiregrass ecosystems: plant cover, diversity and biomass following low–rate hexazinone application on Florida sandhills, Forest Ecology and Management, 103, 159–175.
Brockway, D.G., and Lewis, C. E. 2003, Influence of deer, cattle grazing and timber harvest on plant species diversity in a longleaf pine bluestem ecosystem. Forest Ecology and Management, 175:1-3, 49-69.
Brubaker, L.B. 1986, Responses of tree populations to climatic change. Vegetatio, 67:2, 119-130.
Bhuta, A.A., Kennedy, L.M., and Pederson, N. 2009, Climate-radial growth relationships of northern latitudinal range margin longleaf pine (Pinus palustris P. Mill.) in the Atlantic coastal plain of southeastern Virginia. Tree-Ring Research, 65:2, 105-115.
Burns, R.M., and Honkala, B.H. 1990, Silvics of North America. Volume 1, Conifers. Agriculture Handbook (Washington), 654.
Coile, T.S. 1936, Soil samplers. Soil Science, 42:2, 139-142.

47
Cole, L.C., 1954. The population consequences of life history phenomena. The Quarterly Review of Biology. 29: 103-137.
Cook, E.R., Peters, K. 1981. The smoothing spline: a new approach to standardizing forest interior tree–ring width series for dendroclimatic studies. Tree–Ring Bulletin 41:45–53.
Cook, E.R. 1985, A time series analysis approach to tree–ring standardization, dendrochronology, Forestry, Dendroclimatology and Autoregressive Process, PhD dissertation, University of Arizona, Tucson, 175.
Cotton, M.H., Hicks Jr, R.R., and Flake, R.H. 1975, Morphological variability among loblolly and shortleaf pines of east Texas with reference to natural hybridization. Castanea, 309-319.
DeSantis, R.D., Hallgren, S.W., and Stahle, D.W. 2010, Historic fire regime of an upland oak forest in south-central North America. Fire Ecology, 6:3, 45-61.
De Luis, M., Novak, K., Čufar, K., and Raventós, J. 2009, Size mediated climate–growth relationships in Pinus halepensis and Pinus pinea. Trees, 23:5, 1065-1073.
Drew, MB., Kirkman L.K., Gholson Jr. C. and Angus K. 1998, The vascular flora of Ichauway, Baker County, Georgia: A remnant longleaf pine/wiregrass ecosystem, Castanea, 63: 1, 1–24.
Estes, ET. 1970, Dendrochronology of black oak (Quercus velutina Lam.), white oak (Quercus alba L.), and shortleaf pine (Pinus echinata Mill.) in the Central Mississippi Valley, Ecological Monographs, 40: 295–316.
Francis, R.C., Hare, S.R., Hollowed, A.B. and Wooster, W.S. (1998) Effects of interdecadal climate variability on the oceanic ecosystems of the NE Pacific. Fisheries Oceanography 7:1–21.
Fraver S. and White A.S. 2005, Identifying growth releases in dendrochronological studies of forest disturbance, Canadian Journal of Forest Research, 35: 7.
Frost, C.C. 1993, Four centuries of changing landscape patterns in the longleaf pine ecosystem. In Proceedings of the Tall Timbers fire ecology conference, 18: 17-43.
García–Suárez, A.M., Butler C.J. and Baillie M. 2009, Climate signal in tree–ring chronologies in a temperate climate: a multi–species approach, Dendrochronologia, 27:3, 183-198
Ginter, D.L., McLeod K.W. and Sherrod C. 1979, Water stress in longleaf pine induced by litter removal, Forest Ecology and Management, 2, 13-20.
48
Grissino-Mayer, H.D. and Butler D.R. 1993, Effects of climate on growth of shortleaf pine (Pinus echinata Mill.) in Northern Georgia: A dendroclimatic study, Southeastern Geographer, 33:1, 65–81.
Grissino–Mayer, H.D. 2001, Evaluating crossdating accuracy: A manual and tutorial for the computer program COFECHA, Tree–Ring Research, 57:2, 205–221.
Grissino–Mayer, H.D., and Van de Gevel, S. L. 2007, Tell–tale trees: Historical dendroarchaeology of log structures at Rocky Mount, Piney Flats, Tennessee. Historical Archaeology, 414, 32–49.
Guyer, C., and Bailey, M.A. 1993, Amphibians and reptiles of longleaf pine communities. In Proceedings of the Tall Timbers Fire Ecology Conference 18, :139-158.
Guyette, R.P., and Cutter, B.E. 1991. Tree-ring analysis of fire history of a post oak savanna in the Missouri Ozarks. Natural Areas Journal, 11: 93-99.
Guyette, R.P. and Dey D.C. 1997, Historic shortleaf pine (Pinus echinata Mill.) abundance and fire frequency in a mixed oak – Pine Forest (MOFEP, Site 8), U.S. Department of Agriculture, Forest Service, North Central Forest Experiment Station: 136–149.
Hall, C.A.S., and Day, Jr. J.W. 1977, Ecosystem modeling in theory and practice: an introduction with case histories. Wiley, New York
Harley G.L., Grissino–Mayer H.D., and Horn S.P. 2011 The dendrochronology of Pinus elliottii in the Lower Florida Keys: Chronology development and climate response., Tree–Ring Research, 67:1, 39–50.
Henderson, J.P., and Grissino–Mayer H.D. 2008, Climate–tree growth relationships of longleaf pine (Pinus palustris Mill.) in the southeastern Coastal Plain, USA, Dendrochronologia, 27, 31–43.
Holmes, R.L., 1983, Computer–assisted quality control in tree–ring dating and measurement, Tree–Ring Bulletin, 43:51–67.
Iverson, L.R., A.M. Prasad, B.J. Hale, and E.K. Sutherland. 1999. An atlas of current and potential future distributions of common trees of the eastern United States. General Technical Report NE–265. Northeastern Research Station, USDA Forest Service, Newton Square, Pennsylvania; 245.
Jose, S., Jokela E. and Miller D.L. 2006, The longleaf pine ecosystem: Ecology, silviculture, and restoration, The Longleaf Pine Ecosystem, 3–8.

49
Kabrick J.M., Dey D.C., Jensen R.G., Wallendorf, M. 2008, The role of environmental factors in oak decline and mortality in the Ozark Highlands. Forest Ecology Management 255:1409–1417.
Kantola, A.T., and Humphrey, S.R. 1990, Habitat use by Sherman's fox squirrel (Sciurus niger shermani) in Florida. Journal of Mammalogy, 71: 3, 411-419.
Kirkman, L.K., Goebel P.C., Palik B.J. and West L.T. 2004, Predicting plant species diversity in a longleaf pine landscape, Ecoscience, 11:1, 80–93.
Knapp, P.A., Maxwell J.T. and Soulé P.T. 2015, Tropical cyclone rainfall variability in coastal North Carolina derived from longleaf pine (Pinus palustris Mill.): AD 1771–2014, Climatic Change, 135:311–323.
Landers, J.L., Van Lear D.H. and Boyer W.D. 1995, The longleaf pine forests of the Southeast: Requiem or renaissance? Journal of Forestry, 93: 11, 39–44.
Lawson, E.R., 1990. Pinus echinata Mill. RM Burns 8r BH Honkala (Tech. coords.). Silvics of North America, 1, 316–326.
LeBlanc, D.C., and Stahle D.W. 2015, Radial growth responses of four oak species to climate in eastern and central North America, Canadian Journal of Forest Research, 45:7, 793–804.
LeBlanc, D.C, and Terrell M.A. 2011, Comparison of growth–climate relationships between northern red oak and white oak across eastern North America, Canadian Journal of Forest Research, 40787.
Little, E.L., and Viereck, L.A. 1971, Atlas of United States Trees, 5: US Dept. of Agriculture, Forest Service.
Lloyd, A.H., and Bunn, A.G. 2007, Responses of the circumpolar boreal forest to 20th century climate variability. Environmental Research Letters, 2: 4, 045013.
Mann, D.F. 2002, The Dendroarchaeology of the Swaggerty Blockhouse, Cocke County, Tennessee (Doctoral dissertation, University of Tennessee, Knoxville).
Martin, P.S., Robins, C.R., and Heed, W.B. 1954, Birds and biogeography of the Sierra de Tamaulipas, an isolated pine-oak habitat. The Wilson Bulletin, 38-57.
Maxwell, R.S, Hessl A.E, Cook E.R. and Pederson, N., 2011, A multispecies tree–ring reconstruction of Potomac River streamflow (950–2001), Water Resources Research, 47:5.
Maxwell, J.T., Harley G.L. and Matheus T.J. 2015, Dendroclimatic reconstructions from multiple co–occurring species: a case study from an old–growth deciduous forest

50
in Indiana, USA, International Journal of Climatology, 35:6, 860–87010.1002/joc.4021.
Maxwell, J.T. and Harley G.L. 2017, Increased tree‑ring network density reveals more precise estimations of sub‑regional hydroclimate variability and climate dynamics in the Midwest, USA, Climate Dynamics, 49:4, 1479-1493.
McBride, J.R.1983, Analysis of tree rings and fire scars to establish fire history. Tree-Ring Bulletin 43: 5-67.
McEwan, R.W., Hutchinson T.F., Ford R.D. and McCarthy B.C. 2007, An experimental evaluation of fire history reconstruction using dendrochronology in white oak (Quercus alba), Canadian Journal of Forest Research, 37, 4; ProQuest 806.
Meko, D.M., Baisan, C.H. 2001, Pilot study of latewood–width of conifers as an indicator of variability of summer rainfall in the North American monsoon region, International Journal of Climatology 21: 697–708.
Mencuccini M., Martinez-Vilalta J., Vanderklein D., Hamid H.A., Korakaki E., Lee S., Michiels B. 2005, Size-mediated ageing reduces vigour in trees. Ecology Letters, 8:1183–1190.
Palmer, W.C., 1965, Meteorological Drought. Research Paper No. 45, US Weather Bureau, Washington, DC.
Patterson, T.W., Cummings L.W. and Knapp P.A. 2016, Longleaf pine (Pinus palustris Mill.) morphology and climate/growth responses along a physiographic gradient in North Carolina, The Professional Geographer, 68:2, 238–248.
Peñuelas, J. 2005, Plant physiology—a big issue for trees. Nature 437:965–966.
Pickard, F., Robichaud A. and Laroque C.P. 2011, Using dendrochronology to date the Val Comeau canoe, New Brunswick and developing an eastern white pine chronology in the Canadian Maritimes, Dendrochronologia, 29:1, 3-8.
Ramsey, C.L., Jose S., Brecke B.J. and Merritt S. 2003, Growth response of longleaf pine (Pinus palustris Mill.) seedlings to fertilization and herbaceous weed control in an old field in southern USA, Forest Ecology and Management, 172:2-3, 281-289.
Rathgeber C., Nicault A., Guiot J., Keller T., Guibal, F., and Roche,P. 2000, Simulated responses of Pinus halepensis forest productivity to climatic change and CO2 increase using a statistical model. Global Planetary Change, 26:4, 405-421.
Richter, K., Eckstein, D., and Holmes, R.L. 1991, The dendrochronological signal of pine trees (Pinus spp.) in Spain. Tree-Ring Bulletin. 51:1-13

51
Rubino, D.L. and McCarthy B.C. 2000, Dendroclimatological analysis of white oak (Quercus alba L., Fagaceae) from an old–growth forest of Southeastern Ohio, USA, The Journal of the Torrey Botanical Society, 127: 3, 240–250.
Rossen, J.F. 1994, Quercus stellata Growth and stand characteristics in the Quercus stellata-Quercus marilandica forest type in the Cross Timbers Region of Central Oklahoma. Proceedings of the North American Conference on Savannas and Barrens. Illinois State University, Normal Illinois.
Salzer, M.W., Hughes M.K., Bunn A.G. and Kipfmueller K.F. 2009, Recent unprecedented tree–ring growth in bristlecone pine at the highest elevations and possible causes, National Academy of Sciences, 106:48 :20348–20353.
Salzer, M.W. and Hughes M.K. 2007, Bristlecone pine tree rings and volcanic eruptions over the last 5000 years, Quaternary Research, 67:1, 57–68.
Schulman, E. 1942, Dendrochronology in pines of Arkansas, Ecology, 23:3, 309–318.
Schweingruber, F.H., Bartholin T., Schaur E., Briffa, K.R. 1988, Radiodensitometric‐dendroclimatological conifer chronologies from Lapland (Scandinavia) and the Alps (Switzerland), Boreas, 17:4, 559-566.
Scott, V.E., Evans, K.E., Patton, D.R., Sone, C.P., 1977, Cavity-nesting birds of North America forests. USDA Agricultural Handbook 511. Washington, DC.
Shumway, D.L., Abrams, M.D., and Ruffner, C.M. 2001, A 400-year history of fire and oak recruitment in an old-growth oak forest in western Maryland, USA. Canadian Journal of Forest Research, 31:8, 1437-1443.
Slobodkin, L.B., 1964. Growth and regulation of animal populations. Biology Series. Holt, Rinehart, Winston. New York. 184 pp.
Soil Survey Staff, Natural Resources Conservation Service, United States Department of Agriculture, 2018. Web Soil Survey. Available online at the following link: https://websoilsurvey.sc.egov.usda.gov/. Accessed [March/13/2018].
Sparks, J.C., Masters, R.E., Engle, D.M., & Bukenhofer, G.A. 2002, Season of burn influences fire behavior and fuel consumption in restored shortleaf pine–grassland communities. Restoration Ecology, 10:4, 714-722.
Speer, J.H., Grissino–Mayer H.D., Orvis K.H. and Greenberg C.H. 2009, Climate response of five oak species in the eastern deciduous forest of the southern Appalachian Mountains, USA, Canadian Journal of Forest Research, 39:3, 507–518.

52
Sperry, J.S., Nichols K.L., Sullivan J.E.M. and Eastlack S.E. 1994, Xylem embolism in ring–porous, diffuse–porous, and coniferous trees of Northern Utah and Interior Alaska, Ecological Society of America, Ecology, 75: 6, 1736–1752.
Stahle, D.W. 1979, Tree–Ring dating of historic buildings in Arkansas, Tree–Ring Bulletin, 39:1–28.
Stahle, D.W., and Hehr, J.G. 1984, Dendroclimatic relationships of post oak across a precipitation gradient in the southcentral United States. Annals of the Association of American Geographers, 74:4, 561-573.
Stambaugh, M.C. and Guyette R.P. 2004, Long–term growth and climate response of shortleaf pine at the Missouri Ozark Forest Ecosystem Project, Proceedings of the 14th central hardwood conference, 448–458.
State Climate Office of North Carolina, NC State University. CRONOS [internet database] available at http://climate.ncsu.edu/cronos/. Accessed January 25, 2018.
Therrell, M.D., and D.W. Stahle. 1998. A predictive model to locate ancient forests in the Cross Timbers of Osage County, Oklahoma. Journal of Biogeography 25: 847-854
Van Lear, D.H., Carroll, W.D., Kapeluck, P.R., & Johnson, R. 2005, History and restoration of the longleaf pine-grassland ecosystem: implications for species at risk. Forest ecology and Management, 211:1-2, 150-165.
Van de Gevel, S.L., Hart J.L., Grissino–Mayer H.D. and Robinson K.W. 2009, Tree–ring dating of old–growth longleaf pine (Pinus palustris Mill.) logs from an exposed timber crib dam, Hope Mills, North Carolina, U.S.A, Tree–Ring Research, 65:1:69–80.
Vieira, J., Campelo, F., and Nabais, C. 2009, Age-dependent responses of tree-ring growth and intra-annual density fluctuations of Pinus pinaster to Mediterranean climate. Trees, 23:2, 257-265.
Walker, D.H., and Sinclair, F.L. 1998, Acquiring qualitative knowledge about complex agroecosystems. Part 2: formal representation. Agricultural Systems, 56:3, 365-386.
Watkins, K.E., Patterson, T.W., and Knapp, P.A. 2018, Investigating the climatic sensitivity of shortleaf pine on a southeastern US college campus. Southeastern Geographer, 58:2, 146–163.
Way, A.G. 2011. Conserving southern longleaf: Herbert Stoddard and the rise of ecological land management. University of Georgia Press.

53
Wigley, T.M., Briffa, K.R., and Jones, P.D. 1984, On the average value of correlated time series, with applications in dendroclimatology and hydrometeorology. Journal of Climate and Applied Meteorology, 23:2, 201-213.
Wight, G.D. and Grissino–Mayer H.D. 2004, Dendrochronological dating of an antebellum period house, Forsyth County, Georgia, U.S.A., Tree–Ring Society, 60:2, 91-99.
White, P.B., van de Gevel, S.L., Grissino–Mayer, H.D., LaForest, L.B., DeWeese, G.G., 2011. Climatic response of oak species across an environmental gradient in the southern Appalachian Mountains, U.S.A. Tree–Ring Research 67:1, 27–37.
Yamaguchi, D.K. 1991, A simple method for cross–dating increment cores from living trees., Canadian Journal of Forest Research, 21:3, 414–416.