
Matching and retrieval based on the vocabulary and grammar of
17
38 IEEE TRANSACTIONS ON IMAGE PROCESSING,VOL. 9, NO. 1, JANUARY 2000 Matching and Retrieval Based on the Vocabulary and Grammar of Color Patterns Aleksandra Mojsilovic ´ , Member, IEEE, Jelena Kovaˇ cevic ´ , Senior Member, IEEE, Jianying Hu, Member, IEEE, Robert J. Safranek, Senior Member, IEEE, and S. Kicha Ganapathy, Member, IEEE Abstract—We propose a perceptually based system for pattern retrieval and matching. There is a need for such an “intelligent” retrieval system in applications such as digital museums and li- braries, design, architecture, and digital stock photography. The central idea of the work is that similarity judgment has to be mod- eled along perceptual dimensions. Hence, we detect basic visual categories that people use in judgment of similarity, and design a computational model that accepts patterns as input, and depending on the query, produces a set of choices that follow human behavior in pattern matching. There are two major research aspects to our work. The first one addresses the issue of how humans perceive and measure similarity within the domain of color patterns. To un- derstand and describe this mechanism we performed a subjective experiment. The experiment yielded five perceptual criteria used in comparison between color patterns (vocabulary), as well as a set of rules governing the use of these criteria in similarity judg- ment (grammar). The second research aspect is the actual imple- mentation of the perceptual criteria and rules in an image retrieval system. Following the processing typical for human vision, we de- sign a system to: 1) extract perceptual features from the vocabulary and 2) perform the comparison between the patterns according to the grammar rules. The modeling of human perception of color patterns is new—starting with a new color codebook design, com- pact color representation, and texture description through mul- tiple scale edge distribution along different directions. Moreover, we propose new color and texture distance functions that corre- late with human performance. The performance of the system is illustrated with numerous examples from image databases from different application domains. Index Terms—Color and texture classification, color and texture extraction, image database retrieval. I. INTRODUCTION F LEXIBLE retrieval and manipulation of image databases has become an important problem with application in video editing, photo-journalism, art, fashion, cataloguing, re- tailing, interactive CAD, geographic data processing, etc. Until recently, content-based retrieval systems (CBR’s) have asked people for key words to search image and video databases. Unfortunately, this approach does not work well since different people describe what they see or what they search for in different ways, and even the same person might describe the same image differently depending on the context in which it will be used. These problems stimulated the development of Manuscript received November 20, 1998; revised July 7, 1999. The associate editor coordinating the review of this manuscript and approving it for publica- tion was Dr. B. S. Manjunath. The authors are with Bell Laboratories, Lucent Technologies, Murray Hill, NJ 07974 USA (e-mail: [email protected]). Publisher Item Identifier S 1057-7149(00)00175-5. innovative content-based search techniques as well as new types of queries. A. Previous Work One of the earliest CBR systems is ART MUSEUM [1], where retrieval is performed entirely based on edge features. The first commercial content-based image search engine with profound effects on later systems was QBIC [2]. As color representation, this system uses a -element histogram and average of ( ), ( ), and ( ) coordinates, whereas for the description of texture it implements Tamura’s feature set [3]. In a similar fashion, color, texture, and shape are supported as a set of interactive tools for browsing and searching images in the Photobook system developed at the MIT Media Lab [4]. In addition to these elementary features, systems such as VisualSeek [5], Netra [6], and Virage [7] support queries based on spatial relationships and color layout. Moreover, in the Virage system [7], the user can select a combination of implemented features by adjusting the weights according to his own “perception.” This paradigm is also sup- ported in RetrievalWare search engine [8]. A different approach to similarity modeling is proposed in the MARS system [9], where the main focus is not in finding a best representation, but rather on the relevance feedback that will dynamically adapt multiple visual features to different applications and different users. Hence, although great progress has been made, none of the existing search engines offers a complete solution to the general image retrieval problem, and there are still many open research issues, preventing their use in a real application. Why is that so? B. Motivation While it is recognized that images can be described at a metalevel through color, texture, and shape of the objects within the image, general image understanding is a hard problem. Thus, one challenge is to accomplish image retrieval based on similarities in the feature space without necessarily performing full-fledged scene analysis. Many of the existing systems [7], [8], accomplish this task by expecting the user to assign a set of weights to color, shape, and texture features, thus specifying the way these attributes are going to be combined in the algorithm. Unfortunately, certain problems arise from this approach: First, this is certainly not the way matching is performed in the human visual system. Further, humans have no general notion of similarity; instead, they possess a functional notion of similarity within a particular domain. Therefore, to 1057–7149/00$10.00 © 2000 IEEE
Transcript of Matching and retrieval based on the vocabulary and grammar of
38 IEEE TRANSACTIONS ON IMAGE PROCESSING, VOL. 9, NO. 1, JANUARY 2000
Matching and Retrieval Based on the Vocabulary andGrammar of Color Patterns
Aleksandra Mojsilovic´, Member, IEEE, Jelena Kovaˇcevic, Senior Member, IEEE, Jianying Hu, Member, IEEE,Robert J. Safranek, Senior Member, IEEE, and S. Kicha Ganapathy, Member, IEEE
Abstract—We propose a perceptually based system for patternretrieval and matching. There is a need for such an “intelligent”retrieval system in applications such as digital museums and li-braries, design, architecture, and digital stock photography. Thecentral idea of the work is that similarity judgment has to be mod-eled along perceptual dimensions. Hence, we detect basic visualcategories that people use in judgment of similarity, and design acomputational model that accepts patterns as input, and dependingon the query, produces a set of choices that follow human behaviorin pattern matching. There are two major research aspects to ourwork. The first one addresses the issue of how humans perceiveand measure similarity within the domain of color patterns. To un-derstand and describe this mechanism we performed a subjectiveexperiment. The experiment yielded five perceptual criteria usedin comparison between color patterns (vocabulary), as well as aset of rules governing the use of these criteria in similarity judg-ment (grammar). The second research aspect is the actual imple-mentation of the perceptual criteria and rules in an image retrievalsystem. Following the processing typical for human vision, we de-sign a system to: 1) extract perceptual features from the vocabularyand 2) perform the comparison between the patterns according tothe grammar rules. The modeling of human perception of colorpatterns is new—starting with a new color codebook design, com-pact color representation, and texture description through mul-tiple scale edge distribution along different directions. Moreover,we propose new color and texture distance functions that corre-late with human performance. The performance of the system isillustrated with numerous examples from image databases fromdifferent application domains.
Index Terms—Color and texture classification, color and textureextraction, image database retrieval.
I. INTRODUCTION
F LEXIBLE retrieval and manipulation of image databaseshas become an important problem with application in
video editing, photo-journalism, art, fashion, cataloguing, re-tailing, interactive CAD, geographic data processing, etc. Untilrecently, content-based retrieval systems (CBR’s) have askedpeople for key words to search image and video databases.Unfortunately, this approach does not work well since differentpeople describe what they see or what they search for indifferent ways, and even the same person might describe thesame image differently depending on the context in which itwill be used. These problems stimulated the development of
Manuscript received November 20, 1998; revised July 7, 1999. The associateeditor coordinating the review of this manuscript and approving it for publica-tion was Dr. B. S. Manjunath.
The authors are with Bell Laboratories, Lucent Technologies, Murray Hill,NJ 07974 USA (e-mail: [email protected]).
Publisher Item Identifier S 1057-7149(00)00175-5.
innovative content-based search techniques as well as newtypes of queries.
A. Previous Work
One of the earliest CBR systems is ART MUSEUM [1],where retrieval is performed entirely based on edge features.The first commercial content-based image search engine withprofound effects on later systems was QBIC [2]. As colorrepresentation, this system uses ak-element histogram andaverage of (R; G; B), (Y; i; q), and (L; a; b) coordinates,whereas for the description of texture it implements Tamura’sfeature set [3]. In a similar fashion, color, texture, and shapeare supported as a set of interactive tools for browsing andsearching images in the Photobook system developed at theMIT Media Lab [4]. In addition to these elementary features,systems such as VisualSeek [5], Netra [6], and Virage [7]support queries based on spatial relationships and color layout.Moreover, in the Virage system [7], the user can select acombination of implemented features by adjusting the weightsaccording to his own “perception.” This paradigm is also sup-ported in RetrievalWare search engine [8]. A different approachto similarity modeling is proposed in the MARS system [9],where the main focus is not in finding a best representation, butrather on the relevance feedback that will dynamically adaptmultiple visual features to different applications and differentusers. Hence, although great progress has been made, none ofthe existing search engines offers a complete solution to thegeneral image retrieval problem, and there are still many openresearch issues, preventing their use in a real application.Whyis that so?
B. Motivation
While it is recognized that images can be described at ametalevel through color, texture, and shape of the objectswithin the image, general image understanding is a hardproblem. Thus, one challenge is to accomplish image retrievalbased on similarities in the feature space without necessarilyperforming full-fledged scene analysis. Many of the existingsystems [7], [8], accomplish this task by expecting the user toassign a set of weights to color, shape, and texture features, thusspecifying the way these attributes are going to be combinedin the algorithm. Unfortunately, certain problems arise fromthis approach: First, this is certainly not the way matching isperformed in the human visual system. Further, humans have nogeneral notion of similarity; instead, they possess a functionalnotion of similarity within a particular domain. Therefore, to
1057–7149/00$10.00 © 2000 IEEE
MOJSILOVICet al.: VOCABULARY AND GRAMMAR OF COLOR PATTERNS 39
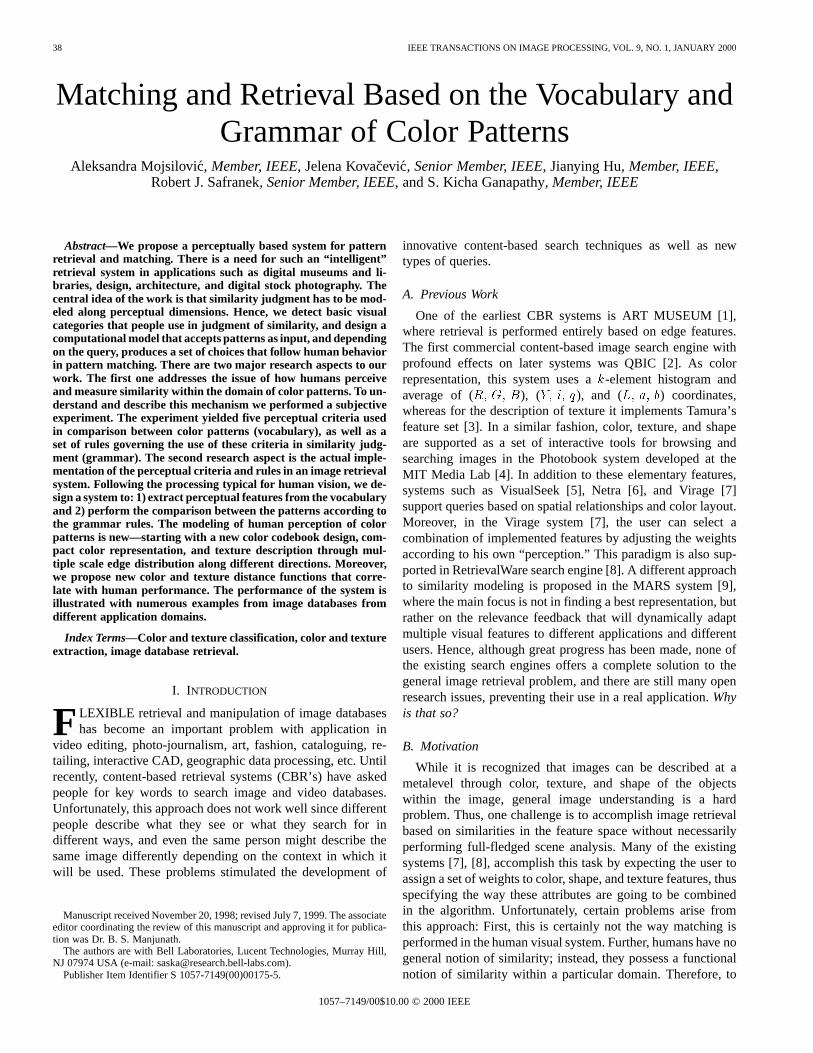
Fig. 1. Overview of the system. The two main parts deal with featureextraction and similarity measurement. Both the feature extraction andsimilarity measurment parts mimic the behavior of the human visual system.Within the feature extraction part, color and texture are processed separately.
perform similarity matching in a human-like manner one hasto: 1) choose a specific application domain, 2) understand howusers judge similarity within that domain, and then 3) build asystem that will replicate human performance.
Since color and texture are fundamental aspects of human vi-sual perception, we developed a set of techniques for search andmanipulation of color patterns. Moreover, there are a great manyapplications for pattern retrieval in: arts and museums, fashion,garment and design industry, digital libraries, and digital stockphotography.Therefore, there isa need for an “intelligent” visualinformation retrieval system that will perform pattern matchingin these applications. However, regardless of the application do-main,toaccomplishretrievalsuccessfully it isnecessary tounder-standwhat type of colorand texture information humans actuallyuseand how they combine them indeciding whether twopatternsare similar. In this paper, we are focusing on the integration ofcolor and texture features for pattern retrieval and matching. Ouraimis todetectbasicvisualcategories thatpeopleuse in judgmentofsimilarity, and then todesign acomputational model whichac-cepts one (or more) texture images as input, and depending onthe type of query, produces a set of choices that followhuman be-havior in pattern matching.
There are two major research aspects in our work: The firstone addresses the issue of how humans perceive and measuresimilarity within the domain of color patterns. To understandand describe this mechanism we performed a subjective experi-ment. The experiment yieldedfive perceptual criteria importantfor the comparison between the color patterns, as well as a setof rules governing the use of these criteria in the similarity judg-ment. Thefive perceptual criteria are considered to be thebasicvocabulary,whereas the set of rules is considered as thebasicgrammar of the “color pattern language.” The second researchaspect is the actual implementation of the perceptual criteria andrules in the image retrieval system illustrated in Figs. 1 and 2.Following the processing typical for human vision, we design asystem to 1) extract perceptual features from the vocabulary and2) perform the comparison between the patterns according tothe grammar rules. The modeling of human perception of color
patterns is new—starting with a new color codebook design,compact color representation, and texture description throughmultiple scale edge distribution along different directions. Fi-nally, to model the human behavior in pattern matching, insteadof using the traditional Euclidean metric to compare color andtexture feature vectors, we propose new distance functions thatcorrelate with human performance.
The outline of the paper is as follows. Section II describesthe subjective experiment and analytical tools we used to inter-pret the data. At the end of this section we list and describe indetail thefive perceptual categories (vocabulary) andfive rules(grammar) used by humans in comparison of color patterns.Section III gives an overview of the system together with itspsychophysical background. Sections IV and V present the im-plementation of feature extraction based on color and texture,respectively, and the development of new color and texture met-rics. Section VI describes how these features and distances areused in similarity measurement and presents numerous exam-ples. Section VII gives examples of different queries and thecorresponding search results. The final section includes discus-sion and conclusions.
II. V OCABULARY AND GRAMMAR OF COLOR PATTERNS
Our understanding of color patterns is very modest comparedto our understanding of other visual phenomena such as color,contrast or even gray-level textures. That is mainly due to thefact that the basic dimensions of color patterns have not yetbeen identified, a standardized set of features for addressingtheir important characteristics does not exist, nor are thererules defining how these features are to be combined. Previousinvestigations in this field concentrated mainly on gray-levelnatural textures [3], [10], [11]. Particularly interesting is workof Rao and Lohse [11]: their research focused on how peopleclassify textures in meaningful, hierarchically structuredcategories, identifying relevant features used in the perceptionof gray-level textures. Similarly, here we determine the basiccategories—vocabulary—used by humans in judging similarityof color patterns, their relative importance and relationships, aswell as the hierarchy of rules—grammar. Later in the paper,through numerous search examples (see Figs. 8–13), we willshow that these attributes are applicable to a broad rangeof textures, starting from simple patterns, all the way up tocomplex, high-level visual texture phenomena.
This section describes the subjective experiment, and givesa brief overview of multidimensional scaling and hierarchicalclustering techniques we used to interpret the experimental data.Multidimensional scaling was applied to determine the most im-portant dimensions of pattern similarity, while hierarchical clus-tering helped us understand how people combine these dimen-sions when comparing color patterns. The results obtained arelisted and explained at the end of this section, while the detailscan be found in [14].
A. Experimental Setup
During the subjective testing, we used 25 patterns from in-terior design catalogs. Twenty patterns were used in the ac-tual study, whilefive patterns were used as a “warm-up” before
40 IEEE TRANSACTIONS ON IMAGE PROCESSING, VOL. 9, NO. 1, JANUARY 2000
(a)
(b)
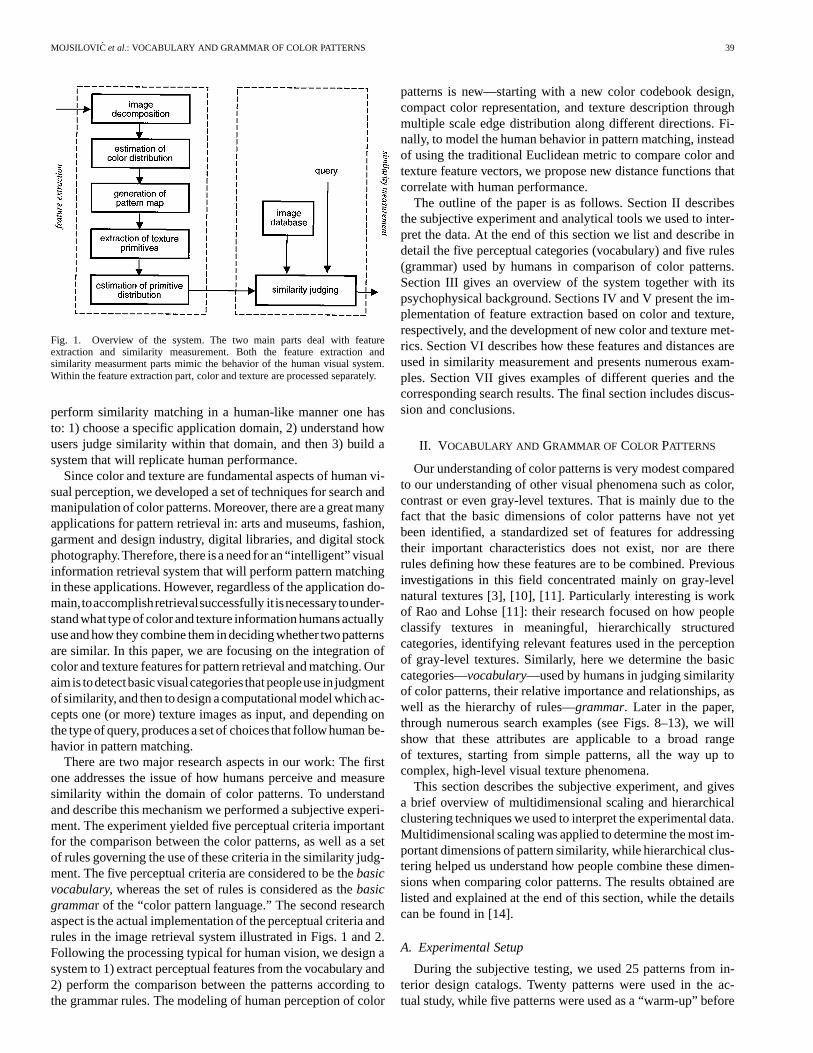
Fig. 2. Two basic blocks of the feature extraction part from Fig. 1. (a) Color representation and modeling. (b) Texture representation and modeling.
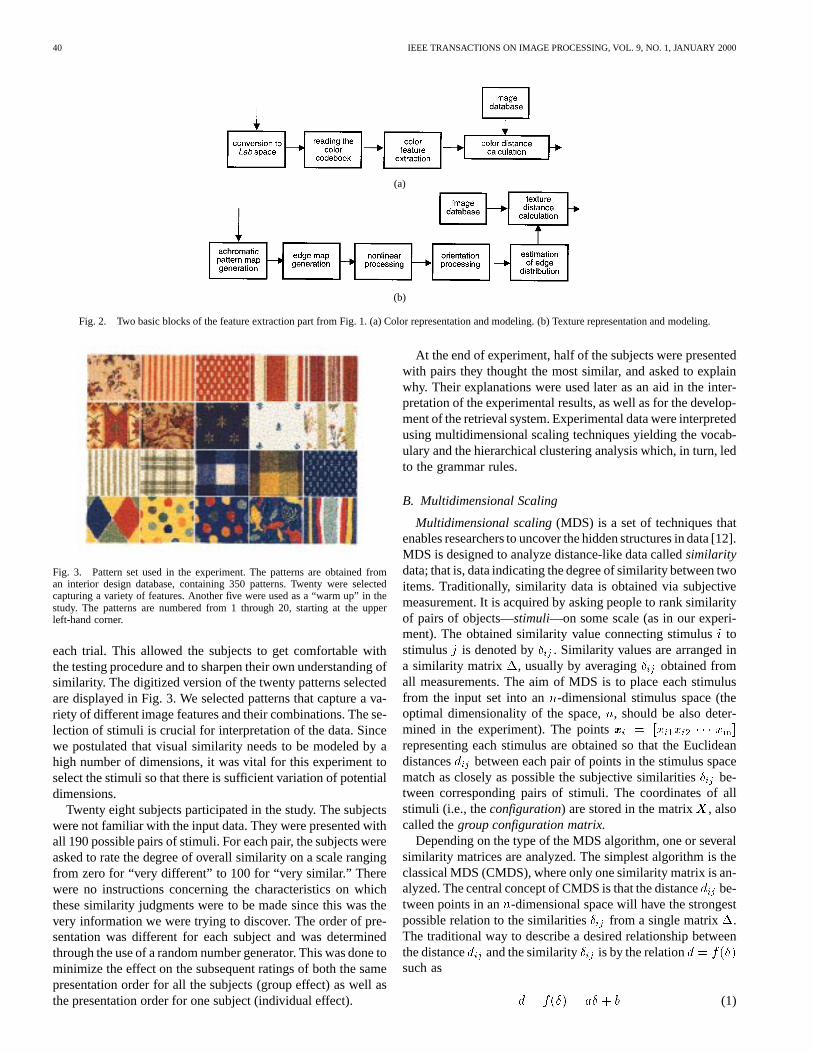
Fig. 3. Pattern set used in the experiment. The patterns are obtained froman interior design database, containing 350 patterns. Twenty were selectedcapturing a variety of features. Another five were used as a “warm up” in thestudy. The patterns are numbered from 1 through 20, starting at the upperleft-hand corner.
each trial. This allowed the subjects to get comfortable withthe testing procedure and to sharpen their own understanding ofsimilarity. The digitized version of the twenty patterns selectedare displayed in Fig. 3. We selected patterns that capture a va-riety of different image features and their combinations. The se-lection of stimuli is crucial for interpretation of the data. Sincewe postulated that visual similarity needs to be modeled by ahigh number of dimensions, it was vital for this experiment toselect the stimuli so that there is sufficient variation of potentialdimensions.
Twenty eight subjects participated in the study. The subjectswere not familiar with the input data. They were presented withall 190 possible pairs of stimuli. For each pair, the subjects wereasked to rate the degree of overall similarity on a scale rangingfrom zero for “very different” to 100 for “very similar.” Therewere no instructions concerning the characteristics on whichthese similarity judgments were to be made since this was thevery information we were trying to discover. The order of pre-sentation was different for each subject and was determinedthrough the use of a random number generator. This was done tominimize the effect on the subsequent ratings of both the samepresentation order for all the subjects (group effect) as well asthe presentation order for one subject (individual effect).
At the end of experiment, half of the subjects were presentedwith pairs they thought the most similar, and asked to explainwhy. Their explanations were used later as an aid in the inter-pretation of the experimental results, as well as for the develop-ment of the retrieval system. Experimental data were interpretedusing multidimensional scaling techniques yielding the vocab-ulary and the hierarchical clustering analysis which, in turn, ledto the grammar rules.
B. Multidimensional Scaling
Multidimensional scaling(MDS) is a set of techniques thatenables researchers to uncover the hidden structures in data [12].MDS is designed to analyze distance-like data calledsimilaritydata; that is, data indicating the degree of similarity between twoitems. Traditionally, similarity data is obtained via subjectivemeasurement. It is acquired by asking people to rank similarityof pairs of objects—stimuli—on some scale (as in our experi-ment). The obtained similarity value connecting stimulusi tostimulusj is denoted by�ij . Similarity values are arranged ina similarity matrix�, usually by averaging�ij obtained fromall measurements. The aim of MDS is to place each stimulusfrom the input set into ann-dimensional stimulus space (theoptimal dimensionality of the space,n, should be also deter-mined in the experiment). The pointsxxxi = [xi1xi2 � � � xin]representing each stimulus are obtained so that the Euclideandistancesdij between each pair of points in the stimulus spacematch as closely as possible the subjective similarities�ij be-tween corresponding pairs of stimuli. The coordinates of allstimuli (i.e., theconfiguration) are stored in the matrixXXX , alsocalled thegroup configuration matrix.
Depending on the type of the MDS algorithm, one or severalsimilarity matrices are analyzed. The simplest algorithm is theclassical MDS (CMDS), where only one similarity matrix is an-alyzed. The central concept of CMDS is that the distancedij be-tween points in ann-dimensional space will have the strongestpossible relation to the similarities�ij from a single matrix�.The traditional way to describe a desired relationship betweenthe distancedij and the similarity�ij is by the relationd = f (�)such as
d = f(�) = a� + b (1)
MOJSILOVICet al.: VOCABULARY AND GRAMMAR OF COLOR PATTERNS 41
where, for a given configuration, valuesa andb must be dis-covered using numerical optimization. There are many differentcomputational approaches for solving this equation [12]. Oncethe bestf is found, we then search for the best configurationXXX
of points in the stimulus space. This procedure is repeated fordifferentn’s until further increase in the number of dimensionsdoes not bring a reduction in the following error function (alsoknown asstress formula 1 or Kruskal’s stress formula):
stress(�; XXX; f ) =
vuuuuut
Xi
Xj
[f(�ij)� dij]2
Xi
Xj
f(�ij )2: (2)
A detailed introduction to the CMDS together with many im-portant implementation aspects can be found in [12]. Once theCMDS configuration is obtained we are left with the task of in-terpreting and labeling the dimensions we have. Usually, we aimto interpret each dimension of the space. However, the numberof dimensions does not necessarily reflect all the relevant char-acteristics. Also, although a particular feature exists in the stim-ulus set, it may not contribute strongly enough to become visibleas a separate dimension. Therefore, one useful role of MDS isto indicate which particular features are important.
Another important MDS type is weighted multidimensionalscaling (WMDS). It generalizes CMDS Euclidean distancemodel, so that several similarity matrices can be used. Thismodel assumes that individuals vary in the importance theyattach to each dimension of the stimulus space. In that wayWMDS accounts for individual differences in human re-sponses. WMDS analyzes several similarity matrices, one foreach of m subjects. In the WMDS model,�ijk indicates thesimilarity between stimulii and j, as judged by subjectk.The notion of “individual taste” is incorporated into the modelthrough weightswkl, for each subjectk = 1; � � � ; m and eachdimensionl = 1; � � � ; n. Just as in CMDS, WMDS determinesthe configuration of points in the group stimulus spaceXXX .However, in order to find the best possible configuration,WMDS does not use distances among the points in the groupspace. Instead, a configuration for each subject is made byaltering the group configuration space according to the weightswkl. Algebraically, given a pointxxxi from the group space, thepoints for subjectk are obtained as
xilk =pwlk � xil: (3)
In WMDS, the formula for stress is based on the squared dis-tances calculated from each of m individual similarity matrices
stress(�; Xk; f) =
vuuuuut1
m
Xk
Xi
Xj
[f(�ijk)� dijk]2
Xi
Xj
f(�ijk)2(4)
wheredijk are weighted Euclidean distances between stimulii andj, for the subjectk. In that way, the WMDS model ac-commodates very large differences among the individual rat-ings, and even very different data from two subjects can fit intothe same space.
An important characteristic of CMDS is that once a configu-ration of points is obtained, it can be rotated, implying that thedimensions are not meaningful. Thus, when interpreting the re-sults, higher-dimensional CMDS soon becomes impractical. Asopposed to CMDS, due to the algebra of the weighted Euclidianmodel, once the WMDS configuration is obtained, it cannot berotated [12], [28]. However, the stability of configuration de-pends heavily on the accuracy of the model; if the model fitsthat data well, the dimensions are meaningful which makes ourjob of interpreting them much easier.
C. Hierarchical Cluster Analysis
Given a similarity matrix, hierarchical cluster analysis (HCA)organizes a set of stimuli into similar units [13]. Therefore, HCAhelp us discover the rules and the hierarchy we use in judgingsimilarity and pattern matching. This method starts from thestimulus set to build a tree. Before the procedure begins, allstimuli are considered as separate clusters, hence there are asmany clusters as there are ranked stimuli. The tree is formed bysuccessively joining the most similar pairs of stimuli into newclusters. At every step, either an individual stimulus is added tothe existing clusters, or two existing clusters are merged. Thegrouping continues until all stimuli are members of a singlecluster. How the similarity matrix is updated at each stage ofthe tree is determined by the joining algorithm. There are manypossible criteria for deciding how to merge clusters. Some ofthe simplest methods usenearest neighbor technique, wherethe first two objects combined are those that have the smallestdistance between them. Another commonly used technique isthe farthest neighbor technique where the distance between twoclusters is obtained as the distance between their farthest points.The centroid method calculates the distances between two clus-ters as the distance between their means. Also, since the mergingof clusters at each step depends on the distance measure, dif-ferent distance measures can result in different clustering solu-tions for the same clustering method [13].
Clustering techniques are often used in combination withMDS, to clarify the obtained dimensions. However, in the sameway as with the labeling of the dimensions in the MDS algo-rithm, interpretation of the clusters is usually done subjectivelyand strongly depends on the quality of the data.
D. Vocabulary: Most Important Dimensions of Color Patterns
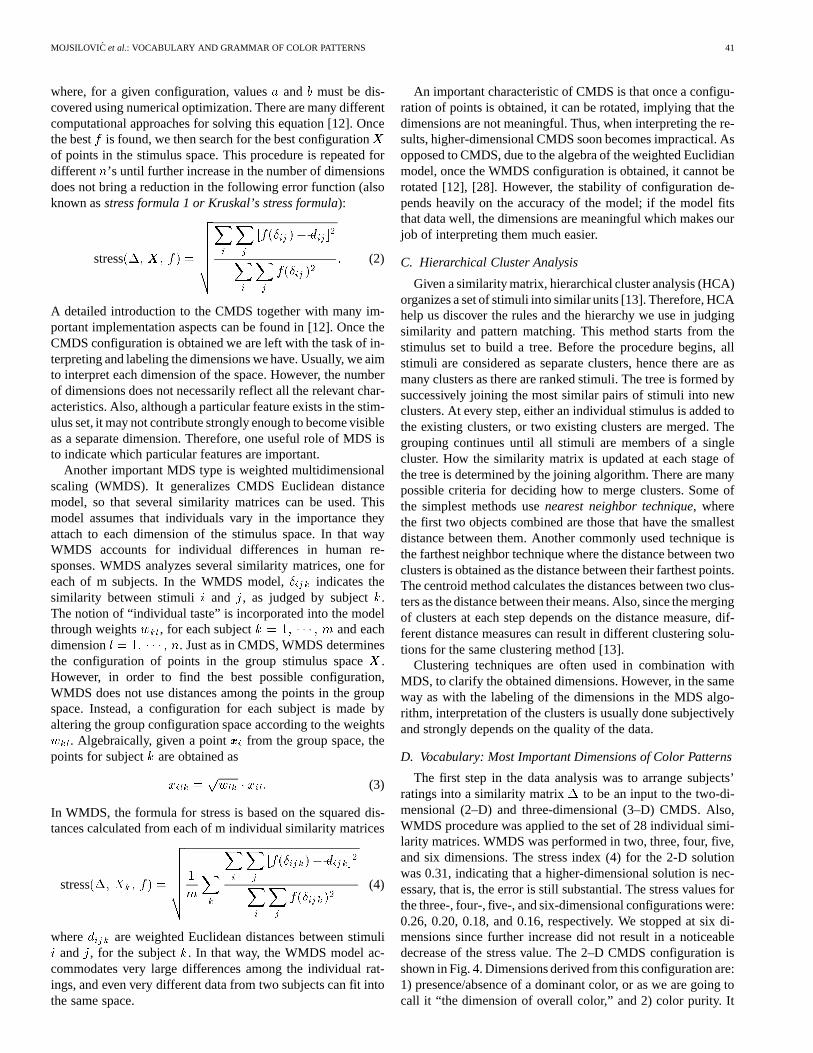
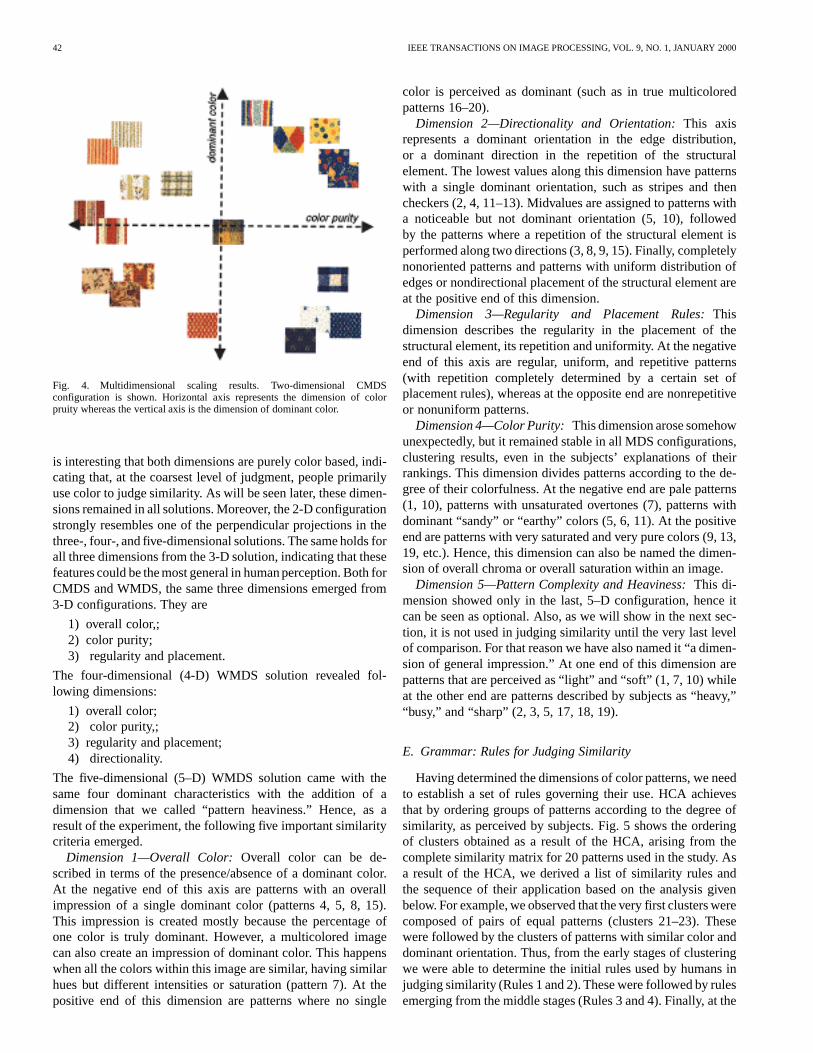
The first step in the data analysis was to arrange subjects’ratings into a similarity matrix� to be an input to the two-di-mensional (2–D) and three-dimensional (3–D) CMDS. Also,WMDS procedure was applied to the set of 28 individual simi-larity matrices. WMDS was performed in two, three, four,five,and six dimensions. The stress index (4) for the 2-D solutionwas 0.31, indicating that a higher-dimensional solution is nec-essary, that is, the error is still substantial. The stress values forthe three-, four-,five-, and six-dimensional configurations were:0.26, 0.20, 0.18, and 0.16, respectively. We stopped at six di-mensions since further increase did not result in a noticeabledecrease of the stress value. The 2–D CMDS configuration isshown in Fig. 4. Dimensions derived from this configuration are:1) presence/absence of a dominant color, or as we are going tocall it “the dimension of overall color,” and 2) color purity. It
42 IEEE TRANSACTIONS ON IMAGE PROCESSING, VOL. 9, NO. 1, JANUARY 2000
Fig. 4. Multidimensional scaling results. Two-dimensional CMDSconfiguration is shown. Horizontal axis represents the dimension of colorpruity whereas the vertical axis is the dimension of dominant color.
is interesting that both dimensions are purely color based, indi-cating that, at the coarsest level of judgment, people primarilyuse color to judge similarity. As will be seen later, these dimen-sions remained in all solutions. Moreover, the 2-D configurationstrongly resembles one of the perpendicular projections in thethree-, four-, andfive-dimensional solutions. The same holds forall three dimensions from the 3-D solution, indicating that thesefeatures could be the most general in human perception. Both forCMDS and WMDS, the same three dimensions emerged from3-D configurations. They are
1) overall color,;2) color purity;3) regularity and placement.
The four-dimensional (4-D) WMDS solution revealed fol-lowing dimensions:
1) overall color;2) color purity,;3) regularity and placement;4) directionality.
The five-dimensional (5–D) WMDS solution came with thesame four dominant characteristics with the addition of adimension that we called “pattern heaviness.” Hence, as aresult of the experiment, the followingfive important similaritycriteria emerged.
Dimension 1—Overall Color:Overall color can be de-scribed in terms of the presence/absence of a dominant color.At the negative end of this axis are patterns with an overallimpression of a single dominant color (patterns 4, 5, 8, 15).This impression is created mostly because the percentage ofone color is truly dominant. However, a multicolored imagecan also create an impression of dominant color. This happenswhen all the colors within this image are similar, having similarhues but different intensities or saturation (pattern 7). At thepositive end of this dimension are patterns where no single
color is perceived as dominant (such as in true multicoloredpatterns 16–20).
Dimension 2—Directionality and Orientation:This axisrepresents a dominant orientation in the edge distribution,or a dominant direction in the repetition of the structuralelement. The lowest values along this dimension have patternswith a single dominant orientation, such as stripes and thencheckers (2, 4, 11–13). Midvalues are assigned to patterns witha noticeable but not dominant orientation (5, 10), followedby the patterns where a repetition of the structural element isperformed along two directions (3, 8, 9, 15). Finally, completelynonoriented patterns and patterns with uniform distribution ofedges or nondirectional placement of the structural element areat the positive end of this dimension.
Dimension 3—Regularity and Placement Rules:Thisdimension describes the regularity in the placement of thestructural element, its repetition and uniformity. At the negativeend of this axis are regular, uniform, and repetitive patterns(with repetition completely determined by a certain set ofplacement rules), whereas at the opposite end are nonrepetitiveor nonuniform patterns.
Dimension 4—Color Purity:This dimension arose somehowunexpectedly, but it remained stable in all MDS configurations,clustering results, even in the subjects’ explanations of theirrankings. This dimension divides patterns according to the de-gree of their colorfulness. At the negative end are pale patterns(1, 10), patterns with unsaturated overtones (7), patterns withdominant “sandy” or “earthy” colors (5, 6, 11). At the positiveend are patterns with very saturated and very pure colors (9, 13,19, etc.). Hence, this dimension can also be named the dimen-sion of overall chroma or overall saturation within an image.
Dimension 5—Pattern Complexity and Heaviness:This di-mension showed only in the last, 5–D configuration, hence itcan be seen as optional. Also, as we will show in the next sec-tion, it is not used in judging similarity until the very last levelof comparison. For that reason we have also named it “a dimen-sion of general impression.” At one end of this dimension arepatterns that are perceived as “light” and “soft” (1, 7, 10) whileat the other end are patterns described by subjects as “heavy,”“busy,” and “sharp” (2, 3, 5, 17, 18, 19).
E. Grammar: Rules for Judging Similarity
Having determined the dimensions of color patterns, we needto establish a set of rules governing their use. HCA achievesthat by ordering groups of patterns according to the degree ofsimilarity, as perceived by subjects. Fig. 5 shows the orderingof clusters obtained as a result of the HCA, arising from thecomplete similarity matrix for 20 patterns used in the study. Asa result of the HCA, we derived a list of similarity rules andthe sequence of their application based on the analysis givenbelow. For example, we observed that the very first clusters werecomposed of pairs of equal patterns (clusters 21–23). Thesewere followed by the clusters of patterns with similar color anddominant orientation. Thus, from the early stages of clusteringwe were able to determine the initial rules used by humans injudging similarity (Rules 1 and 2). These were followed by rulesemerging from the middle stages (Rules 3 and 4). Finally, at the

MOJSILOVICet al.: VOCABULARY AND GRAMMAR OF COLOR PATTERNS 43
Fig. 5. Result of the HCA applied to the complete set of stimuli. Clusters 1 to 20 are original patterns, clusters 21 to 37 represent successive nodes of the tree. Inthe last step, clusters 36 and 38 are joined to form the top cluster. The ordering of clusters was used to determine the rules and the sequence of their applicationin pattern matching.
coarsest level of comparison we use Rule 5 (clusters 36–38 inFig. 5).
In addition, to confirm the stability of rules, we have splitthe original data in several ways and performed separate HCA’sfor each part. As suggested in [12], we eliminated some of thestimuli from the data matrix and determined the HCA trees forthe remaining stimuli. The rules remained stable through var-ious solutions; thus we conclude that the 5–D configuration canbe used for modeling the similarity metrics of the human visualsystem, together with the following rules:
Rule 1: The strongest similarity rule is that of equal pattern.Regardless of color, two textures with exactly the same patternsuch as pairs (17, 18), (2, 11), and (3, 15) are always judged tobe the most similar. Hence, this rule uses Dimensions 3 and 2(pattern regularity and directionality).
Rule 2: The second rule in the hierarchy is that of overallappearance. It uses the combination of Dimension 1 (dominantcolor)andDimension 2 (directionality). Two patterns that havesimilar values in both dimensions, such as pairs (10, 11), (1, 7),and the triplet (2, 4, 5) are also perceived as similar.
Rule 3: The third rule is that of similar pattern. It concernseither dimension 2 (directionality)or dimension 3 (pattern regu-larity and placement rules). Hence, two patterns which are dom-inant along the same direction (or directions) are seen as sim-ilar, regardless of their color. One such example is the cluster(12–14). In the same manner, seen as similar are patterns withthe same placement or repetition of the structural element, evenif the structural element is not exactly the same (see patterns 8and 9, or 17, 18 and 19).
Rule 4: In the middle of the hierarchy comes the rule of dom-inant color. Two multicolored patterns are perceived as similarif they possess the same color distributions regardless of theircontent, directionality, placement, or repetition of a structuralelement (patterns 16–20). This also holds for patterns that havethe same dominant or overall color (patterns 2–6). Hence, thisrule involves only the Dimension 1 (dominant color).
Rule 5: Finally, at the very end of the hierarchy, comes therule of general impression (Dimensions 4 and 5). This ruledivides patterns into “dim,” “smooth,” “earthy,” “romantic,” or“pale” (at one end of the corresponding dimension) as opposed

44 IEEE TRANSACTIONS ON IMAGE PROCESSING, VOL. 9, NO. 1, JANUARY 2000
to “bold,” “bright,” “strong,” “pure,” “sharp,” “abstract,” or“heavy” patterns (at the opposite end). This rule represents thecomplex combination of color, contrast, saturation, and spatialfrequency, and therefore applies to patterns at the highest,abstract level of understanding.
This set of rules represents the basic grammar of patternmatching. For actual implementation of the grammar it isimportant to observe the way these rules are applied: Eachrule can be expressed as a logical combination (logical OR,AND, XOR, NOT) of the pattern values along the dimensionsinvolved in it. For example, consider cluster 24 composed ofpatterns 4 and 5 in Fig. 5. These patterns have similar overallcolor and dominant orientation, thus their values both alongthe dimensions 1 and 2 are very close. Consequently, they areperceived as similar according to the Rule 2, which is expressedin the following way:
(DIM1(pattern 4) similar toDIM1(pattern 5))
AND(DIM2(pattern 4) similar toDIM2(pattern5)): (5)
III. OVERVIEW OF THE SYSTEM
We will summarize our findings thus far. To model the humanperception of similarity:
1) we determined the basic vocabularyV of colorpatterns consisting of dimensions 1–5:V =fDIM1; � � � ; DIM5g;
2) we determined the grammarG, that is, the rules gov-erning the use of the dimensions from the vocabularyV . Five rules (R1–R5) were discovered so thatG =fR1; R2; R3; R4; R5g.
Having found the vocabulary and grammar, we need to designa system that will, given an input imageA and a queryQ:
1) measure the dimensionsDIMi(A) from the vocabulary,i = 1; � � � ; 5;
2) for each imageB from the database, apply rulesR1–R5
from G and obtain corresponding distance measuresdist1(A; B); � � �, dist5(A; B), where disti(A; B) isthe distance between the imagesA andB according tothe rulei;
Therefore, the system has two main parts: 1) the featureextraction part, measuring the dimensions fromV and 2) thesearch part, where similar patterns are found according to therules fromG. The feature extraction part is designed to extractdimensions 1 to 4 of pattern similarity. Dimension 5 (patterncomplexity and heaviness) is not implemented, since ourexperiments have shown that people use this criterion only at ahigher level of judgment, while comparing groups of textures[14]. Feature extraction is followed by judgment of similarityaccording to Rules 1–4 fromG. Rule 5 is not supported in thecurrent implementation, since it is only used in combinationwith dimension 5 at a higher level of pattern matching (suchas subdividing a group of patterns into romantic, abstract,geometric, bold, etc.).
Let us now examine the system in more detail. It is importantto note that the feature extraction part is developed according tothe following assumptions derived from psychophysical proper-
ties of the human visual system and conclusions extracted fromour experiment.
1) The overall perception of color patterns is formedthrough the interaction of luminance componentL,chrominance componentC and achromatic patterncomponentAP . The luminance and chrominance com-ponents approximate signal representation in the earlyvisual cortical areas while the achromatic pattern com-ponent approximates signal representation formed athigher processing levels [15]. Our experimental resultsconfirm this fact: we found that at the coarsest levelof judgment only color features are used (2-D MDS)whereas texture information is added later and used in thedetailed comparison. Therefore, our feature extractionsimulates the same mechanism; it decomposes the imagemap into luminance and chrominance components in theinitial stages, and models pattern information later in thesystem.
2) As in the human visual system the first approximation isthat each of these components is processed through sep-arate pathways [16], [29]. While luminance and chromi-nance components are used for the extraction of color-based information, the achromatic pattern component isused for the extraction of purely texture-based informa-tion. However, if we want to be more precise, we need toaccount for residual interactions along the pathways [17].As will be shown in Section V, we accomplish this by ex-tracting the achromatic pattern component from the colordistribution, instead of using the luminance signal as inprevious models. Moreover, the discrete color distributionis estimated through the use of a specially designed per-ceptual codebook allowing the interaction between the lu-minance and chrominance components (see Section IV).
3) Features are extracted by combining three major do-mains: a) nonoriented luminance domain representedby the luminance component of an image, b) orientedluminance domain represented by the achromatic patternmap, and c) nonoriented color domain represented bythe chrominance component. The first two domains areessentially color blind, whereas the third domain carriesonly the chromatic information. These three domainsare well documented in the literature [18] and experi-mentally verified in perceptual computational modelsfor segregation of color textures [19]. Purely color-baseddimensions (1 and 4) are extracted in the nonorienteddomains and are measured using the color feature vector.Texture-based dimensions (2 and 3) are extracted in theoriented luminance domain, through the scale-orientationprocessing of the achromatic pattern map.
In summary, our computational model is implemented as inFig. 1 and contains the following parts.
1) Feature extraction blockwith the following components.• Image Decomposition: Input image is transformed into
theLab color space and decomposed into luminanceL and chrominanceC = (a; b) components.
• Estimation of Color Distribution: BothL andC mapsare used for the color distribution estimation and
MOJSILOVICet al.: VOCABULARY AND GRAMMAR OF COLOR PATTERNS 45
extraction of color features. We are thus performingfeature extraction along the color-based dimensions1 and 4.
• Pattern Map Generation: Color features extracted inthe second stage are used to build the achromatic pat-tern map.
• Texture Primitive Extraction and Estimation: Theachromatic pattern map is used to estimate the spatialdistribution of texture primitives. We are thus per-forming feature extraction along the texture-baseddimensions 2 and 3.
2) Similarity Measurement: Here similar patterns are foundaccording to the rules fromG. Given an input imageA,for every imageB in the database, rulesR1–R4 are ap-plied and corresponding distance measures are computed.Then, depending on a queryQ, a set of best matches isfound.
IV. FEATURE EXTRACTION BASED ON COLOR INFORMATION
The color information is used both for the extraction of color-related dimensions (color features), and for the construction ofthe achromatic pattern map (used later in texture processing),therefore we aim for compact, perceptually-based color repre-sentation. As illustrated in Fig. 2(a), this representation is ob-tained through the following steps.
1) The input image is transformed into theLab color space.2) Its color distribution is determined using a vector quanti-
zation-based histogram technique,.3) Significant color features are determined from the his-
togram.4) These color features are used in conjunction with a new
distance measure to determine the perceptual similaritybetween two color distributions.
A. Color Representation
Our goal is to produce a system that performs in accordancewith human perception, hence we need a representation (colorspace) based on human color matching. CIELab is such acolor space, since it was designed so that intercolor distancescomputed using thek k2 norm correspond to subjective colormatching data [20]. After transforming an input image intothe Lab color space, the next step is to estimate the colordistribution by computing a histogram of the input color data.Since linear color spaces (such as RGB) can be approximatedby 3-D cubes, histogram bin centers can be computed byperforming separable, equidistant discretizations along each ofthe coordinate axes. Unfortunately, by going to the nonlinearLab color space, the volume of all possible colors distorts fromcube to an irregular cone and consequently, there is no simplediscretization that can be applied to this volume.
To estimate color distributions in theLab space, we have todetermine the set of bin centers and decision boundaries thatminimize some error criterion. In theLab color system,k k2norm corresponds to perceptual similarity, thus representing theoptimal distance metric for that space [20]. Therefore, to ob-tain an optimal set of bin centers and decision boundaries, we
have to findLab coordinates ofN bin centers so that the overallmean-square classification error is minimized. This is exactlythe underlying problem in vector quantization (VQ). Hence,we used the LBG vector quantization algorithm [21] to obtaina set of codebooks which optimally represent the valid colorsin theLab space. In any VQ design, the training data have alarge effect on the final result. A commonly used approach is toselect training images that are either representative of a givenproblem so the codebook is optimally designed for that partic-ular application, or span enough of the input space so the re-sulting codebook can be used in different applications. The fol-lowing problem occurs with both approaches: In order to obtainan accurate estimation for the color distribution, a large numberof training images is required, resulting in a computationallyexpensive and possibly intractable design task. To overcomethis problem, we have taken a different approach. Since we aredealing with an arbitrary input, we can assume that every coloris equiprobable. Hence, a synthetic set of training data was gen-erated by uniformly quantizing theXY Z space. The data wastransformed into theLab space and used as input to the stan-dard VQ design algorithm. This resulted in a set of codebooksranging in size from 16 to 512 colors. When used in the standardimage retrieval task, these codebooks performed quite well. Forour task, however, these codebooks have one drawback; Theyare designed as a global representation of the entire color spaceand consequently, there is no structure to the bin centers. Ourpurpose is to design a system which allows a user to interactwith the retrieval process. Therefore, the color representationmust provide manipulation with colors in a “human-friendlymanner.” To simulate human performance in color perception,a certain amount of structure on the relationships between theL, a, andb components must be introduced. One possible wayto accomplish this is by separating the luminanceL, from thechrominance (a; b) components. Starting from this assumption,we first applied one-dimensional (1–D) quantization on lumi-nance values of the training data (using a Lloyd–Max quantizer).Then, after partitioning the training data into slices of similarluminance, a separate chrominance codebook was designed foreach slice by applying the LBG algorithm to the appropriate(a; b) components.
This color representation better mimics human perceptionand allows the formulation of functional queries such as lookingfor “same but lighter color,” “paler,” “contrasting,” etc. For ex-ample, the formulation of a query vector to search for a “lighter”color can be accomplished through the following steps:
1) extract the luminanceLQ and the (aQ, bQ) pair for thequery color;
2) find the codebook for a higher luminance levelL > LQ;3) in this codebook, find the cell which corresponds to (a; b)
entry which is the closest to (aQ; bQ) in thek k2 sense;4) retrieve all images having (L; a; b) as a dominant color.
Moreover, starting from the relationship betweenL; a, andbvalues for a particular color, and its hueH and saturationS
H = arctanb
a; S =
pa2 + b2: (6)
Similar procedures can be applied to satisfy queries such as“paler color,” “bolder color,” “contrasting color,” etc. Finally,

46 IEEE TRANSACTIONS ON IMAGE PROCESSING, VOL. 9, NO. 1, JANUARY 2000
in applications where the search is performed between differentdatabases or when the query image is supplied by the user, sep-aration of luminance and chrominance allows for elimination ofthe unequal luminance condition. Since the chrominance com-ponents contain the information about the type of color regard-less of the intensity value, color features can be extracted onlyin the chrominance domainC(i; j) = fa(i; j); b(i; j)g, forthe corresponding luminance level, thus allowing for compar-ison between images of different quality.
B. Color Feature Extraction
Color histogram representations based on color codebookshave been widely used as a feature vector in image segmenta-tion and retrieval [22], [23]. Although good results have beenreported, a feature set based solely on the image histogram maynot provide a reliable representation for pattern matching and re-trieval. This is due to the fact that most patterns are perceived ascombinations of a few dominant colors. For example, subjectswho participated in our previously reported subjective experi-ments [14], were not able to perceive nor distinguish more thansix or seven colors, even when presented with very busy or mul-ticolored patterns. For that reason, we are proposing color fea-tures and associated distance measures consisting of the subsetof colors (which best represent an image), augmented by thearea percentage in which each of these colors occur.
In our system we have used a codebook withN = 71colors denoted byC71 = fC1; C2; � � � ; C71g where eachcolorCi = fLi; ai; big is a three-dimensionalLab vector. Asthe first step in the feature extraction procedure (before his-togram calculation) input image is convolved with aB-splinesmoothing kernel. This is done to refine contours of textureprimitives and foreground regions, while eliminating most ofthe background noise. TheB-spline kernel is used since itprovides an optimal representation of a signal in thek k2 sense,hence minimizing the perceptual error [24]. The second step(after the histogram of an image was built) involves extractionof dominant colors to find colors from the codebook thatadequately describe a given texture pattern. This was done bysequentially increasing the number of colors until all colorscovering more than 3% of the image area have been extracted.The remaining pixels were represented with their closestmatches (ink k2 sense) from the extracted dominant colors.Finally, the percentage of each dominant color was calculatedand the color feature vectors were obtained as
fc = f(ij ; pj)jj 2 [1; N ]; pj 2 [0; 1]g (7)
whereij is the index in the codebook,pj is the correspondingpercentage andN is the number of dominant colors in theimage. Another similar representation has been successfullyused in image retrieval [25].
The proposed feature extraction scheme has several advan-tages: It provides an optimal representation of the original colorcontent by minimizing the MSE introduced when using a smallnumber of colors. Then, by exploiting the fact that the humaneye cannot perceive a large number of colors at the same time,nor is it able to distinguish close colors well, we provide avery compact feature representation. This greatly reduces the
size of the features needed for storage and indexing. Further-more, because of the codebook used, this representation facil-itates queries containing an overall impression of patterns ex-pressed in a natural way, such as “find me all blue-yellow fab-rics,” “find me the same color, but a bit lighter,” etc. Finally, inaddition to storing the values of the dominant colors and theirpercentages, we are also storing the actual number of domi-nant colors. This information is useful in addressing the morecomplex dimensions of pattern similarities as suggested in [14].Namely, by using this feature we can search for simple andsingle colored patterns, versus heavy, multicolored ones.
C. Color Metric
The color features described above, represented as color andarea pairs, allow the definition of a color metric that closelymatches human perception. The idea is that the similarity be-tween two images in terms of color composition should be mea-sured by a combination of color and area differences.
Given two images, a query imageA and a targetimage B, with NA and NB dominant colors, and fea-ture vectors fc(A) = f(ia; pa)j8a 2 [1; NA]g, andfc(B) = f(ib; pb)j8b 2 [1; NB ]g, respectively, we firstdefine the similarity between these two images in terms of asingle dominant color. Suppose thati is the dominant color inimageA. Then, we measure the similarity betweenA andBin terms of that color using the minimum of distance measuresbetween the color element(i; p) and the set of color elementsf(ib; pb)j8 b 2 [1; NB ]g:
d(i; B) = minb2[1;NB]
D((i; p); (ib; pb)) (8)
where
D((i; p); (ib; pb))
= jp� pbj+p
(L� Lb)2 + (a � ab)2 + (b� bb)2:
(9)
Once the distanced(i; B) has been calculated, besides its valuewe also use its argument to store the color value fromB that,for a particular colori from A, minimizes (8). We denote thiscolor value byk(i; B) as
k(i; B) = arg d(i; B): (10)
Note that the distance between two color/area pairs is definedas the sum of the distance in terms of the area percentage andthe distance in theLab color space, both within the range [0, 1].In [25], Ma et al. used a different definition where the overalldistance is the product of these two components. That defini-tion, while being more intuitive, has the drawback that wheneither component distance is very small the remaining compo-nent becomes irrelevant. Consider the extreme case, when thecolor distance between two color/area pairs is zero. This is notunusual, since the color space has been heavily quantized. Then,even if the difference between the two area percentages is verylarge, the overall distance is zero yielding a measure that doesnot match human perception. Our definition is a simple and ef-fective remedy to that problem—it guarantees that both color
MOJSILOVICet al.: VOCABULARY AND GRAMMAR OF COLOR PATTERNS 47
and area components contribute to the perception of color sim-ilarity.
Given the distance between two images in terms of one domi-nant color as defined above, the distance in terms of overall colorcomposition is defined as the sum over all dominant colors fromboth images, in the following way.
1) For imageA, for 8 a 2 [1; NA] find kA(ia; B) and thecorresponding distanced(ia; B).
2) Repeat this procedure for all dominant colors inB, thatis, for 8 b 2 [1; NB ] find kB(ib; B) andd(ib; A).
3) calculate the overall distance as
dist(A; B) =X
a2[1; NA]
d(ia; B) +X
b2[1;NB]
d(ib; A): (11)
V. FEATURE EXTRACTION BASED ON TEXTURE INFORMATION
Having obtained the color feature vector, the extraction oftexture features involves the following steps [see Fig. 2(b)]:
1) spatial smoothing, to refine texture primitives and removebackground noise;
2) building the achromatic pattern map;3) building the edge map from the achromatic pattern map;4) application of a nonlinear mechanism to suppress nontex-
tured edges;5) orientation processing to extract the distribution of pattern
contours along different spatial directions;6) computation of a scale-spatial texture edge distribution.
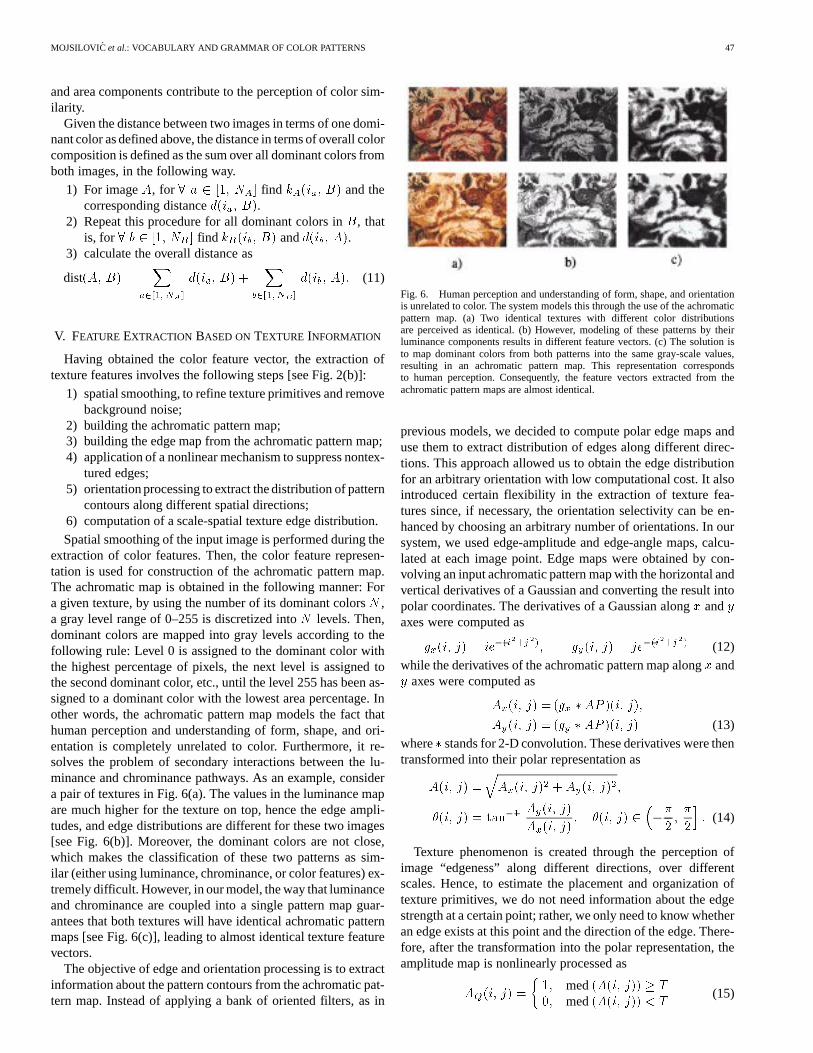
Spatial smoothing of the input image is performed during theextraction of color features. Then, the color feature represen-tation is used for construction of the achromatic pattern map.The achromatic map is obtained in the following manner: Fora given texture, by using the number of its dominant colorsN ,a gray level range of 0–255 is discretized intoN levels. Then,dominant colors are mapped into gray levels according to thefollowing rule: Level 0 is assigned to the dominant color withthe highest percentage of pixels, the next level is assigned tothe second dominant color, etc., until the level 255 has been as-signed to a dominant color with the lowest area percentage. Inother words, the achromatic pattern map models the fact thathuman perception and understanding of form, shape, and ori-entation is completely unrelated to color. Furthermore, it re-solves the problem of secondary interactions between the lu-minance and chrominance pathways. As an example, considera pair of textures in Fig. 6(a). The values in the luminance mapare much higher for the texture on top, hence the edge ampli-tudes, and edge distributions are different for these two images[see Fig. 6(b)]. Moreover, the dominant colors are not close,which makes the classification of these two patterns as sim-ilar (either using luminance, chrominance, or color features) ex-tremely difficult. However, in our model, the way that luminanceand chrominance are coupled into a single pattern map guar-antees that both textures will have identical achromatic patternmaps [see Fig. 6(c)], leading to almost identical texture featurevectors.
The objective of edge and orientation processing is to extractinformation about the pattern contours from the achromatic pat-tern map. Instead of applying a bank of oriented filters, as in
Fig. 6. Human perception and understanding of form, shape, and orientationis unrelated to color. The system models this through the use of the achromaticpattern map. (a) Two identical textures with different color distributionsare perceived as identical. (b) However, modeling of these patterns by theirluminance components results in different feature vectors. (c) The solution isto map dominant colors from both patterns into the same gray-scale values,resulting in an achromatic pattern map. This representation correspondsto human perception. Consequently, the feature vectors extracted from theachromatic pattern maps are almost identical.
previous models, we decided to compute polar edge maps anduse them to extract distribution of edges along different direc-tions. This approach allowed us to obtain the edge distributionfor an arbitrary orientation with low computational cost. It alsointroduced certain flexibility in the extraction of texture fea-tures since, if necessary, the orientation selectivity can be en-hanced by choosing an arbitrary number of orientations. In oursystem, we used edge-amplitude and edge-angle maps, calcu-lated at each image point. Edge maps were obtained by con-volving an input achromatic pattern map with the horizontal andvertical derivatives of a Gaussian and converting the result intopolar coordinates. The derivatives of a Gaussian alongx andyaxes were computed as
gx(i; j) = ie�(i2+j2); gy(i; j) = je�(i2+j2) (12)
while the derivatives of the achromatic pattern map alongx andy axes were computed as
Ax(i; j) = (gx �AP )(i; j);
Ay(i; j) = (gy �AP )(i; j) (13)
where� stands for 2-D convolution. These derivatives were thentransformed into their polar representation as
A(i; j) =qAx(i; j)2 + Ay(i; j)2;
�(i; j) = tan�1 Ay(i; j)
Ax(i; j); �(i; j) 2
���
2;�
2
i: (14)
Texture phenomenon is created through the perception ofimage “edgeness” along different directions, over differentscales. Hence, to estimate the placement and organization oftexture primitives, we do not need information about the edgestrength at a certain point; rather, we only need to know whetheran edge exists at this point and the direction of the edge. There-fore, after the transformation into the polar representation, theamplitude map is nonlinearly processed as
AQ(i; j) =
�1; med(A(i; j)) � T
0; med(A(i; j)) < T(15)
48 IEEE TRANSACTIONS ON IMAGE PROCESSING, VOL. 9, NO. 1, JANUARY 2000
where med(�) represents the median value calculated over a 5× 5 neighborhood. Nonlinear median operation was introducedto suppress false edges in the presence of stronger ones, andeliminate weak edges introduced by noise. The quantizationthresholdT is determined as
T = �A � 2q�2A (16)
where�A and�2A are the mean and variance of the edge ampli-tude, estimated on a set of 300 images. This selection allowedall the major edges to be preserved. After quantizing the am-plitude map, we perform the discretization of the angle space,dividing it into the six bins corresponding to directions 0�, 30�,60�, 90�, 120�, and 150�, respectively. For each direction an am-plitude mapA�i(i; j) is built as
A�i(i; j)
=
�1; AQ(i; j) = 1 ^ �(i; j)) 2 �i0; AQ(i; j) = 0 _ �(i; j)) =2 �i
; i = 1; � � � ; 6:
(17)
To address the textural behavior at different scales, we es-timate mean and variance of edge density distribution, by ap-plying overlapping windows of different sizes to the set of di-rectional amplitude maps. For a given scale, along a given direc-tion, edge density is calculated simply by summing the valuesof the corresponding amplitude map within the window, and di-viding that value by the total number of pixels in the window. Weused four scales, with the following parameters for the slidingwindow:
Scale 1: WS1 = 34 W � 3
4 H; N1 = 30;
Scale 2: WS2 = 25 W � 2
5 H; N2 = 56;
Scale 3: WS3 = 15 W � 1
5 H; N3 = 80;
Scale 4: WS4 = 110 W � 1
10 H; N4 = 224
whereWSi andNi are window size and number of windowsfor scalei, andW andH are the width and height of the inputtexture. Note that the above approach is scale (zoom) invariant.In other words, the same pattern at different scales will havesimilar feature vectors.
Hence, at the output of the texture processing block, we havea texture feature vector of length 48:
ft = [��11 ��11 ��21 �
�21 � � � ��61 �
�61 ��12 �
�1
2 � � � ��64 ��64 ] (18)
where��ji and��ji stand for mean and standard deviation of tex-ture edges at scalei along the direction�j . Each feature com-ponent is normalized so that it assumes the mean value of zeroand standard deviation of one over the whole database. In thatway this feature vector essentially models both texture-relateddimensions (directionality and regularity): The distribution es-timates along the different directions address the dimension ofdirectionality. At any particular scale, the mean value can be un-derstood as an estimation of the overall pattern quality, whereas
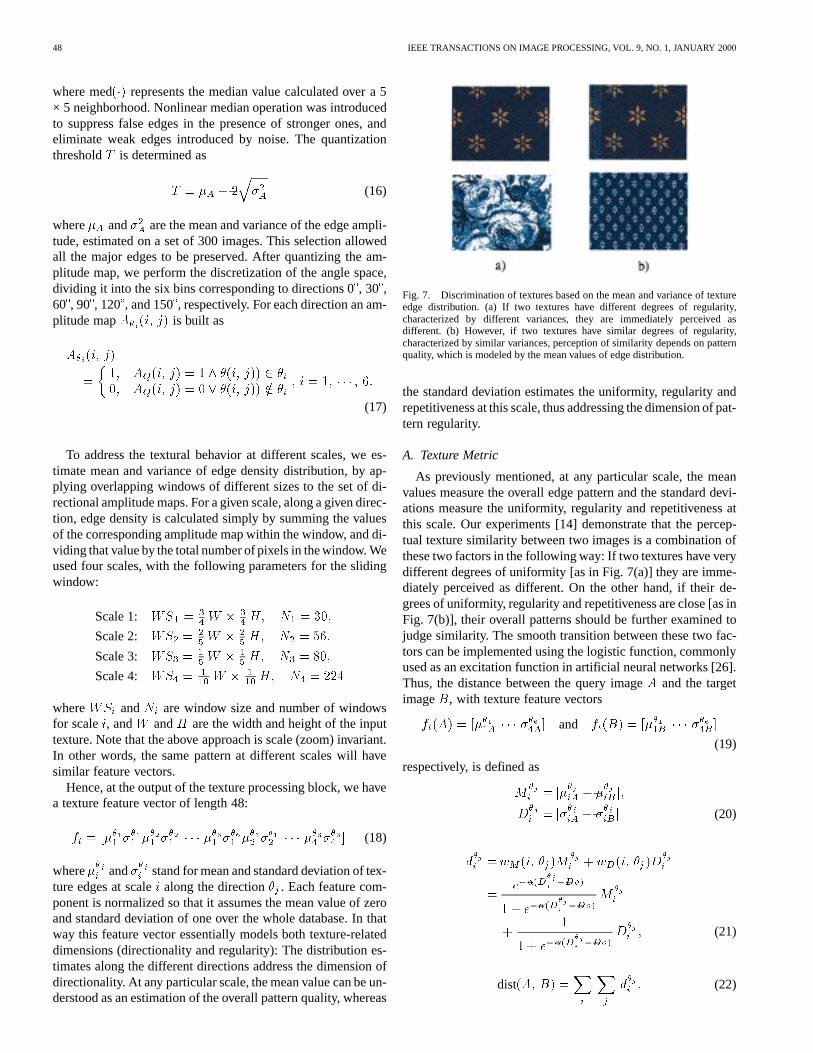
Fig. 7. Discrimination of textures based on the mean and variance of textureedge distribution. (a) If two textures have different degrees of regularity,characterized by different variances, they are immediately perceived asdifferent. (b) However, if two textures have similar degrees of regularity,characterized by similar variances, perception of similarity depends on patternquality, which is modeled by the mean values of edge distribution.
the standard deviation estimates the uniformity, regularity andrepetitiveness at this scale, thus addressing the dimension of pat-tern regularity.
A. Texture Metric
As previously mentioned, at any particular scale, the meanvalues measure the overall edge pattern and the standard devi-ations measure the uniformity, regularity and repetitiveness atthis scale. Our experiments [14] demonstrate that the percep-tual texture similarity between two images is a combination ofthese two factors in the following way: If two textures have verydifferent degrees of uniformity [as in Fig. 7(a)] they are imme-diately perceived as different. On the other hand, if their de-grees of uniformity, regularity and repetitiveness are close [as inFig. 7(b)], their overall patterns should be further examined tojudge similarity. The smooth transition between these two fac-tors can be implemented using the logistic function, commonlyused as an excitation function in artificial neural networks [26].Thus, the distance between the query imageA and the targetimageB, with texture feature vectors
ft(A) = [��11A � � � ��64A] and ft(B) = [��11B � � � ��64B]
(19)
respectively, is defined as
M�ji = j�
�jiA � �
�jiB j;
D�ji = j�
�jiA � �
�jiBj (20)
d�ji =wM(i; �j)M
�ji +wD(i; �j)D
�ji
=e��(D
�j
i�Do)
1 + e��(D�j
i�Do)
M�ji
+1
1+ e��(D�j
i�Do)
D�ji ; (21)
dist(A; B) =Xi
Xj
d�ji : (22)
MOJSILOVICet al.: VOCABULARY AND GRAMMAR OF COLOR PATTERNS 49
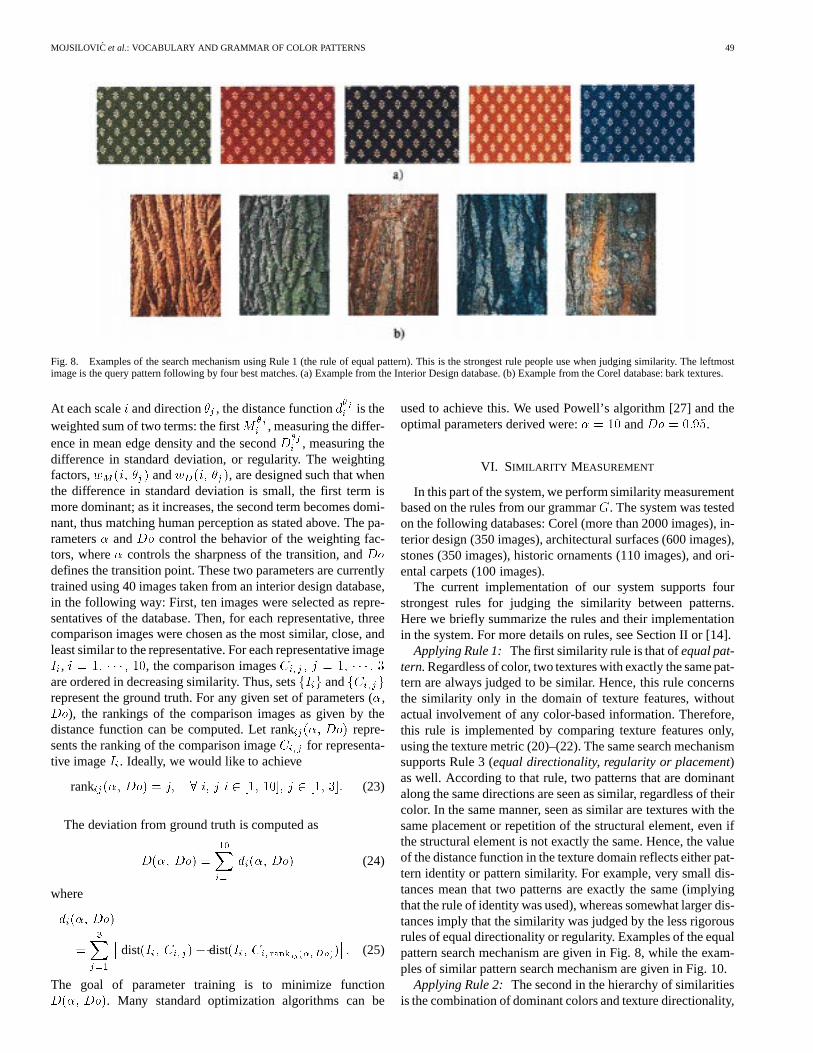
Fig. 8. Examples of the search mechanism using Rule 1 (the rule of equal pattern). This is the strongest rule people use when judging similarity. The leftmostimage is the query pattern following by four best matches. (a) Example from the Interior Design database. (b) Example from the Corel database: bark textures.
At each scalei and direction�j , the distance functiond�ji is theweighted sum of two terms: the firstM �j
i , measuring the differ-ence in mean edge density and the secondD
�ji , measuring the
difference in standard deviation, or regularity. The weightingfactors,wM(i; �j) andwD(i; �j), are designed such that whenthe difference in standard deviation is small, the first term ismore dominant; as it increases, the second term becomes domi-nant, thus matching human perception as stated above. The pa-rameters� andDo control the behavior of the weighting fac-tors, where� controls the sharpness of the transition, andDo
defines the transition point. These two parameters are currentlytrained using 40 images taken from an interior design database,in the following way: First, ten images were selected as repre-sentatives of the database. Then, for each representative, threecomparison images were chosen as the most similar, close, andleast similar to the representative. For each representative imageIi, i = 1; � � � ; 10, the comparison imagesCi; j; j = 1; � � � ; 3are ordered in decreasing similarity. Thus, setsfIig andfCi; jgrepresent the ground truth. For any given set of parameters (�,Do), the rankings of the comparison images as given by thedistance function can be computed. Let rankij(�; Do) repre-sents the ranking of the comparison imageCi; j for representa-tive imageIi. Ideally, we would like to achieve
rankij(�; Do) = j; 8 i; jji 2 [1; 10]; j 2 [1; 3]: (23)
The deviation from ground truth is computed as
D(�; Do) =10X
i=1
di(�; Do) (24)
where
di(�; Do)
=3X
j=1
�� dist(Ii; Ci; j) � dist(Ii; Ci; rankij(�;Do))�� : (25)
The goal of parameter training is to minimize functionD(�; Do). Many standard optimization algorithms can be
used to achieve this. We used Powell’s algorithm [27] and theoptimal parameters derived were:� = 10 andDo = 0:95.
VI. SIMILARITY MEASUREMENT
In this part of the system, we perform similarity measurementbased on the rules from our grammarG. The system was testedon the following databases: Corel (more than 2000 images), in-terior design (350 images), architectural surfaces (600 images),stones (350 images), historic ornaments (110 images), and ori-ental carpets (100 images).
The current implementation of our system supports fourstrongest rules for judging the similarity between patterns.Here we briefly summarize the rules and their implementationin the system. For more details on rules, see Section II or [14].
Applying Rule 1: The first similarity rule is that ofequal pat-tern.Regardless of color, two textures with exactly the same pat-tern are always judged to be similar. Hence, this rule concernsthe similarity only in the domain of texture features, withoutactual involvement of any color-based information. Therefore,this rule is implemented by comparing texture features only,using the texture metric (20)–(22). The same search mechanismsupports Rule 3 (equal directionality, regularity or placement)as well. According to that rule, two patterns that are dominantalong the same directions are seen as similar, regardless of theircolor. In the same manner, seen as similar are textures with thesame placement or repetition of the structural element, even ifthe structural element is not exactly the same. Hence, the valueof the distance function in the texture domain reflects either pat-tern identity or pattern similarity. For example, very small dis-tances mean that two patterns are exactly the same (implyingthat the rule of identity was used), whereas somewhat larger dis-tances imply that the similarity was judged by the less rigorousrules of equal directionality or regularity. Examples of the equalpattern search mechanism are given in Fig. 8, while the exam-ples of similar pattern search mechanism are given in Fig. 10.
Applying Rule 2: The second in the hierarchy of similaritiesis the combination of dominant colors and texture directionality,
50 IEEE TRANSACTIONS ON IMAGE PROCESSING, VOL. 9, NO. 1, JANUARY 2000
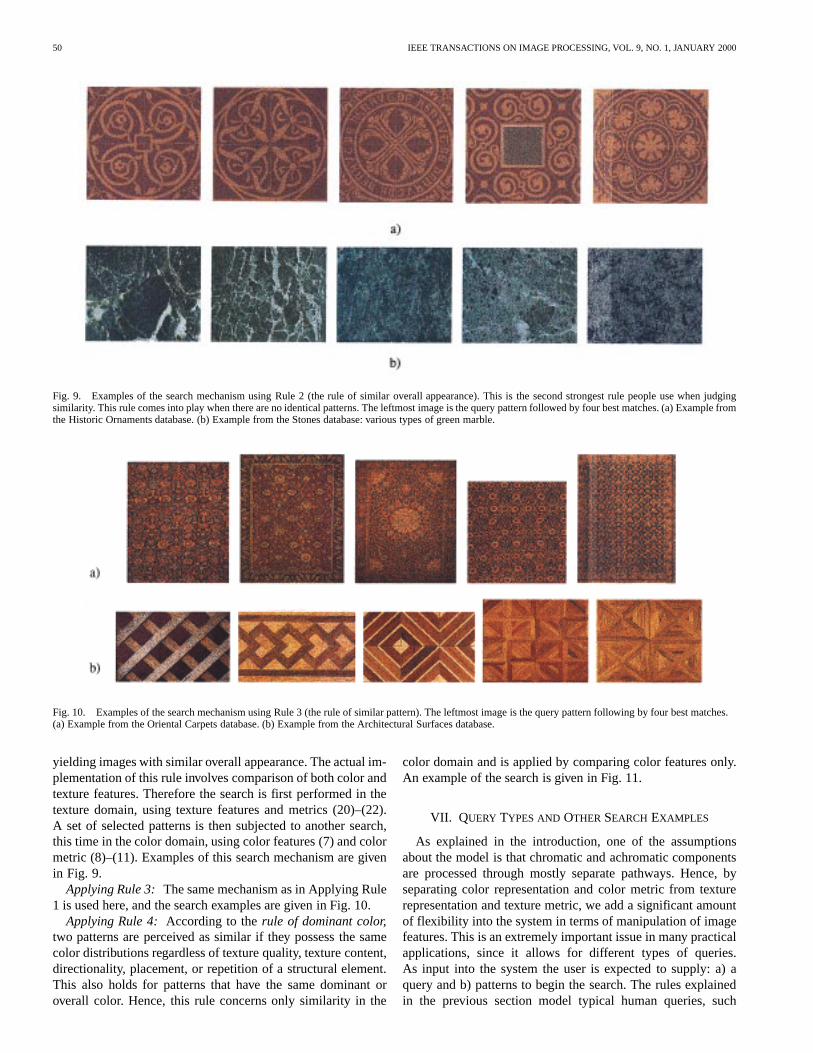
Fig. 9. Examples of the search mechanism using Rule 2 (the rule of similar overall appearance). This is the second strongest rule people use when judgingsimilarity. This rule comes into play when there are no identical patterns. The leftmost image is the query pattern followed by four best matches. (a) Example fromthe Historic Ornaments database. (b) Example from the Stones database: various types of green marble.
Fig. 10. Examples of the search mechanism using Rule 3 (the rule of similar pattern). The leftmost image is the query pattern following by four best matches.(a) Example from the Oriental Carpets database. (b) Example from the Architectural Surfaces database.
yielding images with similar overall appearance. The actual im-plementation of this rule involves comparison of both color andtexture features. Therefore the search is first performed in thetexture domain, using texture features and metrics (20)–(22).A set of selected patterns is then subjected to another search,this time in the color domain, using color features (7) and colormetric (8)–(11). Examples of this search mechanism are givenin Fig. 9.
Applying Rule 3: The same mechanism as in Applying Rule1 is used here, and the search examples are given in Fig. 10.
Applying Rule 4: According to therule of dominant color,two patterns are perceived as similar if they possess the samecolor distributions regardless of texture quality, texture content,directionality, placement, or repetition of a structural element.This also holds for patterns that have the same dominant oroverall color. Hence, this rule concerns only similarity in the
color domain and is applied by comparing color features only.An example of the search is given in Fig. 11.
VII. QUERY TYPES AND OTHER SEARCH EXAMPLES
As explained in the introduction, one of the assumptionsabout the model is that chromatic and achromatic componentsare processed through mostly separate pathways. Hence, byseparating color representation and color metric from texturerepresentation and texture metric, we add a significant amountof flexibility into the system in terms of manipulation of imagefeatures. This is an extremely important issue in many practicalapplications, since it allows for different types of queries.As input into the system the user is expected to supply: a) aquery and b) patterns to begin the search. The rules explainedin the previous section model typical human queries, such
MOJSILOVICet al.: VOCABULARY AND GRAMMAR OF COLOR PATTERNS 51
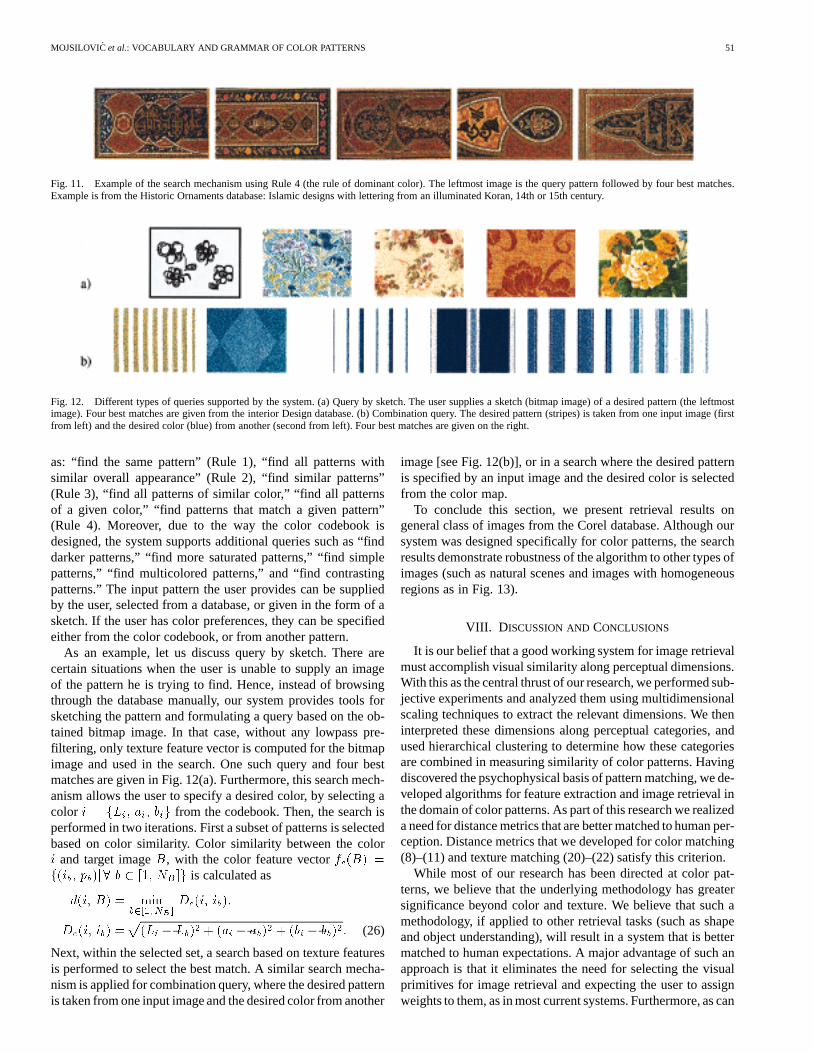
Fig. 11. Example of the search mechanism using Rule 4 (the rule of dominant color). The leftmost image is the query pattern followed by four best matches.Example is from the Historic Ornaments database: Islamic designs with lettering from an illuminated Koran, 14th or 15th century.
Fig. 12. Different types of queries supported by the system. (a) Query by sketch. The user supplies a sketch (bitmap image) of a desired pattern (the leftmostimage). Four best matches are given from the interior Design database. (b) Combination query. The desired pattern (stripes) is taken from one input image (firstfrom left) and the desired color (blue) from another (second from left). Four best matches are given on the right.
as: “find the same pattern” (Rule 1), “find all patterns withsimilar overall appearance” (Rule 2), “find similar patterns”(Rule 3), “find all patterns of similar color,” “find all patternsof a given color,” “find patterns that match a given pattern”(Rule 4). Moreover, due to the way the color codebook isdesigned, the system supports additional queries such as “finddarker patterns,” “find more saturated patterns,” “find simplepatterns,” “find multicolored patterns,” and “find contrastingpatterns.” The input pattern the user provides can be suppliedby the user, selected from a database, or given in the form of asketch. If the user has color preferences, they can be specifiedeither from the color codebook, or from another pattern.
As an example, let us discuss query by sketch. There arecertain situations when the user is unable to supply an imageof the pattern he is trying to find. Hence, instead of browsingthrough the database manually, our system provides tools forsketching the pattern and formulating a query based on the ob-tained bitmap image. In that case, without any lowpass pre-filtering, only texture feature vector is computed for the bitmapimage and used in the search. One such query and four bestmatches are given in Fig. 12(a). Furthermore, this search mech-anism allows the user to specify a desired color, by selecting acolor i = fLi; ai; big from the codebook. Then, the search isperformed in two iterations. First a subset of patterns is selectedbased on color similarity. Color similarity between the colori and target imageB, with the color feature vectorfc(B) =f(ib; pb)j 8 b 2 [1; NB ]g is calculated as
d(i; B) = minb2[1; NB ]
Dc(i; ib);
Dc(i; ib) =p(Li � Lb)2 + (ai � ab)2 + (bi � bb)2: (26)
Next, within the selected set, a search based on texture featuresis performed to select the best match. A similar search mecha-nism is applied for combination query, where the desired patternis taken from one input image and the desired color from another
image [see Fig. 12(b)], or in a search where the desired patternis specified by an input image and the desired color is selectedfrom the color map.
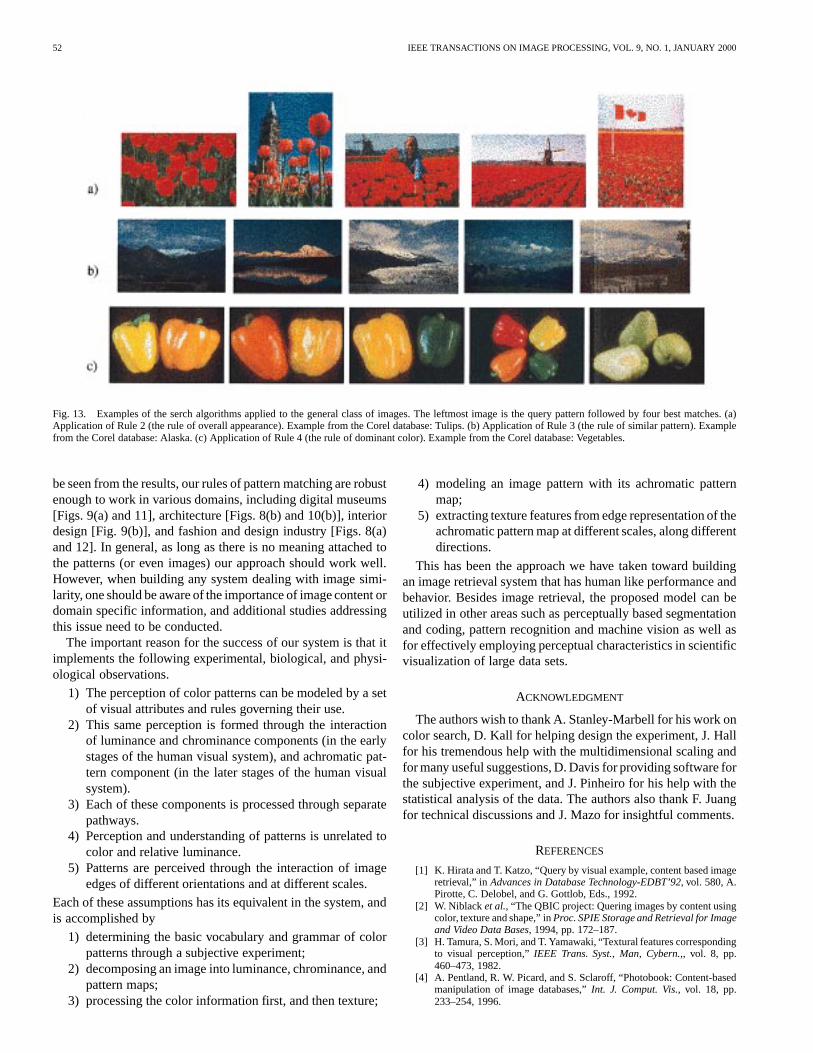
To conclude this section, we present retrieval results ongeneral class of images from the Corel database. Although oursystem was designed specifically for color patterns, the searchresults demonstrate robustness of the algorithm to other types ofimages (such as natural scenes and images with homogeneousregions as in Fig. 13).
VIII. D ISCUSSION ANDCONCLUSIONS
It is our belief that a good working system for image retrievalmust accomplish visual similarity along perceptual dimensions.With this as the central thrust of our research, we performed sub-jective experiments and analyzed them using multidimensionalscaling techniques to extract the relevant dimensions. We theninterpreted these dimensions along perceptual categories, andused hierarchical clustering to determine how these categoriesare combined in measuring similarity of color patterns. Havingdiscovered the psychophysical basis of pattern matching, we de-veloped algorithms for feature extraction and image retrieval inthe domain of color patterns. As part of this research we realizeda need for distance metrics that are better matched to human per-ception. Distance metrics that we developed for color matching(8)–(11) and texture matching (20)–(22) satisfy this criterion.
While most of our research has been directed at color pat-terns, we believe that the underlying methodology has greatersignificance beyond color and texture. We believe that such amethodology, if applied to other retrieval tasks (such as shapeand object understanding), will result in a system that is bettermatched to human expectations. A major advantage of such anapproach is that it eliminates the need for selecting the visualprimitives for image retrieval and expecting the user to assignweights to them, as in most current systems. Furthermore, as can
52 IEEE TRANSACTIONS ON IMAGE PROCESSING, VOL. 9, NO. 1, JANUARY 2000
Fig. 13. Examples of the serch algorithms applied to the general class of images. The leftmost image is the query pattern followed by four best matches.(a)Application of Rule 2 (the rule of overall appearance). Example from the Corel database: Tulips. (b) Application of Rule 3 (the rule of similar pattern). Examplefrom the Corel database: Alaska. (c) Application of Rule 4 (the rule of dominant color). Example from the Corel database: Vegetables.
be seen from the results, our rules of pattern matching are robustenough to work in various domains, including digital museums[Figs. 9(a) and 11], architecture [Figs. 8(b) and 10(b)], interiordesign [Fig. 9(b)], and fashion and design industry [Figs. 8(a)and 12]. In general, as long as there is no meaning attached tothe patterns (or even images) our approach should work well.However, when building any system dealing with image simi-larity, one should be aware of the importance of image content ordomain specific information, and additional studies addressingthis issue need to be conducted.
The important reason for the success of our system is that itimplements the following experimental, biological, and physi-ological observations.
1) The perception of color patterns can be modeled by a setof visual attributes and rules governing their use.
2) This same perception is formed through the interactionof luminance and chrominance components (in the earlystages of the human visual system), and achromatic pat-tern component (in the later stages of the human visualsystem).
3) Each of these components is processed through separatepathways.
4) Perception and understanding of patterns is unrelated tocolor and relative luminance.
5) Patterns are perceived through the interaction of imageedges of different orientations and at different scales.
Each of these assumptions has its equivalent in the system, andis accomplished by
1) determining the basic vocabulary and grammar of colorpatterns through a subjective experiment;
2) decomposing an image into luminance, chrominance, andpattern maps;
3) processing the color information first, and then texture;
4) modeling an image pattern with its achromatic patternmap;
5) extracting texture features from edge representation of theachromatic pattern map at different scales, along differentdirections.
This has been the approach we have taken toward buildingan image retrieval system that has human like performance andbehavior. Besides image retrieval, the proposed model can beutilized in other areas such as perceptually based segmentationand coding, pattern recognition and machine vision as well asfor effectively employing perceptual characteristics in scientificvisualization of large data sets.
ACKNOWLEDGMENT
The authors wish to thank A. Stanley-Marbell for his work oncolor search, D. Kall for helping design the experiment, J. Hallfor his tremendous help with the multidimensional scaling andfor many useful suggestions, D. Davis for providing software forthe subjective experiment, and J. Pinheiro for his help with thestatistical analysis of the data. The authors also thank F. Juangfor technical discussions and J. Mazo for insightful comments.
REFERENCES
[1] K. Hirata and T. Katzo, “Query by visual example, content based imageretrieval,” inAdvances in Database Technology-EDBT’92, vol. 580, A.Pirotte, C. Delobel, and G. Gottlob, Eds., 1992.
[2] W. Niblack et al., “The QBIC project: Quering images by content usingcolor, texture and shape,” inProc. SPIE Storage and Retrieval for Imageand Video Data Bases, 1994, pp. 172–187.
[3] H. Tamura, S. Mori, and T. Yamawaki, “Textural features correspondingto visual perception,”IEEE Trans. Syst., Man, Cybern.,, vol. 8, pp.460–473, 1982.
[4] A. Pentland, R. W. Picard, and S. Sclaroff, “Photobook: Content-basedmanipulation of image databases,”Int. J. Comput. Vis., vol. 18, pp.233–254, 1996.
MOJSILOVICet al.: VOCABULARY AND GRAMMAR OF COLOR PATTERNS 53
[5] J. R. Smith and S. Chang, “Visualseek: A fully automated content-basedquery system,” inProc. ACM Multimedia’96, pp. 87–98.
[6] W. Y. Ma and B. S. Manjunath, “Netra: A toolbox for navigating largeimage databases,” inProc. IEEE Int. Conf. Image Processing, 1997, pp.568–571.
[7] A. Gupta and R. Jain, “Visual information retrieval,”Commun. ACM,vol. 40, pp. 70–79, 1997.
[8] J. Dowe, “Content based retrieval in multimedia imaging,” inProc. SPIEConf. Storage and Retrieval for Image and Video Databases, 1993.
[9] Y. Rui, T. S. Huang, and S. Mehrotra, “Content-based image retrievalwith relevance feed-back in Mars,” inProc. IEEE Conf. Image Pro-cessing, 1997, pp. 815–818.
[10] Amadsun and R. King, “Textural features corresponding to texture prop-erties,”IEEE Trans. Syst., Man, Cybern.,, vol. 19, pp. 1264–1274, 1989.
[11] A. R. Rao and G. L. Lohse, “Toward a texture naming system: Iden-tifying relevant dimensions of texture,”Vis. Res., vol. 36, no. 11, pp.1649–1669, 1996.
[12] J. Kruskal and M. Wish,Multidimensional Scaling. London, U.K.:Sage , 1978.
[13] R. Duda and P. Hart,Pattern Classification and Scene Analysis. NewYork: Wiley, 1973.
[14] A. Mojsilovic et al., “Toward vocabulary and grammar of color pat-terns,” IEEE Trans. Image Processing, to be published.
[15] T. N. Cornsweet,Visual Perception. New York: Academic , 1970.[16] E. A. DeYoe and D. C. VanEssen, “Concurrent processing streams in
monkey visual cortex,”Trends. Neurosci., vol. 11, pp. 219–226, 1988.[17] R. L. DeValois and K. K. DeValois,Spatial Vision. Oxford, U.K.: Ox-
ford Univ.Press, 1990.[18] M. S. Livingstone and D. H. Hubel, “Segregation of form, color, move-
ment and depth: Anatomy, physiology and perception,”Science, vol.240, pp. 740–749, 1988.
[19] T. V. Papathomas, R. S. Kashi, and A. Gorea, “A human vision basedcomputational model for chromatic texture segregation,”IEEE Trans.Syst., Man, Cybern. B, vol. 27, pp. 428–440, June 1997.
[20] G. Wyszecki and W. S. Stiles,Color Science: Concepts and Methods,Quantitative Data and Formulae, New York: Wiley, 1982.
[21] A. Gersho and R. M. Gray,Vector Quantization and Signal Pro-cessing. Boston, MA: Kluwer, 1992.
[22] M. Ioka, “A method of defining the similarity of images on the basis ofcolor information,” IBM Res., Tokyo Res. Lab., Tech. Rep. RT-0030,Nov. 1989.
[23] M. Swain and D. Ballard, “Color indexing,”Int. J. Comput.Vis., vol. 7,pp. 11–32, 1991.
[24] M. Unser, A. Aldroubi, and M. Eden, “Enlargement or reduction of dig-ital images with minimum loss of information,”IEEE Trans. Image Pro-cessing, vol. 4, pp. 247–257, Mar. 1995.
[25] W. Y. Ma, Y. Deng, and B. S. Manjunath, “Tools for texture/color basesearch of images,”Proc. SPIE, vol. 3016, pp. 496–505, 1997.
[26] S. Haykin, Neural Networks: A Comprehensive Foundation. NewYork: Macmillan , 1994.
[27] W. H. Press, S. A. Teukolsky, W. T. Vetterling, and B. P. Flannery,Nu-merical Recipes in C, 2nd ed, New York: Cambridge Univ. Press, 1992,pp. 412–420.
[28] SPSS Inc., , , SPSS Professional Statistics, Chicago, IL, 1997.[29] A. B. Poirson and B. A. Wandell, “Appearance of colored patterns: Pat-
tern-color separability,”J. Opt. Soc. Amer. A, vol. 10, Dec. 1993.[30] S. Santini and R. Jain, “Similarity Matching,”IEEE Trans. Pattern Anal.
Machine Intell., to be published.
Aleksandra Mojsilovic (S’93–M’98) was born inBelgrade, Yugoslavia, in 1968. She received theB.S.E.E., M.S.E.E., and Ph.D. degrees from theUniversity of Belgrade, Belgrade, Yugoslavia, in1992, 1994, and 1997, respectively.
From 1994 to 1998, she was a member of the aca-demic staff at Department of Electrical Engineering,University of Belgrade. Since 1998, she has beena Member of Technical Staff, Bell Laboratories,Lucent Technologies, Murray Hill, NJ. Her mainresearch interests include multidimensional signal
processing, computer vision, and image analysis.
Jelena Kovacevic (S’88–M’91–SM’96) receivedthe Dipl. Electr. Eng. degree from the ElectricalEngineering Department, University of Belgrade,Yugoslavia, in 1986, and the M.S. and Ph.D. degreesfrom Columbia University, New York, NY, in 1988and 1991, respectively.
In November, 1991, she joined AT&T Bell Labo-ratories (now Lucent Technologies), Murray Hill, NJ,as a Member of Technical Staff. In the fall of 1986,she was a Teaching Assistant at the University of Bel-grade. From 1987 to 1991, she was a Graduate Re-
search Assistant at Columbia University. In the summer of 1985, she workedfor Gaz de France, Paris, France, during the summer of 1987 for INTELSAT,Washington, DC, and in the summer of 1988 for Pacific Bell, San Ramon, CA.Her research interests include wavelets, multirate signal processing, data com-pression, and signal processing for communications. She is the coauthor of thebook (with M. Vetterli)Wavelets and Subband Coding,(Englewood Cliffs, NJ:Prentice-Hall, 1995).
Dr. Kovacevic served as an Associate Editor of the IEEE TRANSACTIONS ON
SIGNAL PROCESSINGand as the Guest Co-editor (with I. Daubechies) of thespecial issue on wavelets of the PROCEEDINGS OF THEIEEE. She is on the edi-torial boards of theJournal of Applied and Computational Harmonic Analysis,Journal of Fourier Analysis and Applications, andSignal Processing. She is onthe IMDSP technical committee of the Signal Processing Society of the IEEEand was the General Co-chair (with J. Allerbach) of the Ninth Workshop Imageand Multidimensional Signal Processing. She received the Belgrade OctoberPrize for student scientific achievements awarded for the Engineering Diplomathesis in October 1986, and the E. I. Jury Award at Columbia University foroutstanding achievement as a graduate student in the areas of systems, commu-nication, or signal processing.
Jianying Hu (M’93) studied electrical engineeringat Tsinghua University in Beijing, China, from 1984to 1988. She received the M.S. and Ph.D. degrees incomputer science from the State University of NewYork at Stony Brook in 1991 and 1993, respectively.
Since 1993, Dr. Hu has been a Member ofTechnical Staff at Bell Laboratories, Lucent Tech-nologies, Murray Hill, NJ. Her current researchinterests include document structure analysis,content based image retrieval, information retrieval,multimedia information systems, and handwriting
recognition. She is a member of the ACM.
Robert H. Safranek (M’80–SM’92) was born inManitowoc, WI, in 1958. He received the B.S.E.E.degree in 1980, the M.S.E.E. degree in 1982, and thePh.D. degree in 1986, all from Purdue University,West Lafayette, IN. While at Purdue, he workedin the areas of parallel processing, speech coding,computer vision, and robotics. Since 1986, he hasbeen with Bell Laboratories, Lucent Technologies,Murray Hill, NJ. His research interests includehuman and machine perception, digital video,networked multimedia, film and video production,
and hardware/software systems for signal processing.While at Bell Labs, he worked on a variety of problems in the area of
image and video processing. He was a member of the team that developed theAT&T/Zenith submission to the U.S. HDTV standardization process. He hasalso been active in investigating and promoting the use of human perception insignal processing systems. Currently, he is working in the areas of networkedmultimedia and multimedia information retrieval.
Dr. Safranek holds 17 U.S. patents and numerous foreign patents and haspublished extensively. In 1995, he was awarded the IEEE Donald G. Fink Prizefor his paper “Signal compression based on models of human compression”(co-authored with J. D. Johnston and N. S. Jayant). He is a member of the EtaKappa Nu, SMPTE, and a Member of the IEEE Image and MultidimensionalSignal Processing Technical Committee.

54 IEEE TRANSACTIONS ON IMAGE PROCESSING, VOL. 9, NO. 1, JANUARY 2000
S. Kicha Ganapathy (M’82) received the B.Tech.degree in electrical engineering from the IndianInstitute of Technology (IIT), Bombay, in 1967, theM.Tech. degree in electrical engineering from IIT,Kanpur, in 1969, and the Ph.D. degree in computerscience from Stanford University, Stanford, CA, in1976 in the area of computer vision.
He was on the faculty at the University ofMichigan, Ann Arbor, from 1976 to 1982, andconducted research in the areas of computer vision,computer graphics, and robotics. Since 1982, he
has been with Bell Laboratories, Lucent Technologies, Murray Hill, NJ, andbecame a Research Department Head in 1985. In that capacity, he codirectedwork that put Bell Laboratories in the forefront of robotics. These includerobot ping-pong player, telerobotics, and the pioneering work in siliconmicromachines. Subsequently, he initiated and led the team that created virtualreality based video games, an example of which can be seen at the AT&Tpavilion at Epcot Center. Currently, he is a Member of Technical Staff inthe Multimedia Communications Research Laboratory, and is engaged in thearea of multimedia information retrieval based on psychophysics of humanperception. In particular, he is leading an R&D effort at Lucent Technologiesthat is applying these research ideas to the emerging field of electronic retailingand related business in e-commerce.