Predicting Fatigue Life with ANSYS Workbench Predicting Fatigue ...

Matching and Predicting Street Level Images
Biliana Kaneva1, Josef Sivic2, Antonio Torralba1, Shai Avidan3, andWilliam T. Freeman1
1Massachusetts Institute of Technology{biliana,torralba,billf}@csail.mit.edu
2 INRIA, WILLOW, Laboratoire d’Informatique de l’Ecole Normale [email protected]
3Tel-Aviv University, Adobe [email protected]
Abstract. The paradigm of matching images to a very large datasethas been used for numerous vision tasks and is a powerful one. If theimage dataset is large enough, one can expect to find good matches ofalmost any image to the database, allowing label transfer [3, 15], andimage editing or enhancement [6, 11]. Users of this approach will wantto know how many images are required, and what features to use forfinding semantic relevant matches. Furthermore, for navigation tasks orto exploit context, users will want to know the predictive quality of thedataset: can we predict the image that would be seen under changes incamera position?We address these questions in detail for one category of images: streetlevel views. We have a dataset of images taken from an enumeration ofpositions and viewpoints within Pittsburgh. We evaluate how well we canmatch those images, using images from non-Pittsburgh cities, and howwell we can predict the images that would be seen under changes in cam-era position. We compare performance for these tasks for eight differentfeature sets, finding a feature set that outperforms the others (HOG).A combination of all the features performs better in the prediction taskthan any individual feature. We used Amazon Mechanical Turk workersto rank the matches and predictions of different algorithm conditions bycomparing each one to the selection of a random image. This approachcan evaluate the efficacy of different feature sets and parameter settingsfor the matching paradigm with other image categories.
1 Introduction
An important resource for the computer vision research community is the manyimages available through the Internet or large-scale acquisition and storage. Anatural task for a large dataset, not possible for smaller ones, is to find closevisual matches to a test image. While each image is unique, in a large dataset,close enough matches may be found to enable transfer of the object or regionlabels the retrieved image may have [3, 15], or exploiting the retrieved imagesfor editing [11] or enhancement [6] of the query image.
We call the task of finding a semantically meaningful matches to a test im-age the matching task. To make the matching task feasible in the applications

2 Matching and Predicting Street Level Images
above, the set of retrieved images is usually restricted to some category, suchas indoor scenes, faces, or city images taken from street level. To support thisclass of computer vision algorithm, we need to understand various fundamentalproperties of this approach. How well do the methods scale with the datasetsize? What are the best features to use to find semantically meaningful nearestneighbor matches?
The matching task asks how well a collection of test images can match adataset of images, and indicates the coverage of a set of test images by thereference database. To study the structure of all the images within the givencategory, we also want to address the prediction task: how well can images fromone camera position and orientation predict the image taken by a camera at aneighboring position or orientation? This tells us spatial regularities within theimage database, and has applications in two broad domains: to study spatialconsistencies within the image database, and to predict images from a movingcamera. Knowledge of such regularities is needed to form more powerful imageprior probabilities, useful for image synthesis and reconstruction (for example, [6,9]). The prediction task provides another way to ask a question of importance inthe object recognition community, how well can context predict image content [7,24]? The prediction task is used implicitly by mobile agents in the world (peopleor robots) in deciding where to look or move next.
We want to know: how well can we match? how well can we predict? what arethe regularities of the visual world, and how accessible are they through largedatasets? We will study this problem restricted to one class of images: outdoorstreet scenes. The restriction to one image category provides us with a varietyof images, yet a tractable set. This class of images is of commercial interest formapping and commerce.
There have been informal studies of matching or prediction for individualapplications [11, 21], but systematic study of these properties have not beenundertaken. In the past, large image databases were used to fill in holes in animage [11] or create infinite images from photographs taken at the differentlocations in the real world [21]. The evaluation of [11] did not address the tasksof matching or prediction, and the method was user-assisted, not automatic asours is. Prior work on multiperspective panoramas [1, 19, 27] focuses on usinglarge number of images all taken from the same location but from different viewpoints and stitching them together. Similarly, the PhotoTourism interface [22]places a large collection of images of one particular geographic location in acommon 3D space. Here we use image transformations similar to those of [21]but we focus on a database of outdoor city scenes from many different parts of theworld that were downloaded from various photo sharing websites. In addition, wedesign and execute an quantitative experimental evaluation and compare severalstate-of-the-art image descriptors for the matching and prediction tasks.
To measure how well the system works, we use a ground truth databasesynthesized from 10,000 geo-referenced images from the Google Street View dataset of Pittsburgh [10].

Matching and Predicting Street Level Images 3
Fig. 1. Prediction and matching. Top row: Query Image. Transformed query imagefor rotate right motion. The prediction obtained by finding the nearest neighbor usingthe transformed query (the prediction task). Ground truth (the actual view seen afterthe camera rotated from the query image). Top match to the ground truth image (thematching task). Bottom row: The transformed query image and the top predictionimage retrieved with the bins used for retrieval overlaid. The ground truth and the topmatch images and the bins used for the retrieval overlaid.
In the matching task, we ask how well can we explain street-level imagesfrom Pittsburgh from outdoor images taken in any city other than Pittsburgh?In the prediction task, we ask what regularities are in common across imagesof Pittsburgh and of other cities in the world such that we can predict imagesof Pittsburgh under different camera transformations? The matching and pre-diction tasks are illustrated in figure 1. We conduct large scale experiments toevaluate both the matching task and the prediction task using various imagerepresentation methods, various database size and various camera motions (forprediction). We evaluate the quality of the matches and predictions in a userstudy performed using Amazons Mechanical Turk web service.
2 Database, Features, and Transformations
In this section we describe our image database, give details of the comparedimage features, and outline our image matching and prediction methods.
2.1 Image database
Our premise is that if we had enough images of the world, we will be ableto make predictions about what is around us. Here, we focus on images of anurban environment. We created a large database of 100, 000 images of outdoorstreet scenes downloaded from Flickr. The images typically have resolution of500x375 pixels. We used image tag information, e.g. ”Paris street” or ”Seattlealley”, to select candidate city street scenes. Due to noise in the tags, therewere many images that did not belong to the outdoor city theme, includingindoor scenes and portraits of people. To reduce the amount of noise, we trainedan SVM scene classifier, similar to [4, 14], to prune out the images that do not

4 Matching and Predicting Street Level Images
belong to the city theme. We manually labeled the training data of 1000 positiveand 2000 negative training images with the help of a labeling interface that wehave developed. The tool allows the user to interactively train the classifier andprovides visual feedback about its performance after each iteration. It can beused for the creation of databases with other themes. Currently, we only considerimages in landscape format with aspect ratio close to 4:3.
2.2 Image representations
Here we describe the different image representations we investigate for the match-ing and prediction tasks. Similar representations were used by [28] for the tasksof scene detection and classification.
i. GIST descriptor: The GIST descriptor has been shown to work well for sceneclassification [18]. It measures the oriented edge energy at different scale levelsaggregated into coarse spatial bins. We create a 480 dimensional feature vectorby first converting the image to grayscale and then dividing it in 6x4 bins andapplying 8, 8, and 4 orientation filters at three difference scales (coarse to fine)to each bin. The GIST descriptor for each image is normalized to have unit L2norm.
ii. Histograms of oriented gradients (HOG): The HOG descriptor [5] and itsvariants [8] have demonstrated excellent performance for object and human de-tection. Similar to the SIFT [16], the HOG descriptor measures histograms ofimage gradient orientation at a coarse grid of spatial locations. First, HOG de-scriptors are densely extracted on a regular grid at steps of 8 pixels using thecode available online provided by [8]. This gives a 31-dimension descriptor foreach node of the grid. Then, 2x2 neighboring HOG descriptors are stacked to-gether to form a descriptor with 124 dimensions. The stacking has overlappingon the grid, and the 124-dimension descriptors are quantized into 300 visualwords by k-means. The quantized descriptors are then spatially binned into acoarse grid of 6x4 bins, similar to the GIST descriptor. The resulting histogramis normalized to have unit L1 norm.
iii. The self-similarity descriptor (SSIM): The self-similarity descriptor [20] hasbeen shown to perform well on matching objects of similar shape but vastly dif-ferent local appearance. The idea is to represent the appearance in a local imagearea around a particular image patch by the “correlation map” of the patch withits neighborhood. The descriptor captures the local pattern of self-similaritiy.Such self-similarity patterns can then be matched despite a very different ap-pearance of the central patch. We employ the self-similarity descriptor for scenerepresentation.
The self-similarity descriptors are computed on a regular grid at steps offive pixels. Each descriptor is obtained by computing the correlation map of a5x5 patch in a window with radius equal to 40 pixels, then quantizing it in 3radial bins and 10 angular bins, obtaining 30 dimensional descriptor vectors.The descriptors are then quantized into 300 visual words by k-means. Similarto HOG, the self-similarity descriptors are spatially binned into a coarse grid of6x4 bins, and normalized to have unit L1 norm.

Matching and Predicting Street Level Images 5
iv. Dense SIFT: Densely extracted SIFT descriptors have been shown to workwell in both object and scene recognition [14]. Here, we extract the descriptor ona regular grid at steps of 5 pixels using a window at two scales (4x4 and 8x8). Thedescriptors are stacked together for each HSV color channel and quantized into300 visual words by k-means. The quantized descriptors are then spatially binnedinto a coarse grid of 6x4 bins, similar to the GIST descriptor. The resultinghistogram is normalized to have unit L1 norm.
v. Geometric context (GC): The geometric context classifiers [12] estimate thecoarse geometric layout of natural scenes with respect to the camera. It hasbeen shown to work well as a spatial prior for object detectors [13]. Here weinvestigate it for the task of scene matching and prediction. We use only the(i) ground, (ii) sky, (iii) vertical and (iv) porous classes as they are more reli-ably detected. We reduce the probability outputs of each of the four geometricclasses to 32x32 pixels resulting in a 256-dimensional descriptor. The resultingdescriptor is normalized to have unit L2 norm.
vi. Tiny images (Tiny32): As a baseline we also include the tiny image rep-resentation of Torralba et al. [25]. The most trivial way to match scenes is tocompare them directly in color image space. Reducing drastically the image di-mensions makes this approach more computationally feasible and less sensitiveto exact alignment. This method of image matching has been examined thor-oughly [25] for the purpose of object recognition and scene classification. Each ofthe RGB channels is subsampled to 32x32 pixels resulting in a 3,072 dimensionaldescriptor. The images are then normalized to have unit L2 norm.
vii. Texton histogram: Textons as elementary units in image analysis were intro-duced in [17]. We use a 512 entry universal texton dictionary built by clusteringthe responses of filters at 8 different orientations, 2 different scales and elonga-tions. We then build a 512-dimensional histograms spatially binned into a coarsegrid of 6x4 bins by assigning the result of the filter responses at each pixel tothe nearest texton dictionary entry. The histogram is normalized to have unitL1 norm.
viii. Color histogram: We compute color histograms in CIE L*a*b* color spacewith 4, 14, and 14 bins in L, a, and b, similar to [28]. The histograms are thenspatially binned into a coarse grid of 6x4 bins and normalized to unit L1 norm.
Next we describe the matching and description procedures.
2.3 Nearest neighbor image matching
In the matching task, the goal is to find the best matching image in the streetscene database given the query. Recently, there has been some success in semanticscene matching using nearest neighbor techniques in large databases of millionsof images [11, 25] and we follow this work here. This matching is performedusing an exhaustive nearest neighbor search, though faster but approximate
6 Matching and Predicting Street Level Images
indexing techniques could be used [26]. For the (normalized) GIST, tiny imageand geometric context descriptors we use the Euclidean distance. For the HOG,self-similarity, dense SIFT, texton and color histograms we use the χ2 distance.
We also investigate a combination of all descriptors (denoted All). This isachieved by a simple weighted average of the distances using individual descrip-tors. Here we investigate uniformly set weights, but weights learnt on a separatetraining set can be also used [2]. Uniform weights are a reasonable choice in ourcase, as the range of distances for each of the normalized descriptors is between0 and 1.
2.4 Prediction using transformed image retrieval
In the prediction task, we would like to predict what we will see if we move thecamera. Given a query image, we want to find possible candidates describingthe parts of the scene not captured by the camera. We extend traditional im-age retrieval to find matches that simulate a particular camera motion withoutexplicitly modeling the geometry of the scene. Instead, we apply 2D transforma-tions to the query image. We achieve horizontal camera rotation by warping theimage using the appropriate homography [23](page 11)
H = K R K−1, (1)
where K is the internal calibration matrix and R the camera rotation matrix.For specifying K, we set the unknown focal length to be half the image width.For specifying R we assume no vertical or in-plane rotation. The 3D zoom-outmotion (or backward motion) is approximated by scaling the image ignoring theparallax effects. The transformed query image has missing pixels because notall the information of what the camera would see after the transformation isavailable in the original query image. Therefore, we can only use a subset of thefeature vector to perform the transformed image retrieval (Fig. 1). Given theobserved portion of the transformed query image, we can now find semanticallysimilar images that approximate the new camera point of view. For rotation, wetake about half of the overlapping image. For zoom, we use a scaled version ofthe image depending on the amount of zoom. The retrieval is performed usingthe nearest neighbor search as outlined in section 2.3 but only using the observedportion of the transformed query image.
3 Evaluation methods
To compare the different descriptors for the matching and prediction tasks wehave collected the following ground truth image test set and designed an evalu-ation procedure based on human judgment of visual similarity.
3.1 Ground truth data set
We gathered ground truth data from the Google Street View Pittsburgh data set[10], which is provided by Google for research purposes. The data set containsabout 10, 000 high-resolution spherical panoramas collected by a moving vehicle

Matching and Predicting Street Level Images 7
for the Street View feature of Google Maps. Each panorama has a field of view of360 degrees horizontally and 180 degrees vertically. To synthesize images similarto those in our Flickr city database, we unwarp portions of the spherical panora-mas simulating a camera with 45 degree field of view with rotation stops at every22.5 degrees [23]. From the synthesized images, we selected 300 representativepairs for each motion - rotate right, and zoom out - for our ground truth data set.Each pair contains the query image for our test set and its corresponding groundtruth match based on the camera motion. Having ground truth data allows usto measure the quality of the different image representations used for matchingand making predictions about what the camera would see if it performed a givencamera motion.
3.2 Performance measures
As a performance measure we use human judgment of visual similarity of thematched / predicted image to the ground truth. We sought to evaluate the visualquality of the images retrieved using a variety of different feature descriptors.Rather than assessing pairwise comparisons between each possible descriptor’sresults, we compared the results from each feature descriptor against a randomselection from the image database. This allowed us to evaluate performance ofall the descriptors with respect to a common scale and reduced the complexityof the evaluation task.
We designed and conducted experiments using the Amazon Mechanical Turkto compare the performance of the different features for the matching and pre-diction tasks. We divided each experiment of 300 test query images into 10 tasksand each task contained 30 examples.
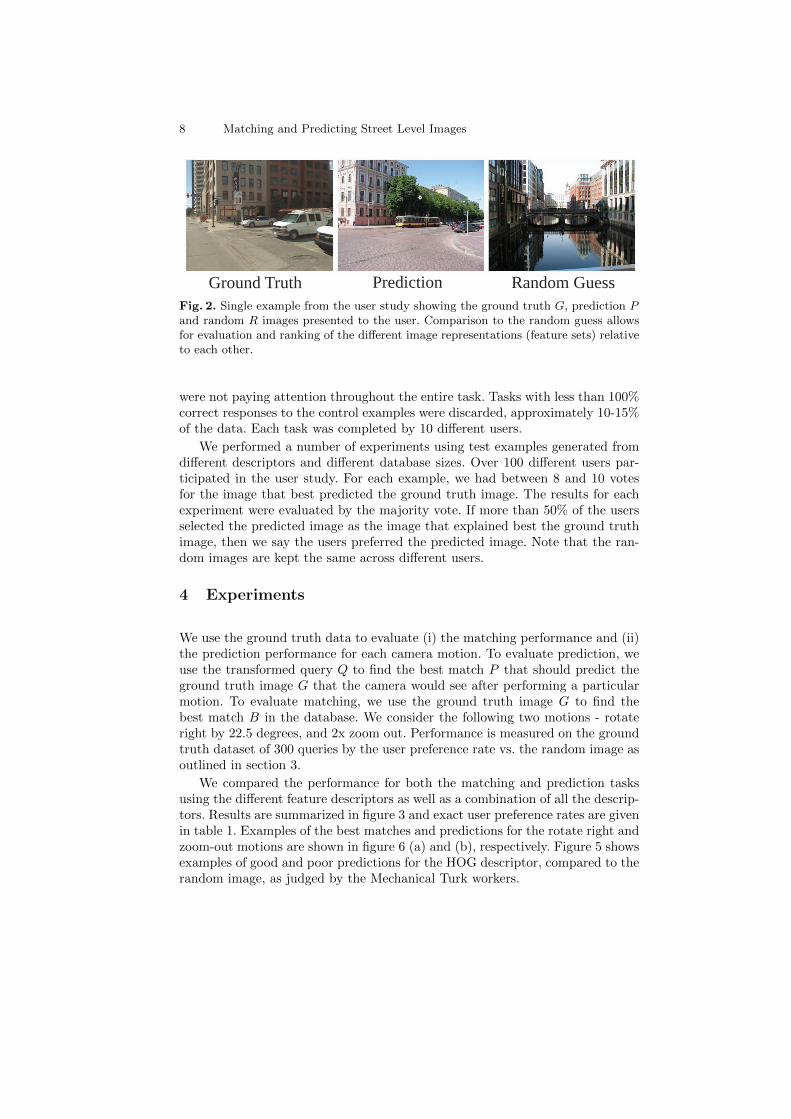
To evaluate the prediction performance, an example included (i) the groundtruth image G (the actual view after the camera transformation), (ii) the pre-dicted image P from the database obtained using the transformed image re-trieval and (iii) a random image R from the database (Fig. 2). The users werethen asked to select which one of the (ii) predicted image or the (iii) randomimage was most like the (i) ground truth image, based on visual similarity of thescene type, common objects and their locations in the images. The predicted andrandom images were presented in a random order to eliminate possible bias ifusers had a preference in selecting the first or the second image more often. Therandom image in the triplet is kept the same across different evaluated features.The chance performance for this task is 50%. The best performance, i.e. if theusers prefer the predicted image over the random image for all 300 test queries,would be 100%
Similarly, to evaluate the matching task an example included: (i) the groundtruth image G, (ii) the best match from the database B (obtained by matchingdirectly on G without a transformation), and (iii) a random image R from thedatabase.
To ensure the quality of the work, we set a qualification requirement thatallowed only users with 95% task acceptance rate to participate. Furthermore,we added six control examples to each task presented in a random order. Thecontrol examples had a clear correct answer and allowed us to remove users that
8 Matching and Predicting Street Level Images
Ground Truth Prediction Random GuessFig. 2. Single example from the user study showing the ground truth G, prediction Pand random R images presented to the user. Comparison to the random guess allowsfor evaluation and ranking of the different image representations (feature sets) relativeto each other.
were not paying attention throughout the entire task. Tasks with less than 100%correct responses to the control examples were discarded, approximately 10-15%of the data. Each task was completed by 10 different users.
We performed a number of experiments using test examples generated fromdifferent descriptors and different database sizes. Over 100 different users par-ticipated in the user study. For each example, we had between 8 and 10 votesfor the image that best predicted the ground truth image. The results for eachexperiment were evaluated by the majority vote. If more than 50% of the usersselected the predicted image as the image that explained best the ground truthimage, then we say the users preferred the predicted image. Note that the ran-dom images are kept the same across different users.
4 Experiments
We use the ground truth data to evaluate (i) the matching performance and (ii)the prediction performance for each camera motion. To evaluate prediction, weuse the transformed query Q to find the best match P that should predict theground truth image G that the camera would see after performing a particularmotion. To evaluate matching, we use the ground truth image G to find thebest match B in the database. We consider the following two motions - rotateright by 22.5 degrees, and 2x zoom out. Performance is measured on the groundtruth dataset of 300 queries by the user preference rate vs. the random image asoutlined in section 3.
We compared the performance for both the matching and prediction tasksusing the different feature descriptors as well as a combination of all the descrip-tors. Results are summarized in figure 3 and exact user preference rates are givenin table 1. Examples of the best matches and predictions for the rotate right andzoom-out motions are shown in figure 6 (a) and (b), respectively. Figure 5 showsexamples of good and poor predictions for the HOG descriptor, compared to therandom image, as judged by the Mechanical Turk workers.

Matching and Predicting Street Level Images 9
Comparison of different scene descriptors: The best prediction performance isachieved by a combination of all of the descriptors as shown in Fig. 3. Theclear winner among the individual descriptors in both the prediction and thematching tasks is the HOG feature descriptor as shown in Fig. 3. It performs ex-tremely well for the zoom out motion with 92% preference rate in the matchingtask and 84% in the prediction task. This is interesting and confirms the goodperformance of bag-of-features methods with coarse spatial binning for imageand scene classification tasks [14, 4] (though these methods are based on thequantized SIFT [16] descriptor rather than quantized HOG [5]). The predictionresults using the dense SIFT descriptor are similar to those of the HOG de-scriptor for both types of motions, however the HOG descriptor performs betterin the matching task. For the rotate right motion, the geometric context (GC),self-similarity descriptor (SSIM), GIST and the color and texton histograms per-form about the same – around 60%. The tiny image descriptor performs slightlyabove the chance performance (50%).
Matching vs. prediction performance: In the majority of the cases, the descriptorsperformed better at the matching task. This is to be expected since there is moreinformation available in this case as we use the entire ground truth image toretrieve similar images from the database. For prediction, only the visible portionof the transformed query image is used (Fig. 1). Nevertheless, the significantlyabove chance (50%) results on the prediction task (77% for rotate-right and 88%for zoom-out) suggest it is possible, to some extent, to predict the appearanceoutside the boundary of the image for the street scenes considered in this work.
Interestingly, the performance of the self-similarity descriptor (SSIM) in theprediction task is significantly better than that for the matching task. One pos-sible explanation are the matches on night images (see the fourth column of thetop row of Fig. 6 (b) for the SSIM descriptor). The self-similarity descriptor islargely invariant to illumination. The users were generally influenced by colorwhen selecting similar images even though they were not explicitly asked tocompare the images based on color appearance.
For zoom-out motion, the geometric context (GC) is performing significantlyworse for prediction than matching. This might be due to the fact that for thezoom-out prediction the transformed retrieval uses only the middle portion of thedatabase images. This typically excludes the ground plane region – an importantfeature for geometric context.
Rotate vs. zoom-out motion: Most of the descriptors perform better in the match-ing task for the zoom out motion than for the rotate right motion, despite thefact that the matching task is the same for both motions (i.e. no transformationis applied to the query). This is likely due to the nature of our ground truthtest datasets where most of the images for the zoom out motion are perspectiveviews of streets (see Fig. 6 (b)), which are well represented in the database ofFlickr images. For the rotate motion the test set is more varied making the taskconsiderably harder. Similar behavior is observed for the prediction task, furtheremphasizing the easier nature of the zoom-out motion test data.

10 Matching and Predicting Street Level Images
Motion Rotate Right Zoom Out
Features Matching Prediction Matching Prediction
All 80% 77% 86% 88%
HOG 78% 69% 92% 84%
Dense SIFT 69% 69% 85% 84%
GC 64% 61% 71% 40%
Color Hist 63% 63% 57% 61%
Texton Hist 63% 61% 89% 85%
SSIM 62% 54% 77% 85%
GIST 59% 61% 64% 63%
Tiny32 56% 55% 74% 73%
Table 1. Performance of the different features in the matching and prediction tasks(sorted by performance).
The effect of increasing database size: We performed an additional experimentvarying the size of the database of Flickr images between 1K, 10K, and 100K.For this experiment, we used the best performing feature descriptor on the 100Kdatabase (HOG) with the rotate right and zoom out motions. We selected a ran-dom subset of 1K and 10K images from our 100K database. The matching andprediction performance is shown in figure 4. Increasing the database size from1K to 10K results in a marked improvement for both the matching and predic-tion tasks for the rotate right motion (Fig. 4 (a)). However, the performancedoes not change significantly as the database increases to 100K images. In fact,the prediction performance decreases slightly for the 100K dataset, though thisdecrease is likely to be within the evaluation error (due to the random selectionof comparison images). The performance for the zoom out motion for both tasksdoes not change significantly with the change in database size. Others have ob-served a steady increase in image matching performance with database size forrecognition [25] or computer graphics [11] applications. In our case, the lack ofobservable improvement for the zoom out motion and when going from the 10Kto the 100K dataset for the rotate right motion might be due to the fact thatour Flickr database has been carefully pre-filtered (section 2) to contain mostlystreet scenes. The use of a scene classifier to select the images in our dataset mayhave reduced the variability in the data where adding images beyond 1K (forzoom out) or 10K (for rotate right) does not provide any additional informationto make the tasks easier to solve. The reason for the lower bound for zoom outmotion may be due to the easier nature of the ground truth data set where mostof the scenes are of perspective street views.
5 Conclusions
We have studied the properties of an instance of a general computer visionalgorithm: match a test image to examples in a large dataset of images of thecorresponding class (street level views, in this case). This general approach hasmany current and potential applications [15, 3, 11, 6], and we study fundamentalissues: How many images do we need to find semantically meaningful matches?

Matching and Predicting Street Level Images 11
0%10%20%30%40%50%60%70%80%90%
100%
Rotate Right
Prediction
Matching
0%10%20%30%40%50%60%70%80%90%
100%
Zoom Out
Prediction
Matching
(a) (b)
Fig. 3. Performance of the different features in the matching and prediction tasks(sorted by matching performance). a) Rotate Right. b) Zoom Out.
0%10%20%30%40%50%60%70%80%90%
100%
Matching Prediction
HOG Features - Rotate Right
1K10K100K
0%10%20%30%40%50%60%70%80%90%
100%
Matching Prediction
HOG Features - Zoom Out1K10K100K
(a) (b)
Fig. 4. Performance of HOG feature descriptor on different database sizes. a) RotateRight. b) Zoom Out.
What features should we use to do so? Further, we study properties of theimages in the class with respect to navigation, and we ask: how regular is theimage dataset across changes in camera position?
We use Amazon Mechanical Turk workers to judge image matching and pre-diction performance relative to a random image choice as a way to assess therelative power of different algorithm choices.
We find that histograms of quantized HOG features worked best of the eightindividual categories of features we tested. A dataset size of 100,000 imageswas sufficient to match images with 78 to 92 percent favoring the retrievedimage over a random selection. We found there was sufficient regularity in thestreetview datasets to predict images at new camera positions, almost to theaccuracy to which images can be matched. In this case, a combination of all thefeatures performed better than any individual feature set alone. The experimentsdescribed here allow us to calibrate and characterize datasets for the matchingand prediction tasks, useful for dataset driven recognition and navigation.

12 Matching and Predicting Street Level Images
Fig. 5. Examples of image triplets shown to the user. The first three columns showexamples where the users picked the prediction based on the HOG feature descriptorfrom a 100K database. The second three columns show examples where the userspreferred the random image.
Acknowledgements
We acknowledge the funding support of ARDA VACE, NGA NEGI-1582-04-0004, MURI Grant N00014-06-1-0734, ANR project HFIBMR (ANR-07-BLAN-0331-01), the MSR-INRIA laboratory and a Xerox Fellowship.
References
1. A. Agarwala, M. Agrawala, M. Cohen, D. Salesin, and R. Szeliski. Photographinglong scenes with multi-viewpoint panoramas. ACM Transactions on Graphics,2006.
2. F. R. Bach, R. Thibaux, and M. I. Jordan. Computing regularization paths forlearning multiple kernels. In Advances in Neural Information Processing Systems,2004.
3. A. C. Berg, T. L. Berg, and J. Malik. Shape matching and object recognition usinglow distortion correspondence. In IEEE Computer Vision and Pattern Recognition(CVPR), 2005.
4. A. Bosch, A. Zisserman, and X. Munoz. Scene classification using a hybrid gener-ative/discriminative approach. IEEE Trans. Pattern Analysis and Machine Intel-ligence, 30(4), 2008.
5. N. Dalal and B. Triggs. Histograms of oriented gradients for human detection. InProc. IEEE Conf. Computer Vision and Pattern Recognition, 2005.
6. K. Dale, M. K. Johnson, K. Sunkavalli, W. Matusik, and H. Pfister. Image restora-tion using online photo collections. In IEEE International Conference on ComputerVision (ICCV), 2009.

Matching and Predicting Street Level Images 13
7. S. Divvala, D. Hoiem, J. Hays, A. Efros, and M. Hebert. An empirical study ofcontext in object detection. In Proceedings of the IEEE Conf. on Computer Visionand Pattern Recognition (CVPR), June 2009.
8. P. Felzenszwalb, D. McAllester, and D. Ramanan. A discriminatively trained,multiscale, deformable part model. In Proc. IEEE Conf. Computer Vision andPattern Recognition, 2008.
9. R. Fergus, B. Singh, A. Hertzmann, S. T. Roweis, and W. Freeman. Removing cam-era shake from a single photograph. ACM Transactions on Graphics, SIGGRAPH2006 Conference Proceedings, Boston, MA, 25:787–794, 2006.
10. Google. Google Street View Pittsburgh data set. Inhttp://maps.google.com/help/maps/streetview/, 2008.
11. J. Hays and A. A. Efros. Scene completion using millions of photographs. Proc.ACM SIGGRAPH, 26(3):4:1–4:7, 2007.
12. D. Hoiem, A. Efros, and M. Hebert. Geometric context from a single image. InProc. IEEE Int. Conf. Computer Vision, 2005.
13. D. Hoiem, A. Efros, and M. Hebert. Putting objects in perspective. In Proc. IEEEConf. Computer Vision and Pattern Recognition, 2006.
14. S. Lazebnik, C. Schmid, and J. Ponce. Beyond bags of features: Spatial pyramidmatching for recognizing natural scene categories. In Proc. IEEE Conf. ComputerVision and Pattern Recognition, 2006.
15. C. Liu, J. Yuen, and A. Torralba. Dense scene alignment using SIFT flow for objectrecognition. In Proc. IEEE Conf. Computer Vision and Pattern Recognition, 2009.
16. D. Lowe. Object recognition from local scale-invariant features. InProc. IEEE Int. Conf. Computer Vision, Sept. 1999.
17. J. Malik, S. Belongie, J. Shi, and T. Leung. Textons, contours and regions: Cueintegration in image segmentation. In Proc. IEEE Int. Conf. Computer Vision,pages 918–925, 1999.
18. A. Oliva and A. Torralba. Modeling the shape of the scene: a holistic representationof the spatial envelope. Int. Journal of Computer Vision, 42(3):145–175, 2001.
19. P. Rademacher and G. Bishop. Multiple-center-of-projection images. ACM Trans-actions on Graphics, 1998.
20. E. Shechtman and M. Irani. Matching local self-similarities across images andvideos. In Proc. IEEE Conf. Computer Vision and Pattern Recognition, 2007.
21. J. Sivic, B. Kaneva, A. Torralba, S. Avidan, and W. T. Freeman. Creating andexploring a large photorealistic virtual space. In First IEEE Workshop on InternetVision, 2008.
22. N. Snavely, S. M. Seitz, and R. Szeliski. Photo tourism: Exploring photo collectionsin 3D. In Proc. ACM SIGGRAPH, 2006.
23. R. Szeliski. Image alignment and stitching: A tutorial. Foundations and Trends inComputer Graphics and Computer Vision, 2006.
24. A. Torralba. Contextual priming for object detection. Int. Journal of ComputerVision, 53:169–191, 2003.
25. A. Torralba, R. Fergus, and W. T. Freeman. 80 million tiny images: a large datasetfor non-parametric object and scene recognition. IEEE Trans. Pattern Analysisand Machine Intelligence, 30(11):1958–1970, 2008.
26. Y. Weiss, A. Torralba, and R. Fergus. Spectral hashing. In Advances in NeuralInformation Processing Systems, 2009.
27. D. N. Wood, A. Finkelstein, J. F. Hughes, C. E. Thayer, and D. Salesin. Multi-perspective panoramas for cel animation. ACM Transactions on Graphics, 1997.
28. J. Xiao, J. Hays, K. A. Ehinger, A. Torralba, and A. Oliva. SUN database: Largescale scene recognition from Abbey to Zoo. In Proc. IEEE Conf. Computer Visionand Pattern Recognition, 2010.

14 Matching and Predicting Street Level Images
Fig. 6. Example matches and predictions on a 100K database. a) Rotate Right. b)Zoom Out. For each descriptor the images shown in: Top row - Matches to the groundtruth; Bottom row - Predictions of the ground truth image based on the query image.