Mata Kuliah E P I D E M I L O G I Overview of Epidemiology · Mata Kuliah E P I D E M I L O G I...
21
1 Overview of Mata Kuliah E P I D E M I L O G I Overview of Epidemiology Overview 1 SESI 1 Prof. dr. M. Hakimi, Sp.OG, PhD Overview 2
-
Upload
truongtruc -
Category
Documents
-
view
213 -
download
0
Transcript of Mata Kuliah E P I D E M I L O G I Overview of Epidemiology · Mata Kuliah E P I D E M I L O G I...

1
Overview of
Mata KuliahE P I D E M I L O G I
Overview of Epidemiology
Overview 1
SESI 1Prof. dr. M. Hakimi, Sp.OG, PhD
Overview 2
2
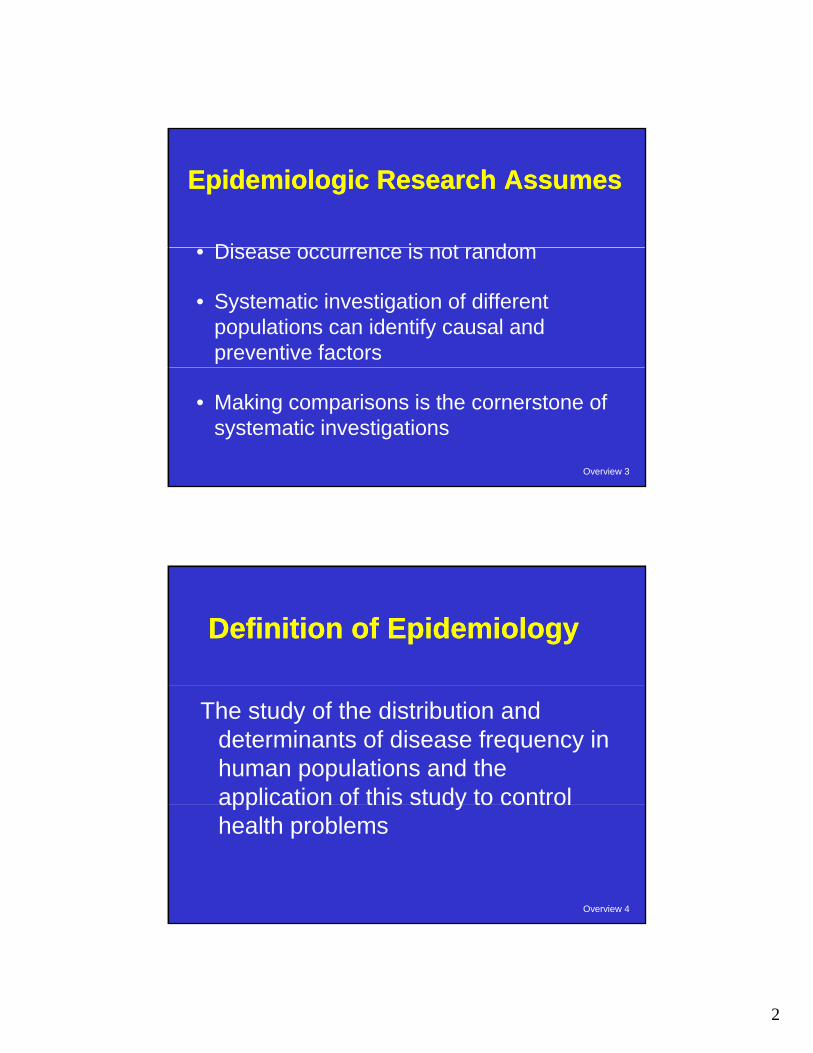
Epidemiologic Research AssumesEpidemiologic Research Assumes
Disease occ rrence is not random• Disease occurrence is not random
• Systematic investigation of different populations can identify causal and preventive factors
Overview 3
• Making comparisons is the cornerstone of systematic investigations
Definition of EpidemiologyDefinition of Epidemiology
The study of the distribution and determinants of disease frequency in human populations and the application of this study to control
Overview 4
application of this study to control health problems
3
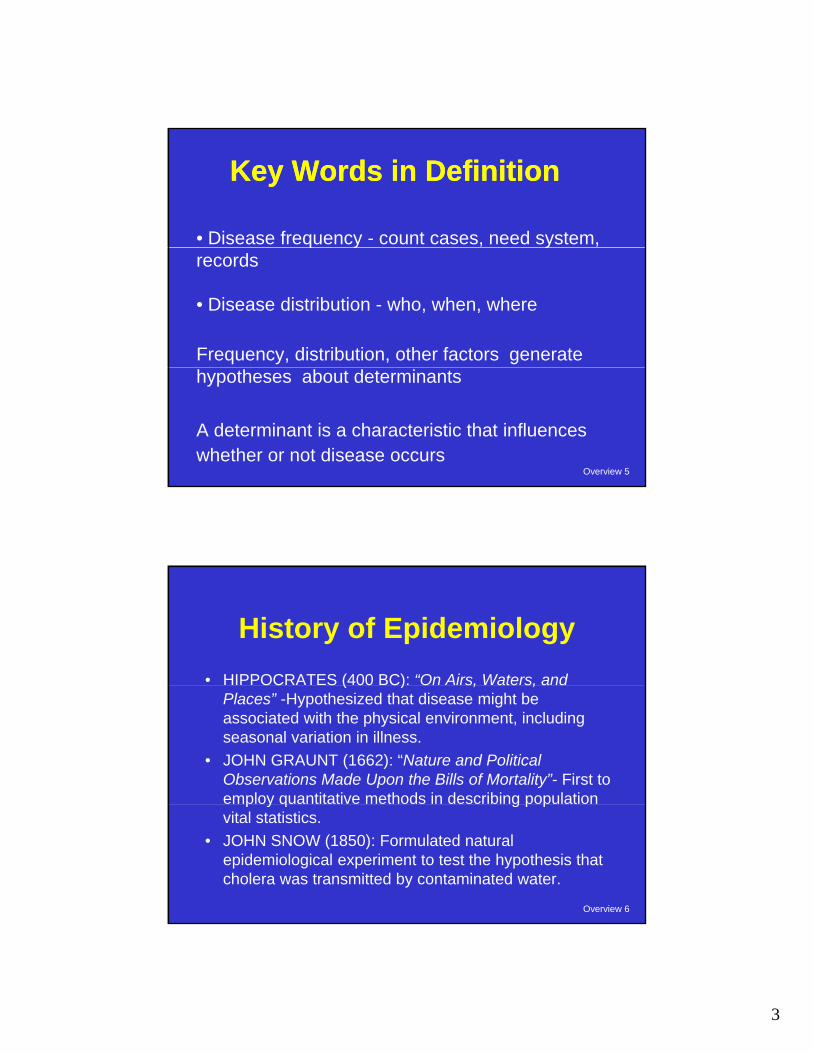
• Disease frequency - count cases, need system,
Key Words in DefinitionKey Words in Definition
q y yrecords
• Disease distribution - who, when, where
Frequency, distribution, other factors generate
Overview 5
hypotheses about determinants
A determinant is a characteristic that influences whether or not disease occurs
History of Epidemiology• HIPPOCRATES (400 BC): “On Airs, Waters, and OC S ( 00 C) O s, ate s, a d
Places” -Hypothesized that disease might be associated with the physical environment, including seasonal variation in illness.
• JOHN GRAUNT (1662): “Nature and Political Observations Made Upon the Bills of Mortality”- First to employ quantitative methods in describing population
Overview 6
p y q g p pvital statistics.
• JOHN SNOW (1850): Formulated natural epidemiological experiment to test the hypothesis that cholera was transmitted by contaminated water.

4
Overview 7
Overview 8

5
Deaths from Cholera per 10,000 houses by source of water supply, London 1854
Number of Deaths from Deaths inHouses Cholera each
Water Supply 10,000 homes
Southwark & Vauxhall 40,046 1,263 315Company
Overview 9
Lamberth Company 26,107 98 37
Rest of London 256,423 1,422 59
History of Epidemiology (cont.)
• DOLL & HILL (1950): Used a case-control design toDOLL & HILL (1950): Used a case control design to describe and test the association between smoking and lung cancer.
• FRANCES at al. (1950): Huge formal field trial of the Poliomyelitis vaccine In school children.
• DAWBER et al. (1955): Used the cohort design to study risk factors for cardiovascular disease in the
Overview 10
study risk factors for cardiovascular disease in the Framingham Heart Study.

6
Natural Progression in Natural Progression in Epidemiologic ReasoningEpidemiologic Reasoning
1st – Suspicion that a factor influences disease occurrence. Arises from clinical practice, lab research, examining disease patterns by person, place and time, prior epidemiologic studies
Overview 11
epidemiologic studies
2nd – Formulation of a specific hypothesis
Natural Progression in Natural Progression in Epidemiologic ReasoningEpidemiologic Reasoning
3rd – Conduct epidemiologic study to determine3 – Conduct epidemiologic study to determine the relationship between the exposure and the disease. Need to consider chance, bias, confounding when interpreting the study results.
Overview 12
4th – Judge whether association may be causal. Need to consider other research, strength of association, time directionality

7
Hypothesis Formation and TestingHypothesis Formation and Testing
Cl f d i i i• Clues from many sources and imagination lead to hypothesis formation
• Conduct epidemiologic study to test hypothesis
Overview 13
hypothesis
Descriptive EpidemiologyDescriptive Epidemiology
• Describe patterns of disease by person, place, and time
• Person: Who is getting the disease? (for l h t i th i li i
Overview 14
example, what is their age, sex, religion, race, educational level etc?)
8
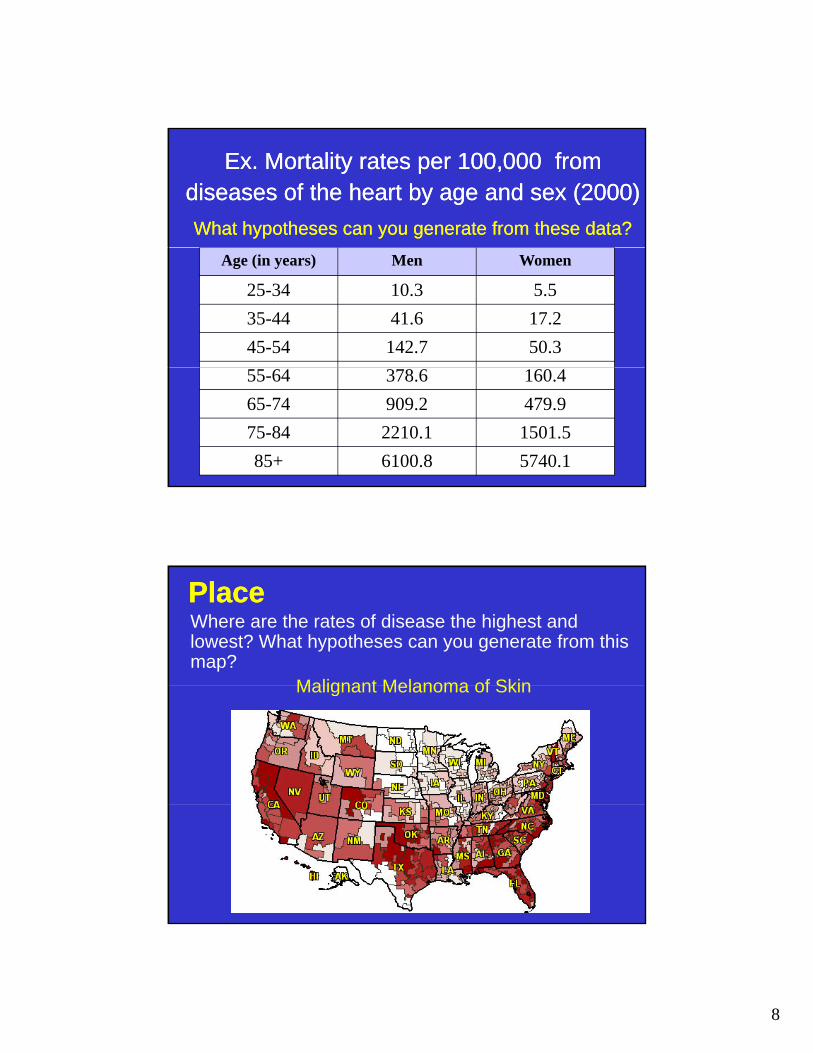
Ex. Mortality rates per 100,000 from Ex. Mortality rates per 100,000 from diseases of the heart by age and sex (2000)diseases of the heart by age and sex (2000)What hypotheses can you generate from these data?What hypotheses can you generate from these data?
Age (in years) Men Women
25-34 10.3 5.535-44 41.6 17.245-54 142.7 50.355-64 378.6 160.465-74 909.2 479.975-84 2210.1 1501.585+ 6100.8 5740.1
PlacePlaceWhere are the rates of disease the highest and lowest? What hypotheses can you generate from this map?
Malignant Melanoma of SkinMalignant Melanoma of Skin

9
PlacePlaceWhat hypotheses can you generate from this map?
Cancer of the Trachea, Bronchus and LungCancer of the Trachea, Bronchus and Lung
Overview 17
Variation on Place: Migrant StudiesVariation on Place: Migrant StudiesMortality rates (per 100,000) due to stomach Mortality rates (per 100,000) due to stomach cancer. What hypotheses can you generate from cancer. What hypotheses can you generate from these data?these data?
Japanese in Japan 58.4
Japanese Immigrants to California 29.9
Overview 18
Sons of Japanese Immigrants 11.7
Native Californians (Caucasians) 8.0

10
Time:Time:• Is the present frequency of disease different from the
past?
• What hypotheses can you generate from these data?
Overview 19
Solve the Mystery EpidemicSolve the Mystery EpidemicThe following data relate to an unusual
episode that actually occurred.p y
• Describe the epidemiologic features of this episode. For example, the overall mortality ‘rate’ was 68.2%
Overview 20
• Based on the descriptive characteristics, formulate a hypothesis concerning the etiology of this episode.

11
Solve the Mystery EpidemicSolve the Mystery EpidemicAdult Men Adult Women Children Total
Socio-economic Status
N % Died
N % Died
N % Died
N % Died
High 173 66.5 144 3.5 5 0.0 322 37.3
Middle 160 91.9 93 16.1 24 0.0 277 58.6
Overview 21
Low 454 87.9 179 45.3 76 71.1 709 75.3
Unknown 875 78.4 23 8.7 0 --- 898 76.6
Total 1,662 81.0 439 23.5 105 51.4 2,206 68.2
Main Epidemiologic Study Main Epidemiologic Study Designs for Testing HypothesesDesigns for Testing Hypotheses
Cohort studyCohort studyExperimental study Case-control study
Each design represents a different way of harvesting information.
Overview 22
harvesting information.Selection of one over another depends on the
particular research question, concerns of about data quality and efficiency, and practical and ethical considerations

12
Which study design to choose?Which study design to choose?
In theory, it's possible to use eachdesign to test a hypothesis
Example: Suppose you want to study the relationship between dietary Vitamin A and
Overview 23
relationship between dietary Vitamin A and lung cancer….
Cohort Study OptionCohort Study Option
Subjects are chosen on the basis of exposure status and followed to assess the occurrence of disease
• High Vitamin A consumption ---------------> lung cancer or not
Low Vitamin A Consumption > lung cancer
Overview 24
• Low Vitamin A Consumption --------------> lung canceror not
What are the advantages and disadvantages of this option?

13
Experimental Study OptionExperimental Study OptionSpecial type of cohort study in which investigator
assigns the exposure to individuals, preferably at drandom
Investigator assigns exposure to:
• High Vit A consumption ----------------> lung canceror not
Overview 25
• Low Vit A consumption ----------------> lung canceror not
What are the advantages and disadvantages of this option?
CaseCase--Control Study OptionControl Study Option
Cases with the disease and controls who generally do not have the disease are chosen and past pexposure to a factor is determined
• Prior Vitamin A consumption <----------- lung cancer cases• Prior Vitamin A consumption <---------- controls
Overview 26
What are the advantages and disadvantages of this option?

14
In practice, choice of study design In practice, choice of study design depends on:depends on:
• State of knowledge• State of knowledge
• Frequency of exposure and disease
• Time, cost and other feasibility considerations
Overview 27
• Each study design has unique and complementary advantages and disadvantages
The result of an epidemiologic study, regardless of type, is an association between the disease
Evaluating Validity and CausalityEvaluating Validity and Causality
of type, is an association between the disease under study and an exposure.
What we are trying to do is evaluate whether that relationship is causal.
How is this done?
Overview 28
Two questions must be answered:• Is the observed association valid?• Is the association causal?
How is this done?

15
Example: Lung Cancer and Smoking
Ex. Lung Cancer and Smoking
50,000 Smokers 50,000 Non-Smokers
100,000 People
Overview 29
100 Lung Cancers 20 lung Cancers
Conclusion: The rate of lung cancer among smokers is five times that of nonsmokers. There is an association between smoking and lung cancer in these data.
Example: Lung Cancer and SmokingExample: Lung Cancer and Smoking
1st Question: Is the observed association valid?
Framework for assessing if observed association is valid:
• Random Error (chance)
Overview 30
• Bias (systematic error)
• Confounding (mixing of effects)

16
Random ErrorRandom Error
• Inference about experience of entire population based on study samplepopulation based on study sample
• Random variation from sample to sample
• Sample size determines degree to which chance affects findings
Overview 31
• P values and confidence intervals quantify amount of random error
Random ErrorRandom ErrorPrior smoking and lung cancer study:
• Under null hypothesis (no association between yp (smoking and lung cancer) you would expect to see an equal number of lung cancers among smokers and nonsmokers (120/2 = 60).
• P value tells you probability of seeing 100 vs. 20 lung cancers given that you expected 60 in
Overview 32
20 lung cancers given that you expected 60 in each group.
• P value tells you nothing about alternative explanations such as bias
17
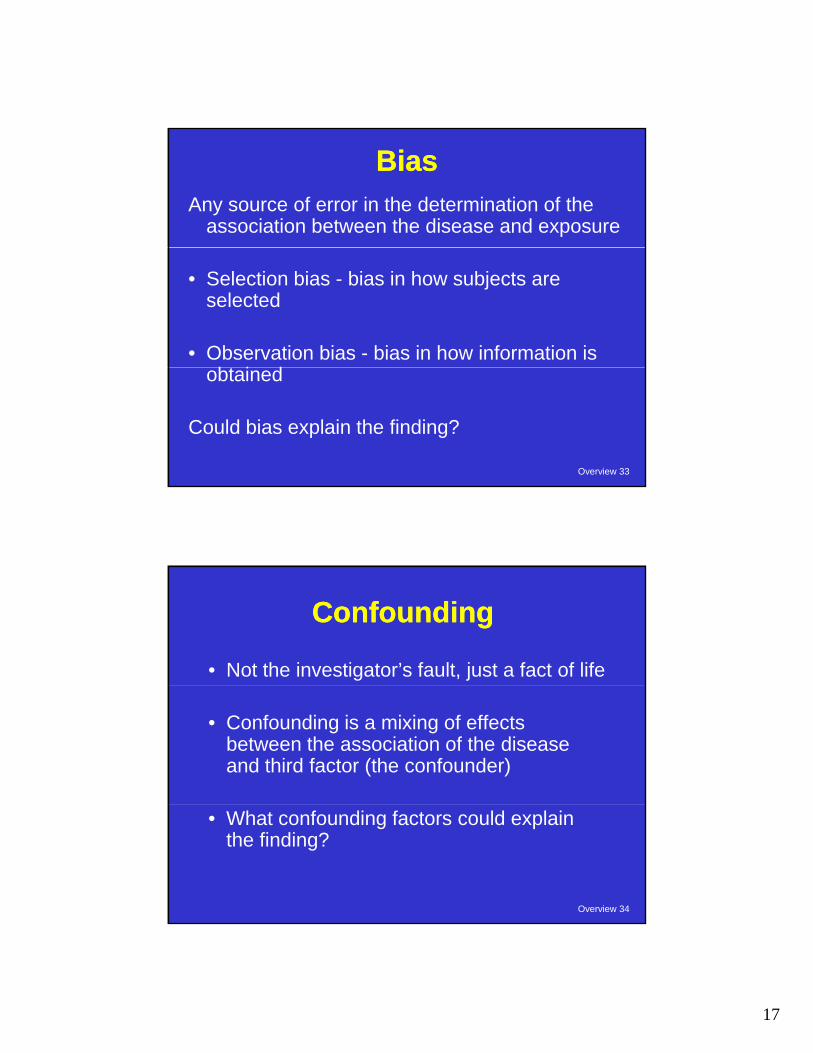
BiasBiasAny source of error in the determination of the
association between the disease and exposure
• Selection bias - bias in how subjects are selected
• Observation bias - bias in how information is bt i d
Overview 33
obtained
Could bias explain the finding?
ConfoundingConfounding
• Not the investigator’s fault, just a fact of life
• Confounding is a mixing of effects between the association of the disease and third factor (the confounder)
Overview 34
• What confounding factors could explain the finding?

18
Let’s practice assessing validity.Let’s practice assessing validity.The Good News Survey was administered to
readers of the magazine Hippocrates.
Nearly 3,000 readers responded with information on their health, diets and habits.
The data were analyzed and many associations were seen Consider the following findings and
Overview 35
were seen. Consider the following findings and state whether or not you think that they are valid. If not, give a possible alternative explanation for the association.
Frosted Flakes Prevent CancerTo avoid cancer, people should stay away from oatmeal and eat frosted Flakes. The Good News Survey (GNS) found that children who often ate Frosted Flakes went on to have half the rate of cancer of those who never ate cereal. Conversely, those who often ate oatmeal as children were four times more likely to develop cancer than
Overview 36
times more likely to develop cancer than those who did not. The GNS research team speculates that the sugar coating on Frosted Flakes may be the long-sought “magic bullet” against cancer.

19
The Routine Physical is a Routine Killer
Physical exams cause dangerous long-termPhysical exams cause dangerous long-term increases in blood pressure and cholesterol levels. GNS respondents who had been given a physical during the previous three years were twice as likely as other respondents to report problems with high
Overview 37
respondents to report problems with high blood pressure and cholesterol.
Study Exonerates Over-sleepersFar from being a sign of laziness, sleeping late appears to be a genetic trait, according to a pp g glandmark study. The GNS found that children whose parents slept late on weekends were 60 percent more likely to sleep in past 11 a.m. on weekends. “Late sleepers shouldn’t be blamed for their actions,” said one researcher. “And it’s time
Overview 38
we got rid of that old wives’ tale about early-to-rise making you healthy. Our study shows that late sleepers actually have lower rates of cancer and heart disease, not to mention more satisfactory sex lives.”

20
Call Waiting Brings Headaches, Herpes
People with the Call Waiting feature on their telephones are more prone to splittingtelephones are more prone to splitting headaches, tennis elbow, and herpes. GNS researchers believe the headaches and tennis elbow may be due to rapid switching from one caller to another, but the herpes link remains puzzling. “It’s possible that Call Waiting is a sign of general promiscuity ” says one specialist
Overview 39
of general promiscuity, says one specialist. “Although we always thought that anyone who put personal calls on hold every time an encyclopedia salesman called would quickly end up with no romantic life whatsoever.”
Valid statistical association does not Valid statistical association does not imply cause and effect.imply cause and effect.
You must use your judgment.
Remember: Causality is in the eyes of the beholder.
Overview 40
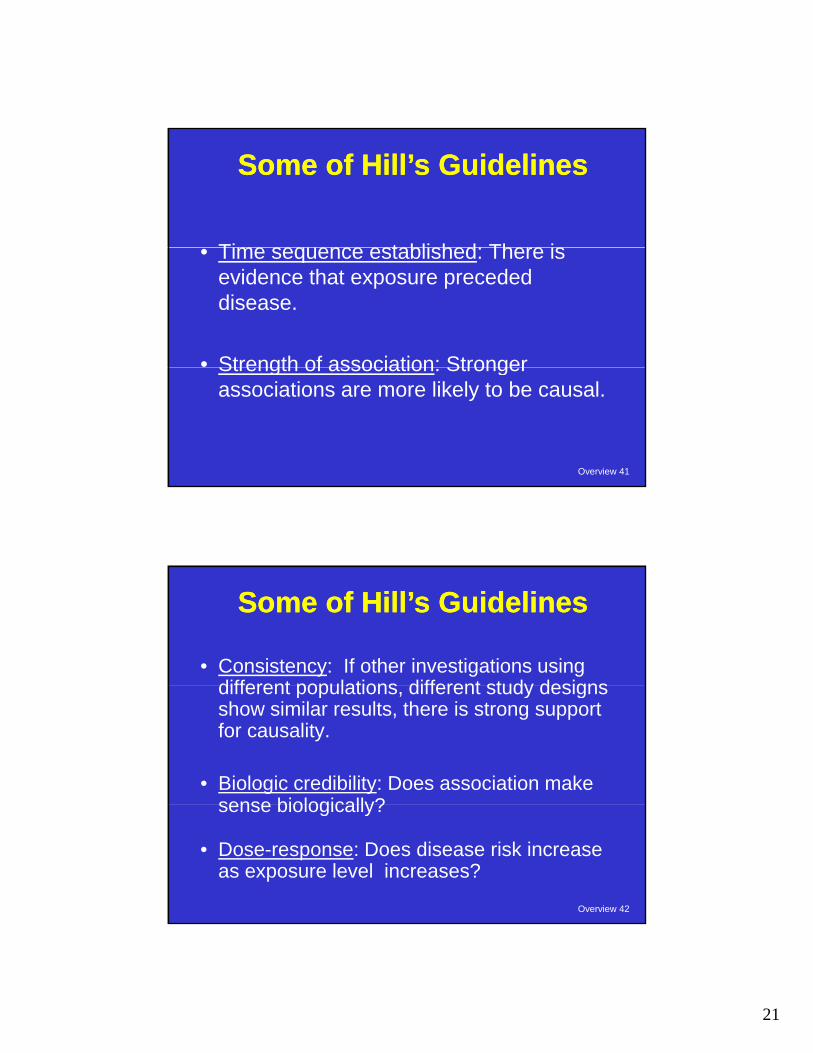
Many epidemiologists think that Sir A.B. Hill's guidelines are useful for making the assessment.
21
Time seq ence established There is
Some of Hill’s GuidelinesSome of Hill’s Guidelines
• Time sequence established: There is evidence that exposure preceded disease.
• Strength of association: Stronger
Overview 41
Strength of association: Stronger associations are more likely to be causal.
• Consistency: If other investigations using different populations different study designs
Some of Hill’s GuidelinesSome of Hill’s Guidelines
different populations, different study designs show similar results, there is strong support for causality.
• Biologic credibility: Does association make sense biologically?
Overview 42
sense biologically?
• Dose-response: Does disease risk increase as exposure level increases?