MASTER'S THESIS · The bits used in the runs are graded using the IADC dull grading system. For a...
57
FACULTY OF SCIENCE AND TECHNOLOGY MASTER'S THESIS Study program/specialization: Master of Science in Petroleum Engineering Drilling Engineering Spring semester, 2008 Confidential Author: Sigurd Eikemo Vikra ………………………………………… (signature author) Instructors: Vebjørn Nygaard / Jean Phillippe Tantet Supervisor: Erik Skaugen Title of Master's Thesis: Utilizing down hole data, acquired by a multiple sensor down hole . tool, to determine the PDC bit wear state. Norwegian title: Bruk av nedihull data, skaffet av et flersensor nedihullsutstyr, til å . . bestemme slitasjen på en PDC borekrone. ECTS: 30 Subject headings: Pages: 56 + attachments/other: ………… Stavanger, 06.06.2008 Date/year
Transcript of MASTER'S THESIS · The bits used in the runs are graded using the IADC dull grading system. For a...

FACULTY OF SCIENCE AND TECHNOLOGY
MASTER'S THESIS
Study program/specialization: Master of Science in Petroleum Engineering Drilling Engineering
Spring semester, 2008
Confidential
Author: Sigurd Eikemo Vikra
…………………………………………
(signature author)
Instructors: Vebjørn Nygaard / Jean Phillippe Tantet Supervisor: Erik Skaugen Title of Master's Thesis: Utilizing down hole data, acquired by a multiple sensor down hole . tool, to determine the PDC bit wear state. Norwegian title: Bruk av nedihull data, skaffet av et flersensor nedihullsutstyr, til å . . bestemme slitasjen på en PDC borekrone. ECTS: 30 Subject headings:
Pages: 56 + attachments/other: ………… Stavanger, 06.06.2008 Date/year

1
Acknowledgement
This is a thesis for the Master degree in petroleum technology at the University of Stavanger.
I would like to thank Jean Phillippe Tantet, Frank Johnsen and Vebjørn Nygaard at the
BEACON centre Stavanger for making this thesis possible.
I would also like to thank Erik Skaugen for his guidance and advices throughout the writing
of this thesis.

2
Abstract
By using real-time data from INTEQ`s CoPilot Real-Time Drilling Optimalization a search
for dependable indications of the degree of the bit wear was done. This would improve
decision making procedures for when to pull the bit when experiencing a poor penetrationrate
in soft formations or problems getting through harder formations.
Using several recorded runs, factors that might be good indicators of the drill bit state of wear
was investigated by comparing several bit runs that were using a PDC bit with an Auto Trak
X-Treme motor and a CoPilot sub assembly. Some of the possible suggestions did not seem
viable to determine the wear of the bit. Some looked viable in some cases, but then again had
exceptions in other runs under other conditions. At the end only two of the indications seemed
usable to determine the wear of the bit. ROP compared to WOB was in almost every run a
good indicator. But the most reliable indicator of bit wear in the runs investigated, was the
degree of reduction of torque relative to the applied WOB. When recording these parameters
with a new bit in early sections, using this as a basis for comparison with later measurements,
it was possible to see if the torque generated had declined once a similar formation appeared
again.
A third possibility that was not fully investigated was recording increase in mud pressure due
to blocked nozzles. This theory was not easy to investigate since there were no available raw
data, and the resolution in graphs was too low for the accuracy required.
3
Contents 1. Introduction ........................................................................................................................................ 5
2. Location ............................................................................................................................................... 6
2.1 The Troll field ................................................................................................................................. 6
3. Equipment ........................................................................................................................................... 7
3.1 PDC bit ............................................................................................................................................... 7
3.2 PDC dull bit grading ......................................................................................................................... 10
3.3 X-Treme motor ................................................................................................................................ 11
3.4 CoPilot sensors and data acquisition ............................................................................................... 13
3.4.1 CoPilot main parts .................................................................................................................... 13
3.4.2 Copilot coordinate systems ...................................................................................................... 14
3.4.3 Mounting of Electronic Boards ................................................................................................. 15
3.4.4 Transducers .............................................................................................................................. 16
3.4.5 CoPilot data processing ............................................................................................................ 17
4. Theories ............................................................................................................................................. 19
4.1 Power transfer ................................................................................................................................. 19
4.1.1 Weight on bit versus penetration rate ..................................................................................... 20
4.1.2 Torque transfer......................................................................................................................... 21
4.1.2.1 History of the PDC bit at the Troll field ............................................................................. 21
4.2 Axial vibration .................................................................................................................................. 22
4.3 Lateral vibration .............................................................................................................................. 23
4.4 Pump pressure................................................................................................................................. 23
5. CoPilot Data output ........................................................................................................................... 25
5.1 real-time depth based ..................................................................................................................... 25
5.2 Real-time time based ...................................................................................................................... 26
5.3 Memory logs .................................................................................................................................... 27
6. Result ................................................................................................................................................. 29
Severely worn bit Deep Sea Trym ..................................................................................................... 30
Slightly worn bit at Deep Sea Trym ................................................................................................... 37
Severely worn bit West Venture ....................................................................................................... 40
Slightly worn bit West Venture ......................................................................................................... 43
6.2 Plotting key data .............................................................................................................................. 46
6.2.1 WOB versus torque .............................................................................................................. 46

4
6.2.2 WOB versus ROP .................................................................................................................. 49
7. Discussion .......................................................................................................................................... 51
7.1 Different PDC bits ............................................................................................................................ 51
7.2 Drilling conditions ............................................................................................................................ 52
7.3 Data compared ................................................................................................................................ 52
8. Conclusion ......................................................................................................................................... 53
References ............................................................................................................................................. 55

5
1. Introduction
The CoPilot is Baker Hughes INTEQ`s down hole real time diagnostic system. The data that
are being transmitted from the CoPilot are being monitored by the CoPilot crew onshore at the
BEACON centre. The service at this centre uses down hole drilling data to decide what is
going on, and using that information to decide what the next step should be.
One of the things to decide is whether or not a bit is so worn, that pulling out and go in with a
new bit, would be more preferable than to continue. For this to be the case, the bit must be so
worn that it will have problems getting through stringers of hard formation and perform badly
in softer formations. Also a worn bit may jeopardize the quality of the hole.
To investigate this, real time logs from the three rigs standing at the Troll field (Deep Sea
Trym, West Venture and Songa Dee) the last year was filtered. Comparing all runs that
contained a 8 ½” PDC bit and a X-Treme motor was done, to get as similar drilling conditions
as possible.
The main part in this thesis was to further investigate the methods that the CoPilot crew were
using to recognize a worn bit, in addition to look into other parameters that might be useful as
well. Since this is a real time operation this thesis tried to find a reliable way to recognize bit
wear visually from the logs. This was done by comparing how the drilling parameters for a
worn bit changed compared tot hat of a not so worn bit.

6
2. Location
To be able to compare the data with as alike lithologies as possible, the data compared in this
thesis was taken from three rigs standing at the Troll field and monitored by the CoPilot
engineers at the BEACON centre. These three rigs were West Wenture, Songa Dee and Deep
Sea Trym. Several wells were drilled with all of these rigs and this gave several runs that
could be compared under similar conditions.
2.1 The Troll field
Reference: 1
The Troll field is a large offshore gas field with a thin underlying oil column that covers an
area of some 750 square kilometers. It is located in the North Sea some 80 km west of
Bergen.
To be able to recover oil from the thin oil layers, it has been necessary to develop advanced
drilling technologies. The Troll fields reservoir lies approximately 1500m beneath the seabed
and has a complex environment with regard to rock structure. The reservoir is composed of a
suite of sandstones varying in grade from very fine to coarse, with unpredictable zones of
cementation and discrete calcite stringers. This structure has an impact on several drilling
characteristics and subsequent performance.

7
3. Equipment
For the comparison between the different runs to be viable, the equipment being used had to
be alike in all runs. Therefore the runs investigated was limited to the ones including a rotary
steerable drilling assembly including an AutoTrak X-treme motor and of course a 8 1/2 ”
PDC bit.
The bit was graded using the standard IADC dull bit grading system, and all the data collected
was being processed through the CoPilot tool.
3.1 PDC bit
Reference: 2
PDC stands for polycrystalline diamond compact. The name comes from the synthetic
diamond cutters that are welded to tungsten carbide plugs and then inserted into the open slots
of the bit body. The body of the bit itself is made up by a mix of carbon and tungsten powder
that are bonded together with a metal alloy binder. This body is very resistant to erosion and
abrasion, but more prone to breaking than steel.
Figure 2.1: PDC bit without cutters inserted[2].

8
The PDC cutters are made out of a pre-made synthetic diamond and a pre-made tungsten
carbide substrate that are being fitted together in a high temperature high pressure (HTHP)
process.
Figure 2.2: Fitting together process of synthetic diamond and carbide substrate[2]
Once the cutters have been fitted into the bit body the PDC bit will be treated with oxy
acetylene macro hard facing. This hardening of the bit is what gives the golden color.
In between the blades the nozzles are positioned. The total area of the nozzles combined, is
the total area that the mud will be allowed to flow through. The area can be reduced or
increased by changing the number or the size of the nozzles. A relative small nozzle area will
give a faster flow out of the bit, giving it better cleaning properties, but at the same time it
increases the pressure that the mud pump has to produce to maintain the flow that is wanted.
A relative nozzle large area might not give as good cleaning to the bit, but on the other hand it
will be easier for the mud pump to produce high enough pressure.
Figure 2.3: PDC bit with cutters and treated with oxy acetylene[2]

9
The PDC and the roller cone rock bit are using different methods to get through the formation.
While the PDC cutters are cutting the formation by shearing through it, the Roller Cone teeth
are crushing the formation.
Figure 2.4: PDC cutter[2]. Figure 2.5: Roller Cone teeth[2].
The Roller Cone bit has a better performance in tougher formations and is usually used in the
upper sections of a well. The drawback for Roller Cone bits is that it has a limited lifetime on
seal and bearing. So even though a PDC bit may be slower in some types of harder formations
it is often preferred in the longer reservoir sections of a well.

10
3.2 PDC dull bit grading
Reference: 3
The bits used in the runs are graded using the IADC dull grading system. For a PDC bit the
following wears are measured: Inner rows, outer rows, dull characteristics, gauge and other
characteristics. In addition there is reason pulled, location and for tricone bits there also is
bearing seals.
Figure 2.6: Scheme used to grade a PDC bit[3].
The most important wear parameter for PDC bits are the cutters. This is due to the impact
these have on the bits drilling performance. When the cutters are being graded they are
divided into two parts. The inner rows, that stands for 2/3 of the bits total radius cover about
44% of rock removed. And the outer rows that stands for 1/3 of the bits radius, remove about
56% of the drilled rock.
The severity of the wear is then compared to to a linear scale that is cutter size independent. A
smoothly worn cutter should not exceed a grading of four, and a grading of five to eight
would suggest that the cutters are broken or severely chipped.
Figure 2.7: What the dull grading refers to as inner and outer cutters and the severity scale[3].
Cutting Structure B G Remarks Inner Rows
Outer Rows
Dull Charact-eristics
Location Bearing Seals
Gauge (1/16”)
Other Charact-eristics
Reason Pulled
X

11
Reference: 4
All the bit runs collected for this thesis is graded by using this system. And the preferable
wear on the inner and outer rows of cutters is 3-3. The reason why we do not want one or zero
is because then the bit has not been pushed as hard as it could and therefore not been giving as
much ROP as it could have.
If it goes up to four or higher the bit will not perform very well and again this will not give
optimal ROP over time. So one important task for the CoPilot crew is to recognize when the
bit has passed that point and then give the appropriate recommendations. But even with a
wear that high, the ROP might be good enough to continue. Especially if the bit is at a depth it
will take a long time to trip out of. Then the time it takes to trip out and change versus the
time lost due to a worn bit, has to be weighed up against each other.
3.3 X-Treme motor
Reference: 5
The INTEQ Navi-Drill tools are positive displacement motors. Circulating drilling fluid is
being used to drive the drill bit independently of drill string rotation using the Moineau
principle. This principle holds that a helical rotor with one or more lobes will rotate when
placed inside a stator that has got one more lobe than the rotor. When the drilling fluid is
pumped inside the tool, the rotor will be driven in a rotary motion allowing the fluid to pass
while transmitting rotational power to the drive train and the bit.
Torque and rotational outputs can be varied by using different rotor/stator lobe configurations.
As a rule of thumb, more torque and less rpm will be generated by employing greater number
of lobes. The X-Treme motor is using a 5/6 lobe configuration placing it in the middle of rpm,
torque and efficiency parameters compared to other lobe configurations. This gives the motor
good performance under most conditions.

12
Figure 2.8: How the different lobe configurations performs[5].
The X-Treme series motors are INTEQ`s strongest down hole motor. They were designed to
maximize effective rate of penetration and increase dogleg capabilities. These motors have a
high torque capability and power output.
Figure 2.9: X-Treme motor[5].
At a given rate of rotation an increased rate of penetration requires increased weight on bit. To
cope with the extra weight on bit the X-Treme motors are equipped with bearing assemblies
that houses special ball or diamond bearings.

13
3.4 CoPilot sensors and data acquisition
Reference: 6
This is an innovative MWD-based tool that provides real-time drilling-data. In addition to
provide average values for down hole mechanical measurements, it also diagnoses the
occurrence and severity of the drilling dynamic-related problems. The down hole diagnosis
system contains a variety of drilling process sensors and a high-speed data
acquisition/processing system.
The CoPilot tools down hole processor performs continuous analysis of the data stream
acquired and, after compressing it down to diagnostic words, transmits it to surface via
OnTrak mud pulsing telemetry. This data can also be monitored by personnel at onshore
facilities known as BEACON centers.
The CoPilot is usually run in order to understand and prevent any vibration that might occur
while drilling. Monitoring real-time parameters to enhance the performance while acting
within safe dynamic drilling parameters.
This service is most commonly used in drilling environments that are known to cause drilling
problems and premature failure of both bit and other down hole equipment.
3.4.1 CoPilot main parts
The tool has three main parts: the Electronic Sub, the Sleeve and the Top Sub. The Electronic
Sub takes the loads and incorporates the sensors as well as the electronics. The electronic
boards are mounted in slots that are covered by the Sleeve. The Sleeve is press-fitted by the
Top Sub, which is connected to the Electronic Sub. The sleeve will then cover and protect
components in the electronic sub.
Figure 2.10: CoPilot tool completely assembled[6].

14
3.4.2 Copilot coordinate systems
The tool is using a standard clockwise x/y/z coordinate, where the z coordinate is aligned with
the drillstring and pointing up-hole, both x and y axis are accordingly pointing in a radial
direction.
The tool will show a positive x or y value if it is being bent in the x or y direction, and a
positive x,y or z acceleration value if it accelerates in any of those directions. If bending and
accelerations are in the opposite directions, their values will be negative.
Figure 2.11: CoPilot tools coordinate system and sensors[6].

15
3.4.3 Mounting of Electronic Boards
In total there are six boards mounted into electronic pockets of the CoPilot. Five electronic
boards are Q-packed and press-fitted into rectangular pockets, and the Strain Gauge
Connection Board is mounted with screws.
Figure 2.12: Q-packed boards, and Strain Gauge Connection Board and one of the two
. acceleremometers[6].
16
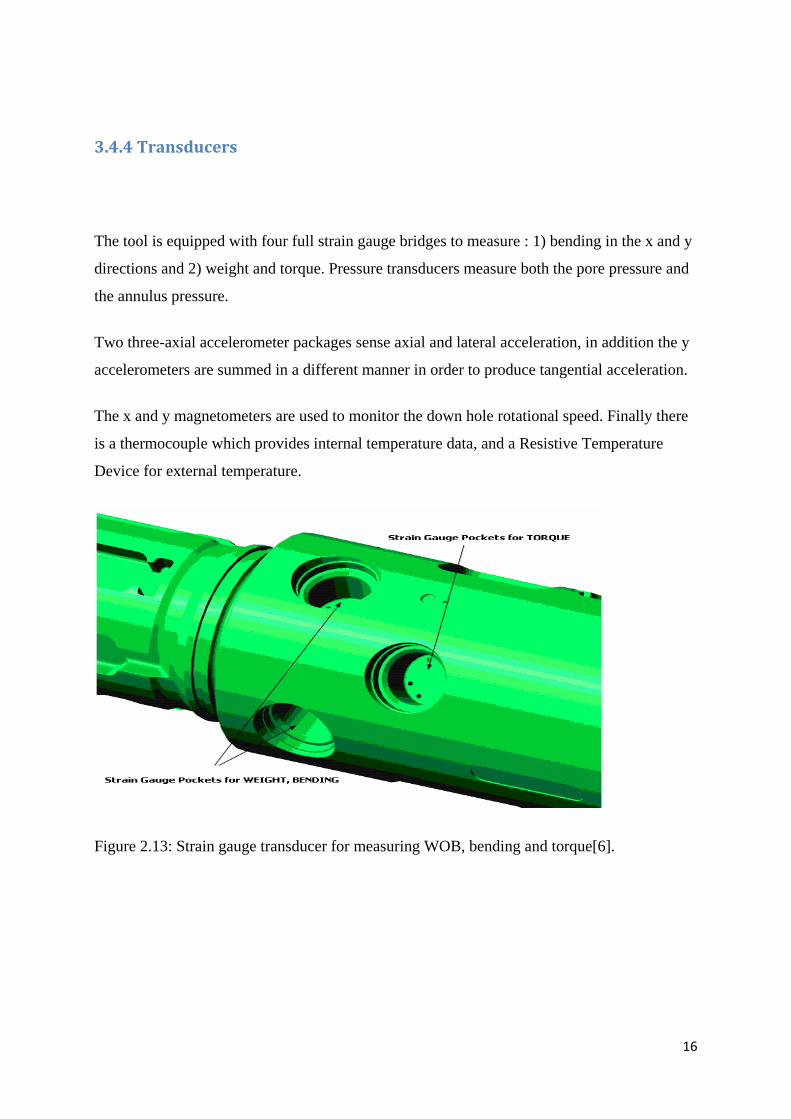
3.4.4 Transducers
The tool is equipped with four full strain gauge bridges to measure : 1) bending in the x and y
directions and 2) weight and torque. Pressure transducers measure both the pore pressure and
the annulus pressure.
Two three-axial accelerometer packages sense axial and lateral acceleration, in addition the y
accelerometers are summed in a different manner in order to produce tangential acceleration.
The x and y magnetometers are used to monitor the down hole rotational speed. Finally there
is a thermocouple which provides internal temperature data, and a Resistive Temperature
Device for external temperature.
Figure 2.13: Strain gauge transducer for measuring WOB, bending and torque[6].

17
3.4.5 CoPilot data processing
In total there are fourteen sensor channels in the tool. All fourteen data channels are
simultaneously sampled at 1000Hz. A real-time clock is employed to time-stamp the signals
and to ensure a chronological data stream. The fourteen sensor channel inputs are:
• Lateral (x-axis)magnetometer • Lateral (y-axis) magnetometer • Lateral (x-axis) acceleration • Lateral (y-axis) acceleration • Axial (z-axis) acceleration • Tangential acceleration • Lateral (x-axis) bending moment • Weight (WOB) • External hydraulic pressure • Lateral (y-axis) bending moment • Torque • Internal hydraulic pressure • Internal temperature • External temperature
All this input is being processed in the Digital Signal Processor (DSP) which is doing a
continuous evaluation of the data stream using a five second loop. Within each five second
segment raw data values are converted into static and diagnostic information.
Figure 2.14: Data acquisition and processing block diagram[6].

18
Out of the ten diagnostics, five of them are relied on for real-time optimization. These are :
• Stick-slip
• Whirl
• Axial vibration
• Lateral vibration
• Bit bounce
Figure 2.15: diagnostics and the sensors by which they are affected[6].
Various statistical calculations are used to determine these diagnostic values. The output is
graded in severity after a user defined threshold level going from 0 to 7. These levels are color
coded when output at remote displays. This is done to make it easier for the one watching the
monitor to spot severe values of the five diagnostics.

19
4. Theories
After talking to experienced CoPilot engineers and reading about the subject, several theories
about how to recognize bit wear by using the CoPilot real-time data were suggested.
4.1 Power transfer
Reference: 6
The power applied on surface is transfered through several components and possible obstacles
on its way to the bit. To be able to analyze the data we are given in the CoPilot correctly, we
need to use the right components and the right input in our data collection and simulations.
The ones needed by the CoPilot is:
• Power plant: Diesel engines, alternators, AC/DC silicon rectifier converters and DC
motors.
• Rotary drive: Top-drive or rotary table and gear box.
• Drillstring: Drill pipe, BHA and borehole.
• Drilling motors, when used, where hydraulic power is converted to mechanical power.
• Drill bit.
To ensure that there is an efficient delivery of power from surface to the bit, there are done
measurements at both surface and down hole. The power can be measured by recording both
torque and rate of rotation (RPM).
The down hole power input is measured at the CoPilot sub, which is close to the bit. The
power used to drill at surface is measured directly after the DC motors, and the axial forces
from the top drive or dead line anchor.

20
Since the bit is the last part of the power transfer, comparing surface and down hole forces
can give indications on whether the bit is performing as it should. The power on the bit can be
calculated with:
TfRRfTvr
RTPower ππ 22
=== vr = 2π Tf
Where T is torque, R is radius of tool or drill string and f is rate of rotation.
For instance, for T = 10 kNm and f = 2s-1 (120 RPM), as measured at the bit, the power
delivered to the bit is 2π 10kNm 2s-1 = 125.7 kJs-1 = 125.7 kW.
Note that WOB, the contact force between the bit and the bottom of the well, does not
contribute directly to the power delivered to the bit. But indirectly it is important as it is one
of the main factors determining the torque of the bit. The other main factors are formation
strength and friction coefficient between formation and drill bit body.
4.1.1 Weight on bit versus penetration rate
Reference: 7
By adding more weight on the bit we hope to gain an increase in the penetration rate. If there
is no increase, or not as much as expected, it can be caused by a worn bit. One important
factor here is what formation we are drilling in, since a hard formation will not give as much
increase in penetration as a function of weight on bit as a softer formation will. This
information can easily be assessed from the density and formation logs from the Copilot Real
Time depth based display screen.
To recognize a worn bit by using this method it is important to compare the bits penetration as
a function of weight on bit to that of a new bit in similar formations. If the density of the
formation is the same as earlier and the penetration goes down or stays steady after an
increase in weight on bit, we can suspect a worn bit. If this is happening in a soft formation
the CoPilot team may suggest to pull out of hole to change bit, if there are expected
difficulties getting through a stringer at a later point.

21
4.1.2 Torque transfer
Reference: 6
By comparing down hole weight on bit and down hole torque we can determine how much of
the rotary torque is being generated through friction between the bit and the formation.
If the weight on bit is the same, and it is assumed that the formation has not changed, then
changes in torque can be a very good indicator of bit wear. This is because the PDC bit is very
dependent on its cutters to generate good penetration. Worn down cutters and cutters with
rounded edges may not penetrate as deeply into the rock as new, sharp edged cutters will, and
less rock is removed for each revolution of the bit. The cutters are sliding more on the rock
rather than shearing it, and this gives less resistance, and thereby less torque. So if the bit is
producing lower torque under similar conditions, it might be because the cutters on the bit are
worn and the bits performance has decreased.
4.1.2.1 History of the PDC bit at the Troll field
Reference: 1
Further support on this theory was found in a SPE paper about how the use of PDC bits at the
Troll field evolved[1].
After rotary steerable systems were available on Troll in 1998, it was possible to drill the
reservoir sections with PDC bits instead of using roller cone bits. But when the PDC bit was
used in formations with high calcite content, the drilling progress was unacceptable. So in
early 2002 it was the general opinion that Roller Cone bits were the favored solution for Troll
reservoirs.
The only drawback for the Roller Cone is that it has a predefined lifetime limitation with
regard to seal and bearing. So a PDC bit would be the preferred solution even though the
penetration rate is poor in cemented sands and it was unfeasible to determine the wear

22
condition of the bit while drilling. This made it impossible to determine if the reduced
penetration rate were due to bit wear or formation characteristics.
The introduction of the down hole diagnosis system made it possible to estimate the PDC bit
wear state through the comparison of the down hole weight on bit (DWOB) and down hole
torque on bit (DTOB) trends. For a new PDC bit the DTOB created by the cutting action of
the cutters would increase accordingly with applied DWOB. This presented a ratio trend for
the formation, and as the bit run progressed it could be used as a basis for comparison with the
most recent performance trend.
Figure 4.1: WOB vs torque dull bit[1]. Figure 4.2: WOB vs Torque new state bit[1].
This simple capability changed the opinion that Roller Cone bits were the favored alternative
for Troll reservoirs. So today it is PDC bits that are the favored alternative, and 97% of the
Troll reservoir is deemed as PDC drillable[1].
When looking into how WOB versus torque was compared at the Troll field in order to
distinguish a dull and new state bit, it looked very possible to use the same comparison
visually from the real time data that are being used at the BEACON centre.
4.2 Axial vibration
Reference: 7
23
Axial vibrations are displacement-waves that travel along the drill string axis giving, local
stress in the form of compression some places and tension in other places. These energy
waves travel axially along the drill-pipe and may be detected at the surface. For long drill
strings this is not always possible, as these waves experience friction against both the mud
and the wall of the well (contact friction). Therefore their amplitudes gradually decreases as
they travel up the drill string wholly.
Since these waves travel along the drill string axis, they can affect and be affected by the
weight on bit during drilling. And one of the theories from the BEACON center is that an
increase in axial vibrations can be caused by a worn bit. If the cutters on the bit are worn then
the weight on bit will not cause the penetration rate it is supposed to. These forces may then
act on the drill string instead, making displacement-waves in the drill string which can be read
from the CoPilot sensors.
4.3 Lateral vibration
Lateral vibrations are damped out even faster than axial vibrations as they travel up the drill
string, and can not be reliably detected at the top. Detection of these vibrations therefore
depends upon the downhole measurements.
Some of the CoPilot engineers were of the opinion that lateral vibrations may increase as the
bit is getting more worn. There was not any obvious reason for this.
4.4 Pump pressure

24
When a bit is experiencing hard formation, we usually will need to apply a high weight on bit
to get through this formation. As we get through the hard formation the bit will be pushed into
the following softer formation resulting in that the nozzles can get blocked by the soft
formation, leading to an increase in pump pressure on the screen.
If we continue to see an increase in pressure as we go on drilling in softer formations, it
might be due to the bit starting to wear, making it easier for the soft formation to reach and
plug the nozzles of the bit.

25
5. CoPilot Data output
The data that are available as real-time data are mainly monitored using two different logs
from the CoPilot. One is real-time data as a function of time and the other is real-time as a
function of depth.
The curves used in these two plots are slightly different but in this thesis the depth based log
will mainly be used to disclose any abnormalities that could support any of the theories
regarding the bit wear.
5.1 real-time depth based
Figure 4.1: CoPilot real time depth based log header[9].
In the left column the depth based log gives good information of the formation we are drilling
in by using gamma, neutron and density measurements. It also gives us a pointer of what state
the bit is in regarding to bending, steering sub orientation (referred to as sleeve in header) and
the hole quality with the caliper log.
The middle column gives a good overview of how much of the power applied at surface is
transferred down hole, by comparing surface weight on bit, RPM and torque versus down

26
hole weight on bit, RPM and torque. It also shows how the applied WOB affects the ROP and
torque down hole.
In the right column all vibrations and forces on the string are measured. Combining this with
the other two columns it might be possible to find a correlation between lateral and axial
vibrations and bit wear-state.
5.2 Real-time time based
Figure 4.2: CoPilot real-time time-based log header[10].
The time based plot uses no lithology data or ROP. These data are replaced by flow in, pump
pressure, block position and down hole ECD in the left column. ROP is being replaced by bit
depth in the middle column and the right column is identical to the depth based plot. This plot
is better suited to monitor the rig operations than the bit performance, since it can not compare
the way the bit acts in softer formations to harder formations.
27
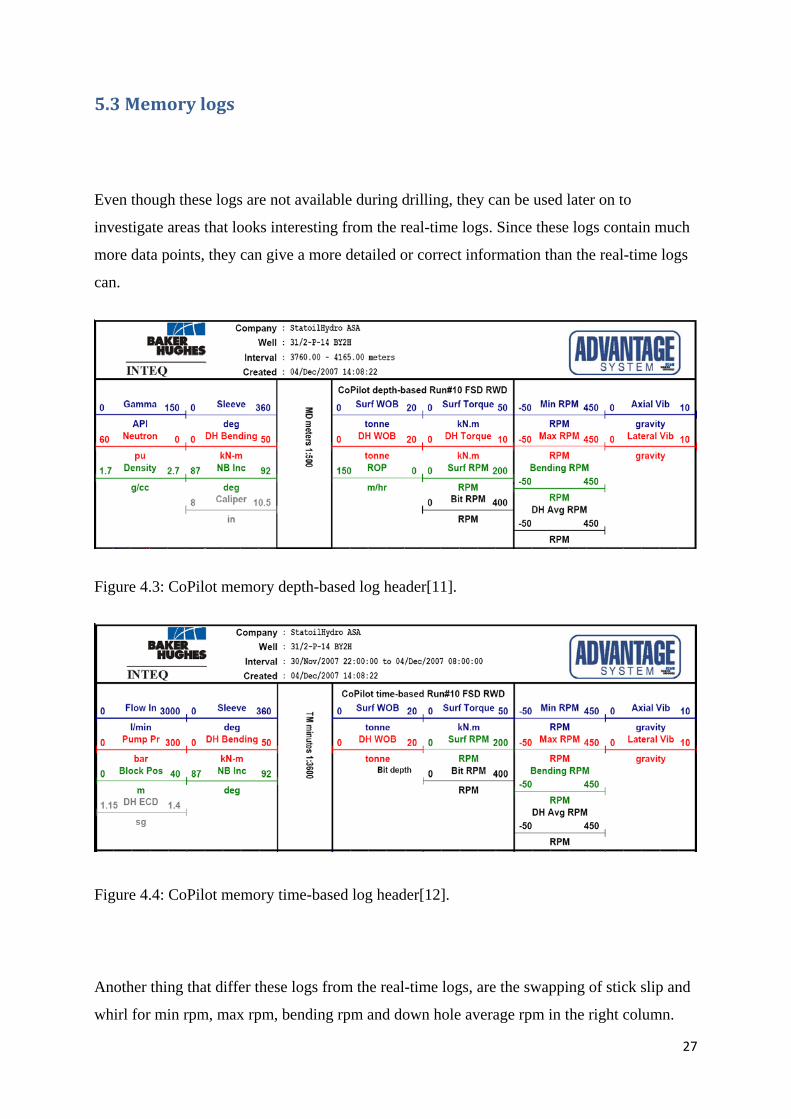
5.3 Memory logs
Even though these logs are not available during drilling, they can be used later on to
investigate areas that looks interesting from the real-time logs. Since these logs contain much
more data points, they can give a more detailed or correct information than the real-time logs
can.
Figure 4.3: CoPilot memory depth-based log header[11].
Figure 4.4: CoPilot memory time-based log header[12].
Another thing that differ these logs from the real-time logs, are the swapping of stick slip and
whirl for min rpm, max rpm, bending rpm and down hole average rpm in the right column.

28
This gives a better overview on the vibrations compared to the current rpm, thus making it
easier to differ formation or bit caused vibrations from vibrations caused by change in rpm.

29
6. Result
Since this thesis tried to find a reliable way to determine bit wear just by looking at the real-
time logs, there were no available raw data from the runs to investigate. Instead several worn
bit runs were compared to not worn bits under similar conditions, and then checking for signs
and key data.
After looking through all runs that were made on West Venture, Deep Sea Trym and Songa
Dee at year 2007, some of the runs had to be filtered out. There were various reasons for this,
such as length of run, grading of bit, assembly used, formation drilled in and down hole tool-
failure.
The four runs presented on the next pages are the ones that gave the best representation of all
the runs that were compared and what was found. Note that all these runs start with a new bit.
The bit grade given refer to the worn state of this bit at the end of the run.

30
Severely worn bit Deep Sea Trym
This run was done for Norsk Hydro at Deep Sea Trym starting the 10th of February 2007. It
drilled from 3045meters to 5430 meters and the bit was graded : 8-5-RO-N-X-I-WT after
drilling ended.
Figure 6.1: Start of run 22 Deep Sea Trym [13].

31
As the beginning of this run a new state bit was used, we can get some data to compare with
later on in the run.
In the area from 3068 to 3072 the bit encountered a hard formation with a density around 2.65
g/cc. The ROP decreased to close to zero, and we can see axial vibrations from level 0 to1 and
lateral vibrations from level 2 to 3. The DH WOB varied from 8 to 10 and the DH torque was
around 2kNm.
From 3075 to 3100 the bit encountered a softer formation that varied from 2.1 to 2.2 g/cc. The
ROP in this section varied from 30m/hr up to 80m/hr for short durations. The lateral and axial
vibrations stayed at 2 and 0. DH WOB was from 2 to 3 tons and DH torque varied from 0 to 2
kNm.
Further down at 3735 to 3745 the bit again encountered a formation with a density around
2.65 g/cc.
Figure 6.2: Interval 3725m to 3745m from run 22 at Deep Sea Trym[13].
For this run the ROP is much the same as in the upper area and the level of lateral and axial
vibrations were respectively 2 and 0 to 1 as earlier. The DH WOB stands out a bit from
earlier variations from 10 to 12 tons and it results in the same DH torque, 0 to 2 kNm, as the

32
earlier section that had 8 to 10 tons. This might indicate that the bit is starting to wear at this
point.
In the section from 3775m to 3825m the bit enters a formation that is more similar to the
softer formation at the start. It has a density of 2.1 to 2.2 g/cc and the ROP is around 30m/hr
with some spikes up to 60m/hr. The lateral vibrations stays at level 2 and the axial vibrations
stays at 0. The DH WOB varies from 6 to 8 tons giving a torque output of 0 to 2 kNm.
Compared to the softer formation drilled earlier, the WOB increased by 4 to 5 tons and the
torque output is the same. Also the overall ROP was lower in this similar section. This again
suggests that the bit is starting to wear. It is also worth noticing that there are no changes in
the axial and lateral vibrations so far.
Figure 6.3: Interval 3770m to 3825m from run 22 at Deep Sea Trym[13].

33
Further down at 4450m to 4475m there was a section with slightly softer formation, staying
around 2.1 g/cc. The ROP here was varying from 15m/hr to 28m/hr and with lateral and axial
vibrations showing 2 and 0. The WOB was varying between 8 and 10 tons, giving a torque of
2 to 3 kNm.
So even in a softer formation and with an increase in WOB, the ROP was substantially
decreased. Also the WOB was increased by around 2 tons to give a slightly higher torque than
before. Again there was no signs of change in vibrations.
Figure 6.4 : Interval 4450m to 4475m from run 22 at Deep Sea Trym[13].

34
To be able to compare the theory regarding increase in pump pressure, we need to use the
real-time time log. Preferably in areas with soft formations since pump pressure increase in
hard formations might happen regardless of the bit wear.
Looking at a new bit in the interval from 3075 m to 3100m, we can see that the pressure
varies a bit, but it has not got any spikes that would suggest blocked nozzles.
Figure 6.5: Interval 3075m to 3100m from run 22 at Deep Sea Trym[14].
35
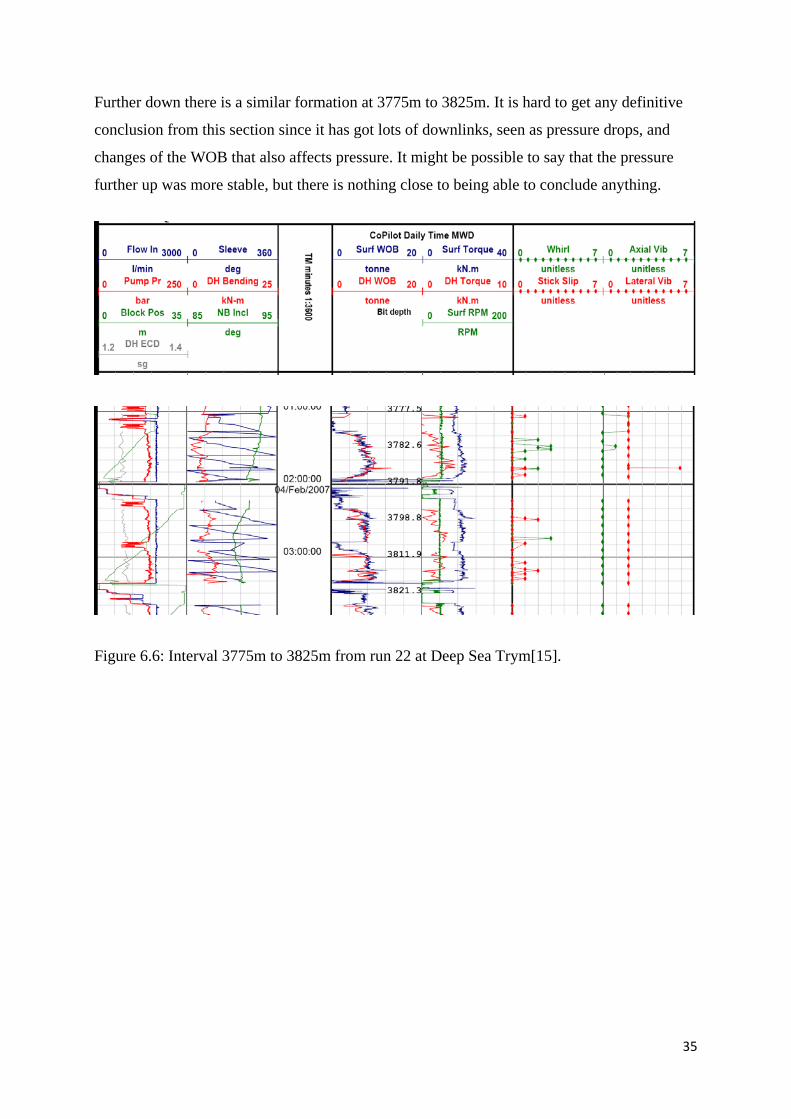
Further down there is a similar formation at 3775m to 3825m. It is hard to get any definitive
conclusion from this section since it has got lots of downlinks, seen as pressure drops, and
changes of the WOB that also affects pressure. It might be possible to say that the pressure
further up was more stable, but there is nothing close to being able to conclude anything.
Figure 6.6: Interval 3775m to 3825m from run 22 at Deep Sea Trym[15].

36
At the last section from 4450m to 4490m a more frequent increase in pressure was seen as
compared to the earlier sections. This may suggest that the bit was being forced into the
formation without being able to cut it first, thus resulting in the nozzles of the bit being
blocked. The big scale range being used for the measured pressure was making it harder to
recognize the pressure changes, making it hard to conclude anything.
Figure 6.7: Interval 4450m to 4490m from run 22 at Deep Sea Trym[15].

37
Slightly worn bit at Deep Sea Trym
The former results can be compared with another run made at Deep Sea Trym, drilled for
Norsk Hydro from 4044m to4977m starting the 11th of November 2007.At the end the bit
was graded : 3-1-CT-S-X-I-NO-TD , which is a wear that should not affect the drilling
efficiency.
Figure 6.8: Interval 4115m to 4135m from run 7 at Deep Sea Trym[15].
At the start from 4115m to 4135m, there was a formation with density of 2.2 g/cc.The ROP
through this was 30-60 m/hr and there were no lateral or axial vibrations. The WOB stayed
around 4 to 5 tons which gave a torque of 1kNm.
38
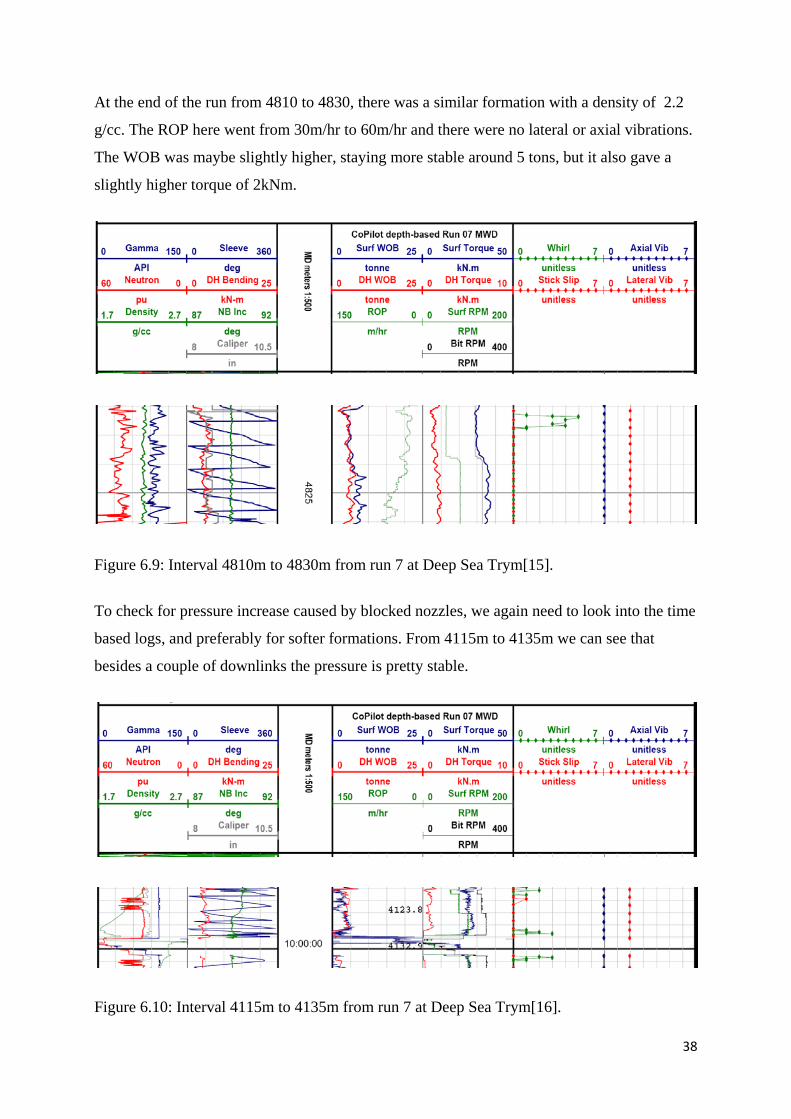
At the end of the run from 4810 to 4830, there was a similar formation with a density of 2.2
g/cc. The ROP here went from 30m/hr to 60m/hr and there were no lateral or axial vibrations.
The WOB was maybe slightly higher, staying more stable around 5 tons, but it also gave a
slightly higher torque of 2kNm.
Figure 6.9: Interval 4810m to 4830m from run 7 at Deep Sea Trym[15].
To check for pressure increase caused by blocked nozzles, we again need to look into the time
based logs, and preferably for softer formations. From 4115m to 4135m we can see that
besides a couple of downlinks the pressure is pretty stable.
Figure 6.10: Interval 4115m to 4135m from run 7 at Deep Sea Trym[16].

39
From 4810m to 4830m it becomes even clearer that the pressure is showing no signs of
blocked nozzles. Even though the cutters of the bit is graded a 3, the pressure is showing a
steady trend.
Figure 6.11: Interval 4810m to 4830m from run 7 at Deep Sea Trym[16].
Comparing the two different bit runs, we can clearly see that the WOB versus torque and ROP
ratio was much more stable throughout this run than in the run with a severely worn bit. Also
the difference between the more spiky pressure curve from the worn bit, as compared to this
run, became more visible.

40
Severely worn bit West Venture
Starting at the 4th of April 2007, this run was made for Norsk Hydro and beginning with a
new bit was drilled from 3973m to 4617m. At the end the bit was quite worn and was graded :
5-8-RO-N-X-I-SD-PR.
The first interval investigated was drilled while the bit was still new, at 4000m to 4010m.
Here the density of the formation was 2.1 g/cc and the ROP varied from 50m/hr to 65m/hr.
Lateral vibrations measured as level 2 and axial vibrations as 0. The WOB was very low with
readings around 0.5 tons and a torque going from 1 to 2kNm.
Figure 6.12: Interval 4000m to 4010m from run 19 at West Venture[17].
The second interval is from 4400m to 4415m with a formation density of 2.1 g/cc. This
interval had a ROP of 30m/hr to 50m/hr and lateral vibrations from level 2 to 3 and axial
vibrations from 0 to 1. The WOB was around 2 tons and the torque around 1kNm.

41
Figure 6.13: Interval 4400m to 4415m from run 19 at West Venture[17].
Even though the difference was not as clear as with the worn bit from Deep Sea Trym, much
of the same was seen here. The WOB increased from 0.5 to 2 tons and the torque decreased
from 1 to 2kNm to 1kNm. Also the ROP was generally lower in the last section, going down
from 50 to 65m/hr to 30 to 50m/Hr. In addition some small changes in lateral and axial
vibrations were observed.
To investigate the theory of blocked nozzles we need to look into the timebased log in soft
formations.
Figure 6.14: Interval 4000m to 4020m from run 19 at West Venture[18].
42
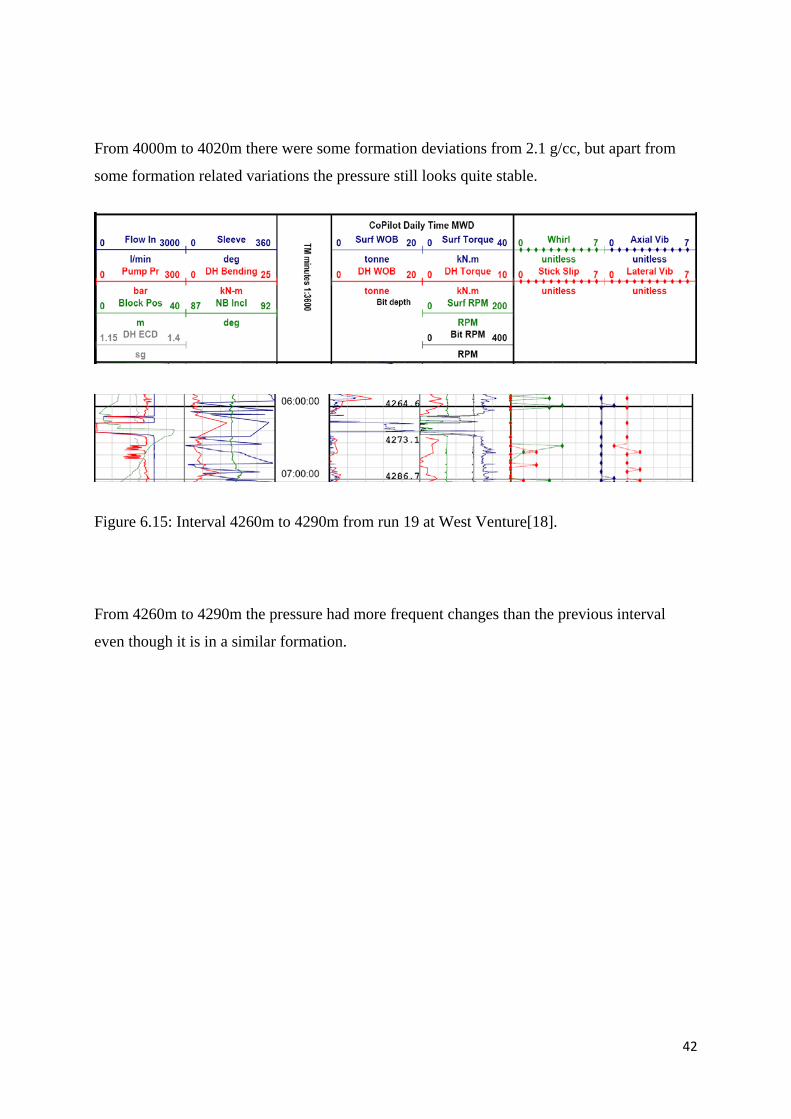
From 4000m to 4020m there were some formation deviations from 2.1 g/cc, but apart from
some formation related variations the pressure still looks quite stable.
Figure 6.15: Interval 4260m to 4290m from run 19 at West Venture[18].
From 4260m to 4290m the pressure had more frequent changes than the previous interval
even though it is in a similar formation.

43
Slightly worn bit West Venture
This run was made for Norsk Hydro and was drilled from 2658m to3189m starting at the 19th
of March 2007. At the end of the run the bit was graded : 2-3-CT-N-X-I-NO-PR.
The first interval shown here was from 2700m to 2725m. The formation had a density of 2.1
g/cc and the ROP was from 40m/hr to 60m/hr. Lateral vibrations showed level 2, and axial
vibrations 0. The WOB was varying from 1 to 2 tons and the torque was around 1kNm.
Figure 6.16: Interval 2700m to 2725m from run 16 at West Venture[19].
At the end of this run a similar formation occurred from 3025m to 3040m. It had a density of
2.1 and a ROP varying from 15 to 40m/hr. Lateral vibrations showing level 2 and axial 0. The
WOB increased to 4 to 5 tons and the torque increasing to 2 to 3kNm. So in this case the
torque reacted to the increase in WOB.
Even though the WOB was increased the ROP decreased as compared to the similar
formation, and this bit was actually pulled due to poor penetration rate. But at surface the bit

44
showed only small wear signs. So the lack of ROP in this case was due to something else than
bit wear.
Figure 6.17: Interval 3025m to 3050m from run 16 at West Venture[19].

45
The pressure in this run was compared to former runs by looking at the time based plot in the
interval 2700m to 2725 which had a soft formation.
Figure 6.18: Interval 2700m to 2725m from run 16 at West Venture[20].
From the pressure we can see that there was very little changes in the pressure here. To
further investigate we looked at the interval from 3005m to 3020m which had got a similar
formation.
Figure 6.19: Interval 3005m to 3020m from run 16 at West Venture[20].

46
Compared to the pressure above it might look like there was more frequent changes in the
pressure. But again the large scale range of the pressure curve makes it hard to determine this
with any accuracy.
If we compare the run with a worn bit versus the lightly worn bit, we can see that the WOB
torque ratio stands out as a difference. The ROP decreased for both runs, but only one of these
had a worn bit. The pressure in the last run was a little bit more stable than for the worn bit
run, but the difference was not as great as in the case of the Deep Sea Trym runs.
6.2 Plotting key data
To get a better look at the data that looked like the most reliable for recognizing bit wear, the
data in question was read out from the curves and plotted in excel. Since there was nothing
from the logs that suggested that the axial and lateral vibrations increased as the bit got more
worn, they were not included here. Although the pump pressure showed an increase in
frequency of spikes as the bit got more worn, the data from the curves was not plotable.
6.2.1 WOB versus torque
After looking at the data from West Venture and Deep Sea Trym, the two parameters that
looked the most reliant to decide bit wear was torque and WOB. These data were taken from
similar formations at the beginning and at the end of a bit run, and was plotted in excel. The
WOB is given in a scale of 1ton, while the torque is given in a scale of 1kNm.

47
Figure 6.20 : WOB vs Torque from bit run 22 DS Trym, starting with a new bit and worn
. down to a grading of 8-5-RO-N-X-I-WT. This indicates a heavily worn bit.
Figure 6.21 : WOB vs Torque from bit run 7 DS Trym, starting with a new bit which at the
. end was worn down to a grading of 3-1-CT-S-X-I-NO-TD. This indicates a bit
. hardly worn.
When we look at the two graphs from Deep Sea Trym, it is easy to see how much the ratio
between WOB and torque increases for the heavily worn bit as compared to the lightly worn
bit. While the first graph shows an increase in WOB while the torque increased by only
1kNm, the second graph shows that both WOB and torque had a steady increase from start to
end. The reason why the lightly worn bit also had an increase in WOB may be that the
formation further down was more compacted. So more WOB was required to maintain the
wanted ROP. Also the formation could be slightly harder without the logs picking this up.
The main difference is that the torque increases as the WOB increases for the slightly worn

48
bit, while the torque for the severely worn bit hardly shows an increase compared to the
increase in WOB.
The same data were then plotted for the two runs from West Venture.
Figure 6.22 : WOB vs Torque from West Venture, starting with a new bit that is worn down
. to a grading of : 5-8-RO-N-X-I-SD-PR. This indicates a severely worn bit.
Figure 6.23 : WOB vs Torque from West Venture, starting with a new bit which at the end of
. the run was worn down to a grading of 2-3-CT-N-X-I-NO-PR. This indicates a
. bit hardly worn.

49
These two runs also show that while the heavily worn bit had an increase in WOB and a
decrease in torque, the lightly worn showed a steady increase for both values.
6.2.2 WOB versus ROP
The ROP in the sections investigated was averaged and plotted in excel with the WOB that
was applied at the moment. To give a better presentation of the WOB the scale was changed
from 1 ton to 0.1 tonnes, while the ROP is given in m/hr.
Figure 6.24 : WOB vs ROP from bit run 22 DS Trym, at the end graded 8-5-RO-N-X-I-WT
Figure 6.25 : WOB vs ROP from bit run 7 DS Trym, at the end graded 3-1-CT-S-X-I-NO-TD

50
From the two plots made from the Deep Sea Trym data, we can see how different the ROP
behaves for a severely worn bit as opposed to a lightly worn bit.
The same data was plotted from the two runs investigated at West Venture.
Figure 6.26 : WOB vs ROP from West Venture, at the end graded 5-8-RO-N-X-I-SD-PR
Figure 6.27 : WOB vs ROP from West Venture, at the end graded 2-3-CT-N-X-I-NO-PR
In these two plots we can see that the ROP actually declines just as much for the lightly worn
as it does for the severely worn. This shows that the ROP was not a good indicator for bit
wear in this particular run, and that the decline in ROP probably was caused by something
else than a worn bit.
51
7. Discussion
7.1 Different PDC bits
Reference: 2
When comparing data from the different runs, a new bit did not always behave the same way
as often seen in other runs, even though drilling in similar formation. One of the reasons for
this might be that every PDC has several ways of being customized to the formation it is
supposed to drill in. The most important for the bit performance is probably how aggressive
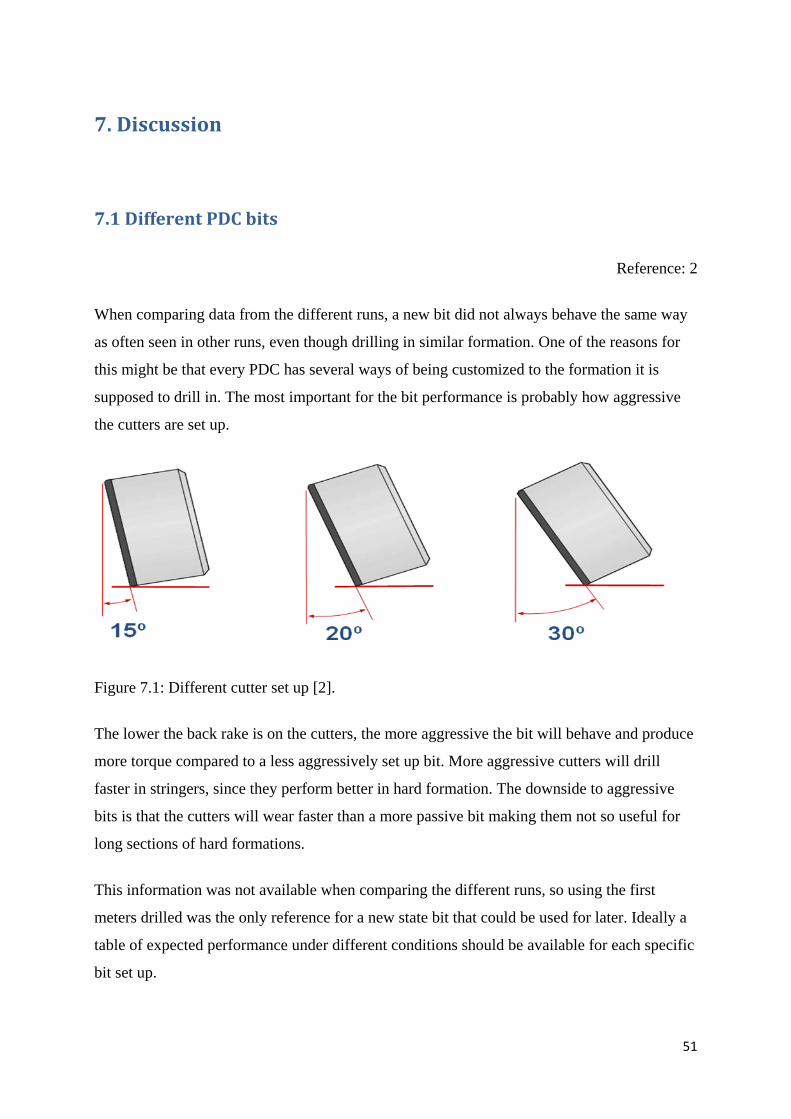
the cutters are set up.
Figure 7.1: Different cutter set up [2].
The lower the back rake is on the cutters, the more aggressive the bit will behave and produce
more torque compared to a less aggressively set up bit. More aggressive cutters will drill
faster in stringers, since they perform better in hard formation. The downside to aggressive
bits is that the cutters will wear faster than a more passive bit making them not so useful for
long sections of hard formations.
This information was not available when comparing the different runs, so using the first
meters drilled was the only reference for a new state bit that could be used for later. Ideally a
table of expected performance under different conditions should be available for each specific
bit set up.

52
7.2 Drilling conditions
When looking into these logs many conditions were not taken into account, such as weather
conditions, problem with equipment, type of mud, hole problems or even difference in drill
crews. Especially when looking at the ROP, conditions like these will influence the result
without being shown in the log. For instance, hole problems such as bad hole cleaning would
affect ROP, making it hard to know for sure whether the decrease in ROP is due to the bit or
due to other reasons.
If there is a limitation on ROP, it can also give less pressure spikes due to blocked nozzles.
This is because less WOB will be needed to maintain the ROP that is wanted decreasing the
possibility that the nozzles are pushed against the formation and blocked. On the other hand
rig heave may give an increase in pressure spikes due to the difficulties in keeping a steady
WOB.
7.3 Data compared
Since there was no access to the raw data other than looking at and comparing logs, which
was what was wanted from this thesis, getting a final conclusion to all the theories was hard.
Data such as pressure, where the measured value was small compared to the large scale used
in the output, made it difficult to spot both the start of, and the actual change of, possibly
significant variations.
Access to raw data would also had made it possible to compare all data from different runs in
one graph, making it easier to spot differences between a worn bit versus a not worn bit.

53
8. Conclusion
Several bit runs were compared, first to find similarities in the formations drilled, and then to
compare how the different drilling data in question developed. This data output was then
compared to how each bit was performing at the start of the run, to see what data would
change most from a new state bit, as the bit got more worn. Then comparing the findings from
the run to the actual wear of the bit when it was graded using the IADC dull bit system.
Lateral and axial vibrations were compared for worn bits and not worn bits. In the logs that
were compared the readings from these vibrations showed no distinct, if any at all, changes
from a new state bit to a worn bit. Most of these vibrations occurred as the bit was going into
a harder than normal formation, or on its way out of a hard formation. That was the case for
both new state and worn bits, and from the logs compared it was hard to see any increase or
decrease in vibrations as the bit got more worn.
The relation between pump pressure and blocked nozzles was also investigated. The large
scale used in the logs made it difficult to get a confirmation of this theory. But when
comparing bits in almost new state versus the more worn bits, it often looked like the worn
bits had a more unsteady pump pressure. So an increase in pressure spikes in softer
formations may be a sign of a worn bit. Especially when the same WOB was applied as in an
earlier section with the same formation, and then showing a distinct increase in time of
pressure spikes amplitudes.
The pressure spikes caused by assumedly blocked nozzles also occurred, as expected, as the
bit broke through harder formations and went into a softer formation. So intervals that had
many changes in lithology were not the best to use as a comparison. This gave a restricted set
of intervals and runs to investigate this theory. But overall it looked like experiencing an
increase in the frequency and amplitudes of pressure spikes can be used as an indication of a
worn bit.
How the ROP changed throughout runs with bits in different wear states was looked into. It
was clearly seen that the ROP for worn bits declined much more rapidly than for those bits

54
that were not so worn. This may sound like a self-fulfilling prophecy since the reason we want
to recognize bit wear and pull out, is to maintain a steady high ROP.
But on some occasions the ROP would decline and the bit grades was not severely worn at all,
such as the run made at West Venture the 19th of March 2007. This bit was pulled due to poor
penetration rate, but when the bit was inspected it was graded 2-3-CT-N-X-I-NO-PR. This is
a wear so small that it should have no effect on the performance of the bit. The reason for the
decline in ROP may be due to something else, such as a slight change of formation into a type
that the bit is not optimized for. For instance a formation favoring a more aggressive cutter set
up, thus making it look like the bit overall is worn. Also other reasons, that these plots are
unable to show, may be the cause of this.
This shows that a decline in ROP cannot always be relied on to recognize bit wear. But in
most runs where this happened an increased bit wear was generally the case, so using ROP as
an indicator may well be confirmed as a method that can be used, but with some caution.
By looking into how much torque that was generated from applied WOB at the beginning of
each run, and then compare with how much that was generated at the end, a clear pattern
appeared. The severe worn bits showed that in the end a lot more WOB had to be applied to
maintain the torque than was required at the beginning of the section, when the bit was new.
Even though there are different bit set ups, with regards to how aggressive the cutters are set
up and therefore how much torque they will generate, a decrease in torque output was
distinctly seen for the severely worn bits. When plotting WOB and torque from the runs that
were shown in this thesis, it was easy to see that the severely worn bits needed a lot more
WOB to get an increase in or to maintain torque. These data was taken from similar
formations, so there should not be any factors from the formation playing in.
Overall this comparison showed to be the most reliant indicator of the bit wear. And with data
from the manufacturer containing how a bit performs with different wears and under different
conditions, such as cutter set up, WOB and formation type, it could be possible to grade the
bit by comparing the down hole parameters with these tables. Unfortunately these data were
not available for this thesis to investigate, but as a future study it looks like a possibility for
obtaining a more quantitative estimation of bit wear.

55
References
(1) M.Stavland,SPE, Baker Hughes INTEQ; H.Wolter, SPE, Norsk Hydro; J.G. Evans, SPE,
Baker Hughes OASIS, ” Mitigating Application-Specific Challenges through a total system
approach.” IADC/SPE 99122.
(2) Baker Hughes INTEQ, PDC bit training ppt.
(3) Baker Hughes INTEQ, PDC dull grading training ppt.
(4) Jean Phillippe Tantet, Baker Hughes INTEQ, private conversation week 6 2008.
(5)Baker Hughes INTEQ, Navi drill motor handbook 10th edition.
(6) Baker Hughes INTEQ, CoPilot manual CoP-20-70-0000-02-01-Rev. A
(7) Jean Phillippe Tantet, Baker Hughes INTEQ, private conversation week 9 2008.
(8) P.D. Spanos, A.M. Chevallier, N.P. Politis and M.L. Payne: “Oil well drilling: A vibration
perspective”, The shock and vibration digest, vol35, No 2, March 2003
(9) Real-time depthbased plot Deep Sea Trym, well 31/2-P-14, December 2007
(10) Real-time timebased plot Deep Sea Trym, well 31/2-P-14, December 2007
(11) Memory depthbased plot Deep Sea Trym, well 31/2-P-14, December 2007
(12) Memory timebased plot Deep Sea Trym, well 31/2-P-14, December 2007
(13) Real-time depthbased plot Deep Sea Trym, well 31/2-N-22 Y3H, February 2007
(14 Real-time timebased plot Deep Sea Trym, well 31/2-N-22 Y3H, February 2007
(15) Real-time depthbased plot Deep Sea Trym, well 31/2-P-14 BY1H, November 2007
(16) Real-time timebased plot Deep Sea Trym, well 31/2-P-14 BY1H, November 2007

56
(17) Real-time depthbased plot West Venture, well 31/2-G-1 BY2H, April 2007
(18) Real-time timebased plot West Venture, well 31/2-G-1 BY2H, April 2007
(19) Real-time depthbased plot West Venture, well 31/2-G-1 BY2H, March 2007
(20) Real-time timebased plot West Venture, well 31/2-G-1 BY2H, March 2007