Mastering Financial Statements - Allied Foods. Allied Foods Allied Foods is a processor and...
26
Mastering Financial Statements - Allied Foods
-
Upload
lyric-caryl -
Category
Documents
-
view
243 -
download
1
Transcript of Mastering Financial Statements - Allied Foods. Allied Foods Allied Foods is a processor and...

Mastering Financial Statements
- Allied Foods

Allied Foods
• Allied Foods is a processor and distributor of a wide variety of staple foods
• Formed in 1978 \• Allied’s earnings : $117.8 million in 2001
: $133.5 million in 2002
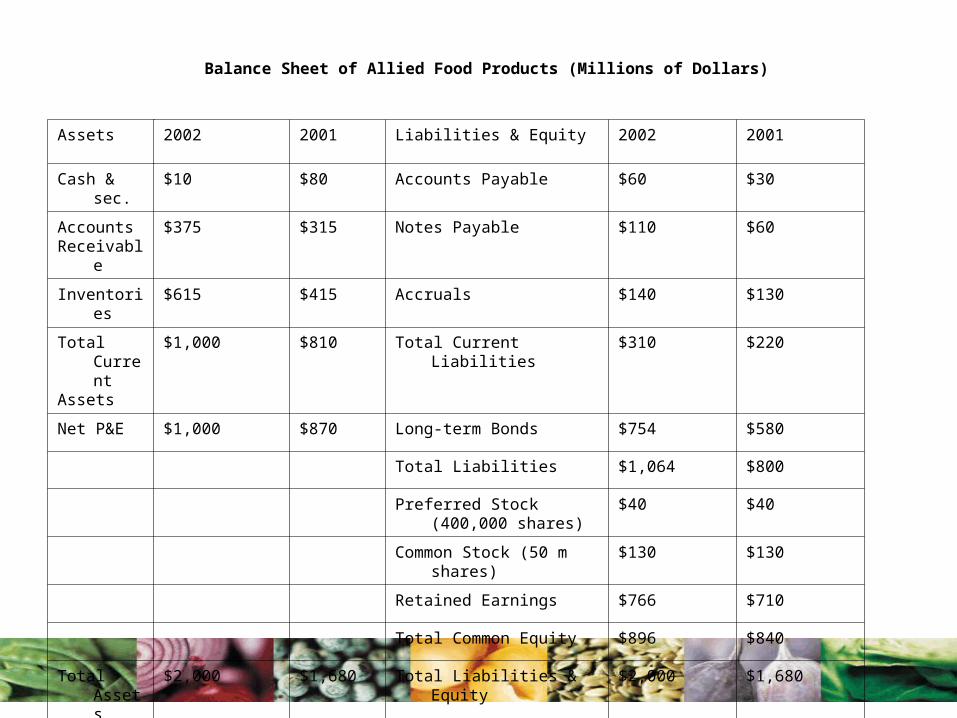
Balance Sheet of Allied Food Products (Millions of Dollars)
Assets 2002 2001 Liabilities & Equity 2002 2001
Cash & sec. $10 $80 Accounts Payable $60 $30
AccountsReceivable
$375 $315 Notes Payable $110 $60
Inventories $615 $415 Accruals $140 $130
Total CurrentAssets
$1,000 $810 Total Current Liabilities $310 $220
Net P&E $1,000 $870 Long-term Bonds $754 $580
Total Liabilities $1,064 $800
Preferred Stock (400,000 shares)
$40 $40
Common Stock (50 m shares) $130 $130
Retained Earnings $766 $710
Total Common Equity $896 $840
Total Assets $2,000 $1,680 Total Liabilities & Equity $2,000 $1,680

Income Statement for Allied Food Products (Millions of Dollars)
2002 2001 Per Share Data
Net Sales 3000 2850 2002 2001
Operating Costs 2616.2 2497 Common Stock Price 23 26
EBITDA 383.8 353 Earnings per share 2.27 2.36
Depreciation 100 90 Dividends per share 1.15 1.06
Amortization 0 0 Book value per share 17.92 16.8
EBIT (operating income) 283.8 263 Cash Flow per share 4.27 4.16
Less interest 88 60
EBT 195.8 203
Taxes (40%) 78.3 81.2
Net income before pref. div.
117.5 121.8
Preferred dividends 4 4
Net income 113.5 117.8
Common dividends 57.5 53
Addition to retained earnings
56 64.8

Balance Sheet Observations
• Cash:Cash represents actual money and Receivables are bills others owe Allied .Inventories show the dollars the company has invested in raw materials, work-in-process, and finished goods for sale. Net Plant & Equipment represent the amount of money paid for Allied’s fixed assets when it acquired those assets in the past.
• Liabilities versus stockholder’s equity: Net worth is the same as common stockholders’ equity.
• Preferred versus Common Stock :Preferred is a hybrid and in the event of bankruptcy, preferred stock ranks below debt but above common. Preferred dividend is usually fixed so the preferred stock holders do not benefit if earnings increase .

Balance Sheet Observations … cont
• Time Factor: Balance Sheet changes every day as inventories are increased or decreased, as fixed assets are added or retired, as bank loans are increased or decreased.– Companies whose businesses are seasonal have larger changes in their
balance sheets.– Allied has low inventories just before harvest season but they are high
after the fall crops have been brought and processed.– Retailers have large inventories just before Christmas but low
inventories and high A/R right after Christmas.
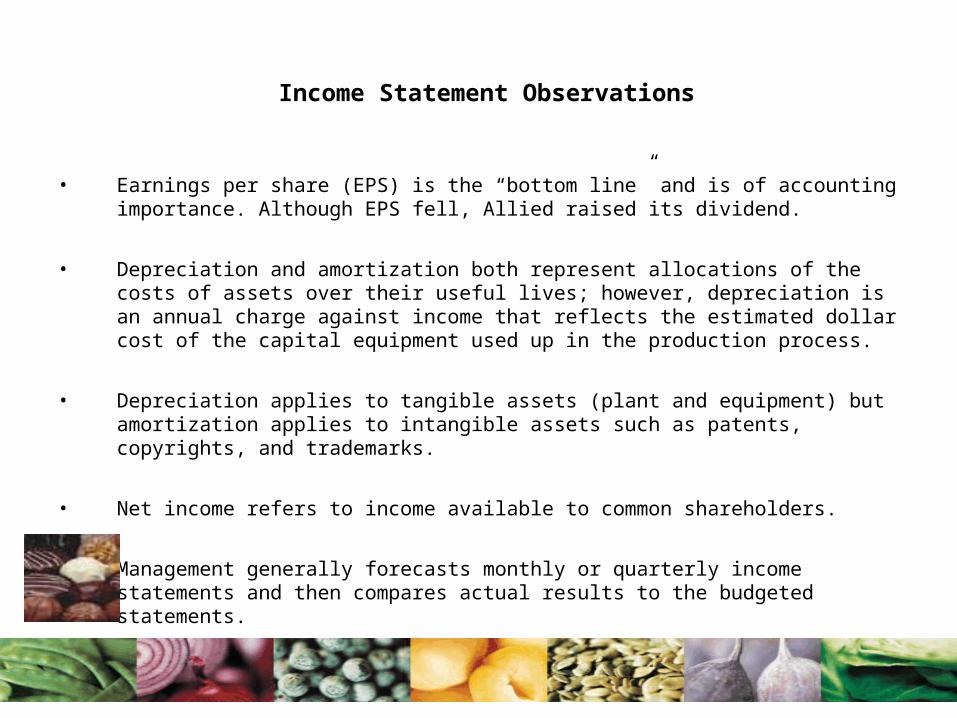
Income Statement Observations
• Earnings per share (EPS) is the “bottom line” and is of accounting importance. Although EPS fell, Allied raised its dividend.
• Depreciation and amortization both represent allocations of the costs of assets over their useful lives; however, depreciation is an annual charge against income that reflects the estimated dollar cost of the capital equipment used up in the production process.
• Depreciation applies to tangible assets (plant and equipment) but amortization applies to intangible assets such as patents, copyrights, and trademarks.
• Net income refers to income available to common shareholders.
• Management generally forecasts monthly or quarterly income statements and then compares actual results to the budgeted statements.
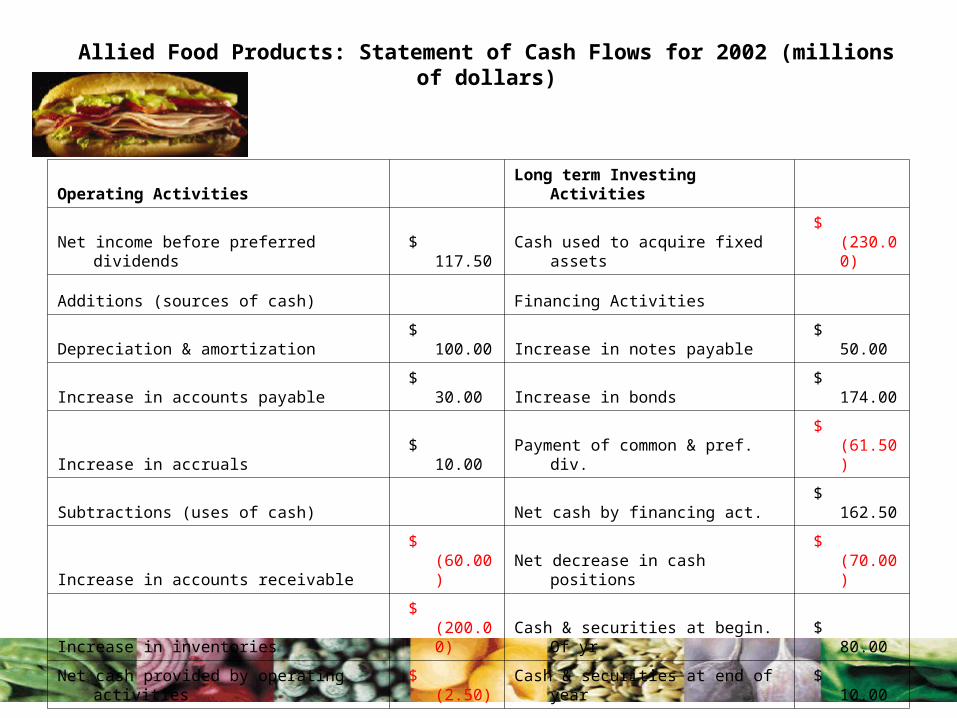
Allied Food Products: Statement of Cash Flows for 2002 (millions of dollars)
Operating Activities Long term Investing
Activities
Net income before preferred dividends $ 117.50 Cash used to acquire fixed assets $ (230.00)
Additions (sources of cash) Financing Activities
Depreciation & amortization $ 100.00 Increase in notes payable $ 50.00
Increase in accounts payable $ 30.00 Increase in bonds $ 174.00
Increase in accruals $ 10.00 Payment of common & pref. div. $ (61.50)
Subtractions (uses of cash) Net cash by financing act. $ 162.50
Increase in accounts receivable $ (60.00) Net decrease in cash positions $ (70.00)
Increase in inventories $ (200.00) Cash & securities at begin. Of yr $ 80.00
Net cash provided by operating activities $ (2.50) Cash & securities at end of year $ 10.00

Statement of Cash Flow Observations
• Net cash flow represents the amount of cash a business generates for its shareholders in a given year.
• Cash flow may be used to pay dividends, to increase inventories, to finance accounts receivables, to reduce debt, to buy back stock, etc.
• Impact of cash:– Positive net cash flow will lead to MORE cash in bank– Increases in CA (other than cash) will DECREASE cash (if inventories
are to increase, firm must use some of cash to buy more inventory)– Increases in CL (A/P) will INCREASE cash. If payables increase, the
firm has additional credit from its suppliers which saves cash.– If a company invests in fixed assets, cash will DECREASE– If a company issues stock or bonds, funds raised will INCREASE cash.– If a company uses cash to buy back outstanding debt or equity or
pays dividends, this will DECREASE cash.

Statement of Cash Flow Observations
• Is the firm generating enough cash to purchase additional assets required for growth?
Allied’s day to day operations in 2002 provided $257.5 million; however, the increase in receivables and inventories more than offset this amount, resulting in a NEGATIVE cash flow from operations of $2.5 million.
• Is the firm generating any extra cash that can be used to repay debt or invest in new products?
Allied purchased $230 million in fixed assets; this is the only long-term investment.
• Will inadequate cash flows force the company to issue more stock? Allied raised $224 by borrowing but it paid $61.5 million in preferred and common dividends. Its net inflow of funds was $162.5 million.
• Cash was reduced by $70 million. Allied met that shortfall by drawing
down its cash and marketable securities by $70 million.
• BIG WORRY for analysts! Company had $2.5 million cash shortfall from operations, it spent $230 million on new fixed assets, and it paid out another $61.5 million in dividends. It did so by borrowing heavily and selling off most of its marketable securities.

What is Free Cash Flow
• Free cash flow is the cash flow actually available for distribution to all investors (stock and debt) after the company has made all the investments in fixed assets, new products, and working capital necessary to sustain ongoing operations.
• FCF differs from net cash flow in two ways:– Free cash flow represents funds to all investors whereas net cash
flow represents funds to common stockholders. Payments to bondholders and preferred stockholders reduce net cash flow but they are not subtracted out of free cash flow.
– Free cash flow represents the funds available to all investors after subtracting out the investments that are necessary to sustain the firm’s ongoing operations.
• Remember that analysts will calculate net cash flow to measure the cash generated for shareholders in a given year but free cash flow is more relevant when estimating the value of a project or firm!
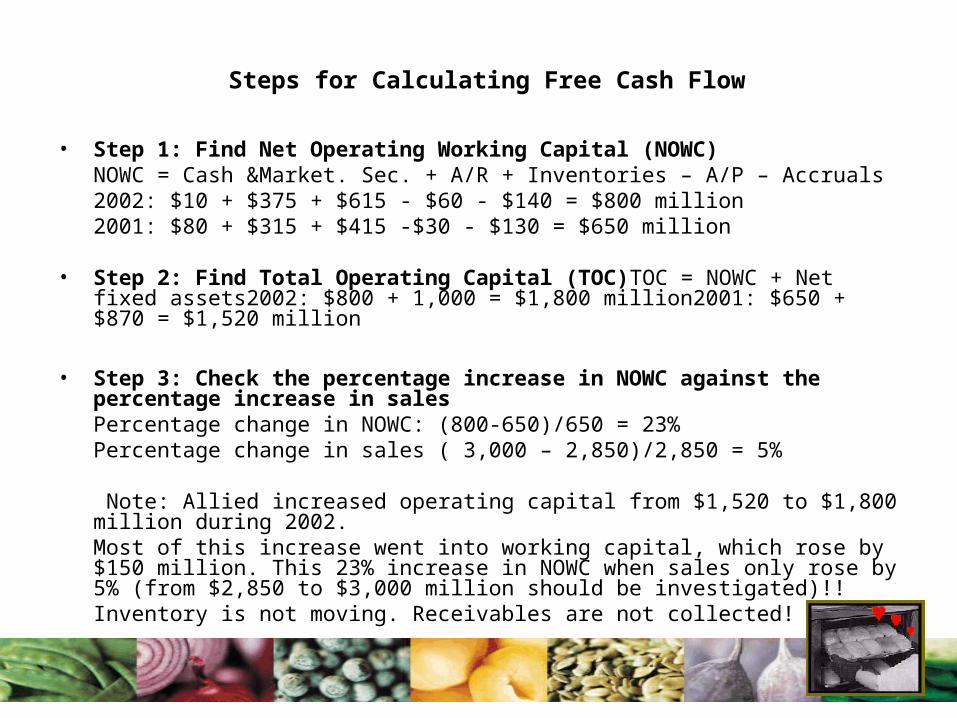
Steps for Calculating Free Cash Flow
• Step 1: Find Net Operating Working Capital (NOWC)NOWC = Cash &Market. Sec. + A/R + Inventories – A/P – Accruals2002: $10 + $375 + $615 - $60 - $140 = $800 million2001: $80 + $315 + $415 -$30 - $130 = $650 million
• Step 2: Find Total Operating Capital (TOC)TOC = NOWC + Net fixed assets2002: $800 + 1,000 = $1,800 million2001: $650 + $870 = $1,520 million
• Step 3: Check the percentage increase in NOWC against the percentage increase in salesPercentage change in NOWC: (800-650)/650 = 23%Percentage change in sales ( 3,000 – 2,850)/2,850 = 5%
Note: Allied increased operating capital from $1,520 to $1,800 million during 2002. Most of this increase went into working capital, which rose by $150 million. This 23% increase in NOWC when sales only rose by 5% (from $2,850 to $3,000 million should be investigated)!! Inventory is not moving. Receivables are not collected!

Steps for Calculating Free Cash Flow …cont
• Step 4: Calculate Net Operating Profit after Taxes (NOPAT): Profit a company would generate if it had no debt and held no operating assetsNOPAT = EBIT (1-t)2002: NOPAT = $283.8(1-.40) = $283.8(0.60) = $170.3 million 2001: NOPAT = $263(1-.4) = $263(0.60) = $157.8 million Allied generated an after-tax profit of $170.3 million in 2002 from its operations. Decrease in EPS was caused by an increase in interest expense and not a decrease in profit. Why did Allied increase debt? Because it increased its operating capital.
• Step 5: Calculate Operating Cash Flow OCF = NOPAT + Depreciation + Amortization2002: $170.3 + $100 = $270.3 million
• Step 6: Calculate Net Investment in Operating Capital Net Investment in Operating Capital = TOC2002 – TOC2001Net Investment in Operating Capital = 1,800 – 1,520 = $280 million
• Step 7: Calculate Gross Investment in Operating CapitalGross Investment in O.C. = Net investment + Depreciation & Amortization Gross Investment = $280 + $100 = $380 million
• Step 8: The 2 equations for Free Cash FlowFCF = Operating Cash Flow – Gross Investment = $270.3 - $380 = -$109.7FCF = NOPAT – Net investment in operating capital = $170.3 - $280 = -$109.7
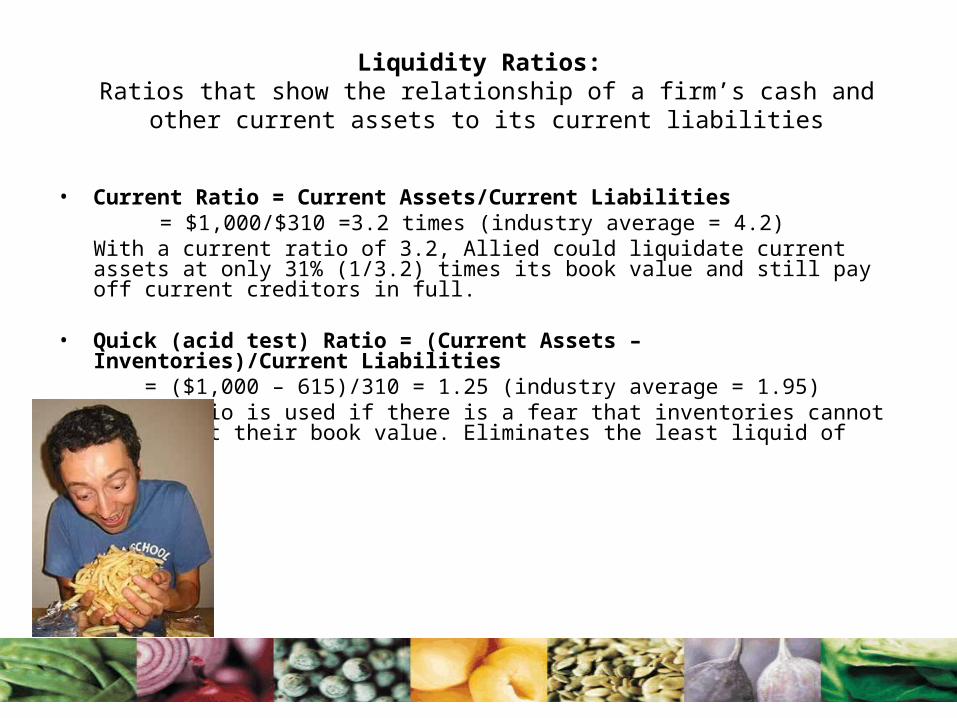
Liquidity Ratios: Ratios that show the relationship of a firm’s cash and other current
assets to its current liabilities
• Current Ratio = Current Assets/Current Liabilities = $1,000/$310 =3.2 times (industry average = 4.2)
With a current ratio of 3.2, Allied could liquidate current assets at only 31% (1/3.2) times its book value and still pay off current creditors in full.
• Quick (acid test) Ratio = (Current Assets – Inventories)/Current Liabilities = ($1,000 – 615)/310 = 1.25 (industry average = 1.95)Quick ratio is used if there is a fear that inventories cannot be sold at their book value. Eliminates the least liquid of assets

Asset Management Ratios:
How effectively is a firm in managing its assets?
• Inventory Turnover Ratio = Sales/Inventories= $3,000/$615 = 4.9 times (industry average =9.0 times)
Each item of Allied’s inventory is sold out and restocked 4.9 times a year. Allied is holding too much inventory. Excess inventory is unproductive. Is the firm holding obsolete goods that cannot be sold?
• Days sales outstanding (DSO) = Receivables/(Annual Sales/365) = $375/($3,000/365) = 45.625 days (industry = 36 days)The average length of time Allied must wait after making a sale before it receives cash is 46 days. This is also known as the ACP (average collection period). Allied’s sales terms call for payment within 30 days so the customers of Allied are not paying their bills on time. This deprives Allied of funds that it could use to invest in assets. Should they change credit policy?

Asset Management Ratios: ….cont
• Fixed Asset Turnover Ratio (FA) = Sales/Net fixed assets= $3,000/$1,000 = 3.0 (industry = 3.0 times)
This measures how effectively a firm uses its plant and equipment. Allied seems to have the right amount of fixed assets in relation to other firms. One potential problem is fixed assets reflect historical costs of assets. Inflation has caused the value of many assets that were purchased in the past to be seriously understated. If we compare an old firm that acquired many of its fixed assets years ago at low prices to a new company with new assets at higher cost, the old firm automatically has a higher FA ratio. In Allied’s case, not a problem since all firms in the industry have been expanding at the same rate!
• Total Asset Turnover (TA) = Sales/Total Assets= $3,000/$2,000 = 1.5 times (industry = 1.8 times)
Allied is somewhat below average, so the company is not generating enough volume given its investments. Sales should be increased, some assets should be disposed of, or both.
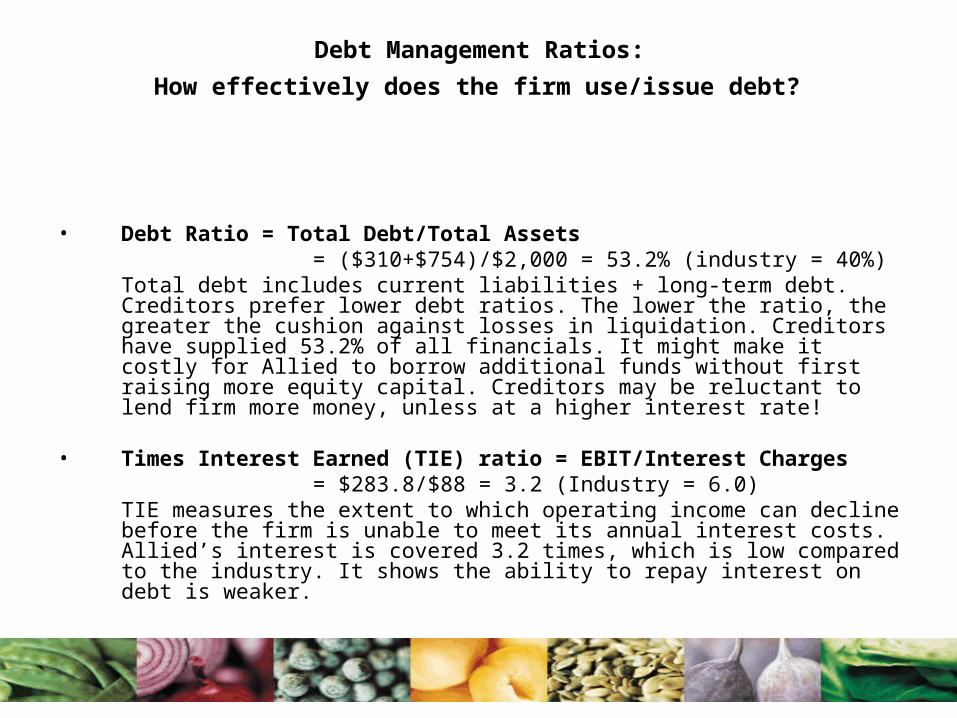
Debt Management Ratios:
How effectively does the firm use/issue debt?
• Debt Ratio = Total Debt/Total Assets = ($310+$754)/$2,000 = 53.2% (industry = 40%)
Total debt includes current liabilities + long-term debt. Creditors prefer lower debt ratios. The lower the ratio, the greater the cushion against losses in liquidation. Creditors have supplied 53.2% of all financials. It might make it costly for Allied to borrow additional funds without first raising more equity capital. Creditors may be reluctant to lend firm more money, unless at a higher interest rate!
• Times Interest Earned (TIE) ratio = EBIT/Interest Charges = $283.8/$88 = 3.2 (Industry = 6.0)
TIE measures the extent to which operating income can decline before the firm is unable to meet its annual interest costs. Allied’s interest is covered 3.2 times, which is low compared to the industry. It shows the ability to repay interest on debt is weaker.

Debt Management Ratios: …cont
• EBITDA Coverage Ratio = (EBITDA + Lease Pay.)/(Interest+Principal pay. + Lease pay) = ($283.8 +$100 +$28)/($88+$20+$28) = 3.0 times (industry = 4.3 times)This is used for short-term lenders such as banks, which rarely make loans for longer than 5 years. EBITDA accounts for lease payments (a type of debt not included in TIE). Assume lease payments of $28 million and principal payments of $20 million) and noncash charges (depreciation) of $100 million. If operating income (EBIT) declines, coverage will fall and so Allied fares worse than the average firm.

Profitability Ratios: Measures effectiveness of a firm’s operations
• Profit Margin = Net income available to common stockholders/Sales
= $113.5/$3,000 = 3.8% (Industry = 5.0%)Low profit margin due to high costs and high use of debt.
• Basic Earning Power = EBIT/Total Assets= $283.8/$2,000 = 14.2% (industry = 17.2%)
Indicates the ability of the firm’s assets to generate operating income. This shows raw earning power and helps compare firms with different tax situations and degrees of leverage. Allied is not earning a high return.
• Return on Total Assets (ROA) = Net income available to common stockholders/TA
= $113.5/$2,000 = 5.7% (industry = 9.0%)Low return on assets due to higher than average debt.
• Return on Common Equity (ROE) = Net income available to common stock/CE
= $113.5/$896 = 12.7% (industry = 15.0%)Stockholders of Allied earn 12.7%. Higher debt, lower common equity, higher ROE.
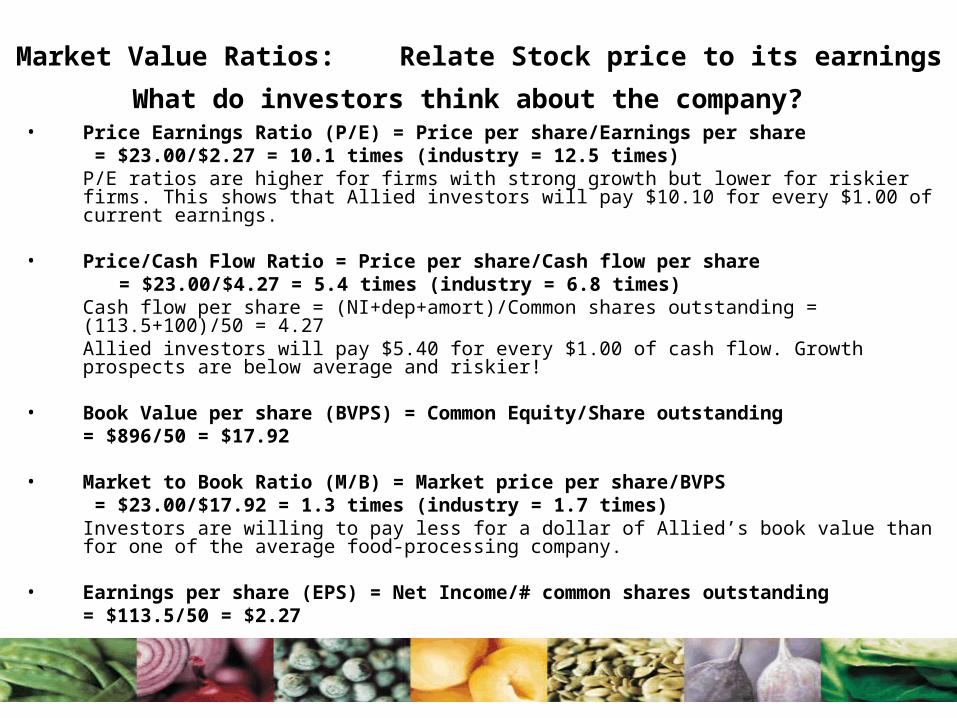
Market Value Ratios: Relate Stock price to its earnings
What do investors think about the company? • Price Earnings Ratio (P/E) = Price per share/Earnings per share
= $23.00/$2.27 = 10.1 times (industry = 12.5 times) P/E ratios are higher for firms with strong growth but lower for riskier firms. This shows that Allied investors will pay $10.10 for every $1.00 of current earnings.
• Price/Cash Flow Ratio = Price per share/Cash flow per share= $23.00/$4.27 = 5.4 times (industry = 6.8 times)
Cash flow per share = (NI+dep+amort)/Common shares outstanding = (113.5+100)/50 = 4.27Allied investors will pay $5.40 for every $1.00 of cash flow. Growth prospects are below average and riskier!
• Book Value per share (BVPS) = Common Equity/Share outstanding= $896/50 = $17.92
• Market to Book Ratio (M/B) = Market price per share/BVPS = $23.00/$17.92 = 1.3 times (industry = 1.7 times)Investors are willing to pay less for a dollar of Allied’s book value than for one of the average food-processing company.
• Earnings per share (EPS) = Net Income/# common shares outstanding= $113.5/50 = $2.27
Comparative Ratios & Benchmarking
• Allied will compare its particular company with a group of benchmark companies.
• Competitors are:– Campbell Soup– Dean Foods (processor of canned and frozen vegetables)– H.J. Heinz (ketchup)– Flowers Industries ( bakery and snack-food goods)– Sara Lee (baked goods)– Hershey Foods (chocolates, confectionary, pasta)
• Can use a number of sources including Value Line, Dun and Bradstreet, Annual Statement Studies (Robert Morris Associates, national association of bank loan officers)
• D&B is mainly for small firms (creditor’s viewpoint) and its ratios emphasize current assets and liabilities
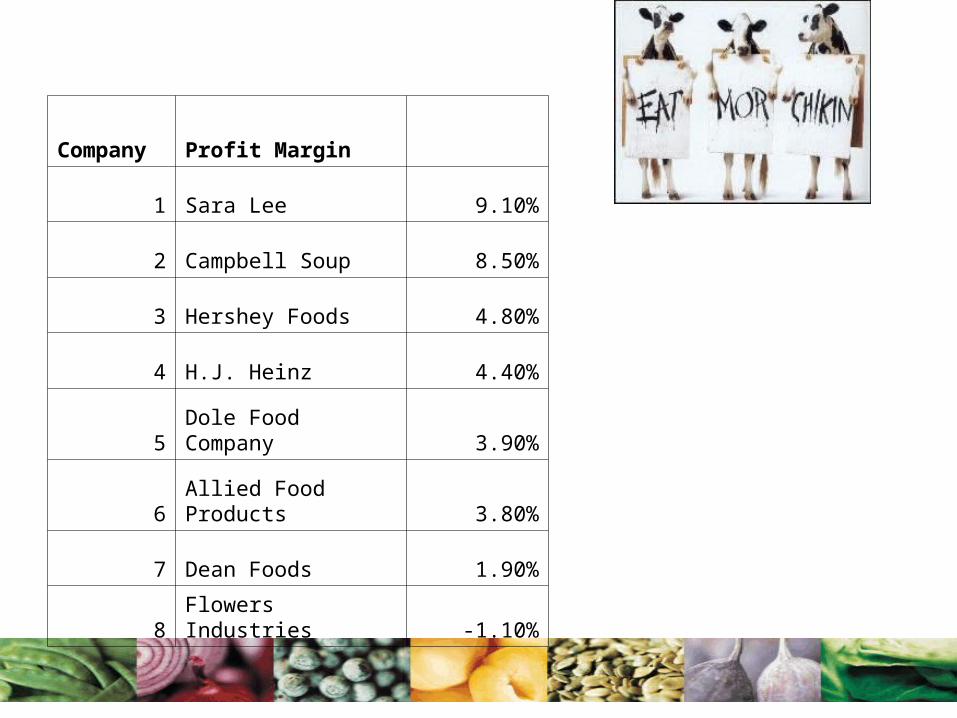
Company Profit Margin
1 Sara Lee 9.10%
2 Campbell Soup 8.50%
3 Hershey Foods 4.80%
4 H.J. Heinz 4.40%
5Dole Food Company 3.90%
6Allied Food Products 3.80%
7 Dean Foods 1.90%
8 Flowers Industries -1.10%

Looking for Warning Signs within Financial Statements
• Year after year, a company reports restructuring charges and/or write-downs. This practice raises concerns because companies can use write-downs to mask operating expenses that would lead to lower earnings.
• A company’s earnings have been propped up through a series of acquisitions. Acquisitions can increase earnings if the acquiring company has a higher P/E than the acquired firm, but such growth cannot be sustained.
• A company depreciates its assets more slowly than the industry average. Lower depreciation will boost earnings.
• A company has routinely high earnings but low cash flows.
• A company’s insiders are selling stock.
• A/R and inventory are increasing faster than sales revenues.
Uses & Limitations of Ratio Analysis
• Many large firms operate in different divisions in different industries. It is hard to create a meaningful set of industry averages. Ratio analysis is more useful for small, narrowly focused firms.
• Most firms want to be better than average. Target the industry leaders.
• Inflation affects depreciation and inventory and profits. Inflation distorts the balance sheet so look at ratios over time.
• Seasonal factors distort analysis (inventory turnover for a food processor is different before and after the canning season ends)

Uses & Limitations of Ratio Analysis….cont
• Firm’s employ window dressing. Chicago builder borrowed on a 2 year basis on Dec. 27, 2002 and held the proceeds of the loan as cash for a few days and then paid off the loan ahead of time on January 2, 2003. This improved the current and quick ratios. After a week, balance sheet was back.
• Different accounting practices distort analysis. If a firm leases, then assets may appear low relative to sales because leases do not always appear on the balance sheet. But, liability associated with the lease obligation may not be shown as debt. This improves turnover and debt ratios.
• Defining a ratio as “good” or “bad” is not easy. High current ratio could be high liquidity or too much cash.
• Some ratios may look “good” and some may look “bad.”
Web-Based Resources & Important Current Information
– Use the following to collect ratio information
• http://finance.yahoo.com: Updated market information (find the ticker for a security and go to profile for key financials, insider information, etc.)
• http://www.sec.gov and http://www.edgar-online.com: Links to 10K and 10Q information.
• Other sources for up to date information on the market:– http://money.cnn.com– http://cbs.marketwatch.com
• Research stocks using http://www.quicken.com, http://money.netscape.cnn.com/money/, http://www.hoovers.com, and http://www.bloomberg.com
• Two popular sites are http://www.fool.com and http://www.thestreet.com