MASTER THESIS - uis.brage.unit.no
188
Front page for master thesis Faculty of Science and Technology Decision made by the Dean October 30 th 2009 Faculty of Science and Technology MASTER’S THESIS Study program/ Specialization: Offshore Technology/ Marine and Subsea Technology Spring semester, 2015. Open / Restricted access Writer: Gilang Muhammad Gemilang ………………………………………… (Writer’s signature) Faculty supervisor: Dr. Daniel Karunakaran, Ph.D. (University of Stavanger, Subsea 7 Norway) External supervisor(s): Dr. Daniel Karunakaran, Ph.D. Thesis title: Feasibility Study of Selected Riser Concepts in Deep Water and Harsh Environment Credits (ECTS): 30 Key words: SCR, Weight Distributed, Lazy Wave, Extreme response Analysis, Downward Velocity, Deep Water, Harsh Environment Pages: 155 + enclosure: 33 + 1 CD Stavanger, June 11 2015. Date/year
Transcript of MASTER THESIS - uis.brage.unit.no

Front page for master thesis
Faculty of Science and Technology
Decision made by the Dean October 30th
2009
Faculty of Science and Technology
MASTER’S THESIS
Study program/ Specialization:
Offshore Technology/ Marine and Subsea
Technology
Spring semester, 2015.
Open / Restricted access
Writer:
Gilang Muhammad Gemilang
………………………………………… (Writer’s signature)
Faculty supervisor:
Dr. Daniel Karunakaran, Ph.D. (University of Stavanger, Subsea 7 Norway)
External supervisor(s):
Dr. Daniel Karunakaran, Ph.D.
Thesis title:
Feasibility Study of Selected Riser Concepts in Deep Water and Harsh
Environment
Credits (ECTS): 30
Key words: SCR, Weight Distributed, Lazy
Wave, Extreme response Analysis,
Downward Velocity, Deep Water, Harsh
Environment
Pages: 155
+ enclosure: 33
+ 1 CD
Stavanger, June 11 2015.
Date/year

Master Thesis
Feasibility Study of Selected Riser Concepts in Deep water and Harsh Environment
Gilang Muhammad Gemilang i
Abstract
Todays, oil and gas sources are explored in deep water and harsh environment. A riser system is
one of the major sub-facilities to transfer oil and gas from the seabed to the host platform. One of
the well-known riser systems, the Steel Catenary Riser (SCR), has been an attractive choice for
the riser system in deep water. However, the main challenge of the SCR is large motions from
the host platforms due to the harsh environment. The large motion of host platforms may induce
excessive buckling and fatigue at the touchdown point. The key component of the large motion
of the host platform is the downward velocity at the hang-off point where the top-end of the riser
is attached to the host platform.
By screening the downward velocities at the hang-off point in the time history graph, the time at
which the critical responses (i.e. buckling utilization, bending moment and compression) peak is
identified. This study investigates the feasibility of the SCR configuration in terms of the
capability to cope with the vessel motion. Several types of the SCR configurations are proposed
in this study. The selected configurations of SCR in this study are conventional SCR, Weight
Distributed SCR (WDSCR), and Steel Lazy Wave Riser (SLWR). The feasibility of the three
riser configurations was analyzed in terms of strength and fatigue performance to understand the
limitation of one over the other. The strength assessment of the risers was performed by using
load cases, the screening approach was based on different extreme downward velocities at the
hang-off point. The checks were according to DNV.
The fatigue performance of the risers was checked considering both wave-induced fatigue and
fatigue due to vortex induced vibration. Overall, from the extreme response analysis study,
results showed that a feasible conventional SCR configuration can be obtained if the downward
velocity at the hang-off point is restricted below 2.6 m/s. It is also found that the downward
velocity at the sag-bend of the conventional SCR is restricted below 3.03 m/s. On the other hand,
a feasible WDSCR configuration can be obtained, if the downward velocity at the hang-off point
is restricted below 3.2 m/s. It is also found that the downward velocity at the sag-bend of the
WDSCR is restricted below 3.43 m/s.
The heavy cross section of WDSCR reduces the critical responses (i.e. bending moment,
compression and utilization) at the TDP and extends the feasibility of the SCR. The results
showed that the SLWR configuration can cope even with a downward velocity of 6 m/s at the
hang-off point. The “lazy wave” configuration efficiently absorbs the vessel heave motions.
Thereby the SLWR configuration is proven to be the most robust configuration to cope with
large motion of the host platform. This study proves that although the SCR feasibility is limited
due to vessel heave motion, innovative solutions can be established to extend its feasibility in
order to cope with the vessel heave motion in harsh environment.
Keywords: Deep Water, SCR, Weight Distributed, Lazy Wave, Extreme response analysis

Master Thesis
Feasibility Study of Selected Riser Concepts in Deep water and Harsh Environment
Gilang Muhammad Gemilang ii
Acknowledgement
All glory to the most precious and the most merciful, Allah, who has guided my life to this point.
This thesis is one of the requirements to complete my Master of Science degree in Marine and
Subsea Technology, Faculty of Science and Technology, University of Stavanger. I would like to
express my deep gratitude to my supervisor, Dr. Daniel Karunakaran, Ph.D for giving me an
opportunity to write my thesis in Subsea 7 and for all of the comments, guidance, inputs and
patience to evaluate my thesis.
I would also like to express my gratitude to Ove Tobias Gudmestad, Sverre Haver, Airindy
Felisita, Sankar Subramanian, Ahmad Makintha Brany, Iqbal Ruswandi, Tomy Nurwanto and
Adekunle Peter Orimolade for the discussions and essential assistance during the writing process
of this thesis. I also would like to thank my former manager, Bamdad Mehrdad for the hospitality
and guidance that has led me to a broad engineering knowledge, and all my colleagues in PT.
Saipem Indonesia.
I dedicate my thesis for my beloved parent in Pekanbaru, Ir. Irianto Rab and Solvadiana. A
million words cannot express my gratitude and my love for my parents. I also want to thank my
sister, Chairunnisa, and my brother, M. Imam Muttaqien. A special thank is also addressed to my
beloved wife, Herian Stiyani who has assisted me with a never-ending support. Last but not least,
my best wishes go to all of my friends, ‘SSSS 2013’, ‘Mosvangen Friends’, ‘geng masjid
makki’, and ‘geng AGASTA’ for all the memories we had together, it is truly priceless.
Stavanger, 11 June 2015
Gilang Muhammad Gemilang

Master Thesis Feasibility Study of Selected Riser Concepts in Deep Water and Harsh Environment
Gilang Muhammad Gemilang 1
Table of Contents
Abstract………………………………………………………………………………………....i
Acknowledgement……………………………………………………………………………..ii
Table of Contents………………………………………………………………………………1
List of Figures………………………………………………………………………………….7
List of Tables…………………………………………………………………………………10
Abbreviation…………………………………………………………………………….…….12
Chapter 1. Introduction ........................................................................................................ 13
1.1 Background ................................................................................................................ 13
1.2 Scope and Purpose ..................................................................................................... 15
Chapter 2. Deep Water Riser System .................................................................................. 17
2.1 Introduction ............................................................................................................... 17
2.2 Functional Riser System ............................................................................................ 18
2.3 Riser Technology ....................................................................................................... 18
2.3.1 Top Tensioned Risers (TTRs) ............................................................................ 18
2.3.2 Compliant Riser .................................................................................................. 20
2.3.3 Hybrid Riser ....................................................................................................... 21
2.4 Riser Material ............................................................................................................ 23
2.4.1 Flexible Riser ..................................................................................................... 23
2.4.2 Rigid Riser .......................................................................................................... 24
2.5 Riser Component ....................................................................................................... 25
2.5.1 Flex joint ............................................................................................................ 25
2.5.2 Tapered stress joint ............................................................................................. 26
2.5.3 Strakes and Fairings ........................................................................................... 26
2.5.4 Buoyancy Module .............................................................................................. 27
2.5.5 Ballast modules .................................................................................................. 27

Master Thesis Feasibility Study of Selected Riser Concepts in Deep Water and Harsh Environment
Gilang Muhammad Gemilang 2
2.6 Risers Challenges ...................................................................................................... 28
2.6.1 Deep Water Challenges ...................................................................................... 28
2.6.2 Harsh Environment Challenges .......................................................................... 29
2.7 Selected Riser for Thesis Work ................................................................................. 30
2.7.1 Conventional SCR .............................................................................................. 30
2.7.2 Weight Distributed SCR ..................................................................................... 32
2.7.3 Steel Lazy Wave Riser ....................................................................................... 32
Chapter 3. Design Code for Riser ........................................................................................ 34
3.1 Introduction ............................................................................................................... 34
3.2 Design Principle ........................................................................................................ 35
3.3 WSD Code – API RP 2RD ........................................................................................ 36
3.3.1 Allowable Stresses ............................................................................................. 36
3.3.2 Allowable Deflection ......................................................................................... 37
3.3.3 Hydrostatic Collapse .......................................................................................... 37
3.3.4 Overall Column Buckling .................................................................................. 38
3.3.5 Fatigue/Service Life ........................................................................................... 38
3.4 LRFD Code – DNV-OS-F201 ................................................................................... 39
3.4.1 Design Loads ...................................................................................................... 40
3.4.2 Resistances ......................................................................................................... 42
3.4.3 Material Strength ................................................................................................ 44
3.4.4 Ultimate Limit States ......................................................................................... 44
3.4.5 Accidental Limit State ........................................................................................ 49
3.4.6 Serviceability Limit State ................................................................................... 50
3.4.7 Fatigue Limit State ............................................................................................. 51
3.5 Conclusion ................................................................................................................. 52

Master Thesis Feasibility Study of Selected Riser Concepts in Deep Water and Harsh Environment
Gilang Muhammad Gemilang 3
Chapter 4. Theoretical Background ..................................................................................... 53
4.1 Introduction ............................................................................................................... 53
4.2 Waves ........................................................................................................................ 53
4.2.1 Wave Parameters ................................................................................................ 53
4.2.2 Regular Wave ..................................................................................................... 54
4.2.3 Irregular Wave .................................................................................................... 54
4.2.4 Wave Energy Spectrum ...................................................................................... 55
4.3 Currents ..................................................................................................................... 60
4.4 Floater Responses ...................................................................................................... 61
4.5 Hydrodynamic Effects on Slender Cylinder .............................................................. 63
4.6 Soil-Riser Interaction ................................................................................................. 66
Chapter 5. Design Basis ....................................................................................................... 67
5.1 Introduction ............................................................................................................... 67
5.2 Global Analysis ......................................................................................................... 67
5.2.1 Static Analysis .................................................................................................... 68
5.2.2 Dynamic Analysis .............................................................................................. 69
5.3 Environmental Data ................................................................................................... 72
5.3.1 Water Depth ....................................................................................................... 72
5.3.2 Waves ................................................................................................................. 72
5.3.3 Current ................................................................................................................ 73
5.3.4 Hydrodynamic Coefficient and Marine Growth ................................................ 74
5.3.5 Soil-riser Interaction ........................................................................................... 74
5.4 Vessel Motion Characteristic..................................................................................... 75
5.4.1 Coupled and De-coupled analysis ...................................................................... 75
5.4.2 Host Platform Selection ..................................................................................... 75
5.4.3 Wave Frequency (WF) Floater Motion .............................................................. 77

Master Thesis Feasibility Study of Selected Riser Concepts in Deep Water and Harsh Environment
Gilang Muhammad Gemilang 4
5.4.4 Low Frequency (LF) Floater Motion ................................................................. 77
5.5 Riser Data .................................................................................................................. 78
5.5.1 Riser Wall thickness ........................................................................................... 78
5.5.2 External Coating ................................................................................................. 79
5.5.3 Buoyancy Modules ............................................................................................. 79
5.5.4 Upper End Termination ...................................................................................... 80
5.5.5 Riser Properties .................................................................................................. 80
5.5.6 Riser Configuration ............................................................................................ 80
5.6 Analysis Concept ....................................................................................................... 83
5.6.1 Design Cases ...................................................................................................... 83
5.6.2 LRFD calculation ............................................................................................... 84
5.6.3 Extreme Response Methodology ....................................................................... 85
5.6.4 Analysis Procedure ............................................................................................. 86
5.6.5 Acceptance Criteria ............................................................................................ 87
Chapter 6. Extreme Response Analysis ............................................................................... 89
6.1 Introduction ............................................................................................................... 89
6.2 Selection of seed components .................................................................................... 89
6.3 Static Analysis ........................................................................................................... 90
6.3.1 Static Analysis of Conventional SCR ................................................................ 90
6.3.2 Static Analysis of WDSCR ................................................................................ 94
6.3.3 Static Analysis of SLWR ................................................................................... 97
6.3.4 Comparison - Static Results ............................................................................. 100
6.4 Dynamic Analysis.................................................................................................... 101
6.4.1 Dynamic Analysis of Conventional SCR ......................................................... 101
6.4.2 Dynamic Analysis of WDSCR ......................................................................... 107

Master Thesis Feasibility Study of Selected Riser Concepts in Deep Water and Harsh Environment
Gilang Muhammad Gemilang 5
6.4.3 Dynamic Analysis of SLWR ............................................................................ 113
6.5 Summary .................................................................................................................. 117
6.6 SLWR for Northern North Sea Condition ............................................................... 119
6.6.1 Introduction ...................................................................................................... 119
6.6.2 Environmental Data .......................................................................................... 120
6.6.3 Results and Discussion ..................................................................................... 120
6.6.4 Comparison of Critical Sections ...................................................................... 122
Chapter 7. Fatigue Analysis ............................................................................................... 124
7.1 Introduction ............................................................................................................. 124
7.2 Wave Induced Fatigue ............................................................................................. 125
7.2.1 Design Data ...................................................................................................... 125
7.2.2 Assumptions ..................................................................................................... 129
7.2.3 Fatigue analysis Procedure ............................................................................... 129
7.2.4 Fatigue Analysis Results .................................................................................. 130
7.2.5 Discussion of Wave Induced Fatigue Performance ......................................... 133
7.3 Vortex Induced Vibration (VIV) ............................................................................. 134
7.3.1 Fatigue Analysis Procedure .............................................................................. 134
7.3.2 Fatigue Analysis Results .................................................................................. 135
7.3.3 Discussion of Fatigue Analysis due to VIV ..................................................... 136
Chapter 8. Riser Fabrication and Installation .................................................................... 138
8.1 Introduction ............................................................................................................. 138
8.2 Fabrication ............................................................................................................... 138
8.3 Installation ............................................................................................................... 140
8.3.1 Pipe-lay Methods .............................................................................................. 141
8.3.2 Riser Hook-up .................................................................................................. 144

Master Thesis Feasibility Study of Selected Riser Concepts in Deep Water and Harsh Environment
Gilang Muhammad Gemilang 6
8.3.3 Installation of Modules ..................................................................................... 144
Chapter 9. Conclusion and Recommendation .................................................................... 146
9.1 Conclusion ............................................................................................................... 146
9.2 Recommendation ..................................................................................................... 148
References…………………………………………………………………………………...149
Appendix A - Wall Thickness Calculation ............................................................................ 153
Appendix B - Sensitivity Analysis Results ............................................................................ 154
Appendix C - Description of Software Used ......................................................................... 161
Appendix D - Fatigue Results ................................................................................................ 182

Master Thesis Feasibility Study of Selected Riser Concepts in Deep Water and Harsh Environment
Gilang Muhammad Gemilang 7
List of Figures
Figure 1-1 Deep water Development (Ogj, 2010) .................................................................... 13
Figure 2-1 Essential Functional Elements of a Riser System (API, 2006) .............................. 17
Figure 2-2 Top Tensioned Risers (TTRs) used on Spar and TLP (Bai and Bai, 2010b) ......... 19
Figure 2-3 SCR Standard Compliant Riser Configurations (API, 2006) ................................. 20
Figure 2-4 Global Arrangement of Free Standing Hybrid Riser (FSHR) (Burgess and Lim,
2006) ......................................................................................................................................... 22
Figure 2-5 COBRA Riser Configurations (Karunakaran and Baarholm, 2013) ...................... 22
Figure 2-6 Flexible Riser Layers (API, 2006) .......................................................................... 23
Figure 2-7 Flex Joint (DNV, 2010a) ........................................................................................ 25
Figure 2-8 Tapered Joint (API, 2006) ...................................................................................... 26
Figure 2-9 Strakes and Fairings (API, 2006) (Vivsolutions, 2015) ......................................... 26
Figure 2-10 Buoyancy Modules (Balmoral, 2014) .................................................................. 27
Figure 2-11 Typical Ballast Module (Balmoral, 2014) ............................................................ 27
Figure 2-12 Rigid SCR Hanging-Free Configuration (API, 2006) .......................................... 31
Figure 2-13 Weight Distributed SCR (Karunakaran and Legras, 2013) .................................. 32
Figure 2-14 Typical SLWR Configuration in Conjunction with FPSO (Chen and Cao, 2013)
.................................................................................................................................................. 33
Figure 3-1 Safety Hierarchy (DNV, 2010a) ............................................................................. 35
Figure 3-2 Propagation Buckling on the Pipe (Tawekal, 2010) ............................................... 38
Figure 3-3 De-rating value (DNV, 2010a) ............................................................................... 44
Figure 4-1 Wave Characteristic (Dean and Dalrymple, 1984)................................................. 54
Figure 4-2 Superposition of Sinusoidal wave components (Journée and Massie, 2001) ......... 55
Figure 4-3 Divided period of wave into some intervals (Journée and Massie, 2001) .............. 56
Figure 4-4 Spectral Wave Density (Journee and Massie, 2001) .............................................. 57
Figure 4-5 Wave Record Analysis (Journée and Massie, 2001) .............................................. 58
Figure 4-6 Six Degree of Freedom of the vessel (Calqlata, 2015) ........................................... 61
Figure 4-7 Schematic System of Motions and Waves (Journee and Massie, 2001) ................ 62
Figure 4-8 Principle of Transfer of Waves into Vessel Response (Journée and Massie, 2001)
.................................................................................................................................................. 63
Figure 4-9 Definition of normal force, tangential force and lift force (DNV, 2010b) ............. 64
Figure 5-1 Effective weight and effective tension (Baltrop, 1998) .......................................... 69
Figure 5-2 Line Model in ORCAFLEX (Orcina, 2010) ........................................................... 70

Master Thesis Feasibility Study of Selected Riser Concepts in Deep Water and Harsh Environment
Gilang Muhammad Gemilang 8
Figure 5-3 Floating Production System (DNV, 2010a) ........................................................... 76
Figure 5-4 Floater Motion Comparison ................................................................................... 77
Figure 5-5 Riser Configuration ................................................................................................ 81
Figure 5-6 Riser Orientation .................................................................................................... 81
Figure 5-7 SLWR Geomerty .................................................................................................... 82
Figure 5-8 Work Diagram ........................................................................................................ 84
Figure 6-1 SCR Intact-Static Configuration for near, mean and far position .......................... 91
Figure 6-2 Static Effective Tension of SCR with Coating ....................................................... 92
Figure 6-3 Static Bending Moment of SCR with Coating ....................................................... 92
Figure 6-4 Static Utilization of SCR with Coating .................................................................. 93
Figure 6-5 Intact-Static WDSCR Configuration near, mean and far position ......................... 95
Figure 6-6 Effective Tension Comparison ............................................................................... 96
Figure 6-7 Static Configuration - Conventional SCR and WDSCR ........................................ 96
Figure 6-8 Static Bending Moment - Conventional SCR and WDSCR .................................. 97
Figure 6-9 Intact-Static SLWR configuration near, mean and far position ............................. 98
Figure 6-10 Comparison of Effective Tension – Mean Position – Static .............................. 100
Figure 6-11 Comparison of Bending Moment – Mean Position- Static ................................ 100
Figure 6-12 Time History: Effective Tension and Bending Moment -SCR-Coating-LC5-
Near-ULS Design ................................................................................................................... 104
Figure 6-13 Time History: Bending Moment and Effective Tension - SCR-No Coating-LC6-
Near-ULS ............................................................................................................................... 105
Figure 6-14 Minimum Dynamic Effective Tension SCR-LC5 .............................................. 106
Figure 6-15 Maximum Dynamic Utilization of SCR and WDSCR with Coating ................. 108
Figure 6-16 Maximum Dynamic Bending Moment Comparison of SCR and WDSCR with
Coating ................................................................................................................................... 109
Figure 6-17 Maximum Downward Velocity Range for WDSCR and Conventional SCR –
Load Case 5 ............................................................................................................................ 109
Figure 6-18 Vertical Velocity VS Bending Moment, WDSCR, LC8, coating ...................... 112
Figure 6-19 Vertical Velocity VS Bending Moment, WDSCR, LC8, No Coating ............... 112
Figure 6-20 Vertical Velocity VS Effective Tension, WDSCR, LC8, Coating ..................... 113
Figure 6-21 Vertical Velocity VS Effective Tension, WDSCR, LC8, No Coating ............... 113
Figure 6-22 Maximum Dynamic Utilization of WDSCR and SLWR with Coating ............. 115
Figure 6-23 Maximum Downward Velocity Range for SLWR and WDSCR – Load Case 8 116
Figure 6-24 Utilization VS Max. Downward Velocity at the Hang-off Point ....................... 118

Master Thesis Feasibility Study of Selected Riser Concepts in Deep Water and Harsh Environment
Gilang Muhammad Gemilang 9
Figure 6-25 Utilization VS Max. Downward Velocity at Point B ......................................... 119
Figure 6-26 Variation of Top Angle in Time History ............................................................ 121
Figure 6-27 Maximum Effective Tension over entire riser length, far and near offset-ULS 122
Figure 6-28 Maximum Bending Moment over entire riser length, far and near offset-ULS . 123
Figure 6-29 Maximum Utilization over entire riser length, far and near offset-ULS ............ 123
Figure 7-1 S-N curves in seawater with cathodic protection (DNV, 2010c) ......................... 126
Figure 7-2 Stress cycling where further fatigue assessment can be omitted (DNV, 2010c) .. 126
Figure 7-3 Subdivision of the sea-state scatter diagram into representative blocks .............. 128
Figure 7-4 Total Fatigue Damage of SCR ............................................................................. 131
Figure 7-5 Total Fatigue Damage of WDSCR ....................................................................... 132
Figure 7-6 Total Fatigue Damage of SLWR .......................................................................... 133
Figure 7-7 Total Fatigue Damage due to VIV over Entire Riser Length ............................... 136
Figure 7-8 Vortex Shedding ................................................................................................... 136
Figure 8-1 Mechanized PGTAW Equipment in Operation and Weld Cap Macro Section
(Karunakaran et al., 2013) ...................................................................................................... 139
Figure 8-2 Mechanized PGMAW in operation and typical girth weld showing CMT weld
roots (Karunakaran et al., 2013) ............................................................................................. 140
Figure 8-3 The Seven Oceans and Seven Borealis Pipe-lay Vessel, Figure from Subsea 7 .. 141
Figure 8-4 Sketch of S-Lay Method ....................................................................................... 141
Figure 8-5 Sketch of J-lay Method (Chacko et al., 2005) ...................................................... 142
Figure 8-6 Spool Base Vigra of Subsea 7, Figure from Subsea 7 .......................................... 143
Figure 8-7 Typical RIT and Flexjoint (Maneschy, 2014) ...................................................... 144
Figure 8-8 the Installation of buoyancy Module onto the Riser (Beattie et al., 2013) ........... 145

Master Thesis Feasibility Study of Selected Riser Concepts in Deep Water and Harsh Environment
Gilang Muhammad Gemilang 10
List of Tables Table 3-1 Classification of Safety Class (DNV, 2010a) .......................................................... 36
Table 3-2 Design Matrix for Rigid Risers (API, 2006) ............................................................ 37
Table 3-3 Examples of Categorization of loads1)
(DNV, 2010a) ............................................. 41
Table 3-4 Load Effect Factor (DNV, 2010a) ........................................................................... 42
Table 3-5 Safety Class Resistance Factor ................................................................................ 43
Table 3-6 Material Resistance Factor ....................................................................................... 43
Table 3-7 Simplified Design Check for Accidental Limit States ............................................. 43
Table 3-8 Material strength factor (DNV, 2010a) .................................................................... 44
Table 3-9 Fabrication Factor (DNV, 2010a) ............................................................................ 47
Table 3-10 Design Fatigue Factor ............................................................................................ 51
Table 5-1 Wave Data ................................................................................................................ 73
Table 5-2 Current Profile ......................................................................................................... 73
Table 5-3 Hydrodynamic Coefficient ...................................................................................... 74
Table 5-4 Soil Parameters ........................................................................................................ 74
Table 5-5 Minimum Wall Thickness ....................................................................................... 79
Table 5-6 Buoyancy Module Properties ................................................................................... 79
Table 5-7 Riser Properties ........................................................................................................ 80
Table 5-8 SLWR Parameters .................................................................................................... 82
Table 5-9 Environmental Load Case Matrix ............................................................................ 83
Table 5-10 Design Case Matrix for Each Environmental Load Case ...................................... 84
Table 5-11 Partial Safety Factor for ULS and ALS ................................................................. 85
Table 6-1 Load Cases with Corresponding Seed Component .................................................. 89
Table 6-2 SCR Static Results- Functional Loads ..................................................................... 91
Table 6-3 WDSCR Static Results- Functional Loads .............................................................. 95
Table 6-4 Selected Parameters for SLWR configuration ......................................................... 98
Table 6-5 SLWR Static Results- Functional Loads ................................................................. 99
Table 6-6 SCR-Strength Response Summary for Load Case 3 ............................................. 102
Table 6-7 SCR-Strength Response Summary for Load Case 4 ............................................. 102
Table 6-8 SCR-Strength Response Summary for Load Case 5 ............................................. 103
Table 6-9 SCR without Coating-Strength Response Summary for Load Case 6 ................... 105
Table 6-10 WDSCR-Strength Response Summary for Load Case 5 ..................................... 107
Table 6-11 WDSCR-Strength Response Summary for Load Case 6 ..................................... 110

Master Thesis Feasibility Study of Selected Riser Concepts in Deep Water and Harsh Environment
Gilang Muhammad Gemilang 11
Table 6-12 WDSCR-Strength Response Summary for Load Case 7 ..................................... 110
Table 6-13 WDSCR-Strength Response Summary for Load Case 8 ..................................... 111
Table 6-14 Summary result of SLWR against LC8 ............................................................... 114
Table 6-15 SLWR- Dynamic analysis Summary ................................................................... 116
Table 6-16 Summary of Downward Velocity Threshold ....................................................... 118
Table 6-17 Strength Analysis Summary ................................................................................ 120
Table 7-1 Fatigue limit (DNV, 2010c) ................................................................................... 127
Table 7-2 Representative sea-state and lumped probability of occurrence ........................... 128
Table 7-3 Directional Probabilities ........................................................................................ 129
Table 7-4 Fatigue Life Summary of SCR .............................................................................. 130
Table 7-5 Fatigue Life Summary of WDSCR ........................................................................ 131
Table 7-6 Fatigue Life Summary of SLWR ........................................................................... 132
Table 7-7 Lumped Probability of Occurrence ........................................................................ 135
Table 7-8 Minimum VIV Fatigue Life ................................................................................... 135
Table 8-1 Prerequisite for Fabrication of SCR Weld (Karunakaran et al., 2013) .................. 139

Master Thesis Feasibility Study of Selected Riser Concepts in Deep Water and Harsh Environment
Gilang Muhammad Gemilang 12
Abbreviation
ALS Accidental Limit State
API American Petroleum Institute
ASME American Society of Mechanical Engineers
COBRA Catenary Offset Buoyant Riser Assembly
DFF Design Fatigue Factor
DNV Det Norske Veritas
DOF Degree of Freedom
DSAW Double Submerged Arc Welded
ERW Electric Resistance Welded
FE Finite Element
FLS Fatigue Limit State
FPS Floating Production System
FPSO Floating Production Storage and Offloading
FSHR Free Standing Hybrid
GOM Gulf of Mexico
HRT Hybrid Riser Tower
JONSWAP Joint Operation North Sea Wave Project
LC Load Case
LF Low Frequency
LRFD Load and Resistance Factor Design
PET Pipeline Engineering Tool
RAO Response Amplitude Operator
RIT Riser Installation Tool
SCF Stress Concentration Factor
SCR Steel Catenary Riser
SLOR Single Line Offset Riser
SLS Serviceability Limit State
SLWR Steel Lazy Wave Riser
SMYS Specified Minimum Yield Stress
SS Semi-submersible
TDA Touchdown Area
TDP Touchdown Point
TLP Tension Leg Platform
TRB Three Roll Bending
TTR Top Tension Riser
ULS Ultimate Limit State
UOE Pipe fabrication process for welded pipes
VIV Vortex Induced Vibration
WF Wave Frequency
WSD Working Stress Design
WDSCR Weight Distributed Steel Catenary Riser

Master Thesis Feasibility Study of Selected Riser Concepts in Deep Water and Harsh Environment
Gilang Muhammad Gemilang 13
Chapter 1. Introduction
1.1 Background
The Oil and Gas industry has become one of the largest energy sources in the world. The
demand for energy continues to increase along with the growth of industries and the
population. The International Energy Agency (IEA) in 2004 estimated that the increase in the
energy consumption will continue to grow with an average increase of up to 1.6% each year.
Due to the increase in energy consumption, governments need to encourage the industry to do
more exploration of oil and gas sector.
Today, oil and gas resources on land are limited and dwindling. Therefore, the exploration
starts to move to offshore. Oil and gas exploration for offshore is different and more difficult
than exploration on land. The main reason is the sea behavior which gives numerous
challenges to the oil and gas exploration. In the recent decades, a lot of oil companies started
to extend their exploration in the deep sea areas.
Thus, the offshore technologies to explore oil and gas resources in deep water are pursued. As
the subsea technology was introduced, exploration and production activities have increased
dramatically in deep water. Oil and gas exploration areas such as Santo Basin, Gulf of
Mexico, West Africa, and the Norwegian Continental Shelf (NCS) are continually moving
into deeper water depths by applying the subsea technology. Figure 1-1 shows the
development of hydrocarbon exploration which continues to move to greater water depth over
the years.
Figure 1-1 Deep water Development (Ogj, 2010)
These water depths vary from 500 to 2400 meters. Each exploration area has its own water
depth and its own environmental characteristics which lead to different challenges. Deep
water and harsh environment are the most challenging combination of exploration facility.
Many developments have been established to tackle these problems that are associated with
deep water and harsh environment.
Master Thesis Feasibility Study of Selected Riser Concepts in Deep Water and Harsh Environment
Gilang Muhammad Gemilang 14
In shallow water, the application of fixed offshore structures is still considered effective and
economical, since fixed offshore structures are the most conservative type in the exploration
activity. In deep water, the application of fixed offshore structures is no longer economical.
This condition encourages industry to establish a new method to accommodate deep water
exploration.
The riser system which transports the production fluids from the seabed to the host platform is
one of the important facilities in deep water field development. The Floating Production
System (FPS) is a proven technology that is developed as a host platform located at the water
surface. There are many types of floating production such as Semi-submersible (SS), Floating
Production, Storage and Offloading (FPSO), SPAR floater, Floating Production Unit (FPU),
Tension Leg Platform (TLP) and their derivatives.
Each floating production system responds dynamically to environmental conditions. The riser
concepts in harsh environment experience a great challenge due to large motions of the
floating production system. A robust, safe and economical riser concept should be designed to
cope with the large motion of the floating production system in deep water and harsh
environment. There are many types of riser configuration that have been installed in oil and
gas exploration; Steel Catenary Risers (SCR), flexible riser, and hybrid riser.
The selection of riser configuration in deep water depends on unique performance, risk, cost
and applicability of each riser concept (Petruzka et al., 2002). The steel catenary riser (SCR)
has emerged to be one of attractive choices for recent deep water environments (Phifer et al.,
1994). The steel catenary riser consists of simple rigid steel pipe hanging freely from the
floating production system to the seabed. The SCR can be used with a large diameter and
adequate wall thickness which is able to withstand higher hydrostatic pressure and higher
temperature in deep water. The capability to provide large diameters may also allow higher
rates of production stream, thus contributing to better use of riser (Hatton and Howells, 1997).
The material of simple rigid riser can be fabricated cheaply, thereby reducing production costs
of field development. The SCR configuration forms catenary due to its own weight. The SCR
also offers benefit over the top tensioned riser because the SCR requires no heave
compensation at the hang-off point (Phifer et al., 1994). On the seabed, the SCR needs no
special bottom connection. The problems that might occur in the SCR application include
sensitivity to environmental loads and heave motions of the floating production system.
The wave frequency of floater motion might cause excessive bending stress at the touchdown
point (TDP), while low frequency of floater motion might cause large offset of the floater,
thereby it causes large changes in the curvature of the SCR and changes in the TDP position.
For near offset position of the vessel, there may be an induced excessive bending moment at
the TDP, while for far offset position, there may be induced high tension at the hang-off
point. Moreover, the touchdown point (TDP) and the top region area are subjected to the
fatigue (Karunakaran and Baarholm, 2013). Therefore, the strength and fatigue performance
of steel catenary riser is still limited. To tackle these challenges, improvement of the SCR
configurations have been proposed, and developed such as weight distributed SCR and steel
lazy wave riser (SLWR).

Master Thesis Feasibility Study of Selected Riser Concepts in Deep Water and Harsh Environment
Gilang Muhammad Gemilang 15
The flexible risers have good proficiency to accommodate the high curvature and dynamic
motions of the floaters resulted from environmental load (Burgess and Lim, 2006). The
flexible risers have been a successful solution for shallow water to the mid water depth riser.
In addition, the flexible riser is, in practice, easy to install. However, when it comes to deep
water, the flexible riser presents a limitation of practical and economic reasons. In deep water,
the cost of flexible pipe is significantly high with increasing depth and it has technical
limitations to the maximum diameter, operating pressure and temperature (Hatton and
Howells, 1996). Furthermore, the availability of flexible riser is limited to a minimum number
of competent vendors.
Another type of riser configuration is hybrid riser. The hybrid riser is the combination of
flexible jumper, vertical bundle of rigid riser and sub-surface buoyancy module attached in
between (Masturi, 2014). The sub-surface buoyancy module is attached at the top of vertical
bundle of rigid riser in deeper water depth away from wave region so as to minimize the
hydrodynamic loadings from the sea surface. The flexible jumpers connecting the top end of
the riser and the floater are utilized to make the riser system uncoupled to the floater motion.
Thus, the hybrid riser is categorized as uncoupled riser. The uncoupled riser is very effective
to de-couple large motions of the floater and hence the riser becomes insensitive to fatigue
damage (Karunakaran and Baarholm, 2013). Nevertheless, the hybrid riser is an expensive
solution since it consists of a number of complex components. The hybrid riser is also hard to
install since it has a complex bottom assembly and connection.
1.2 Scope and Purpose
Design of Steel Catenary Risers (SCR) has seen increasing challenges in deep water
applications due to large motion of the host platform (Yue et al., 2011). The motions of hang-
off point, where the riser is attached at the host platform, result from combination of weather
conditions. The global strength design of the SCR is measured by dynamic response in the
touchdown area, which is mainly driven by the vessel motions (Chen et al., 2009). This thesis
focuses mainly on the assessment of the SCR configuration for evaluation in terms of
capability to cope with the vessel motion.
The purpose of this study is to investigate the feasibility of the SCR configuration in terms of
the capability to cope with the vessel motion. The riser design will be analyzed quantitatively
with respect to the strength and the fatigue performances. Several types of SCR
configurations are proposed in this study. Each configuration has characteristics which make
it better suited for particular applications. The selected configurations of SCR in this study are
conventional SCR, Weight Distributed SCR (WDSCR), and Steel Lazy Wave Riser (SLWR).
It is typically challenging to achieve feasibility for a conventional SCR application in
conjunction with the Semi-submersible in harsh environment. Thus, the WDSCR and SLWR
are proposed to overcome the limitation of the conventional SCR. The three riser
configurations will be discussed and analyzed to see the limitation of one over the other based
on the capability to cope with the vessel motion. The vertical velocity at the hang-off point is
the main design driver for buckling at the TDP (Karunakaran et al., 2013).

Master Thesis Feasibility Study of Selected Riser Concepts in Deep Water and Harsh Environment
Gilang Muhammad Gemilang 16
The downward velocity at the hang-off point dominates the riser‟s critical responses
(stress/buckling) at the TDP very well (Chen et al., 2009). The downward velocity at the
hang-off point is therefore considered in order to capture the limitation of riser integrity in
this study. The heave motion of the vessel is the main driver of the downward velocity at the
hang-off point since it directly correlates to the vertical motion at the hang-off point. In
addition, pitch and roll motion of the vessel can also contribute to downward velocity if the
hang-off point position is not located at the vessel center of gravity (COG). The concern is
also on the velocity of the riser in the touchdown area since a feasible configuration can be
addressed by controlling the dynamic stresses at the TDP.
The study involves a rigorous evaluation to verify both strength and fatigue performance. The
strength analyses of all three riser configurations are performed by using comprehensive non-
linear time domain analysis. The wave induced fatigue analyses are performed by using a
comprehensive irregular wave time domain analysis procedure. The ORCAFLEX software is
mainly applied in this study to carry out simulations. In addition, RIFLEX and VIVANA
software are also applied for VIV fatigue analysis. A brief description of relevant guidelines
for the design of such riser systems will also be discussed.
The scope of thesis is as follows:
Chapter 2 presents a general description of deep water riser systems. Development of
riser system is discussed with the main focus on selected riser configuration.
Chapter 3 discusses the code check and standard for riser system design.
Chapter 4 provides the relevant theoretical background for this study.
Chapter 5 provides basis design of this study. This chapter includes analysis
methodology, design data, and the design acceptance criteria.
Chapter 6 provides extreme response analysis for riser configuration in order to verify
the requirement from ultimate limit state and accidental limit state.
Chapter 7 provides fatigue analyses check for selected riser configuration in order to
verify the requirement from the fatigue limit state.
Chapter 8 provides a general description of fabrication and installation for riser.
Chapter 9 provides the conclusions and recommendations from the study.

Master Thesis Feasibility Study of Selected Riser Concepts in Deep Water and Harsh Environment
Gilang Muhammad Gemilang 17
Chapter 2. Deep Water Riser System
2.1 Introduction
Riser systems are the main conduit to transfer fluid between the subsea equipment to the host
platforms during the drilling, injection, completion, production and exporting phases. Based
on API-RP-2RD, risers may perform the following specific functions (API, 2006):
Transport fluids between the subsea wells and the floater (i.e. production, injection,
circulated fluids).
Import, export, or circulate fluids between the floater and remote equipment or
pipeline systems.
Guide, monitor and control tubular of intervention or drilling tools into the wells.
Support auxiliary lines (i.e. flow line, umbilical).
Incorporate with mooring system for station keeping.
Application of riser system has been extensively used for oil and gas exploration. The
application of riser depends on the water depth and environmental condition. The riser system
should be configured as optimum as possible to satisfy its functional requirement. The
environmental condition depends on the location of exploration. The Gulf of Mexico,
Indonesia and West of Africa are still categorized as mild to moderate. When it comes to
North Sea Continental (NCS), or Barent Sea, the environmental condition starts to move to
harsh environment and promises more challenges to the riser system.
Figure 2-1 Essential Functional Elements of a Riser System (API, 2006)
Riser system consists of essential functional elements, i.e. system integrity, conduit, top
interface and bottom interface as shown in Figure 2-1 (API, 2006). From Figure 2-1, it is
shown that riser system is the interface between a static structure of the seabed and the
dynamic structure of the host platform on the sea surface. From this reason, risers are
commonly referred to as dynamic risers (Lien, 2010). Thereby riser should be able to
accommodate the dynamic motion from the floater to the relatively static seabed.

Master Thesis Feasibility Study of Selected Riser Concepts in Deep Water and Harsh Environment
Gilang Muhammad Gemilang 18
2.2 Functional Riser System
A host platform needs a conduit to connect with the subsea equipment on the seabed. The
riser systems, as the key element for that purpose, provide various functions which call for
different type of riser design. Generally, based on the function, risers are divided into 4
functions as follows.
• Drilling riser
This type of riser applies the concept of Top Tension Risers (TTRs) which is supported by top
tension force on FPS in order to maintain vertical motion of riser from a floater to the seabed.
The surge motions of floater will act as a prescribed dynamic boundary condition in the riser
configuration, while heave relative to vertical motions of the upper riser end is subjected to
active control by top tension force. This type of riser is commonly used when drilling mud to
and from well or major intervention/work over of the subsea well. This is also employed to
serve as a running and retrieving string for the BOP and guide tools/auxiliary lines (DNV,
2010a).
• Production riser
This type of riser is used for transporting the hydrocarbon fluid between a subsea well and a
floater. Mainly, the concept of this riser is according to compliant riser which is configured
such that it could absorb floater motion without a heave compensation system.
• Injection riser
This type of riser is used for injecting or circulating some fluids into the subsea well to
enhance production or to serve the maintenance (API, 2006).
• Export/import riser
This type of riser is used for transporting processed oil or gas between the platform and
pipeline system or tanker (API, 2006).
2.3 Riser Technology
The dynamic behavior of floater is the main challenge for riser system design. The global
riser should able cope with the floater motion so that the riser is able to work as per
requirement. The suspended sections of riser will absorb this dynamic motion of the floater.
Based on the ability of riser to cope with floater motion, riser system is divided into 3 types as
follows.
2.3.1 Top Tensioned Risers (TTRs)
The Top Tensioned Risers (TTRs) concept is a vertical riser supported by a tensioner located
at the floater. The tensioner pulls upward risers on the top part of the riser in order to limit
bending and maintain the constant effective tension with an adequate stroke capacity (DNV,
2010a). The top boundary allows the riser and floater to move vertically relative to each other
(Bai and Bai, 2010b). The tensioner must maintain a constant target value of tension to
prevent excessive bending on the bottom of the riser. Such risers consist of slender metal pipe

Master Thesis Feasibility Study of Selected Riser Concepts in Deep Water and Harsh Environment
Gilang Muhammad Gemilang 19
cross sections which may be thought of as a continuance of the wellbore to the sea surface
(API, 2006). The typical TTRs figure can be seen from Figure 2-2.
Figure 2-2 Top Tensioned Risers (TTRs) used on Spar and TLP (Bai and Bai, 2010b)
The vertical riser is constrained to follow the horizontal motion of the floater. The relative
vertical motion between riser and floater motion is generally denoted stroke (DNV, 2010a).
The top tension and stroke capacity are important design parameters governing the behavior
of vertical riser. A tapered joint, ball-joint or flex-joint is applied to reduce the bending stress
at the termination to the seabed (DNV, 2010a). Generally, the TTRs are used for drilling.
Nevertheless, the TTRs can also be used for production, injection and export riser. For deep
water application, the riser top tension requirements become significant to support riser
weight and avoid bottom compression.
Moreover, harsh environments will cause significant motion of the floater and TTRs.
Therefore, at a field with condition of deep water and harsh environment, TTRs becomes
technically neither feasible nor economical. The top tensioned risers are applicable for floater
with relatively small heave motion, e.g. TLP, Spar, Deep Draft Floater (DDF). Those floaters
have a relatively small requirement for stroke capacity with relatively small offsets (Bai and
Bai, 2010b).
For other floaters like FPSOs and Semi-Submersibles (SS), the demand for stroke capacity
will be much higher for the TTRs, which means that other riser solutions like steel catenary
risers (SCRs) or flexible risers are more preferable. For TLP, the top boundary condition is
equipped with a heave compensation system to allow vertical motion of the riser. For Spar
platforms, the top boundary condition is maintained by buoyancy modules attached along the
upper part of the riser inside the moon pool (DNV, 2010a).

Master Thesis Feasibility Study of Selected Riser Concepts in Deep Water and Harsh Environment
Gilang Muhammad Gemilang 20
2.3.2 Compliant Riser
Compliant riser provides flexibility to tolerate floater motion. The name “compliant” comes
from the type of riser configuration system with the flexibility to move horizontally.
Compliant risers have configuration such that it may absorb floater motions by the change of
its geometry without the use of heave compensation systems (DNV, 2010a). This flexibility
provides dynamic resistance, allowing riser to operate in deep water and harsh environment.
The material of compliant riser is normally either flexible pipe or rigid pipe. The compliant
riser with rigid pipe is commonly addressed as SCR. Thus, the SCR and flexible pipe can be
installed with various compliant configurations depend on a number of key factors, e.g. global
behavior, structural integrity, materials, costs, environment, host platform motion, field layout
and water depth. Some examples of compliant configuration of riser are Steep S, Lazy S,
Steep Wave, Lazy Wave, Steep S, or Free Hanging as shown in Figure 2-3.
Figure 2-3 SCR Standard Compliant Riser Configurations (API, 2006)
The selection of riser configuration is according to the production requirement and
environmental conditions. With such compliant configuration, the riser can cope with larger
static and dynamic excursions of the floater compared to the top tensioned risers. The vessel
motion characteristics will dedicate the dynamic tension and bending moment variation along
the entire riser length in any situations. The connection between the riser and the floater is an
essential design issue for compliant riser configurations. Thereby, tapered joint, flex joint and
other components are installed in the hang-off area to limit bending curvature and pipe
stresses at riser connection (DNV, 2010a).
Free hanging catenary is the simplest configuration of compliant riser and is cost effective for
deep water development, particularly under high pressure and high temperature. It is simple,
since the requirement for subsea infrastructure is minimum and easy to install. On the
contrary, a free hanging catenary configuration is subjected to high bending moment and

Master Thesis Feasibility Study of Selected Riser Concepts in Deep Water and Harsh Environment
Gilang Muhammad Gemilang 21
buckling due to either wave frequency or low frequency of vessel motions especially at the
hang-off point and touchdown point.
Due to high vessel motions, the compression at the riser touchdown point are susceptible to
failure. Moreover, SCRs are exposed to large fatigue loads in the touchdown point area, and
hang-off area (Bell et al., 2005). In order to overcome such limitations, many compliant
configurations have been developed and established as shown in Figure 2-3. In this thesis, the
free hanging riser (conventional SCR) is selected as preliminary riser configuration.
Afterwards, the SCR configuration will be modified to weight distributed SCR and steel lazy
wave riser (SLWR) to improve its performance in terms of strength and fatigue design.
2.3.3 Hybrid Riser
The hybrid riser adopts both concepts of top tensioned risers (TTRs) and compliant (flexible)
riser by applying a vertical pipe tensioned by subsurface buoyancy can and flexible riser
(jumper). There are many types of hybrid riser; Free Standing Hybrid Riser (FSHR), hybrid
riser tower, grouped Single Line Offset Riser (SLOR). The top of the vertical riser is
positioned at a distance below the water surface with some offset to the floater such that a
horizontal length of flexible jumper can be fitted to accommodate large motion from the
floater. The flexibility is then provided by the horizontal length of jumper, which has high
curvature capability (Hatton and Howells, 1996).
As the jumper is flexible pipe, this configuration allows the floater motion to be absorbed by
the jumpers and subsurface buoyancy can, thereby it reduces the dynamic motions over the
rest of the riser (Bell et al., 2005). The floater motions are effectively absorbed by the flexible
jumper, hence the steel pipe becomes less susceptible to fatigue issue. This riser configuration
is characterized as uncoupled risers as it effectively isolates the dynamic motion of the floater
from the vertical riser. With such a configuration, the hybrid riser can therefore be used with a
wide range of floater in deep water or even ultra-deep water application and harsh
environment.
Free Standing Hybrid Riser (FSHR), one of the hybrid risers, has a typical vertical riser
section which is tensioned by buoyancy cans positioned at a distance below the water surface
(Burgess and Lim, 2006). The top end of the riser has offset from the host vessel such that a
suitable length of flexible pipe (jumper) connects the top end of the riser to the vessel. Such
arrangement can accommodate the vessel motions. The Free Standing Hybrid Riser can be
seen in Figure 2-4. However, hybrid riser is an expensive solution due to its complex and
numerous components, e.g. sub-surface buoy can, flex joint, riser bundle, bottom connection
assembly, etc. Moreover, hybrid riser is hard to install.
As development is being progressed, the vertical tensioned riser can be substituted with steel
catenary riser with hanging free configuration. This hybrid riser is commonly referred to as
Catenary Offset Buoyant Riser Assembly (COBRA). The COBRA concept is a modification
of the hybrid riser concept, in which the aim is to combine flexibility features of hybrid
concept with simplicity and economical features of the SCR. The result is the combination of
steel catenary riser section, sub-surface buoy which is tethered down to the seabed, and
flexible jumper. (Karunakaran and Baarholm, 2013).

Master Thesis Feasibility Study of Selected Riser Concepts in Deep Water and Harsh Environment
Gilang Muhammad Gemilang 22
Figure 2-4 Global Arrangement of Free Standing Hybrid Riser (FSHR) (Burgess and Lim, 2006)
The top of the catenary riser section is connected to the host platform by a flexible jumper.
According to Karunakaran and Baarholm (2013), this concept removes the main problems of
fatigue and buckling issues at the touchdown point of steel catenary riser and also avoids the
use of complicated bottom assembly and spools of hybrid riser tower. The sample
arrangement of the COBRA concept for 1500 m water depth is shown in Figure 2-5. The
hybrid riser provides flexibility, excellent dynamic behavior, low fatigue damage and pressure
resistance.
Figure 2-5 COBRA Riser Configurations (Karunakaran and Baarholm, 2013)

Master Thesis Feasibility Study of Selected Riser Concepts in Deep Water and Harsh Environment
Gilang Muhammad Gemilang 23
2.4 Riser Material
Material for riser systems is selected to accommodate the riser requirement. The selection of
material is driven by internal fluid, external environment, loads, temperature, service life,
fatigue resistance, and corrosion resistance (DNV, 2010a). In addition, the selection of
materials depends on chemical composition of the transported fluid since various transported
fluids may cause corrosion or erosion. According to material selection, risers can be divided
into the flexible riser and rigid riser.
2.4.1 Flexible Riser
Flexible riser is a pipe with low bending stiffness and high axial tensile stiffness, which
consists of several numbers of independent layers. Basically, there are two types of flexible
pipe; bonded and non-bonded types (API, 2006). Bonded pipes comprise individual and
different layers of elastomer, fabric and steel wrapped together with a process of
vulcanization. Generally, bonded pipe is only used for short sections e.g. jumper. In contrast,
unbounded pipe is used for long sections for dynamic application.
A non-bonded pipe comprises several individual and different layers having no adhesion
between them (API, 2006). The layers are a carbon-steel circumferential layer for internal
pressure loads, a stainless steel internal carcass for collapse resistance, tensile armor layers for
axial strength, and an extruded watertight external sheath. The flexible riser has been a
successfully applied for shallow water. It also can be used for flow line systems. Flexible riser
has high flexibility, allowing riser to bend with high curvature. The typical flexible riser
layers can be seen in Figure 2-6. Flexible riser has numerous advantages, e.g. easy to install,
reusable, etc.
Figure 2-6 Flexible Riser Layers (API, 2006)
The flexible riser has been extensively used for providing flexibility and resistance to
corrosion. The flexible riser applies pipe-in-pipe method to fit the entire layer in one section.
The layers are arranged such that it can improve flow assurance, resistance to corrosion, and
capability to resist external and internal pressure. The capability of flexible riser becomes a
proven technology, especially in mid water and shallow water.

Master Thesis Feasibility Study of Selected Riser Concepts in Deep Water and Harsh Environment
Gilang Muhammad Gemilang 24
However, as the exploration of oil and gas moves to deeper water, the flexible riser has
technical and economical limitation mainly caused by development cost. As the water
becomes deeper, the length of the riser becomes longer and might cause expensive cost.
Furthermore, in the future, the need for higher number of risers and larger diameter is
predicted (Howells and Hatton, 1997). This limitation of flexible riser has become the main
reason to develop alternative technology to overcome that challenge. Consequently,
alternative types of riser have been eagerly pursued. Thus, when it comes to deep water, rigid
riser emerges as an alternative.
2.4.2 Rigid Riser
2.4.2.1 Carbon Steel Pipe
The selection of materials using a carbon steel pipe was applied since the 1950s based on the
standard API 5L Code of pipe material selection. The requirements on carbon steel quality
differ from the characteristics of the material (e.g. yield/tensile strength, modulus of
elasticity). Based on API 5L code, there are several types of pipe material, namely X46, X52,
X56, X60, X64, X70 and X80. The number indicates the yield stress strength of the material.
Each type of material has the characteristics of the composite and each constituent material.
The specifications of steel material depend on the chemical composition, strength of
materials, and tolerance in the pipeline industry. However, the carbon steel materials tend to
corrode due to:
Sweet corrosion = combination of CO2 and water
Sour corrosion = H2S
Thereby, riser materials selection and internal corrosion mitigation strategies should consider
the fluids that are expected to be in contact with the riser both internally and externally during
service life (API, 2006). Thereby the selection of material should be determined to get the
appropriate material according to the needs of riser systems. The following criteria can be
used in the selection of materials for pipes.
Mechanical properties, including yield strength, resistance to withstand a static load,
dynamic load, and elasticity in the manufacturing process.
Weld ability, ease and strength of the pipe material in the welding process.
Corrosion resistance, the ability of a material to resist corrosion.
Cost, related to the costs per unit of measure of the material.
Availability, related to the availability and supply of materials on the market
2.4.2.2 Titanium pipe
The titanium material offers several benefits over the carbon steel material due to a
significantly low modulus of elasticity implying a higher degree of flexibility. Furthermore,
the yield stress of titanium is much higher and the specific weight is much lower than carbon
steel material (DNV, 2010a). The titanium also offers high fatigue resistance and generally
high chemical resistance. This fact leads titanium to become preferable than the carbon steel
material since the titanium material provides predominance with respect to strength,
flexibility and weight.

Master Thesis Feasibility Study of Selected Riser Concepts in Deep Water and Harsh Environment
Gilang Muhammad Gemilang 25
However, titanium is much more expensive than steel, such that the carbon steel material is
considered to be applied rather than titanium material in deep water. Therefore, the “Titanium
Catenary Risers” (TCR) is only a candidate material of riser for following conditions (Bell et
al., 2005):
When in considerably shallow water depth location where the fatigue problems and
extreme response are greater than in deeper water.
When sour service requires a material that has higher fatigue resistance than carbon
steel.
2.5 Riser Component
This section describes main riser connectors and components commonly used in riser design.
DNV-OS-F201 and API-RP-2RD are mainly used for reference. In order to hold riser stable
and fulfill design criteria, critical locations of riser are equipped with several components that
have the ability to provide sufficient leakage tightness, fatigue resistance and structural
resistance for all related conditions (DNV, 2010a).
2.5.1 Flex joint
The flex joints are often used as the interface between the riser and the upper termination
point. The flex joint provides flexibility to accommodate motion between host platform and
the riser. The flex joints are also used to allow rotational deflections in risers without yielding
large torsional moments near the top-end termination of the riser (API, 2006). Flex joint can
be modeled as a linear spring with appropriate rotational stiffness properties.
This spring is important for fatigue performances in the hang-off area since the flex joint
rotational stiffness contributes to riser fatigue response. For deep water application, the design
of the flex joint will consider the effect of top tension ranges of the riser for fatigue purpose
(Bai and Bai, 2010a). Thus, the range of top tension should be ascertained during the motion
analysis statically and dynamically that the design limits of the flex joints are not exceeded.
Figure 2-7 Flex Joint (DNV, 2010a)

Master Thesis Feasibility Study of Selected Riser Concepts in Deep Water and Harsh Environment
Gilang Muhammad Gemilang 26
2.5.2 Tapered stress joint
The tapered stress joint is used to accommodate a transition member to avoid excessive
bending and fatigue issue between stiffer sections and less stiff sections of a riser. It
contributes to reduce local bending stress and provide a means of distributing riser curvature
arising from bending at either end (API, 2006). The main idea of tapered stress joint is
through the use of a transition member with linearly different of stiffness where the bending
stiffness at one end has a higher stiffness while the opposite end has lower stiffness (API,
2006). The idea can be accomplished by varying the wall thickness of the transition member
linearly while maintaining a constant internal diameter of the riser, see Figure 2-8.
Figure 2-8 Tapered Joint (API, 2006)
2.5.3 Strakes and Fairings
The strong current creates regular shedding of vortices in the wake region of the downstream
side of the flow. The shedding vortices induce vortex-induced vibrations (VIV) effect on the
riser that might cause fatigue damage. The helical strakes and fairings are devices that are
added along the suspended riser to suppress VIV effect. They can be installed to riser in
critical segment length of the riser. The design of helical strakes and fairings are such that
they act to decrease the vibration by controlling the flow pattern around the riser. Figure 2-9
shows the pictorial representation showing helical strakes and fairings.
Figure 2-9 Strakes and Fairings (API, 2006) (Vivsolutions, 2015)
Riser Joint
Tapered Joint
Connector

Master Thesis Feasibility Study of Selected Riser Concepts in Deep Water and Harsh Environment
Gilang Muhammad Gemilang 27
2.5.4 Buoyancy Module
The buoyancy modules are used to shape lazy wave configuration. These buoyancy modules
are added along to some length of the riser to decouple the dynamic motion from floater and
to decrease the top payload. The density of buoyancy module material is less than water
density; thereby it provides a net upward force onto the riser. Balmoral offshore is one of the
qualified suppliers which provide high quality of buoyancy modules. The densities and
composition of the buoyancy modules should be based on operational requirements such as
hydrostatic pressure, water ingress, riser diameter, etc.
Figure 2-10 Buoyancy Modules (Balmoral, 2014)
2.5.5 Ballast modules
One of methods to add weight in the riser is by using the practiced ballast modules. These
modules are obtainable in various dimensions and can be attached over riser per joint with
2000 kg weight at each specific interval of 12 m (Karunakaran et al, 2013). The installation of
these modules is exactly like the installation of buoyancy modules. A typical ballast module is
illustrated in Figure 2-11.
Figure 2-11 Typical Ballast Module (Balmoral, 2014)
The ballast modules consist of following component:
Internal clamp;
Split ballast element;
Tensioning assembly and
Fastening system.

Master Thesis Feasibility Study of Selected Riser Concepts in Deep Water and Harsh Environment
Gilang Muhammad Gemilang 28
2.6 Risers Challenges
The designing riser system includes a number of considerations, e.g. water depth, pressure,
temperature, floater motions, thermal management, hydraulic issues, etc. In this study, the
riser systems are encountered with deep water and harsh environment as challenges. Harsh
environments might increase the complexity of riser design (Karunakaran et al., 2005). Both
challenges are considered to be the most challenging combination for riser system design.
Therefore, Section 2.6 will discuss those challenges with respect to riser design.
2.6.1 Deep Water Challenges
2.6.1.1 Riser Weight
The suspended length of the riser is getting longer proportionally with deep water, hence
risers weight increases proportionally with water depth as well. This leads to higher top
tension force at the host platform (floater), which is usually referred to as top payload. The
top payload is one of the important keys in the host platform type selection. The host platform
capacity has to be able to accommodate the maximum top payload from a large number of
riser systems and mooring systems.
2.6.1.2 Riser Sizing
The internal diameter and wall thickness are the main parameters of riser size. The
consideration of internal diameter selection is related to hydraulic purposes. Meanwhile, the
wall thickness selection is related to capacity to withstand external and internal pressure of the
riser. The external pressure is mainly driven from hydrostatic pressure of sea water whilst the
internal pressure is mainly driven from internal fluid.
The wall thickness of the riser should be selected to accommodate external pressure and
internal pressure to avoid collapse and bursting, respectively. The concern is also given in
installation stage. During the installation stage, the riser is commonly in empty condition. The
empty riser should have adequate resistance against the collapse failure due to external
hydrostatic pressure.
2.6.1.3 Spreading Area
The riser systems require large radial spreading area in deep water. As the water depth
increases, the risers need to be laid down in a larger area to achieve the proper configurations.
For steel catenary riser (SCR) configuration, typical radial spread is 1.0 to 1.5 times the water
depth. Consequently, if the water depth is 1000 m, there should be spreading area of 1500 m
for riser configuration. This spreading issue should be considered when selecting the riser
configuration and positioning (Howells & Hatton, 1997).
2.6.1.4 Current
In deep water, the current effects become significant, as the suspended riser becomes long and
vulnerable to vortex induced vibration (VIV), especially for large current speed in deep water.
The VIV effect may give a significant contribution to fatigue damage on the risers. This leads
to the requirement for VIV suppression such as helical strakes or fairings along the critical
area of the riser.

Master Thesis Feasibility Study of Selected Riser Concepts in Deep Water and Harsh Environment
Gilang Muhammad Gemilang 29
2.6.1.5 Installation
During the installation period, the empty risers should have an adequate wall thickness to
provide collapse and local buckling resistance against external hydrostatic pressure. Different
technologies have been developed to install offshore risers in deep water. The risers can be
installed when the environmental condition allows relatively small motions of installation
vessel. Generally, several installation methods are J-Lay, S-Lay and reel-lay. These three
installation methods require adequate capacity of the installation vessels.
The installation vessel should be chosen accordingly with the requirement of such high
tensioning system of risers. Up to date, the maximum tension limit is around 1000 Te for
tensioning systems of installation vessels. Most installation vessels have capacities of over
500 Te (Burgess and Lim, 2006).
The installation window in deep water is also another aspect that needs to be considered for
riser installation. A greater water depth requires the longer riser length to be installed, and
consequently long installation period is needed. Installation challenges in deep water can be
summarized as follows:
Limited number of installation vessels;
Limited installation windows;
High installation costs;
Complex installation methods.
2.6.2 Harsh Environment Challenges
2.6.2.1 Dynamic motion of FPS
The large motions of the FPS due to combination of waves, currents, and winds become great
challenges in designing riser system in harsh environmental conditions. The dynamic motions
of the FPS contribute to buckling and fatigue issues in the touchdown area (Karunakaran et
al., 2005). In addition, fatigue performance in the hang-off area is also influenced by dynamic
motion of FPS.
The selection of Floating Production System (FPS) concept is highly dependent on the riser
design. The riser arrangements should have the capability to accommodate the low frequency
(LF) and wave frequency (WF) motion of FPS responses. Moreover, in the harsh
environment, the FPS motion may have larger offsets. The SCR configuration should then be
arranged such that it can cope with FPS motion.
2.6.2.2 Fatigue performance
The main challenge for the design of the SCR in harsh environments is fatigue in the hang-off
area and touchdown area (Karunakaran et al., 2013). Moreover, the strong current may
generate vortex shedding in the downstream side of the riser; hence, it contributes to fatigue
damage onto the riser.
2.6.2.3 Installation
In mild environments, riser installation can be performed in almost all months of a year thus
suitable weather windows are very large. However, in harsh environments, riser installation

Master Thesis Feasibility Study of Selected Riser Concepts in Deep Water and Harsh Environment
Gilang Muhammad Gemilang 30
can only be performed in a relatively calm day. This fact leads to more challenge of riser
installation as suitable weather windows are very small in harsh environment. The harsh
environment limits the installation window; hence, the installation window has to deal with
more uncertainty. The installation window is usually limited to summer time and some days
in spring time when the air pressures and temperatures are constant.
2.7 Selected Riser for Thesis Work
The selected riser for thesis work is the Steel Catenary Riser (SCR) with following
configuration:
Conventional SCR,
Weight Distributed SCR (WDSCR) and
Steel Lazy Wave Riser (SLWR)
This section will present the description of each selected riser configuration of SCR.
2.7.1 Conventional SCR
The conventional SCR is a simple hanging-free configuration. The name “catenary” simply
originates from the catenary shape of the riser that is due to its self-weight. This is a simple
drape starting at the floater and curving through nearly 90 degrees to a horizontal orientation
on the seabed. The SCR is self-compensated for the heave movement without heave
compensation. The SCR is installed using an offshore pipe-lay vessel. The steel catenary
risers (SCRs) concept is a promising solution for future deep water applications. SCR is
known to be economical in terms of both installation and construction. Compared to the
flexible risers, the SCRs has emerged to be easier and cheaper to produce.
The SCR also has high resistance to the internal and external pressure to operate in even deep
water due to the material. The material of steel may also be modified to different alloys for
higher strength capacity. The SCR can be mounted in a size that is long enough from the
floater to the seabed. A flex joint is installed at the top-end of the riser at the host platform to
accommodate rotation and deflection.
On the seabed, the riser system does not require a special connection bottom system. Some
length of the pipe is required on the seabed before any seabed termination/connection. This
length allows for any movement caused by vessel offset. Alternatively, the riser can extend to
become part of the subsea pipeline. This reduces the complexity and cost, so that the SCR can
be regarded as a simple riser system.
The description of the SCR is presented in Figure 2-12. The design, fabrication, welding, and
installation challenges of the SCR are mainly related to the high top tensions, high pressure,
high temperature and sour service. The first SCR was initially implemented on Auger
development in the GoM in 1994. Since then, a number of SCR has been installed in some oil
and gas development fields such as gum, and Brazil. In 2004, SCR is firstly installed in West
Africa in which conjunction to an FPSO on the Bonga field offshore Nigeria (Alliot et al.,
2005). At the late of 2008, more than 100 SCRs have been installed in deep water worldwide
with the majority installed in the Gulf Of Mexico (Bai and Bai, 2010b).

Master Thesis Feasibility Study of Selected Riser Concepts in Deep Water and Harsh Environment
Gilang Muhammad Gemilang 31
Figure 2-12 Rigid SCR Hanging-Free Configuration (API, 2006)
However, for deep water applications and harsh environments where vessel motions are
severe, it is difficult for conventional catenary riser configuration to meet both strength and
fatigue design criteria, especially in the touchdown area. The problems that might occur on
the SCR include sensitivity to the waves, current and dynamic motion of the floater. The large
vessel offset due to harsh environment results in the change of suspended length of riser and
thereby changes the TDP position as well. Together with heave motion of the floater, the riser
is therefore lifted off and laid down onto the seabed continuously (Bai and Bai, 2010b).
Hence, the touchdown area becomes critical to fatigue and buckling issue for steel catenary
risers. Soil-riser interaction and heave motion of floater are the main contribution to fatigue
damage on the riser. In addition, the current might also contribute to fatigue damage along the
suspended length of the riser. The vortex was introduced around the riser as current is
obstructed by riser body. This can be anticipated by using VIV suppression in the suspended
length of riser as described in Figure 2-12.
As the development is being progressed, the conventional SCR concepts have been developed
with some modifications such that the SCR can be used in harsh environment and deep water.
The optimization studies of SCR configuration are discussed in this thesis to present the
feasibility study of SCR configuration and its derivatives to cope with the large vessel motion.
The next section will discuss the further development of the conventional SCR.

Master Thesis Feasibility Study of Selected Riser Concepts in Deep Water and Harsh Environment
Gilang Muhammad Gemilang 32
2.7.2 Weight Distributed SCR
One of the developments of conventional SCR is weight distributed SCR. Both strength and
fatigue requirement criteria of SCR design can be successfully solved by varying the weight
along the suspended risers with the heavy modules. One study, from Karunakaran et al.
(2013), shows that by varying heavy and light coating along the suspended risers, SCR
strength and fatigue performance can be upgraded expressively. The concept involves varying
weight along the suspended riser, with the lightest possible cross-section in the touchdown
area (TDA) and heaviest possible cross-section at the bottom of the straight section of the
riser. By using a heavy cross-section at the straight part of the riser, the stresses around the
TDP is significantly reduced. However, this may also increase the vessel payload and the
dynamic axial stress.
The SCR with weighted sections, which improve SCR response at critical area, is a potential
alternative solution for the application of SCRs in deep water and harsh environment (Foyt et
al., 2007). According to Karunakaran et al. (2013), the distribution weight can be achieved by
using well qualified ballast modules that are attached at certain sections of SCR. The ballast
module is shown in Figure 2-11. This weight distributed SCR concept can be fabricated and
installed in the same way as traditional SCRs. Figure 2-13 shows the schematic of weight
distributed SCR.
Figure 2-13 Weight Distributed SCR (Karunakaran and Legras, 2013)
2.7.3 Steel Lazy Wave Riser
The SLWR is the SCR with buoyancy modules added to the middle section of the riser to de-
couple the vessel motions from the TDP region, and to reduce the vessel payload. This
configuration is more compliant than the conventional SCR. The compliant configuration

Master Thesis Feasibility Study of Selected Riser Concepts in Deep Water and Harsh Environment
Gilang Muhammad Gemilang 33
allows significantly large horizontal offset of floater compared to conventional SCR without
significant change in TDP position. The less the TDP moves, the more efficiency of de-
coupled system is achieved.
The SLWR has therefore significantly less TDP movement than the SCR, and thereby
improve the riser strength and fatigue performance (Senra et al, 2011). The SLWR approaches
smoothly to the seabed in a horizontal manner. However, the extra buoyancy introduces
additional bending stress at the sag-bend and the hog-bend region. High static bending
moment at the sag-bend and the hog-bend are design issues for lazy wave configurations
(Karunakaran et al., 1996). Therefore, it is important to ensure low curvatures at the sag-bend
and hog-bend.
Moreover, the buoyancy modules are expensive and difficult to install. Consequently, SLWR
configuration has to be optimized in tradeoff to minimize buoyancy modules while maximize
riser performance as well. This fact attracts continuous development of SLWR to optimize
such efficient configuration of “lazy wave” that meets the riser performance target and saves
development costs. The illustration of SLWR configuration in conjunction with FPSO is
shown in Figure 2-14.
Figure 2-14 Typical SLWR Configuration in Conjunction with FPSO (Chen and Cao, 2013)

Master Thesis Feasibility Study of Selected Riser Concepts in Deep Water and Harsh Environment
Gilang Muhammad Gemilang 34
Chapter 3. Design Code for Riser
3.1 Introduction
Risers are subjected to numerous loads that vary from the normal to accidental event. The
risers should be designed based on accepted standards and regulations to withstand load
effects during its service life. This can be achieved by taking into consideration the various
design conditions that may involve throughout its expected lifetime. The minimum
requirements for risers have to be established to meet criteria for construction, installation,
commissioning, operation, maintenance, requalification, and abandonment.
The design is safe when the resistance is more than the specific minimum requirement for the
given conditions. Selection of wall thickness sizing should be carried out using a design code
taking into account for burst, collapse and buckling criteria. The riser should be designed in
order to meet those criteria. The safety factor is applied to cover uncertainty and inaccuracy in
the analysis of each stage of riser application. Thus, the safety factor is incorporated in design
check. Design codes are distinguishable according to two fundamental design approaches as
listed below.
• Working Stress Design (WSD) and
• Load and Resistance Factor Design (LRFD)
The WSD utilizes only one uniform safety factor to cover uncertainty and inaccuracy from
expected responses and resistance for each limit state. Meanwhile, the LRFD uses various
safety factors to cover uncertainty and inaccuracy from each specific response and resistance
for each limit state. Design codes such as API, ISO, HSE, NPD, DNV and ABS are all
examples of guidelines used when designing riser systems. The following are most commonly
applicable codes for design of deep water risers (Kavanagh et al., 2003)
API RP 2RD, “Design of Risers for Floating Production Systems (FPSs) and Tension-
Leg Platforms (TLPs)”, 1998;
API RP 1111, “Design, Construction, Operation, and Maintenance of Offshore
Hydrocarbon Pipelines (Limit State Design)”, 3rd Edition 1999;
ASME B31.4, “Pipeline Transportation Systems for Liquid Hydrocarbons and Other
Liquids, Chapter IX – „Offshore Liquid Pipeline Systems‟”, 1998 Edition;
ASME B31.8, “Gas Transmission and Distribution Piping Systems”, Chapter VIII -
"Offshore Gas Transmission", 1999 Edition;
Offshore Standard DNV-OS-F201, Dynamic Risers 2010.
This chapter describes the LRFD and WSD method for good understanding of riser basis
evaluation. The selection of the method will be concluded at the end of this chapter. The
WSD method presented in this study is according to API-RP-2RD, while the LRFD method is
according to DNV-OS-F201.

Master Thesis Feasibility Study of Selected Riser Concepts in Deep Water and Harsh Environment
Gilang Muhammad Gemilang 35
3.2 Design Principle
According to the functional requirement of the risers stated by API, the objective of riser
system is to ensure the transportation of fluid safe, continuous and concurrent between seabed
and host platform (floater). From that objective, riser systems are a part of a flow assurance
chain. In order to accomplish the flow assurance purposes, the riser should be designed,
fabricated, constructed, operated and maintained based on standardized design codes. This
standard should consider safety philosophy related to human life, financial issues, public
safety and protection of the environment. According to DNV, the integrity of a riser system is
ensured to safety philosophy for various aspects as illustrated in Figure 3-1.
Figure 3-1 Safety Hierarchy (DNV, 2010a)
In order to attain that objective, any hazardous impact is subjected to be minimized or
eliminated to be as low as reasonably practicable (ALARP Principle). A systematic
assessment by using Quantitative Risk Analysis (QRA) may offer adequate design parameter
to select a suitable safety class with respect to structural failure probability. Thus, the riser can
be designed with different safety requirements based on the given conditions of the riser
system.
DNV provides different safety requirements in respect to riser design, depending on the safety
class to which the riser fits. The safety classes of riser system will be classified into one or
more safety classes. According to DNV (2010a), the safety class of a riser depends on the
following factors (DNV, 2010a).
The hazard potential of the fluid in the riser, e.g. fluid category.
The location of the part of the riser that is being designed.
Whether the riser is in operation or temporary state.
DNV provides a classification of safety classes for the riser design based on the potential
failure consequences. Table 3-1 presents the classification of safety classes which is discussed
in DNV-OS-F201 section C204 (DNV, 2010a).

Master Thesis Feasibility Study of Selected Riser Concepts in Deep Water and Harsh Environment
Gilang Muhammad Gemilang 36
Table 3-1 Classification of Safety Class (DNV, 2010a)
3.3 WSD Code – API RP 2RD
This section addresses design guidelines with Working Stress Design (WSD) method for
typical riser design in conjunction with the Floating Production Systems (FPS). The WSD
method, as reflected in the previous section, is generally based on the principles of limiting
stresses of riser under normal, extreme and accidental conditions. The WSD method accounts
for uncertainty and inaccuracy with only a single safety factor. The criteria of riser failure
mechanisms are discussed in this section including allowable stresses, allowable deflection,
hydrostatic collapse, overall column buckling, fatigue/service life (API, 2006).
3.3.1 Allowable Stresses
Based on API-RP-2RD section 3.4, structural design is based on an allowable stress approach
that defines acceptability on the basis that the calculated stresses in the riser are below
allowable stresses for all applicable loading conditions. With such an approach, the riser
design should be arranged to resist external and internal loads. Guidelines consider three
principal stresses to be established in extreme condition.
The riser is considered to be a plain pipe with axisymmetric geometry. The three principal
stresses for plain pipe are in the axial, hoop and radial directions (API, 2006). Meanwhile,
torsion and transverse shear are insignificant for plain round pipe. The three principal stresses
are calculated at all critical locations in the riser to form a combined stress using the von
Mises yield criterion defined by the following equation:
2 2 2
e 1 2 2 3 3 1
1σ σ σ σ σ
2 (3.1)
Where
σe = Von Mises Equivalent Stress
σ1, σ2, σ3 = Principal Stresses
According to API (2006) section 5.2.3, the equivalent von Mises stresses should be less than
allowable stresses as shown in following inequalities:
p f aeC (3.2)
Where
Safety Class Definition
LowWhere failure implies low risk of human injury and minor
environmental and economic consequences.
Normal
For conditions where failure implies risk of human injury,
significant environmental pollution or very high economic or
political consequences.
High
For operating conditions where failure implies high risk of
human injury, significant environmental pollution or very high
economic or political consequences

Master Thesis Feasibility Study of Selected Riser Concepts in Deep Water and Harsh Environment
Gilang Muhammad Gemilang 37
(σp)e = Equivalent von Mises stress where the principal stresses consist of primary membrane
stresses.
σa = Caσy = basic allowable combined stress.
Ca = allowable stress factor, Ca = 2/3
σy = material minimum yield strength
Cf = design case factor, refer to Table 3-2; this factor is calculated by considering load
category, environmental condition, and pressure (API, 2006).
Table 3-2 Design Matrix for Rigid Risers (API, 2006)
3.3.2 Allowable Deflection
The deflections of the riser should be limited to avoid excessive bending stresses. Even
though riser stress and bending radius are within the allowable limit, large riser curvatures
may overstress tubing or other parts constrained to move with the riser body (API, 2006). In
addition, riser deflections should also be controlled to prevent multiple risers from obstructing
other equipment or components.
3.3.3 Hydrostatic Collapse
3.3.3.1 Collapse Pressure
In deep water application, external pressure from hydrostatic pressure is high. Excessive
external pressure may result in collapse failure. Consequently, the riser should be able to
withstand external pressures experienced at any period during installation or operation. The
maximum allowable external design pressure (Pa) should be less than the predicted collapse
pressure (Pc) times the design factor (Df). The calculation can be expressed in following
equation.
a f cP D P (3.3)
Where
= External Design Pressure
= Predicted Design Collapse Pressure
= 0.75 for seamless or Electric Resistance Welded (ERW) API pipe.
Design
CaseLoad Category Pressure
Reduced Tensioner
Capacity or One Mooring
Line Broken
Cf
1 Operating Design No 1
2 Extreme Design No 1.2
3 Extreme Extreme No 1.2
4 Extreme Design Yes 1.2
5 Temporary Associated No 1.2
6 Test Test No 1.35
7 Survival Associated No 1.5
8 Survival Associated Yes 1.5
Maximum Operating
Survival
Extreme
Environmental
Condition
Maximum Operating
Extreme
Maximum Operating
Maximum Operating
Temporary

Master Thesis Feasibility Study of Selected Riser Concepts in Deep Water and Harsh Environment
Gilang Muhammad Gemilang 38
= 0.60 for (DSAW) internally cold expanded API pipe.
3.3.3.2 Collapse Propagation
Propagation buckling is a deformation of the cross section of pipe that extends and propagates
along the pipe. Propagation buckling is normally caused by difference of external and internal
hydrostatic pressure. The principle of propagation of buckling is the pressure that may cause
the propagation buckle (buckle initiation pressure) whose value is greater than the resistance
to prevent the propagation of the buckle (collapse pressure). This commonly applies to pipes
that have uniform properties along the pipeline. However, propagation buckling will not
happen if there is no local buckling happens.
Figure 3-2 Propagation Buckling on the Pipe (Tawekal, 2010)
In order to mitigate collapse propagation, features such as buckle arrestors can be
incorporated into the design to limit the propagation of a propagating failure at critical region.
In order to avoid propagation buckling, the design pressure differential (Pd) from external and
internal pressure should be less than the predicted propagation pressure differential (Pp) times
the design factor (Dp). The design criterion to prevent collapse propagation is provided in the
following equation.
d p pP D P (3.4)
Where
= design pressure differential
= predicted propagation pressure differential
= design factor = 0.72
These criteria are applicable for riser with metal tubular that used in deep water application.
3.3.4 Overall Column Buckling
The overall column buckling is induced by excessive negative effective tension along the
entire riser lengths. The negative effective tension is usually referred to as compression. The
consequences of excessive compression are excessive bending moment and excessive
curvature at critical locations. Compression may cause buckling on the riser. The overall
column buckling can be prevented by providing tension at the top end termination of the riser.
3.3.5 Fatigue/Service Life
The design fatigue life of riser is defined as the life predicted by cumulative fatigue damage
ratio calculations throughout its design life. The cumulative fatigue damage is calculated with

Master Thesis Feasibility Study of Selected Riser Concepts in Deep Water and Harsh Environment
Gilang Muhammad Gemilang 39
associated safety factor. The selected value of the safety factor is dependent on the pollution,
risk and the difficulty of inspection. At the location, where the risk and difficulty of
inspection are high, the safety factor of 10 is considered. At the location, where the risk and
difficulty of inspection are low, the safety factor of 3 is considered. In order to satisfy fatigue
criteria, the following equation should be satisfied:
i i
i
SFD 1.0 (3.5)
Where
= fatigue damage ratio
= associated safety factor
3.4 LRFD Code – DNV-OS-F201
This section will discuss the fundamental principle of Load and Resistance Factored Design
(LRFD) method according to DNV-OS-F201. The LRFD method is also referred to as partial
safety factor method. DNV-OS-F201 states that the fundamental principle of LRFD method
considers some limit states to ensure the riser design is safe throughout its service life. The
limit states are associated with some of the failure modes including bursting, collapse and
propagation buckling. Based on DNV-OS-F201, the general descriptions of limit states are
grouped into following four categories:
Ultimate Limit State (ULS)
This limit state requires that the riser must be able to remain intact and avoid rupture
over the service period. For operating condition, this limit state corresponds to the
maximum resistance to applied loads with 10-2
annual exceedence probability;
Accidental Limit State (ALS)
This limit state requires that the riser must be able to remain intact and avoid rupture
due to accidental loads (e.g. infrequent loads);
Serviceability Limit State (SLS)
This limit state requires that the riser must be able to remain in service and operate
properly. This limit state corresponds to criteria limiting or governing the normal
operation (functional use) of the riser;
Fatigue Limit State (FLS)
This limit state requires that the riser must be able to remain fit to operate during
service life from accumulated excessive fatigue crack growth or damage under cyclic
loading.
The acceptance criteria are calibrated using a reliability-based methodology for each
particular safety class. The sum of applicable load factor effects incorporated with various
load effect factors is compared to the resistance factor. Based on DNV-OS-F201, the general
LRFD safety format can be expressed as follows.
Kd p F F E E A A
SC m c
RS S ;γ S ;γ S ;γ .S ;
γ .γ .γ (3.6)

Master Thesis Feasibility Study of Selected Riser Concepts in Deep Water and Harsh Environment
Gilang Muhammad Gemilang 40
Where
= Sum of design load factor
= Pressure loads
= Load effect from functional loads (vector or scalar)
= Load effect from environmental loads (vector or scalar)
= Load effect from accidental loads (vector or scalar)
= Load effect factor for functional loads (vector or scalar)
= Load effect factor for environmental loads
= Load effect factor for accidental loads
= Resistance factor to take into account the safety class
= Resistance factor to take into account for material and resistance uncertainties
= Resistance factor to take into account for special conditions
= Generalized resistance (vector or scalar)
3.4.1 Design Loads
In the LRFD method, the classification of loads is distinguished in order to cope with specific
uncertainties of a particular source in a rational way. The classification loads used in LRFD
are as follows:
Pressure load effect (P);
Functional load effects (F);
Environmental load effects (E) and
Accidental load effects (A).
The examples of the each load group are presented in the following table (DNV, 2010a).

Master Thesis Feasibility Study of Selected Riser Concepts in Deep Water and Harsh Environment
Gilang Muhammad Gemilang 41
Table 3-3 Examples of Categorization of loads1) (DNV, 2010a)
The summations of the load effects for each category are established by multiplying the
corresponding load effect safety factor. Specific calculation is presented below for bending
moment and effective tension.
d F F E E A AM γ M γ M γ M (3.7)
Where
= Bending moment design
= Bending moment from functional loads
= Bending moment from environmental loads
= Bending moment from accidental loads
Design effective tension for functional, accidental and environmental induced load effects
ed F eF E eE A eAT γ T γ T γ T (3.8)
Where
= Effective tension design
= Effective tension from functional loads
= Effective tension from environmental loads
= Effective tension from accidental loads
Where the effective tension (Te) is given as follows:

Master Thesis Feasibility Study of Selected Riser Concepts in Deep Water and Harsh Environment
Gilang Muhammad Gemilang 42
e W i i e eT T PA P A (3.9)
Where
= Effective tension
= True wall tension (i.e. axial stress resultant found by integrating axial stress over the
cross-sectional area)
= Internal local pressure
= External local pressure
= Internal cross-sectional area
= Internal cross-sectional area
As shown in the above formulas, each particular load is multiplied by corresponding load
effect safety factor. DNV suggests load effect factors for all limit states design. The
applicable load effect factors are given in Table 3-4 for all limit states and safety class.
Table 3-4 Load Effect Factor (DNV, 2010a)
DNV suggests the value of reduced functional load (γRF) of 0.91 and the value of reduced
environmental load (γRE) of 0.77 for ultimate limit states.
3.4.2 Resistances
The resistance factors are also applied to design strength check. DNV suggests applying
resistance factors as follows:
Safety class factor (γSC) is composed of resistance depending on safety class for failure
consequences (refer to Table 3-5).
Material resistance factor (γm) is incorporated for material and resistance uncertainties
with relevant limit states (refer to Table 3-6).
Condition factor (γC) is accounted for special conditions. The particular condition is
specified explicitly at all corresponding limit states (refer to Table 3-7)
Functional
load effect
Environmental
load effect
Accidental
load effect
γF γE γA
ULS 1.1 1.3 NA
FLS 1 1 NA
SLS 1 1 1
ALS 1 1 1
Limit State

Master Thesis Feasibility Study of Selected Riser Concepts in Deep Water and Harsh Environment
Gilang Muhammad Gemilang 43
Table 3-5 Safety Class Resistance Factor
Table 3-6 Material Resistance Factor
Table 3-7 Simplified Design Check for Accidental Limit States
Condition factor (γC)
Prob. of occurrence Safety class low Safety class normal Safety class high
>10-2
Accidental loads may be regarded similar to environmental
loads and may be evaluated similar to ULS design check
10-2
-10-3
To be evaluated on a case by case basis
10-3
-10-4
γC =1.0 γC =1.0 γC =1.0
10-4
-10-5
γC =0.9 γC =0.9
10-5
-10-6
γC =0.8
<10-6
The calculation of the wall thickness of the riser should consider the possibilities that the
nominal wall thickness may be reduced. From this consideration, the fabrication allowance
and corrosion allowance are added in final wall thickness of the riser. The DNV suggests
using a minimum wall thickness so-called t1 for bursting and collapse failure modes.
On the other hand, for the failure likely to occur due to external loading, DNV suggests using
minimum wall thickness so-called t2 to be calculated by only considering the corrosion
allowance. The wall thickness calculations for the riser design are given in equations (3.10)
and (3.11).
1 nom fab corrt t t t (3.10)
2 nom corrt t t (3.11)
Where
= Specified (nominal) pipe wall thickness
= Fabrication allowance
= Corrosion allowance
Low Normal High
1.04 1.14 1.26
Safety Class resistance factor (γSC)
ULS & ALS SLS & FLS
1.15 1
Material resistance factor (γm)
Accidental loads or events may be
disregarded

Master Thesis Feasibility Study of Selected Riser Concepts in Deep Water and Harsh Environment
Gilang Muhammad Gemilang 44
3.4.3 Material Strength
The material strength can be changed over time, temperature and some practical
consideration. Consequently, the material strength, yield and tensile strength, will be given in
following formula.
,( )y y temp uf SMYS f
,( )u u temp uf SMTS f
Where
SMYS = specified minimum yield stress at room temperature
SMTS = specified minimum tensile stress at room temperature
Fy,temp = temperature de-rating factor for yield stress, DNV recommends de-rating
temperature effects of the yield strength for C-Mn steel, refer to Figure 3-3.
Fu,temp = temperature de-rating factor for tensile stress
αu = material strength factor, refer to Table 3-8
Table 3-8 Material strength factor (DNV, 2010a)
Figure 3-3 De-rating value (DNV, 2010a)
3.4.4 Ultimate Limit States
The ultimate limit state (ULS) design requires that the risers be able to withstand the loads
from the maximum load combinations for an annual exceedence probability of 10-2
. The
consequence of failure of meeting this limit states are the collapse of the riser structurally.
DNV suggests typical failure modes for this limit states that need to be considered in the
design. The typical failure modes are as follows:
Normal Supplementary requirement U
0.96 1

Master Thesis Feasibility Study of Selected Riser Concepts in Deep Water and Harsh Environment
Gilang Muhammad Gemilang 45
Bursting
Hoop Buckling (collapse)
Propagating Buckling
Gross plastic deformation, local buckling and hoop buckling
Unstable fracture and gross plastic deformation
Liquid tightness
Global buckling
3.4.4.1 Bursting
A riser should be designed to transport fluid without bursting. Each riser must undergo checks
on burst pressure from the bottom-end connection to top-end connection. The burst resistance
should be designed to cope with the local differential pressure of internal pressure and
external pressure, which also known as hoop stress. The maximum internal pressure and
minimum external pressure might be located at the top-end, since at that location the external
pressure is minimal and there is internal pressure. Pipe members subjected to internal
overpressure will be designed to meet the following expression at all cross sections.
bli e
m SC
p (t)p p
γ . γ (3.12)
Where
t = Pipe wall thickness
= Safety class factor, refer to Table 3-5
= Material resistance factor, refer to Table 3-6
= Local incidental pressure
= External pressure
= Yield strength
= Tensile strength
= Burst resistance
Pb is the minimum burst resistance required to prevent riser from bursting. The actual burst
resistance is dependent on the riser material such as yielding limit and tensile limit of the
riser. The actual Pb resistance value of pipe is determined from the minimum value of the
following two equations.
1_
22
3b yield
tp t fy
D t
(3.13)
1_
22
1.153b tensile
t fup t
D t
(3.14)
Where

Master Thesis Feasibility Study of Selected Riser Concepts in Deep Water and Harsh Environment
Gilang Muhammad Gemilang 46
D = Outer diameter of pipe
t1 = Minimum wall thickness, refer to equation (3.10)
The local incidental pressure ( is the maximum expected internal pressure with a low
annual exceedence probability. Normally, the incidental surface pressure is taken 10% greater
than the design pressure ( ).
= + 0.1· (3.15)
= + ρi · (3.16)
Where
= Local internal design pressure
= Design pressure, the maximum surface pressure during normal operations
ρi = Internal fluid density
g = Gravity acceleration
h = Height difference between the actual location and the internal pressure reference
point
The minimum required wall thickness for riser without allowance of fabrication and corrosion
in given below.
1
min( ; )4 1.15 1
( )3
uy
m SC li e
Dt
ff
p p
(3.17)
Hence the final wall thickness is defined by adding fabrication allowance and corrosion
allowance into the wall thickness.
1nom fab corrt t t t (3.18)
Where
= Final (nominal) pipe wall thickness \
= Fabrication allowance
= Corrosion allowance
3.4.4.2 System Hoop Buckling (Collapse)
If the external pressure is dominant compared to internal pressure, the wall thickness selection
of the pipe will be governed by external pressure. The pipe should be designed to withstand
collapse from the external pressure. The maximum external force is located at the bottom
section of the riser. DNV suggests selecting the wall thickness of collapse criteria with respect
to the local differential pressure of external pressure and internal pressure. Pipe member
therefore will be designed to meet the following conditions.

Master Thesis Feasibility Study of Selected Riser Concepts in Deep Water and Harsh Environment
Gilang Muhammad Gemilang 47
( )
.
cli e
m SC
p tp p
(3.19)
Where
= External pressure
= Minimum internal pressure
= Hoop buckling resistance, which is given by
2 2( ) ( ) ( ) ( ) ( ) ( ) ( )c el c p c el p o
DP t P t P t P t P t P t P t f
t (3.20)
Where
max mino
D Df
D
(3.21)
= The initial ovality
= Elastic collapse pressure (instability) of pipe, which is given by:
3
2
2
( )1
el
tE
DP t
(3.22)
= Plastic collapse pressure
2. . .p y fab
tP f
D (3.23)
= Fabrication factor, see Table 3-9
Table 3-9 Fabrication Factor (DNV, 2010a)
3.4.4.3 Propagating Buckling
A riser should be designed to be able to prevent from propagation of buckling. This failure
mode is initiated by local buckle. The local buckle will propagate until external pressure
drops due to change in pipe properties. This criterion is to ensure that a possible local buckle
remains local and does not yield to the collapse of adjoining pipe sections. Therefore, the
propagating buckling check is required as follows:
pr
e min
c m SC
PP P
(3.24)
2.5
235 . . pr y fab
tP f
D
(3.25)
UOE UO/TRB
1 0.85 0.925
Tensile strength or seamless pipeCompressive strength for welded pipe

Master Thesis Feasibility Study of Selected Riser Concepts in Deep Water and Harsh Environment
Gilang Muhammad Gemilang 48
Where
t2 = Minimum wall thickness, refer to equation (3.11)
= Special condition factor for buckle propagation. The value is equal to 1.0 if no
propagation factor is allowed or 0.9 if buckle is allowed in a short distance.
= Propagation buckling resistance
By solving the equation, Hence the final wall thickness is obtained by adding and corrosion
allowance into the wall thickness
2nom corrt t t (3.26)
Where
= Final (nominal) pipe wall thickness
= Corrosion allowance
As seen in the equation, the propagation buckle resistance is only dependent on the yield
strength of the material, fabrication factor and t/D ratio. Once a local buckle has been
initiated, the pipe buckle will develop longitudinally through the neighboring pipe section as
long as the buckling propagation resistance is less than the hydrostatic pressure.
Normally, propagating buckling criterion results in significantly thicker wall thickness
compared to other criteria. Consequently, the design will be too conservative if this criterion
has to be met. In practice, the designer would withstand the propagation buckling by installing
buckle arrestor at the critical region rather than using thicker wall thickness uniformly. This
solution would save a significant amount of riser weight and cost.
3.4.4.4 Combined load Criteria
After checking riser against internal pressure and external pressure, riser is then checked to
withstand combination load, including effective tension, bending moment, and net internal
and external overpressure. DNV suggests the riser design to satisfy the following equation
with correspondence of the loading type. The pipe member subjected to bending moment,
effective tension and net internal over pressure will be designed to satisfy the equation (3.27).
Meanwhile, the pipe member subjected to bending moment, effective tension and net external
overpressure will be designed to satisfy the equation (3.28).
2 2 2
2 2
. . 1 1( ) ( )
d id e ed id oSC m
k b k b
M P P T P P
M P t T P t
(3.27)
22 2
2 2
2
. . 1( )
d ed o minSC m SC m
k k c
M T P P
M T P t
(3.28)
2
2 2. .k y cM f D t t (3.29)
2
2 2. .k y cT f D t t (3.30)

Master Thesis Feasibility Study of Selected Riser Concepts in Deep Water and Harsh Environment
Gilang Muhammad Gemilang 49
Where
Md = Design bending moment, refer to equation (3.7)
Ted = Design effective tension, refer to equation (3.8)
PId = Local internal design pressure, refer to equation (3.16)
Mk = Plastic bending moment resistance
Tk = Plastic axial force resistance
= Hoop buckling capacity
αc = Strain hardening factor (no greater than 1.2)
αc = (1-β)+ β
(3.31)
β ={
(
( (
(3.32)
={(
(
√
(3.33)
3.4.5 Accidental Limit State
During the operation, the riser can be subjected to irregular conditions which may come from
incorrect operations or unexpected loads. From that, the accidental limit state (ALS) is
introduced to avoid such disastrous accidents in the risers system due to unexpected loads, so
that a given accidental scenario will not lead to a complete loss of the integrity of the
structure. Accidental loads on the risers system are typically driven by unplanned
occurrences, which may be categorized into (not limited to) the following events (DNV,
2010a).
Fires and explosions
Impact or collisions, e.g. riser interference, dropped objects/anchors, floater impacts,
etc.
Hook or snag loads, e.g. dragging anchor
Failure of support system, e.g. heave compensating system malfunction, loss of
buoyancy, loss of mooring line, etc.
Exceedence of incidental internal overpressure
Environmental events, e.g. earthquake, tsunamis, iceberg, etc.
Risk analyses and relevant experiences are required in order to assess appropriate accidental
loads in terms of occurrence probability and other relevant issues. Furthermore, accidental
loads are dependent on influencing factors such as personnel qualifications, operational
procedures, arrangement of the installation, quality of equipment, safety systems and control
procedures (DNV, 2010a).
for D/t2<15
for D/t2<15
for D/t2<15
for Pld>Pe
otherwise

Master Thesis Feasibility Study of Selected Riser Concepts in Deep Water and Harsh Environment
Gilang Muhammad Gemilang 50
The design of accidental loads is then classified based on the annual probability of the
occurrences and the effect of an accidental event. The main purpose of this limit state is to
ensure that the riser system is able to withstand relevant functional loads in the extreme
condition and avoid disastrous failure that may cause a hazard, environmental damage and
financial loss.
Before proceeding to perform the ALS design check, the risers should already be checked to
satisfy the ultimate limit states design. In order to define the operational limit of the riser, a
service limit state (SLS) should also be introduced as well in compliance with riser‟s
functional requirements. DNV suggests a simplified design check for relevant value of load
effect factors depending on safety class and annual probability of occurrence. A simplified
check with respect to accidental load is shown in Table 3-7.
3.4.6 Serviceability Limit State
The service limit states are associated with sustainability of functional riser throughout its
service life. The determination of acceptable limit for normal operation is established based
on the specific functional requirement of riser system. There are some tools to ensure that the
riser can work properly, such as FMEA, HAZOP and design review meetings. These tools
will be a useful systematic procedure for SLS identification (DNV, 2010a).
However, not meeting SLS criteria will not lead to failure and such conditions should be
evaluated and monitored carefully to make sure that the riser will not exceed the ultimate
limit state (ULS) and accidental limit states (ALS). Consequently, ALS and ULS will be
defined in accordance with exceedence of SLS. The exceedance of SLS can be monitored by
maintenance, inspection and implementation of early warning for unpredicted occurrence.
The limitations of SLS are associated with deflections, vibrations, displacements and rotation
of global riser or ovalisation of the riser pipe. DNV outlines some limitations that need to be
controlled in the global riser design as follows.
Ovalisation limit due to bending
The ovalisation is a deviation of the perimeter of a round pipe section. This has the shape of
cross section as an elliptic cross section. The cross section of pipe should be prevented from
premature local buckling due to bending together with the out-of-roundness tolerance from
the fabrication of the pipe. The ovalisation of round pipe section is limited to 3.0% such that
the ovalisation fulfills following equation (DNV, 2010a).
0.03max mino
D Df
D
(3.34)
Riser stroke
Riser stroke is a term implying the movement of the tensioner at the top-end part of the riser.
A tensioner maintains relatively constant tension along the top part of the riser in order to
limit bending. A tensioner must continue to pull upward as the riser and floater move
relatively to each other. The travel of the tensioner is referred to as a stroke. Riser stroke
determines the input parameter for the tensioner, clearance and draw works. Riser strokes

Master Thesis Feasibility Study of Selected Riser Concepts in Deep Water and Harsh Environment
Gilang Muhammad Gemilang 51
should be designed with sufficient capacity to avoid damage to the riser and its components
(DNV, 2010a).
3.4.7 Fatigue Limit State
The riser system is subjected to cyclic loading during the entire service life, which might
cause fatigue damages. The fatigue damage due to cyclic loads should be calculated and
accumulated to predict the fatigue life of the riser. In the operating condition of the risers,
there are many fatigue sources contributing to failure damages to riser. Fatigue damage
sources include (DNV, 2010a):
Currents (VIV);
Waves (daily waves, extreme waves);
Vessel motions (first and second order);
Slugging.
Fatigue limit states are then suggested to ensure that the riser systems satisfy a minimum
requirement life-service of the riser. DNV suggests two assessments for calculating fatigue
damage as follows.
1. Method based on S-N curves
This method is an assessment of short-term distribution of nominal stress range. According to
DNV, the criterion of fatigue limit state design by considering S-N curves is written below
(DNV, 2010a):
(3.35)
Where
= Accumulated fatigue damage (Palmgren-Miner rule)
= Design fatigue factor, see Table 3-10
Table 3-10 Design Fatigue Factor
2. Methods based on fatigue crack propagation
Fatigue damage can be observed from crack propagation of riser parts. Consequently, the riser
should be designed and inspected so that the maximum expected initial defect size would not
grow to a critical size throughout its service life. DNV provides a formula to estimate fatigue
crack growth life as follows (DNV, 2010a).
1.0tot
cg
NDFF
N (3.36)
Where
= Total number of applied stress cycles during service or to in-service inspection
Low Normal High
3 6 10
Safety Class (DFF)

Master Thesis Feasibility Study of Selected Riser Concepts in Deep Water and Harsh Environment
Gilang Muhammad Gemilang 52
= Number of stress cycles necessary to increase the defect from the initial to the
critical defect size
= Design fatigue factor, refer to Table 3-10
3.5 Conclusion
WSD method is simple and easy to use by utilizing only one uniform safety factor under
particular condition. It has been used in the most of riser system design. However, this
method can lead to too conservative design of riser which is not economical. This fact leads
industry to find an alternative method in order to trade-off the total development cost and
reliability of riser design. On the other hand, the load and resistance factor design (LRFD)
promises more efficient design with various safety factors for each load and resistance. The
value of the safety factor is taken from relevant experience and knowledge to make riser
design reliable and economical.
For this thesis, the riser systems are designed based on the Load and Resistance Factor Design
(LRFD) method of DNV-OS-F201. The design check used in determining the wall thickness
is as the same as in DNV-OS-F101. The main reason for selecting this method is because the
LRFD method presents a more flexible and optimal design with various safety factors.
Thereby LRFD method is considered better than the WSD method. In summary, the design
criteria of LRFD method are considered in this study.

Master Thesis Feasibility Study of Selected Riser Concepts in Deep Water and Harsh Environment
Gilang Muhammad Gemilang 53
Chapter 4. Theoretical Background
4.1 Introduction
The purpose of this chapter is to present fundamental theories and understanding of riser
analysis. General summary of theoretical background related to riser analysis will be
discussed in order to enhance the understanding of riser design. The theoretical backgrounds
are limited to waves, currents, floater responses, hydrodynamic effects of slender structure
and soil-riser interaction.
4.2 Waves
4.2.1 Wave Parameters
The Wave is a major component in designing the environmental effects of offshore structures.
Waves can be generated in many ways, such as friction between the wind and the sea surface,
tides or by the earthquake/plate movement on the ocean floor. Wave theories are
approximations to actual waves. It is used to describe waves on mathematical expression
under given conditions that satisfy the assumptions made in relevant derivation. Waves that
occur in the sea surface are generally generated by the wind. When the wave is generated, the
force of gravity and surface tension will react to cause wave propagation. An ideal form of
small amplitude waves in deep water is sinusoidal. The most important parameters in
describing the waves are:
The wave length L = the horizontal distance between two peaks or two troughs waves
following each other.
The wave height H = the vertical distance between the wave crests and troughs. The
half of H is the same as amplitude of wave (a).
The wave period T = time taken to reach the wave trajectory.
The water depth d = the water depth where the wave propagated.
Other parameters, such as velocity and acceleration of water particles and wavelength can be
derived from wave theory. Other wave parameters are the angular frequency ω = 2π/T, the
wave number k = 2π/L, the wave celerity C = L/T = ω/k, the wave steepness ε = H/L, the
relative depth d/L, and the relative wave height H/d. Wave characteristics can also be defined
in terms of dimensionless parameters such as H/L, H/d, and d/L. Figure 4-1 shows a two
dimensional schematic of waves propagating in the x direction.
As shown in Figure 4-1, the highest point of the wave is the crest and the lowest point is the
trough. Although the ideal waveform is sinusoidal, the real wave formation on the water
surface is usually random; it is induced by so many waves with various wavelength (L), wave
height (H), wave period (T) and wave direction. Consequently, these waves can be seen as a
superposition of many regular harmonic wave components, each single wave has an
amplitude, length, period, frequency and direction as its own characteristic. For irregular
wave, normally significant wave height (Hs) and peak period (Tp) are the parameters to

Master Thesis Feasibility Study of Selected Riser Concepts in Deep Water and Harsh Environment
Gilang Muhammad Gemilang 54
represent the sea-state realizations. Wave energy spectra will be discussed to explain those
parameters.
Figure 4-1 Wave Characteristic (Dean and Dalrymple, 1984)
4.2.2 Regular Wave
The Regular waves are sinusoidal, small in amplitude, two-dimensional (2-D) and
progressively definable by wave height (H) and wave period (T) in a given water depth
(DNV, 2010b). The distance between any two corresponding points on successive sine waves
dedicates wave length and periods for measurement. Such points are also called zero-
crossings, and are used to detect in a wave record. Regular wave is divided in two categories,
which are linear wave and non-linear wave. Linear wave is referred to as the regular wave
with relatively small steepness, where the wave steepness is the ratio of wave height (H) and
wavelength (L). Non-linear wave is referred to as a regular wave with bigger steepness. It has
more peaked at the crest and flatter in the troughs (Nurwanto, 2012).
4.2.3 Irregular Wave
Actual sea surface hardly form an exactly linear (regular) wave or sine wave. Normally, the
waves in nature, have nonlinear character which has irregular and random shapes. This wave
is referred to as irregular wave. The irregular waves can be obtained by adding together many
regular waves of different frequencies, amplitudes and propagation directions. Most of the
waves are generated by wind friction, also called wind wave. Wind wave can be classified
into 2 categories:
Wind-induced wave
A sea waves are driven by prevailing local wind field, which is very irregular.
Swell
A swell is waves which have propagated out of the area of the local wind field. They
are no longer generated by the local wind and could even propagate for hundreds of
miles even to areas where no wind prevails. Individual swell wave can be regarded as
a regular wave with long period and small amplitude (Journée and Massie, 2001).

Master Thesis Feasibility Study of Selected Riser Concepts in Deep Water and Harsh Environment
Gilang Muhammad Gemilang 55
Random wave can be approached as a superposition of a number of regular waves. This
superposition allows one to predict very complex irregular behavior of the sea surface in
terms of theory of regular waves. This superposition method was introduced in
hydrodynamics by (St. Denis and Pierson, 1953), and is illustrated in Figure 4-2.
Figure 4-2 Superposition of Sinusoidal wave components (Journée and Massie, 2001)
To measure this randomness of ocean waves, the irregular wave theory applies statistical and
probabilistic theories with simplification method. One method is to transform the sea surface
into a summation of simple sine waves using Fourier theory to define new wave
characteristics in terms of the spectrum. The spectrum of the waves will be discussed in the
next section.
4.2.4 Wave Energy Spectrum
Every single wave in the wave train contains an amount of energy which is kinetic energy and
potential energy as written in following equation.
21
2E g H Per unit horizontal sea surface area (4.1)
These energies are characterized based on wave lengths, periods and heights. As mentioned
previously, ocean wave is a superposition of many regular waves and become irregular wave
with different wave height and periods. Consequently, this wave energy is different for every
individual wave. In order to quantify the energy of whole waves, the approach of energy
spectrum is introduced. In order to capture such energy spectrum, the investigation is carried
out based on wave observation.
Wave observation records the time history of every single wave. Hence the time history of the
divided wave period in time domain is transformed into a wave energy spectrum in the

Master Thesis Feasibility Study of Selected Riser Concepts in Deep Water and Harsh Environment
Gilang Muhammad Gemilang 56
frequency domain by using Fourier series analysis to obtain each frequency characteristic of
waves as shown in Figure 4-3. Fourier analysis showed that periodic function of δ(t) can be
characterized over the interval -T/2 < t < T/2 as the sum of infinite samples measured in the
interval periods of sinusoidal functions with harmonic wave frequencies (Journée and Massie,
2001).
Figure 4-3 Divided period of wave into some intervals (Journée and Massie, 2001)
The total period of the wave sample can be defined as follows:
N t (4.2)
It can be seen that every time shift has different amplitude δ(t). The height of the surface at a
selected location in the sea can be obtained by using Fourier analysis of the total
superposition of incidental regular wave amplitude. The Fourier series is described as follows:
1
2 2( ) [ cos sin ]o n n
n
n nt a a t b t
T T
(4.3)
Where
/2
/2
1( )
T
o
T
a t dtT
(4.4)
/2
/2
2 2( )cos
T
n
T
na t dt
T T
(4.5)
/2
/2
2 2( )sin
T
n
T
nb t dt
T T
(4.6)
Considering the wave process has averaged at mean sea level, thus ao = 0
1
2 2( ) [ cos sin ]n n
n
n nt a t b t
T T
(4.7)
After some trigonometric manipulations, the amplitude δ(t) can be written as follows:
1
( ) cos( )n n n
n
t t
(4.8)
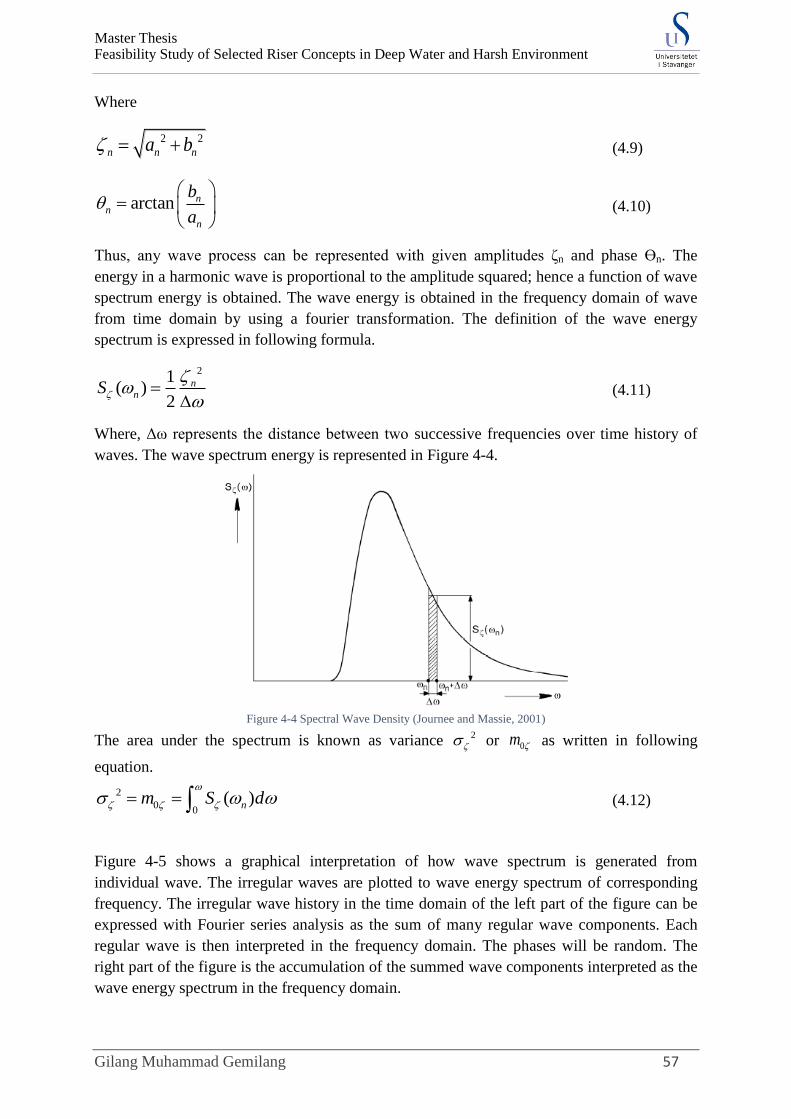
Master Thesis Feasibility Study of Selected Riser Concepts in Deep Water and Harsh Environment
Gilang Muhammad Gemilang 57
Where
2 2
n n na b (4.9)
arctan nn
n
b
a
(4.10)
Thus, any wave process can be represented with given amplitudes δn and phase ϴn. The
energy in a harmonic wave is proportional to the amplitude squared; hence a function of wave
spectrum energy is obtained. The wave energy is obtained in the frequency domain of wave
from time domain by using a fourier transformation. The definition of the wave energy
spectrum is expressed in following formula.
21
( )2
nnS
(4.11)
Where, Δω represents the distance between two successive frequencies over time history of
waves. The wave spectrum energy is represented in Figure 4-4.
Figure 4-4 Spectral Wave Density (Journee and Massie, 2001)
The area under the spectrum is known as variance 2
or 0m as written in following
equation.
2
00
( )n dm S
(4.12)
Figure 4-5 shows a graphical interpretation of how wave spectrum is generated from
individual wave. The irregular waves are plotted to wave energy spectrum of corresponding
frequency. The irregular wave history in the time domain of the left part of the figure can be
expressed with Fourier series analysis as the sum of many regular wave components. Each
regular wave is then interpreted in the frequency domain. The phases will be random. The
right part of the figure is the accumulation of the summed wave components interpreted as the
wave energy spectrum in the frequency domain.

Master Thesis Feasibility Study of Selected Riser Concepts in Deep Water and Harsh Environment
Gilang Muhammad Gemilang 58
Figure 4-5 Wave Record Analysis (Journée and Massie, 2001)
The value of the wave energy spectrum, ( )nS , are then plotted with corresponding
frequency. The statistical method is used to determine the irregular wave characteristics by
calculating the moments of the area under the spectrum. The order moment is identified with
“n” and the general formula for calculating spectrum moment is as follows.
0
( )n
n nS dm
(4.13)
This formula can be used for computing the area under the spectrum at n = 0, which is also
known as variance as shown in equation 4.12. Thus, some important wave parameters can be
obtained from spectral moments. Significant wave height (Hs) was introduced as four times
the root mean square of the area under the spectrum. Mean zero-crossing wave period is the
average time between successive crossings of the mean water level in an upward direction or
downward direction.
01/3 4H m = significant wave amplitude (Hs) (4.14)
0
2
2Z
m
mT
= mean zero- crossing wave period (4.15)
Wave spectrum represents the actual sea-state condition of a particular site. JONSWAP
Spectrum and the Pierson-Moskowitz Spectrum are types of wave spectrum. Both spectra
describe wind sea conditions that often occur in the most severe sea-states (DNV, 2010b). The
type of the spectrum is selected based on the characteristic of the sea-state condition at given
location. Pierson Moskowits spectrum assumed that if the wind is steady over a long time and

Master Thesis Feasibility Study of Selected Riser Concepts in Deep Water and Harsh Environment
Gilang Muhammad Gemilang 59
a large area, it is originally proposed for fully-developed sea, which is most typically
happened in “large water area” such as Gulf of Mexico, North Atlantic and Offshore Brazil.
Based on DNV, The Pierson Moskowitz spectrum ( )pmS can be expressed mathematically in
following equation.
4
2 4 55 5( )
16 4pm p
p
S Hs
(4.16)
Where 2
p
pT
= the angular spectral frequency (4.17)
Meanwhile, the JONSWAP spectrum is applied for relatively “small water area” or “fetch
limited area” such as North Sea. This was resulted from an extensive wave measurement
known as Joint Operation North Sea Wave Project. JONSWAP is the modification of Pierson
Moskowitz (PM) spectrum with typically high non-dimensional peak shape parameter in
some frequency where most the frequency of the wave occurs. For peak shape parameter (ϒ)
= 1, the JONSWAP spectrum is equal to Pierson Moskowitz (PM) spectrum. Based on DNV,
JONSWAP spectrum ( )jS can be expressed mathematically in following equation.
exp 0.5
( ) ( )
p
p
j pmS A S
(4.18)
Where
A = 1 - 0.287 ln(γ) (a normalizing factor)
( )pmS = Pierson Moskowitz Spectrum
= Non-dimensional peak shape parameter, according to DNV-RP-C205, if no
particular peak shape parameter is given, the relation between the significant wave height and
peak period should be applied to define peak shape parameter.
= 5 for
√ ≤ 3.6
= (
√ for 3.6 <
√ < 5
= 1 for 5 <
√
σ = Spectral width parameters
σ = 0.07 for ω ≤ ωp
σ = 0.09 for ω > ωp

Master Thesis Feasibility Study of Selected Riser Concepts in Deep Water and Harsh Environment
Gilang Muhammad Gemilang 60
4.3 Currents
The current has a profile over the water depth. Generally, profile and direction of the current
will be selected using the best statistics available. Based on DNV, Currents generally occur
from contribution of current components as follows (DNV, 2010b).
Tidal current Vc,tide,
Tidal Current is generated by astronomical motions of other gravitational objects.
Wind drift current Vc,wind,
Wind drift current is generated by wind stress and atmospheric pressure over sea
surface.
Density induced/ Soliton current Vc,sol,
This current is generated by different density.
Global ocean/ circulation current Vc,glob,
This current is generated by the global ocean circulation in large scale, e.g. Gulfs
stream.
Loop and eddies current Vc,eddy.
This current is swirling water that can penetrate deeply in the sea column.
Current flow in the horizontal direction is assumed to vary with depth. The magnitude and
direction of tidal currents on the surface are usually determined based on measurements at the
site. For the design purpose, the total incidental current velocity Vc,tot should be taken as the
vector sum of each current component as expressed in equation (4.19). If the current data of
particular site is not available, DNV suggests following equation (DNV, 2010b).
, , , ..( .) ) .(c tot c tide c windz V zV z V (4.19)
, ,( ) (0) oc tide c tide
o
d zV z V
d
(4.20)
, ,( ) (0)c wind c wind
d zV z V
d
(4.21)
Where
Vc,tot(z) = Total current velocity at level z
z = Distance from still water level, positive upwards, negative downwards
Vc,tide(0) = Tidal current velocity at still water level
Vc,wind(0) = Wind drift current velocity at still water level
d = Water depth at given location
do = Reference depth, taken as 50 m above still water level
α = Exponent, typically 1/7

Master Thesis Feasibility Study of Selected Riser Concepts in Deep Water and Harsh Environment
Gilang Muhammad Gemilang 61
4.4 Floater Responses
The motion of the floating structure is a response to external loading depending on its
characteristic shape. The motion of the free-floating structure comprises 6 degrees of freedom
with reference to the center of gravity point (COG). The six degrees of freedom comprises 2
orientations; translational motion and rotational motion. Figure 4-6 shows the direction of six
(6) degrees of freedom.
1. Translational motion
- Surge, transverse movement direction of the x-axis
- Sway, transverse movement direction of the z-axis
- Heave, transverse movement direction of the y-axis
2. Rotational motion
- Roll, rotational movement of the x-axis
- Pitch, rotational movement of the y-axis
- Yaw, rotational movement of the z-axis
Figure 4-6 Six Degree of Freedom of the vessel (Calqlata, 2015)
Irregular waves contain the energy distribution over the wave frequencies which can be
interpreted as a wave energy spectrum. The wave energy spectrum is an input to a system that
possess linear characteristics of waves. As the wave passes through the floater, the output of
the system is the motion of the floater as a response to wave. The responses of the floating
structure can also be interpreted as a response spectrum. The schematic diagram of this
system is shown in Figure 4-7.

Master Thesis Feasibility Study of Selected Riser Concepts in Deep Water and Harsh Environment
Gilang Muhammad Gemilang 62
Figure 4-7 Schematic System of Motions and Waves (Journee and Massie, 2001)
This floater motion has an irregular behavior just as the irregular wave that causes the motion.
According to Journée and Massie (2001), by knowing the wave energy spectrum and
characteristic response of floater motion, the response spectrum of floater can be obtained.
The motion of the floater is categorized into two types of motion; first order and second order
motion. The first order of the motion components of a floating structure is referred to as wave
frequency, while the second order of the motion components of floating structure is referred
to as slow drift motion or low frequency.
1. Wave Frequency (WF)
These are the response of floater moving at short period as a result of direct consequence of
first order wave actions. Response Amplitude Operator (RAO) is a transfer function that can
convert the function of wave forces into motion of a floating structure. The RAO data are
dimensionless parameter to determine harmonic motions of floater in six degrees of freedom,
both translational and rotational. The RAO origin is at the center of gravity of the floater.
RAO is a transfer function for transforming wave energy spectrum to response spectrum. The
transformation of the spectrum can be explained in following equation.
2
( ) ( ) ( )az
a
zS S
(4.22)
Where
( )zS = Motion energy spectrum
( )S = Wave energy spectrum
az = Heave amplitude
a = Wave amplitude
The principle of the transformation of wave energy spectrum to response spectrum can be
described in the following figure.

Master Thesis Feasibility Study of Selected Riser Concepts in Deep Water and Harsh Environment
Gilang Muhammad Gemilang 63
Figure 4-8 Principle of Transfer of Waves into Vessel Response (Journée and Massie, 2001)
2. Low Frequency (LF)
These are floater motions as a result of second order wave effects and wind gust loading. This
motion is also called slow drift motion, since it takes longer periods ranging from 30 to 300
seconds (DNV, 2010a). The second order determines the offset of the floater during its
service life. The following are types of floater offset position (Nurwanto, 2012).
Mean offset: Mean offset is the initial position of the floaters.
Near offset: the floater is displaced along the plane of the riser towards the touchdown
point.
Far offset: the floater is displaced along the plane of the riser away from the
touchdown point.
Cross offset: the floater is displaced perpendicular to the plane of the riser.
4.5 Hydrodynamic Effects on Slender Cylinder
Riser is considered as slender members with cross-sectional dimensions. The diameter of the
riser is sufficiently small to allow the gradients of velocity and acceleration of water to be
neglected (DNV, 2010b). Consequently, the hydrodynamic force on the riser can be
calculated with the Morison equation. The Morison equation is an empirical formula of the
fluctuating force of fluid flow. The following are some condition for the Morison equation.
1. The outer diameter of the riser (D) should be smaller than the wavelength (L). The
criteria that are described in following formula,
, where D is the diameter of the
slender structure and L is the wavelength. If the diameter is larger than the

Master Thesis Feasibility Study of Selected Riser Concepts in Deep Water and Harsh Environment
Gilang Muhammad Gemilang 64
wavelength; then the diffraction effect has to be used instead in order to find total
wave force imposing the slender structure.
2. The wave will not break at the pile with following criteria
1
7
H
L
, where H is wave
height and L is wave length. If a wave breaks at the slender structure, then we must
use the slamming coefficient instead.
3. The riser should not move significantly, when the wave hit the riser. The riser is
assumed to be not significantly moved if it satisfies the following criteria
,
where “a” is the displacement of the riser and D is the outer diameter of the riser.
In conclusion the Morison equation can be applied, if the wave is not affected by the presence
of the riser body. Morison equation consists of two components; drag force and inertia force.
The drag force is induced by friction between the fluid and cylinder and the difference of
pressure between upstream and downstream side.
The inertia force is related to newton‟s second law where forces result from accelerations. The
total hydrodynamic force acting in the same direction is the sum of the drag force and inertia
forces. In addition to hydrodynamic forces, the lift force is also involved in terms of loading
to the riser. The lift force is perpendicular to the oncoming flow direction. The lift force is
induced by the difference of pressure around the riser. According to the direction of the
hydrodynamic force acting on the riser, hydrodynamic loading can be divided into two
components; the tangential force (Ft) and the normal force (Fn). The description of tangential,
normal and lift force of hydrodynamic forces is shown in Figure 4-9.
Figure 4-9 Definition of normal force, tangential force and lift force (DNV, 2010b)
DNV suggests suitable Morison equations for the slender cylinder in normal direction and
tangential direction (DNV, 2010a).
| |
(
(4.23)
| |
(
(4.24)
Where
= Force per unit length in normal direction (N/m)
= Force per unit length in tangential direction (N/m)

Master Thesis Feasibility Study of Selected Riser Concepts in Deep Water and Harsh Environment
Gilang Muhammad Gemilang 65
ρ = Water density (Kg/m3)
= Drag coefficients in normal direction
= Drag coefficients in tangential direction
= Inertia coefficients in normal direction
= Inertia coefficients in tangential direction
= Hydrodynamic diameter (m)
= Buoyancy diameter (m)
= Flow velocity in normal direction (m/s)
= Flow velocity in tangential direction (m/s)
= Flow acceleration in normal direction (m/s2)
= Flow acceleration in tangential direction (m/s2)
= Structural velocity in normal direction (m/s)
= Structural velocity in tangential direction (m/s)
= Structural acceleration in normal direction (m/s2)
= Structural acceleration in tangential direction (m/s2)
The value of CD, CL and CM is practically taken from the experiment for appropriate value,
since the coefficients are determined from several parameters that are listed below.
1. Riser body shape
The value of Inertia and Drag coefficients of three dimensional objects depends on the
shape of the structure. In this case, the shape of riser is a cylinder. DNV suggests such
coefficients for steady flow in DNV-RP-C205 at Appendix D and Appendix E, (DNV,
2010b);
2. Reynold Number (Re)
Where U is the flow velocity, D is the outer diameter and v is the kinematic viscosity;
3. Keulegan Carpenter number (KC)
Where UM the free stream velocity amplitude of the oscillatory flow, T is the period of
oscillatory flow and T is the period of oscillation;
4. Roughness ratio (ε)

Master Thesis Feasibility Study of Selected Riser Concepts in Deep Water and Harsh Environment
Gilang Muhammad Gemilang 66
Where k is the dimension of roughness on riser body and D is the outer diameter of
the riser. The number of k may change over some periods of time due to marine
growth;
5. Reduced velocity (VR)
Where U is the velocity of the flow, fn is the natural frequency of the riser and D is the
outer diameter of the riser.
4.6 Soil-Riser Interaction
The soil riser interaction can influence the extreme response and fatigue performance of the
riser at the touchdown point (TDP) since the TDP is a critical part of the design of the riser.
The TDP moves over time, reflecting movements of the vessel and riser configuration. The
heave motion of the floater may induce in-plane loads; while lateral loads from current and
waves may induce out-of-plane loads. The oscillatory of those loads might become a complex
interaction between riser movement and the seabed at the touchdown point (TDP).
The oscillatory of those loads might make riser penetrate into the soil and thereby increasing
the soil resistance (Karunakaran et al., 2005). Thus, it is important to model soil properties as
accurately as possible to represent the actual condition of the soils in order to obtain correct
predictions of soil-riser interaction. In practice, the soil-riser interaction is commonly
quantified as a linear spring (Bai and Bai, 2010a). In this study, the soil will be modeled by
using the friction coefficient assigned in the axial and lateral directions relative to the
longitudinal axis of the riser.

Master Thesis Feasibility Study of Selected Riser Concepts in Deep Water and Harsh Environment
Gilang Muhammad Gemilang 67
Chapter 5. Design Basis
5.1 Introduction
The design data and methodology that is applicable for the analysis of selected riser concepts
are provided in this chapter. It has been decided that three types of selected riser concepts be
analyzed in respect of riser performances during operating conditions. The objective of this
study has therefore been to investigate the three riser concepts in terms of the capability to
cope with vessel motion. The reader will refer to Chapter 4 for theoretical backgrounds that
are related to this thesis work (e.g. waves, current and floater responses).
The design data is the basis for modeling, analyses and verification of the riser behavior in
deep water field. The riser configuration will be designed and optimized in order to satisfy
both strength and fatigue requirement. The analysis utilizes the finite element method in the
computer modeling with non-linear time domain analysis. The analysis model will be
performed by using the ORCAFLEX Software (Version 9.7a), a proven offshore marine
systems program developed by Orcina which has the capability to perform static and dynamic
analysis of risers (Orcina, 2010). Detail description of ORCAFLEX program is provided in
Appendix C.
5.2 Global Analysis
Global analysis of the riser is performed to verify the strength design of riser against the
global load effects. The global analysis will be based on accepted principles of model
discretization, environmental loading, soil properties and material properties to determine
reliable global load effects on the riser system (DNV, 2010a). The riser model comprises
accurate modeling of mass, stiffness, damping and hydrodynamic load effects along the entire
riser length and boundary conditions of top and bottom connection (DNV, 2010a). The riser
model will be discretized with sufficient number of segments and nodes to represent actual
riser. The global analysis consists of static analysis and dynamic analysis.
The static analysis determines the equilibrium configuration of the system under functional
load such as self-weight, buoyancy, hydrostatic effect, etc. The result of static analysis is used
as an initial configuration for dynamic simulation. The dynamic analysis run motions of the
model over specified periods, starting from the position derived by the static analysis (Orcina,
2010). The period of dynamic simulation is defined as a number of consecutive stages.
According to DNV, the scope of global analysis will include a global cross section description
in relationship of resulting force-displacement. The output of global response analysis is
categorized as follows (DNV, 2010a):
Resulting cross-sectional forces, e.g. effective tension, bending moments, torsional
moment;
Global riser deflections, e.g. curvature, elongation, angular orientation;
Global riser position, e.g. co-ordinates, translations, distance to other structures,
position of touchdown point on the seafloor, and
Support forces at termination to rigid structures, e.g. resulting force and moments.

Master Thesis Feasibility Study of Selected Riser Concepts in Deep Water and Harsh Environment
Gilang Muhammad Gemilang 68
5.2.1 Static Analysis
As explained earlier, the static analysis is performed to establish static equilibrium
configuration of the riser as the initial point for dynamic simulation. The static analysis
establishes the static equilibrium configuration under functional loadings such as weight,
buoyancy, hydrostatic effect and top tension. The riser configuration will be evaluated to
remain intact with both riser terminations at top and bottom. Based on ORCAFLEX manual,
static equilibrium is established in a series of iterative stages (Orcina, 2010):
1. At the start of the calculation, the initial positions and connection of the vessels, lines and
buoys are defined by the data.
2. The equilibrium configuration for each line is calculated based on the type of line ends.
3. The out of balance load acting on each free body is calculated. Thereby a new position of
each free body is estimated. The free body includes node, buoy, etc. The process is repeated
until the out of balance load on each free body is zero.
In most cases, the static analysis process is very fast and reliable. Sometimes, for very
complex systems with numerous free bodies and many interconnections, convergence may
take long time. The static analysis can also be considered as a steady state analysis. Static
riser analyses will be performed by using a nonlinear finite element method. Based on DNV,
basic loading of finite element method is distinguished into following components (DNV,
2010a):
1. Volume forces
The static equilibrium configuration of riser in water is influenced by the weights of the riser,
the hydrostatic loadings (e.g. hydrostatic pressure and buoyancy) and fluid contents. Based on
Baltrop, the static equilibrium configuration can be calculated by using the simplified method
of effective tension and the effective weight (Baltrop, 1998). Figure 5-1 displays the
equilibrium conditions of a curved segment of riser under the volume forces. The weight and
tension of the riser are then altered to effective weight and effective tension respectively. The
equation for effective weight and tension are shown below:
Where
γ = Weight density
A = Cross sectional area
P = Pressure
T = Tension
ρ = Density
W = Weight
i = Internal
o = External

Master Thesis Feasibility Study of Selected Riser Concepts in Deep Water and Harsh Environment
Gilang Muhammad Gemilang 69
s = Structural
t = True
Figure 5-1 Effective weight and effective tension (Baltrop, 1998)
2. Specified forces
Specified forces are used for the system where additional forces are applied to the riser. An
example of specified force is applied top tension. Normally, the applied top tension is used for
top tension risers (TTRs) system which provides tension at the top of riser to keep the riser
under particular tension state, and to avoid compression force which might lead to excessive
buckling. For selected riser in this study, the top tension force of riser is only provided from
the self-weight of the riser without applying tension at the top. The applied tension force may
only exist on installation stage. Therefore, in this study, specified forces are not considered.
3. Prescribed displacement
Prescribed displacement is identified as displacement at the supports from a stress free
location into the specified positions. The prescribed displacement is then applied to establish
the displacement at the boundary conditions of riser by iterative approach.
4. Displacement dependent forces
Displacement dependent forces are the current load. The steady current is applied to the riser
to obtain the final position of static equilibrium which includes the current load effect.
5.2.2 Dynamic Analysis
Dynamic analyses of the riser are performed considering excitation force due to current, direct
wave, low frequency (LF) and wave frequency (WF) floater motions. The WF floater motions

Master Thesis Feasibility Study of Selected Riser Concepts in Deep Water and Harsh Environment
Gilang Muhammad Gemilang 70
are calculated by using corresponding RAO data. The LF floater is the effect of average
environmental forces to the floater as described in section 4.4. Combined WF and LF should
be considered in dynamic analysis. LF floater motions are represented as fixed offset
positions of the floater to account for average environmental forces (DNV, 2010a).
The combination of interactions between floater motions, riser configuration and
environmental loadings produces nonlinearities in the riser system. To solve these problems,
the dynamic finite element method is commonly used to describe the nonlinearities. The
nonlinear effects which are considered in dynamic analysis are as follows (DNV, 2010a):
Inertia forces
Geometric stiffness
Nonlinear material properties
Damping forces
External forces (time-dependent) (e.g. hydrodynamic loading)
Contact issues (e.g. bottom contact, riser collision, vessel contact, etc.)
The finite element method will be performed by using ORCAFLEX software. ORCAFLEX
uses a finite element model as the basic concept of modeling. A single length of pipe
comprises the model of several nodes and segments with boundary of end A and B. Figure
5-2 shows the general ORCAFLEX line model. Each node is connected with two straight
segments. Each segment has the properties of mass, weight, buoyancy, drag, stiffness and
other properties to represent riser sections.
Figure 5-2 Line Model in ORCAFLEX (Orcina, 2010)
Forces and moments are applied at the nodes. Each segment is represented as two co-axial
telescoping rods that are connected by axial and torsional spring and dampers. The bending
properties of the line are represented by rotational spring and dampers at each end of the
segment (Orcina, 2010). According to d„Alemberts principle, the equilibrium of inertia forces,

Master Thesis Feasibility Study of Selected Riser Concepts in Deep Water and Harsh Environment
Gilang Muhammad Gemilang 71
damping forces and forced oscillations to each node of structural riser can be described by the
equation of dynamic equilibrium:
(
Where
= Matrix of nodal displacement vectors
= Matrix of nodal velocity vectors
= Matrix of nodal acceleration vectors
M = System mass matrix
C = System damping matrix
K = System stiffness matrix
F(t) = System external forces (time-dependent)
The dynamic analysis is performed over specified periods, starting from the position derived
from the static analysis. The period of simulation is defined as a number of consecutive
stages. Before the main simulation stage, there is a build-up stage, during which the wave and
vessel motions are smoothly ramped up from zero to fully develop.
This provides a gentle start and reduces the transients that are generated from a static position
to full dynamic motion. This build-up stage is numbered as 0 and its length should normally
be set to at least one wave period. The build-up stage is followed by stage 1 until the end of
simulation time (Orcina, 2010). The period of simulation is determined by user considering
the time origin of environmental loads. Normally, the time origin of environmental loads is
set to be zero, so all of the time frames coincide with global time.
In addition, nonlinearities are important for the statistical response characteristics of the riser
system exposed to irregular loading (DNV, 2010a). Time domain analysis is the method of
analysis to capture the prediction of extreme response of irregular loading. The appropriate
treatment of nonlinearities components is then important to design criteria. DNV suggests
some available features to solve nonlinearities for dynamic analysis as follows.
Nonlinear time domain analysis
Nonlinear time domain analysis utilizes Newton-Rapshon method for step by step numerical
integration of the incremental dynamic equilibrium equations. The non-linearities of stiffness,
damping, inertia and external force are then evaluated at each step to dynamic solution. The
nonlinear approach will give a sufficient description of all nonlinear effects. Hence the
nonlinear approach gives a good representation of a possible non-Gaussian response.
Nonlinear time domain analysis is then appropriate for irregular analyses to estimate extreme
responses with adequate statistical confidence (DNV, 2010a).

Master Thesis Feasibility Study of Selected Riser Concepts in Deep Water and Harsh Environment
Gilang Muhammad Gemilang 72
Linearized time domain analysis
Linearized time domain analysis utilizes linearization of the dynamic equilibrium equations
including stiffness, damping and inertia forces at the static equilibrium position.
Consequently, the system stiffness, damping and mass matrices are set to be constant
throughout the analysis. The linearized time domain provides a good representation for the
system where hydrodynamic loading is the major nonlinear contribution (DNV, 2010a).
Frequency domain analysis
Frequency domain analysis linearizes stiffness, damping, inertia and external forces at the
static equilibrium position. The irregular analysis is performed by using stochastic
linearization for combined loading (i.e. wave, current). Frequency domain analysis provides a
Gaussian distribution in the response spectrum. In general, it is not recommended for extreme
response prediction (DNV, 2010a).
From all features given above, for riser strength analysis in deep water field and harsh
environmental condition where irregular analyses are required to estimate extreme responses
with adequate statistical confidence, nonlinear time domain analysis is then selected for this
study. The time for this method can be managed by varying the length of each segment along
different region of the riser. A critical area of the riser will be discretized with shorter
segments to provide detail result analysis.
5.3 Environmental Data
5.3.1 Water Depth
In this study, the water depth of 1500 m is selected with a constant sea water density of 1025
kg/m3 and temperature of 10
oC. The term of deep water refers to water depths of more than
500 m, and ultra-deep water refers to water depths of more than 2000 m (Bai and Bai, 2010b).
The water depth of 1500 m is then classified as deep water.
5.3.2 Waves
As the purpose of this study is to investigate the limitation of selected riser concepts in terms
of capability to cope with vessel motion, thus the different load cases are applied in order to
generate different vessel motions. The load cases comprise wave data and current data. The
various wave data have been selected for case study. The extreme sea-state is modelled by
irregular waves, using modified JONSWAP spectrum, which characterizes the North Sea
condition in this study. The sea water area in this study is then considered as fetch limited
area.
The JONSWAP spectrum requires information about the significant wave height (Hs) and
spectral peak period (Tp) to complete the simulation of irregular wave, while the peak shape
parameter (ϒ) is determined by relationship formula of wave height (Hs) and peak period
(Tp) as described in section 4.2.4 and in equation 4.18. The significant wave height (Hs) is
ranging from 4 m to 18 m with a uniform peak period (Tp) of 16 seconds.

Master Thesis Feasibility Study of Selected Riser Concepts in Deep Water and Harsh Environment
Gilang Muhammad Gemilang 73
Table 5-1 presents the selected Hs and Tp values with corresponding peak shape parameters
for this study.
Table 5-1 Wave Data
Wave
Characteristics
Hs (m) Tp (s) ϒ
Load Case 1 4 16 1
Load Case 2 5 16 1
Load Case 3 6 16 1
Load Case 4 7 16 1
Load Case 5 8 16 1
Load Case 6 9 16 1
Load Case 7 10 16 1
Load Case 8 11 16 1.224
Load Case 9 12 16 1.550
Load Case 10 13 16 1.909
Load Case 11 14 16 2.298
Load Case 12 15 16 2.715
Load Case 13 16 16 3.158
Load Case 14 17 16 3.623
Load Case 15 18 16 4.108
5.3.3 Current
The current data in this study follow a typical current profile in the North Sea. The current
profile is a function of current velocities over water depth which is maximum at the sea-
surface and minimum at the bottom. For extreme response analysis, current profiles for 10-
year return period in North Sea is considered as shown in Table 5-2.
Table 5-2 Current Profile
Water depth 10-year current
m m/s
0 1.65
-50 1.26
-100 1.25
-200 1.09
-300 0.83
-400 0.74
-500 0.43
-600 0.6
-800 0.6
-1000 0.55
-1200 0.55
3 m above the seabed 0.46

Master Thesis Feasibility Study of Selected Riser Concepts in Deep Water and Harsh Environment
Gilang Muhammad Gemilang 74
5.3.4 Hydrodynamic Coefficient and Marine Growth
The Morison equation is applied to calculate the hydrodynamic load from the waves and
current to the riser body. As discussed in chapter 4, the hydrodynamic coefficient is required
to complete the calculation of hydrodynamic loads. Both appropriate drag and inertia
coefficients should be chosen to obtain the accurate hydrodynamic load effects on the riser
body. The drag and inertia coefficient is then defined based on several parameters that are
listed in section 4.5 (i.e. Reynolds number, Keulegan-Carpenter number, reduced velocity,
body shape and the surface roughness of a structure).
Constant value of drag coefficient can be conservatively used over the entire depth.
According to DNV, for cylindrical plain pipes, drag coefficient between 0.7 and 1.0 and an
inertia coefficient of 2.0 can be used. The conservative approach is adopted for safe design,
and therefore the value is kept constant over the entire depth. During service life, the effect of
marine growth may appear and result in an increase in hydrodynamic load. In this study, the
effect of marine growth is considered to be covered by the selected hydrodynamic coefficient
conservatively. The drag, added mass and inertia coefficient are denoted CD, CA and CM
respectively. The selected hydrodynamic coefficients in this thesis work are presented in
Table 5-3. The added mass coefficient is taken as inertia coefficient minus one as described in
the following expression.
Table 5-3 Hydrodynamic Coefficient
Coefficient Types Value
Drag Coefficient, CD 1.1
Inertia Coefficient, CM 2.0
Added Mass Coefficient, CA 1.0
5.3.5 Soil-riser Interaction
As discussed in the section 4.6, the soil-riser interactions are modeled by linear soil stiffness
and friction. The appropriate friction coefficient and soil stiffness are then selected to
accurately model the interaction between the riser and the seabed. The selected soil
parameters are shown in Table 5-4.
Table 5-4 Soil Parameters
Parameter Value
Normal friction parameter 0.5
Axial friction coefficient 0.3
Horizontal lateral/axial soil stiffness 200 kN/m2
Vertical soil stiffness 50 kN/m2

Master Thesis Feasibility Study of Selected Riser Concepts in Deep Water and Harsh Environment
Gilang Muhammad Gemilang 75
5.4 Vessel Motion Characteristic
5.4.1 Coupled and De-coupled analysis
Riser‟s dynamic responses are highly dependent on vessel motion as a response to
environmental loading. The top end of the riser is attached to the vessel at the hang-off point
so that the motion of the top end of the riser will follow the vessel motion. Slender structures
such as mooring lines, tether and riser system are tied back to the vessel. Thus, the vessel will
respond to environmental loads and also be influenced by the damping of these structures.
Thereby combinations of dynamic behavior between floater, mooring and riser system consist
of an integrated dynamic system in a complex way (DNV, 2010a).
The effect of mooring lines, tethers and risers may significantly influence the vessel motion.
This is usually referred to as coupling effect. The coupled analysis considers the interaction
between the hydrodynamic behavior of the vessel, mooring lines, tethers and risers in
response to environmental loads (Rodrigues et al., 2008). Coupled analysis is expected to give
less vessel motion if compared to vessel motion obtained from de-coupled analysis.
Therefore, the coupled analysis is considered to be a more accurate analysis, optimum and
less conservative method (Rodrigues et al., 2008). However, coupled analysis requires
comprehensive computational effort. Meanwhile, in de-coupled analysis, vessel motion is not
influenced by the dynamic behavior of the mooring lines and risers.
The de-coupled analysis considers the WF floater motion as dynamic excitation of the wave
and the LF floater motion as vessel offset quasi-statically. The specific vessel offsets are
considered as a representation of the LF effect. In summary, the WF floater motions will be
defined by Response Amplitude Operations (RAOs) data of floater, while the LF floater
motions will be defined by specific vessel offsets in de-coupled analysis. As the objective of
this study is to investigate the limitation of the selected riser concept in terms of capability to
cope with vertical velocity at the hang-off point, then de-coupled methodology is then
sufficient for achieving the objective. Therefore, de-coupled methodology will be considered
in this study.
5.4.2 Host Platform Selection
The WF floater motion and LF floater motion are based on the type of the floater. There are
many types of floater used in deep water application such as FPSO, TLP, Semi-submersible,
SPAR as shown in Figure 5-3. Floater motion is the main driver for riser‟s selection and
design. In this section, the type of floater will be discussed and selected for this study.
FPSOs
FPSOs have been successfully installed in shallow waters in harsh environments, and in deep
and ultra-deep waters in benign environments (Olufsen et al., 2003). FPSOs geometry is like a
big vessel. In conjunction with turret mooring, FPSOs have the ability to weather-vane with
environmental load passively or actively. FPSOs are sensitive to wave since it has a natural
period of heave in the range of the period of the wave in typical sea energy as the
consequences of having large area crossing with water area. FPSOs have very large horizontal
offset and is very sensitive to surge and sway excitations as the consequences of its low

Master Thesis Feasibility Study of Selected Riser Concepts in Deep Water and Harsh Environment
Gilang Muhammad Gemilang 76
viscous hull damping (DNV, 2010d). In summary, FPSO is hardly suitable for SCR in deep
water and harsh environment, and therefore the FPSO is not considered for this study.
TLP
TLPs have been successfully installed in water depth up to 1500 m in Magnolia field in
benign environments, and in water depths up to 350 m in harsh environments (Odland, 2013).
The tendon, or also called as tension leg, is the vertical tether with certain tensioning capacity,
which is connecting TLP to seabed. The tendon is designed such that TLP has a smaller
natural period of heave (less than 4 seconds) than typical wave periods to avoid resonance
with sea energy.
Figure 5-3 Floating Production System (DNV, 2010a)
SPARs
SPARs have been successfully deployed in deep and ultra-deep water, with a current record
of up to 2500 m water depth in the Perdido field (Odland, 2013). SPARs have cylindrical hull
as deep draft supporting the deck, which is encircled by helical strokes to avoid VIV effects
on structures. SPAR is typically installed in very deep waters and is permanently moored to
the seabed with the spread mooring system. The deep draft design of spars makes SPAR less
affected by wind, wave and currents and allows for both dry tree and wet tree of the subsea
production. The center of gravity of SPAR is lower than the center of buoyancy of SPAR,
giving it a good stability (Orimolade, 2014). SPARs typically have a long natural period of
heave thus avoiding resonance with sea energy.
Semi-submersible
Semi-Submersibles have been installed in water depths of more than 2000 m in benign
environments, and in water depths of up to 300 m in harsh environments. Semi-submersibles
have good motion characteristics and are used for both drilling and production (Odland,
2013). Semi-submersibles have natural periods of heave above the typical natural wave

Master Thesis Feasibility Study of Selected Riser Concepts in Deep Water and Harsh Environment
Gilang Muhammad Gemilang 77
periods range to avoid resonance with sea energy, making them an attractive choice for deep
water development.
Semi-submersibles comprise a number of semi-submerged circular columns and horizontally
extending pontoons being immersed as the drafts. In order to improve the stability, Semi-
submersible‟s circular columns have to be designed with a large diameter, however,
increasing the diameter size may result in reducing heave natural period. Thus, it is important
to trade-off the diameter size of circular columns to improve stability and also ensure that
heave natural period of Semi-submersible above the typical natural wave periods range.
By considering the trend of floater type for SCR application, the selected host platform for
this study is semi-submersible. In summary, Figure 5-4 is presented to see the differences of
each floater‟s heave natural period against typical natural wave periods range.
Figure 5-4 Floater Motion Comparison
5.4.3 Wave Frequency (WF) Floater Motion
The wave frequency floater motions are a direct consequence of first order wave forces acting
on the floater which can be interpreted as vessel motion in 6 degrees of freedom, both
translational and rotational. Basically, the wave frequency floater motion can be simply
converted from wave characteristics to floater motion by using Response Amplification
Operator (RAO) as discussed in section 4.4. The RAO origin is located at the center of gravity
of the floater. The RAO data of the Semi-submersible for this study is confidential and is
therefore not given in this thesis report, however.
5.4.4 Low Frequency (LF) Floater Motion
The LF floaters motions, or also called as slow drift motion, are related to horizontal motions
as the floater moves from the initial position to specific offset position. In this study, together
with the mooring system, the offset of Semi-submersible is set to be 8% of water depth for

Master Thesis Feasibility Study of Selected Riser Concepts in Deep Water and Harsh Environment
Gilang Muhammad Gemilang 78
intact condition (ULS design) and 10% of water depth in the case of one mooring line failure
(ALS design). The term “damage” refers to ALS design, while the term “intact” refers to ULS
design. The following vessel offsets are used in the strength analysis.
Operation Condition – Intact mooring : 120 m
Accidental Condition – One mooring line broken : 150 m
5.5 Riser Data
5.5.1 Riser Wall thickness
The wall thickness of the riser is calculated in the design stage. The DNV-OS-F201 will be
used as reference for calculating minimum required wall thickness. The minimum required
wall thickness is determined in accordance with ultimate limit state (ULS) design. All pipe
cross sections are designed to adequately withstand internal pressure and external pressure to
meet burst criteria and collapse criteria respectively. The pipes may also be designed to
satisfy minimum wall thickness requirements to withstand buckling propagation. Normally,
the wall thickness requirement from criteria of buckling propagation is relatively too thick
than the criteria of burst and collapse.
It is therefore not economical to design riser that has the ability to avoid propagating buckling
over entire riser length. Thus, the minimum wall thickness requirement of propagating
buckling can be taken care by keeping local buckle remains local and does not lead to
successive propagating buckle to the neighboring pipe sections. In practice, the method to do
that is by using buckle arrestor at some critical regions of the riser. In addition to the final
wall thickness, the corrosion allowance of 3 mm and the fabrication allowance of 2.5 mm will
be included in the wall thickness calculation.
The appropriate parameters will be chosen according to DNV-OS-F201, such as safety class
resistance, load effect factors, de-rating factor and material resistance factor which are listed
in chapter 3. Based on the design basis requirement, an internal pipe diameter of 10 inches is
required to provide a means of transportation of hydrocarbon fluids from the subsea
equipment to the surface facility. In this study, the carbon steel material of grade X65 is used
for steel riser. The fabrication factor is set to be one since the riser pipe is seamless. Safety
class is set to be high. The system pressure test is performed as well. The purpose of the
system pressure test is to prove the pressure containment integrity of the pipe.
The riser is flooded with oil in this study. The density of oil is 800 kg/m3. The design pressure
of 500 bars in operating condition and 575 bars in test condition are considered in this
analysis. A water depth of 1500 m is used to calculate the maximum hydrostatic pressure on
the riser. The unity check is determined by using Pipeline Engineering Tool (PET) software.
The software is based on DNV-OS-F101 which is the same as in DNV-OS-F201 as
mentioned in chapter 3. Based on an initial assessment, the wall thickness of 25 mm is
selected and will be checked based on criteria of burst in operation and test condition,
collapse and propagating buckling. Table 5-5 provides the minimum wall thickness results for
steel pipe with an internal diameter of 10 inches.

Master Thesis Feasibility Study of Selected Riser Concepts in Deep Water and Harsh Environment
Gilang Muhammad Gemilang 79
Table 5-5 Minimum Wall Thickness
Burst
(Operating Condition)
Burst
(Test Condition)
Collapse Propagating
Buckling
21.42 mm 18.53 mm 17.07 mm 24.88 mm
It is shown in Table 5-5 that the selected wall thickness is able to fulfill the criteria of burst,
collapse and propagating buckling. This result indicates that the wall thickness of 25 mm is
adequate to resist the internal and external net overpressures. The highest requirement for wall
thickness is given by criteria of propagating buckling and almost the same as the selected wall
thickness. In order to improve the safety level and to avoid propagating buckling, the buckle
arrestor can be installed at some critical regions. In summary, the minimum wall thickness
requirement is then satisfied with the selected wall thickness of 25 mm.
Detail calculations of the wall thickness design are presented in Appendix A.
5.5.2 External Coating
The external coating is applied uniformly along the entire riser length. The purposes of
coating are to give corrosion protection, mechanical protection or thermal insulation for riser
(Karunakaran et al., 2005). In sensitivity analysis, riser configuration with coating and riser
configuration without coating are included in case study to see how coating influence the
capability of riser to cope with vertical velocity at the hang-off point. The property of external
coating is described as follows.
External coating wall thickness : 50.8 mm
External coating density : 700 kg/m3
5.5.3 Buoyancy Modules
The buoyancy modules are required at certain lengths of riser to achieve the lazy wave
configuration. The buoyancy module is modeled to give net buoyancy force. Individual
buoyancy modules are installed at specified uniform intervals recognized as pitch, along a
certain length of the riser. The pitch of 12 m is considered in this study. The distributed
buoyancy modules are modeled with appropriate net buoyancy force per unit length. Table
5-6 presents the main properties of the buoyancy modules used in this study.
Table 5-6 Buoyancy Module Properties
Parameter Value Unit
Material Density 395 kg/m3
Outer diameter 746 mm
Inner diameter 254 mm
Pitch 12 m
Normal drag coefficient 1.54 -
Axial drag coefficient 0.084 -
Normal added mass coefficient 1.0 -
Axial added mass coefficient 0.37 -
Weight in water -706 N/m

Master Thesis Feasibility Study of Selected Riser Concepts in Deep Water and Harsh Environment
Gilang Muhammad Gemilang 80
5.5.4 Upper End Termination
In this study, the top end of the riser is equipped with flex joint to relieve stress at the
interface of dynamic riser and the host platform. In the extreme loading conditions, the top
end is modeled as pinned. The top end is modeled as pinned since the flex-joint stiffness will
not influence the riser response in extreme loading conditions (Karunakaran et al., 2005).
However, in the fatigue analysis, rotational stiffness at the top end will influence the fatigue
response of the riser cross-section in the hang-off area. The rotational stiffness are presented
in Table 5-7 for the fatigue analysis.
5.5.5 Riser Properties
The wall thickness of the riser is in accordance with previous calculations. Together with all
discussed parameters and calculation, the riser has following properties as shown in Table
5-7.
Table 5-7 Riser Properties
No. Parameter Symbol Value Unit
1 Outer Diameter OD 304 mm
2 Internal Diameter ID 254 mm
3 Wall thickness t 25 mm
4 Type of Material of pipeline Grade X65
Specified Minimum Yield Stress SMYS 448.2 MPa
Specified Minimum Tensile Strength SMTS 530.9 MPa
5 Corrosion allowance tcorr 3 mm
6 Fabrication allowance tfab 2.5 mm
7 Yield derating factor Fy,temp 0 MPa
8 Tensile derating factor Fu,temp 0 MPa
9 Steel Density ρs 7850 kg/m3
10 Modulus Elasticity E 207 GPa
11 Poisson Ratio V 0,3
12 Content density ρc 800 kg/m3
13 Ovality fo 2 %
14 Fabrication factor αfab 1
15 Hardening Factor αc 0.92
16 Material Strength Factor αu 1
17 Wellhead Design Pressure Pd 500 Bars
18 System Test Pressure Pt 575 Bars
19 Flex joint rotational stiffness K 50 kN.m/deg
5.5.6 Riser Configuration
In this study, the three configurations are being investigated; the conventional SCR (SCR),
the weight distributed SCR (WDSCR) and the steel lazy wave riser (SLWR). The typical riser
configuration of weight distributed SCR and conventional SCR is quite similar. The hang-off

Master Thesis Feasibility Study of Selected Riser Concepts in Deep Water and Harsh Environment
Gilang Muhammad Gemilang 81
point is equipped with flex joint in Semi-Submersible (SS). The TDP area is also referred to
as touchdown area (TDA) where the riser approaches the seabed. The typical configurations
of them are shown in Figure 5-5.
Figure 5-5 Riser Configuration
The direction of environmental loading, which consists of wave and current loading, is set to
be parallel to lay direction of riser in order to capture the worst scenario in strength analysis.
The floater position is set to be far and near offset position in order to capture the effect of
slow drift motion of the floater. The near offset position refers to the environmental load
direction and floater displacement towards the lay direction of the riser, while the far offset
position refers to environmental load direction and floater displacement away from the lay
direction of riser, see Figure 5-6.
The hang-off point, where the riser is attached, is located at 15 m from the center of the vessel
and 21 m below the sea surface.
Figure 5-6 shows the orientation of riser‟s lay direction and environmental direction from top
view.
Figure 5-6 Riser Orientation

Master Thesis Feasibility Study of Selected Riser Concepts in Deep Water and Harsh Environment
Gilang Muhammad Gemilang 82
As the configuration and additional design parameters of the SLWR are complex, the SLWR
design has been developed with continuous work from both academic and industries to
optimize its configuration (Chen and Cao, 2013). Due to its complex geometry, the
parameters and variables are introduced to define the SLWR geometry in this study. A typical
configuration and parameters of SLWR geometry is described in Figure 5-7 and Table 5-8.
Table 5-8 SLWR Parameters
Symbols Parameters
S1 Upper catenary section length
S2 Buoyant section length
S3 Lower catenary section length
D Water depth
H1 Horizontal distances between hang-off and TDP
H2 Horizontal distances between hang-off and seabed connection point
V1 Vertical distances between lowest sag-bend and highest hog-bend
V2 Vertical distances between lowest sag-bend seabed
Figure 5-7 SLWR Geomerty

Master Thesis Feasibility Study of Selected Riser Concepts in Deep Water and Harsh Environment
Gilang Muhammad Gemilang 83
5.6 Analysis Concept
5.6.1 Design Cases
Load cases are the set of the environmental loads which comprise wave and current load. As
discussed earlier, each riser model will be analyzed with various load cases in this study for
extreme response analysis.
According to DNV (2010a), an adequate set of load cases should be selected in order to:
Present extreme combined load effects;
Represent all related limit states;
Represent both permanent and temporary conditions;
Represent the range of operating conditions and functional applications;
Study variation of critical parameters at different locations along the entire riser.
Considering that, load cases are applied in 0o and 180
o direction (in-plane with the riser‟s lay
direction) for far and near offset position, respectively in order to capture the worst scenario
in strength analysis (Karunakaran and Baarholm, 2013). Thus, the current flow and wave
direction is the same direction as the vessel offsets. This scenario is described in Figure 5-6.
The lateral load cases are not considered in this study since they are not critical for riser
dimensioning. Lateral load cases can be critical for interference between risers (Karunakaran
et al., 2005). In extreme response analysis, the 10-year current profile and various wave data
are selected as various load cases for giving a number of different extreme vertical velocities
at the hang-off point. The various load cases considered in extreme response analysis are
presented in Table 5-9.
Table 5-9 Environmental Load Case Matrix
Load
Case
Wave Current
Profile Hs
(m)
Tp
(s)
ϒ
1 4 16 1 10-year
2 5 16 1 10-year
3 6 16 1 10-year
4 7 16 1 10-year
5 8 16 1 10-year
6 9 16 1 10-year
7 10 16 1 10-year
8 11 16 1.224 10-year
9 12 16 1.550 10-year
10 13 16 1.909 10-year
11 14 16 2.298 10-year
12 15 16 2.715 10-year
13 16 16 3.158 10-year
14 17 16 3.623 10-year
15 18 16 4.108 10-year
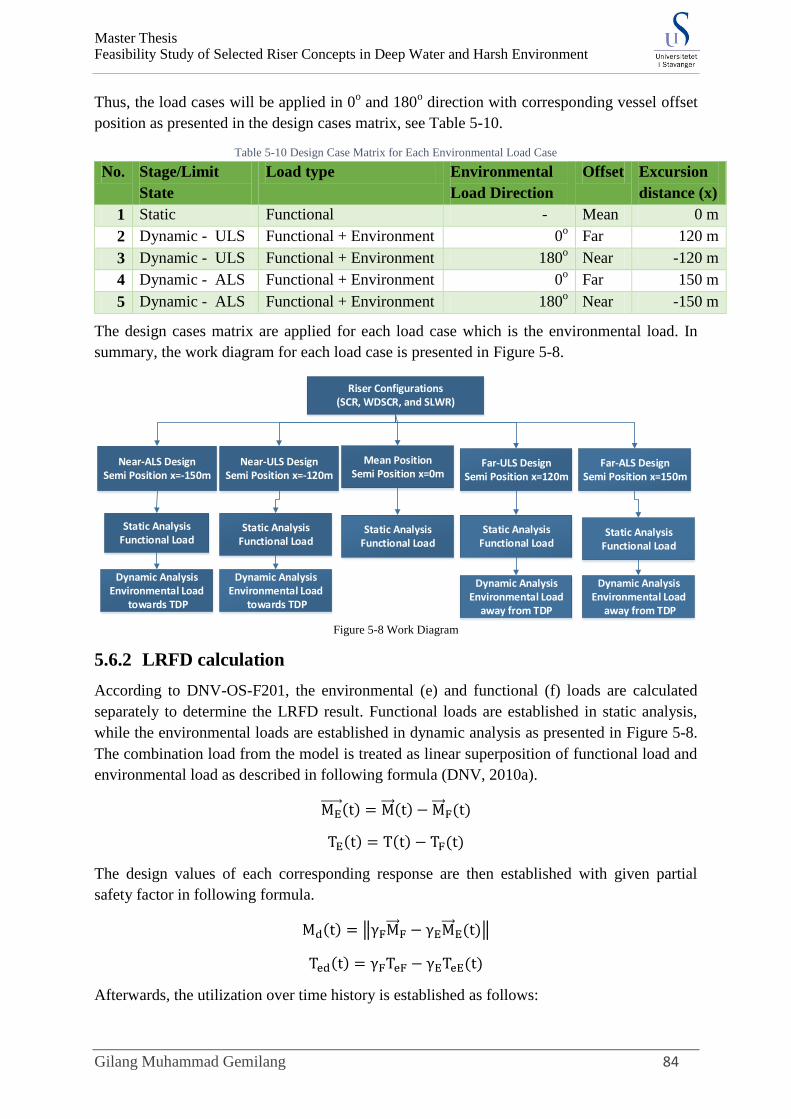
Master Thesis Feasibility Study of Selected Riser Concepts in Deep Water and Harsh Environment
Gilang Muhammad Gemilang 84
Thus, the load cases will be applied in 0o and 180
o direction with corresponding vessel offset
position as presented in the design cases matrix, see Table 5-10.
Table 5-10 Design Case Matrix for Each Environmental Load Case
No. Stage/Limit
State
Load type Environmental
Load Direction
Offset Excursion
distance (x)
1 Static Functional - Mean 0 m
2 Dynamic - ULS Functional + Environment 0o Far 120 m
3 Dynamic - ULS Functional + Environment 180o Near -120 m
4 Dynamic - ALS Functional + Environment 0o Far 150 m
5 Dynamic - ALS Functional + Environment 180o Near -150 m
The design cases matrix are applied for each load case which is the environmental load. In
summary, the work diagram for each load case is presented in Figure 5-8.
Riser Configurations (SCR, WDSCR, and SLWR)
Near-ALS DesignSemi Position x=-150m
Near-ULS DesignSemi Position x=-120m
Mean PositionSemi Position x=0m
Far-ULS DesignSemi Position x=120m
Far-ALS DesignSemi Position x=150m
Static AnalysisFunctional Load
Static AnalysisFunctional Load
Static AnalysisFunctional Load
Static AnalysisFunctional Load
Static AnalysisFunctional Load
Dynamic AnalysisEnvironmental Load
towards TDP
Dynamic AnalysisEnvironmental Load
towards TDP
Dynamic AnalysisEnvironmental Load
away from TDP
Dynamic AnalysisEnvironmental Load
away from TDP
Figure 5-8 Work Diagram
5.6.2 LRFD calculation
According to DNV-OS-F201, the environmental (e) and functional (f) loads are calculated
separately to determine the LRFD result. Functional loads are established in static analysis,
while the environmental loads are established in dynamic analysis as presented in Figure 5-8.
The combination load from the model is treated as linear superposition of functional load and
environmental load as described in following formula (DNV, 2010a).
( ( (
( ( (
The design values of each corresponding response are then established with given partial
safety factor in following formula.
( ‖ ( ‖
( (
Afterwards, the utilization over time history is established as follows:

Master Thesis Feasibility Study of Selected Riser Concepts in Deep Water and Harsh Environment
Gilang Muhammad Gemilang 85
( ( ( (
Where
g(t) = utilization or the generalized load effect at a specific location on the riser
Md, Me, Mf = bending moment for design values, environmental load, and functional load
Ted, Te, Tf = effective tension for design values, environmental load, and functional load
Δp = local differential pressure
Rk = vector of cross-sectional capacities
= vector of safety factors (i.e. material, safety class and condition factors).
The combinations of partial safety factors used in checking ULS and ALS conditions are
selected as shown in Table 5-11.
Table 5-11 Partial Safety Factor for ULS and ALS
ULS ALS
Functional, ϒF 1.1 1.0
Environmental load, ϒE 1.3 1.0
Reduced Functional, ϒRF 0.91 -
Reduced Environmental, ϒRE 0.77 -
5.6.3 Extreme Response Methodology
At an early stage in the design process, reasonable estimates on the percentile response,
simulation duration, and number of simulation should be established for extreme response
analysis. According to Norsok N-003, calculation of characteristic action effects may be
based on selected short term sea-states for systems significantly influenced by nonlinear
behavior (Norsok, 2007). The design storm approach is applicable in connection with a
nonlinear action effect (Norsok, 2007).
The extreme response calculation is based on nonlinear time domain analysis for nonlinear
action effect. The irregular wave of the JONSWAP spectrum described in section 5.3.2 is
used to model the sea-state realization. The main objective of choosing a number of wave data
is to generate different vertical velocities at the hang-off point for cases study. Random wave
trains are characterized in terms of user-defined seed number of wave component, significant
wave height (Hs), peak period (Tp), giving a sea-state realization.
The phases, which are associated with each wave component, are pseudo-random (Orcina,
2010). ORCAFLEX uses a random number generator and the user-defined seed to assign
phases of wave components (Orcina, 2010). The same user-defined seed component will give
the same phases and vice-versa. Therefore, each wave train from the randomly selected seed
component will generate different sea-state realization and also the different response of the
structure. To ascertain that the extreme value distribution for each load case is properly
accounted for, a number of 3-hour simulations with different random seeds are considered to
obtain adequate statistical confidence of short term sea-states.

Master Thesis Feasibility Study of Selected Riser Concepts in Deep Water and Harsh Environment
Gilang Muhammad Gemilang 86
The number of 3-hour simulations should be sufficient that the upper tail of the distribution
function for the 3-hour maximum sea-state is well modeled (DNV, 2013). A sufficient
approximation for the q-probability response/load is then estimated by solving (Haver, 2010):
Where hq* and tq* are the parameter which gives the worst sea-state for the problem under
consideration. α is the percentile response (Haver, 2010). One may instead select the median
response, rather than selecting a higher percentile response (α) as the short term characteristic.
The percentile response level will depend on the nature of the response problem, but a default
choice of 90% percentile response has been recommended in Haver et al. (1998). This is also
adopted by Norsok standard N-003 (Norsok, 2007). Thus, for this study, 90% percentile
response (α) is considered for each load case.
Based on DNV-OS-E301 section 2.2.10, an alternative to one long simulation, to which an
extreme value distribution will be fitted, could be to simulate several (10-20) realizations of
duration 3-hours (DNV, 2013). Thus, 20 random seed simulations will be considered for each
load case to obtain the extreme value distribution. For one seed simulation, one can find a sea-
state realization and 3-hour maximum response denoted X. By repeating the time domain
simulation 20 times with different random seeds, 20 independent “observations” of the 3-hour
maximum responses are then obtained, {X1, X2, X3, …, X20}.
The 90% percentile response for each load case is then obtained from those 3-hour maximum
responses {X1, X2, X3, …, X20} by using extreme value distribution, for instance, Gumbel
distribution. (Haver, 2010). This is important since each set of wave train, from the randomly
selected seed components, generates different sea-state realization and different response. The
90% percentile response of downward velocity at the hang-off point is considered to capture
the capability of riser to cope with the vessel motion. This is because the downward velocity
at the hang-off point dominates the riser‟s critical responses (stress/buckling) in the global
strength design (Chen et al., 2009). In order to cover possible higher order wave effects, the
selected seed component is slightly rounded upwards from 90% percentile response. The
purpose of 3-hour simulation, 90% percentile response and consideration of 20 seed
components in this study is to ensure the extreme response analysis is performed in
accordance with DNV-OS-F201, for adequate statistical confidence.
5.6.4 Analysis Procedure
The riser strength analysis is performed by following procedures as provided below:
1. Semi-submersible is modeled with appropriate RAO data at mean position;
2. 20 random seed components are selected for each load case;
3. The 3-hour maximum responses of downward velocities at the hang-off point are
obtained from 20 random seed components. This step is repeated for 15 load cases.
Thus the total simulation is 15 x 20;

Master Thesis Feasibility Study of Selected Riser Concepts in Deep Water and Harsh Environment
Gilang Muhammad Gemilang 87
4. The seed component satisfying 90% percentile response is obtained from extreme
value distribution. This step is repeated for 15 load cases. The selected seed
components for each load case are thereafter established;
5. The conventional SCR, WDSCR and SLWR are modeled with discrete beam
segments consisting of the shorter segment in the critical region (i.e. hang-off point
and touchdown area);
6. Static riser configuration is established for SCR, WDSCR and SLWR;
7. Static analysis is performed and checked for every offset position;
8. The load cases with the selected seed component are applied in 0 degree and 180
degree direction for far and near offset position respectively;
9. Dynamic analysis is performed for near-ULS, far-ULS, near-ALS and far-ALS design
cases by considering non-linear time domain analysis and irregular wave theory of
JONSWAP within 3-hour dynamic simulation. The strength assessment is performed
by applying the load cases based on the extreme downward velocity at the hang-off
point;
10. The following riser response characteristics are observed and discussed:
Maximum Effective Tension
Maximum Compression
Maximum Bending Moment
Maximum Utilization (LRFD)
5.6.5 Acceptance Criteria
To ensure the riser design criteria has been satisfied, the following acceptance criteria are
adhered to in this analysis:
Buckling Utilization Factor
Based on DNV-OS-F201, the consistent treatment moment-tension relationship is a important
issue for the acceptance criteria of all combined load in LRFD format. To ensure the riser
design satisfies the design criteria, it is convenient to consider utilization or generalized
loading expressed by the following generic equation (DNV, 2010a):
( ( ( (
Where
g(t) = utilization or the generalized load effect functions at a specific location on the riser
Md = design values for bending moment
Ted = design values for effective tension
ΔP = local differential pressure
Rk = vector of cross-sectional capacities
= vector of safety factors (i.e. material, safety class and condition factors).
As g(t) is varied over time, the maximum g(t) is obtained from the maximum value of each
component function and is considered for conservative load effect. The acceptance criteria

Master Thesis Feasibility Study of Selected Riser Concepts in Deep Water and Harsh Environment
Gilang Muhammad Gemilang 88
require the generalized load effect (utilization) to be less than unity for both static and
dynamic response. This criterion is given by:
Thus, the maximum buckling utilization factor should be less than 1.0 for all limit state design
(ULS and ALS). The calculation of LRFD is performed by ORCAFLEX.
Compression
Excessive compression (negative minimum tension) is unwanted. Therefore, the compression
is avoided or be minimal.
Fatigue Life for Wave Induced Fatigue Analysis
The minimum acceptable fatigue life is 250 years for wave induced fatigue analysis.
Fatigue Life for Fatigue Analysis due to VIV
The minimum acceptable fatigue life is 500 years for VIV fatigue analysis.

Master Thesis Feasibility Study of Selected Riser Concepts in Deep Water and Harsh Environment
Gilang Muhammad Gemilang 89
Chapter 6. Extreme Response Analysis
6.1 Introduction
This chapter presents the extreme response analysis of the selected riser concepts. The brief
methodology of the extreme response analysis is presented in the previous chapter. The main
software program for modeling and analysis in this study is the ORCAFLEX. A general
description of the main features of this software program is provided in the Appendix C. The
general procedure adopted in this study is summarized as follows:
Selection of seed component for each load case;
Static analysis, this section gives the determination of an optimum static configuration
for the conventional SCR, WDSCR and SLWR. The strength assessment is performed
to optimize the riser arrangement in order to attain proper model;
Dynamic analysis, the strength analysis is performed in the extreme sea-states under
the combined actions of waves and currents for each load case;
Conclusion, this section present discussion of the results.
6.2 Selection of seed components
This section contains the selection of seed components. The brief description of the
methodology is discussed in section 5.6.3. 20 simulations of 3-hour duration are performed
with 20 different randomly seed components to generate different sea-state realizations for
each load case. Thus, there are 20 x 15 simulations were performed. The 20 random seed
components are ordered from 1 to 20. The order of seed is denoted “m”. The different sea-
state realizations generate different velocities at the hang-off point. Consequently, 20
maximum responses of downward velocities at the hang-off point are obtained. The 20
maximum responses of downward velocities at the hang-off point from each seed are sorted
from smallest to largest such that they can fit into an extreme value distribution.
The downward velocity and corresponding seed component, giving 90% percentile response,
from the extreme value distribution are then obtained and selected. The results of the selection
of seed components (m) are summarized for all load cases in Table 6-1. The downward
velocity at the hang-off in the Table 6-1 is the 90% percentile response from the extreme
value distribution. The increase in downward velocity is observed as increase number of load
case; therefore, this load case will then be used for the next analysis.
Table 6-1 Load Cases with Corresponding Seed Component
Load
Case
Wave Current
Profile
Downward
Velocity at the
hang-off (m/s)
Seed
Order
(m) Hs (m) Tp (s) ϒ
1 4 16 1 10-year 1.34 11
2 5 16 1 10-year 1.68 11
3 6 16 1 10-year 1.75 11
4 7 16 1 10-year 2.04 11
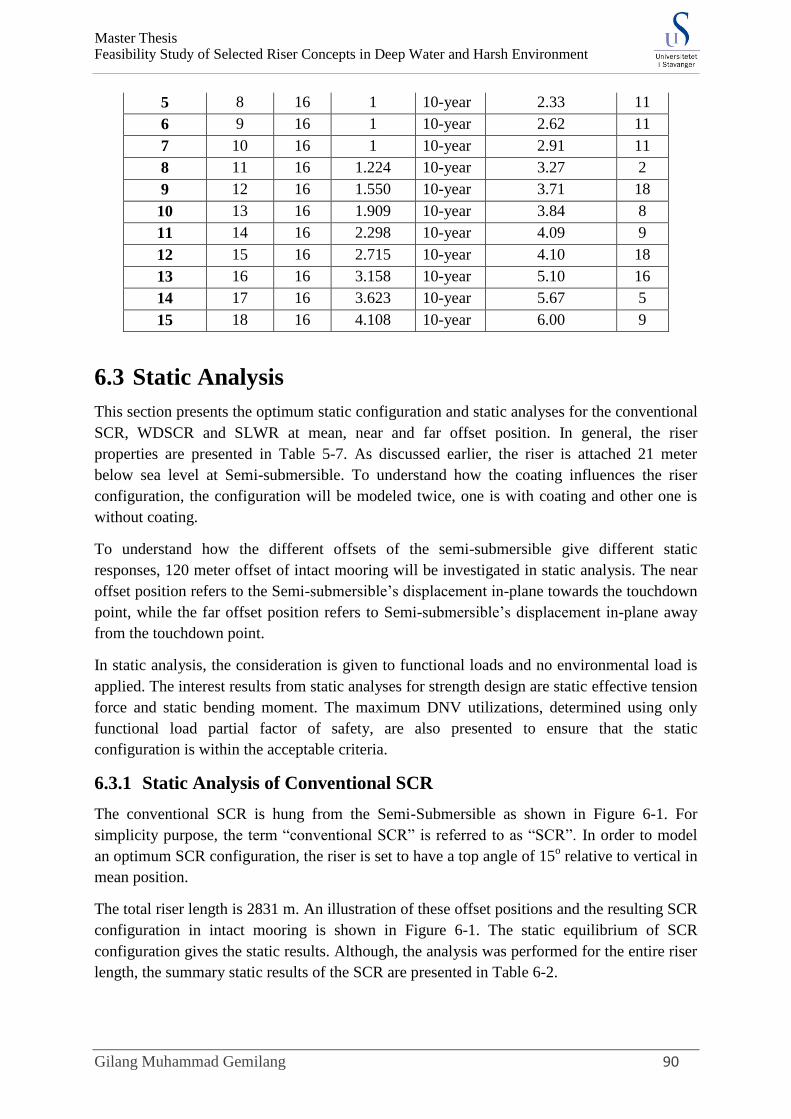
Master Thesis Feasibility Study of Selected Riser Concepts in Deep Water and Harsh Environment
Gilang Muhammad Gemilang 90
5 8 16 1 10-year 2.33 11
6 9 16 1 10-year 2.62 11
7 10 16 1 10-year 2.91 11
8 11 16 1.224 10-year 3.27 2
9 12 16 1.550 10-year 3.71 18
10 13 16 1.909 10-year 3.84 8
11 14 16 2.298 10-year 4.09 9
12 15 16 2.715 10-year 4.10 18
13 16 16 3.158 10-year 5.10 16
14 17 16 3.623 10-year 5.67 5
15 18 16 4.108 10-year 6.00 9
6.3 Static Analysis
This section presents the optimum static configuration and static analyses for the conventional
SCR, WDSCR and SLWR at mean, near and far offset position. In general, the riser
properties are presented in Table 5-7. As discussed earlier, the riser is attached 21 meter
below sea level at Semi-submersible. To understand how the coating influences the riser
configuration, the configuration will be modeled twice, one is with coating and other one is
without coating.
To understand how the different offsets of the semi-submersible give different static
responses, 120 meter offset of intact mooring will be investigated in static analysis. The near
offset position refers to the Semi-submersible‟s displacement in-plane towards the touchdown
point, while the far offset position refers to Semi-submersible‟s displacement in-plane away
from the touchdown point.
In static analysis, the consideration is given to functional loads and no environmental load is
applied. The interest results from static analyses for strength design are static effective tension
force and static bending moment. The maximum DNV utilizations, determined using only
functional load partial factor of safety, are also presented to ensure that the static
configuration is within the acceptable criteria.
6.3.1 Static Analysis of Conventional SCR
The conventional SCR is hung from the Semi-Submersible as shown in Figure 6-1. For
simplicity purpose, the term “conventional SCR” is referred to as “SCR”. In order to model
an optimum SCR configuration, the riser is set to have a top angle of 15o relative to vertical in
mean position.
The total riser length is 2831 m. An illustration of these offset positions and the resulting SCR
configuration in intact mooring is shown in Figure 6-1. The static equilibrium of SCR
configuration gives the static results. Although, the analysis was performed for the entire riser
length, the summary static results of the SCR are presented in Table 6-2.

Master Thesis Feasibility Study of Selected Riser Concepts in Deep Water and Harsh Environment
Gilang Muhammad Gemilang 91
Figure 6-1 SCR Intact-Static Configuration for near, mean and far position
Table 6-2 SCR Static Results- Functional Loads
SCR Intact – Static Coating No Coating
Far Mean Near Far Mean Near
Hang-off angle (o) 21 15 10 21 15 10
Effective top tension (kN) 2699 2341 2108 3114 2700 2432
Max. Bending Moment (kN.m) 54 85 137 54 85 137
Max. DNV Utilization (LRFD) 0.28 0.27 0.34 0.31 0.27 0.35
Discussion of SCR Static Analysis Results:
The following is a general discussion of the SCR response under functional loadings at far,
mean and near vessel position:
It can be seen that the different offset positions give significant impact on the
configuration. The TDP location changes significantly, which causes the different
static and dynamic behavior for the different offset positions.
The SCR with coating is having less effective top tension than the SCR without
coating. This is the consequence of having the coating density of 700 kg/m3 and
thickness of 2 inches, giving upward buoyancy to the riser. Therefore, the riser with
coating is lighter than the riser without coating.
Equal maximum bending moment and hang-off angle are observed for the SCR with
coating and for the SCR without coating. The maximum bending moment occurred in
the TDA.
The SCR without coating has more utilization factor than the SCR with coating for
static equilibrium. The maximum utilization value is 0.35 and is located in the TDA.

Master Thesis Feasibility Study of Selected Riser Concepts in Deep Water and Harsh Environment
Gilang Muhammad Gemilang 92
Figure 6-2 Static Effective Tension of SCR with Coating
From the Figure 6-2, it can be seen that the static effective tension is a function of riser
length. The maximum effective tension occurred at the hang-off point since the whole
submerged weight of the riser is supported at the hang-off point. The far offset
position gives the highest effective top tension due to its longest suspended length. On
the other hand, the near offset position gives the lowest effective top tension due to its
shortest suspended length.
Figure 6-3 Static Bending Moment of SCR with Coating
From the Figure 6-3, the maximum bending moment occurred in the TDA since the
TDA is where the riser starts bending to lay horizontally on the seabed. The bending
Effe
ctiv
e Te
nsi
on
(kN
)

Master Thesis Feasibility Study of Selected Riser Concepts in Deep Water and Harsh Environment
Gilang Muhammad Gemilang 93
moments in the top region are significantly small, since the rotational stiffness of flex
joint is modeled as pinned, permitting the riser to rotate freely at the hang-off point.
The near offset position gives the highest bending moment compared to the mean and
the far offset position. This is the consequence of the small sag-bend curvature which
results in the high static bending moment when the floater is in near offset position,
see Figure 6-3. On the other hand, for the far offset position, the large sag-bend
curvature is observed in the TDA which results in significantly low static bending
moment.
It is also important to keep in mind that the bending moment is dependent on how the
the riser approaches the seabed. In the far offset position, the bending moment is
approaching the seabed in smoother way than the near offset position, see Figure 6-1.
Therefore, the far offset position gives significantly low static bending moment. Thus,
the smoother approach of the riser to the seabed, the less bending moment of the riser
in the TDA.
From the results, the significant change in location of the TDP between far case and
near case is an important design consideration with respect to bending moment.
Figure 6-4 Static Utilization of SCR with Coating
For the near offset position, the maximum utilization occurred in the TDA. For the far
offset position, the maximum utilization occurred in the top region, see Figure 6-4.
This is an indication that the maximum utilization is driven by the effective tension for
the far offset position, while the maximum utilization is driven by the bending
moment for the near offset position.
The maximum utilization in the near offset position is more than the maximum
utilization in the far offset position. This is an indication that the near offset position is
more critical to the extreme response in the design.
From the results above, it can be concluded that the bending moment is of greater
importance than the effective tension, and will be the driving design parameter for the

Master Thesis Feasibility Study of Selected Riser Concepts in Deep Water and Harsh Environment
Gilang Muhammad Gemilang 94
riser. This is because the riser has structurally greater capacity to endure axial loads
than lateral loads.
6.3.2 Static Analysis of WDSCR
The Weight Distributed SCR (WDSCR) is originally the modification of the conventional
SCR. The modification is achieved by adding heavy riser cross-section at the bottom of the
straight section of the SCR. According to Karunakaran et al. (2013), adding heavy riser cross-
section at the bottom of straight section of the SCR will reduce dynamics of the straight
section, thus decreasing the dynamic stresses in the TDA (Karunakaran et al., 2013). For deep
water applications, this modification will increase the top tension and the dynamic axial stress
in the top region.
The length of the heavy cross section is 300 m. The heavy cross-section comprises ballast
modules which are attached per riser joint with 2000 kg weight at each interval length of 12
m. Consequently, there are 26 ballast modules along 300 m. In optimization study, it has been
observed that if heavy cross sections touch the seabed, there will be excessive bending
moment in the TDA. This is the consequence of the sudden drop of riser‟s sag-bend when the
heavy cross section touches the seabed. Therefore, it is necessary to prevent the heavy cross
section from touching seabed under any circumstances.
However, the heavy cross section should be placed at the bottom of the riser‟s straight section
to effectively reduce the dynamic behavior in the TDA. Therefore, the following factors are
considered to optimize the location where the heavy cross section is installed onto the riser.
1. An attachment type of the ballast module with 2000 kg weight is modeled.
2. To locate the ballast modules correctly, nodes are set with intervals of 12 m where the
ballast module is added since the ballast module is added to each node.
3. Sufficient clearance height between the end of heavy cross section and the seabed in
static equilibrium, to prevent the end of heavy cross section from touching the seabed
in dynamic analysis.
4. The end of heavy cross section is located at 80 m above the seabed in the mean
position in the static equilibrium.
Together with the consideration above, an ideal static configuration of the WDSCR is
established as the base case configuration for further analyses. An illustration of the different
offset positions and the resulting WDSCR configuration in intact mooring is shown in Figure
6-5. The red point is the ballast modules that are installed on each node along 300 m riser
length. Although, the analysis was performed for the entire riser length, the summary static
results of the WDSCR are presented in Table 6-3.

Master Thesis Feasibility Study of Selected Riser Concepts in Deep Water and Harsh Environment
Gilang Muhammad Gemilang 95
Figure 6-5 Intact-Static WDSCR Configuration near, mean and far position
Table 6-3 WDSCR Static Results- Functional Loads
WDSCR Intact – Static Coating No Coating
Far Mean Near Far Mean Near
Hang-off angle (o) 21 15 12 20 15 12
Effective top tension (kN) 3273 2859 2576 3688 3221 2906
Max. Bending Moment (kN.m) 73 112 183 69 106 173
Max. DNV Utilization (LRFD) 0.32 0.32 0.42 0.36 0.32 0.40
Discussion of WDSCR Static Analysis Results:
Most of the characteristics of the WDSCR are similar to the conventional SCR, for instances,
the maximum utilization and bending moment occurred in the near offset position, while the
maximum effective top tension occurred in the far offset position. The following will discuss
the WDSCR response under functional loadings in the far, mean and near vessel position
specifically in comparison with the conventional SCR:
It can be seen that the different offset positions give significant impact on the
configuration of the WDSCR. The TDP location changes significantly, which causes
the different static and dynamic behavior for the different offset positions.
The WDSCR without coating has more top tension, but less bending moment than the
WDSCR with coating, since the WDSCR without coating is heavier than the WDSCR
with coating.

Master Thesis Feasibility Study of Selected Riser Concepts in Deep Water and Harsh Environment
Gilang Muhammad Gemilang 96
Figure 6-6 Effective Tension Comparison
Figure 6-6 shows the comparison of WDSCR and SCR in the mean position with
coating. The WDSCR has more effective top tension than the SCR in all
corresponding positions. This is the consequences of installing heavy cross section at
the bottom of straight section.
Figure 6-7 Static Configuration - Conventional SCR and WDSCR
The approach of the SCR to the seabed is smoother than the approach of the WDSCR
to the seabed, see Figure 6-7. This is the consequence of installing the heavy cross
sections at the bottom of straight section. Thereby the static bending moment of the
-1600
-1400
-1200
-1000
-800
-600
-400
-200
0
-2500 -2000 -1500 -1000 -500 0
Z-C
oo
rdin
ate
(m
)
X-Coordinate (m)
Static Configuration -Mean-Coating
WDSCR Conventional SCR
Effe
ctiv
e Te
nsi
on
(kN
)

Master Thesis Feasibility Study of Selected Riser Concepts in Deep Water and Harsh Environment
Gilang Muhammad Gemilang 97
WDSCR is more than the static bending moment of the conventional SCR as seen in
Figure 6-8.
Although, the static bending moment of the WDSCR is higher than the static bending
moment of the conventional SCR, the heavy cross sections will reduce the dynamic
response of the WDSCR in the TDA. Thereby the WDSCR is more insensitive to
vessel heave motion than the SCR in dynamic response. This will be discussed in
dynamic analysis section.
It can be seen from Figure 6-8, the WDSCR has 2 peaks of bending moment which are
located at the end of heavy cross section and at the TDP.
Figure 6-8 Static Bending Moment - Conventional SCR and WDSCR
6.3.3 Static Analysis of SLWR
The SLWR is originally a modification of the SCR as well. It has several buoyancy modules
at the midsection of the riser, thus the configuration of riser is changed into lazy wave. These
buoyancy modules can de-couple the dynamic motion of floater from the TDP and reduce the
top payload. The properties of buoyancy module are presented in Table 5-6.
Since the buoyancy modules introduce additional stress in the sag-bend and hog-bend, high
bending stresses at the sag-bend and the hog-bend become design issues for lazy wave
configurations (Karunakaran et al., 1996). Therefore, it is important to ensure low bending
stresses at the sag-bend and hog-bend. In order to achieve an ideal configuration, the
following factors are considered.
Optimized number of buoyancy elements and the position of buoyancy elements, to
ensure that the SLWR design has “low lazy configuration”.
Sufficient vertical distances between the lowest sag-bend and the highest hog-bend for
all vessel positions, especially in the far offset position, since far offset position gives
the minimum vertical distances between the lowest sag-bend and the highest hog-
0
20
40
60
80
100
120
0 500 1000 1500 2000 2500 3000
Be
nd
ing
Mo
me
nt
(KN
.m)
Arc Length (m)
Static Bending Moment -Mean-Coating
WDSCR Conventional SCR

Master Thesis Feasibility Study of Selected Riser Concepts in Deep Water and Harsh Environment
Gilang Muhammad Gemilang 98
bend. This is important to isolate the TDP motion from the sag-bend motion. This is
also important to maintain the same position of TDP in the different vessel offsets.
Sufficient clearance between the lowest sag-bend and the seabed, to prevent the sag-
bend from touching the seabed under any circumstances, especially when the vessel is
in the near offset position, since the near offset position gives the minimum clearance
between the lowest sag-bend and the seabed.
Together with the considerations above, an ideal static configuration of the SLWR is
established. The selected parameters are presented in Table 6-4 as the base case of the SLWR
configuration. An illustration of offset positions and the resulting SLWR configuration in
intact mooring is shown in Figure 6-9.
Table 6-4 Selected Parameters for SLWR configuration
Parameter Value Unit
Total riser length, L 2842 m
Upper section length, S1 1680 m
Buoyant section length, S2 500 m
lower section length, S3 662 m
Horizontal distances between hang-off and touchdown point, H1 (at mean position) 1330 m
Horizontal distances between hang-off and seabed connection, H2 1802 m
Vertical distances between lowest sag-bend & highest hog-bend, V1 (at mean
position)
72 m
Vertical distances between lowest sag-bend and seabed, V2 (at mean position) 115 m
Vertical distances between lowest sag-bend and highest hog-bend, V1 (at far position) 29 m
Vertical distances between lowest sag-bend and seabed, V2 (at near position) 80 m
Figure 6-9 Intact-Static SLWR configuration near, mean and far position

Master Thesis Feasibility Study of Selected Riser Concepts in Deep Water and Harsh Environment
Gilang Muhammad Gemilang 99
The static results of the SLWR are summarized in Table 6-5 .
Table 6-5 SLWR Static Results- Functional Loads
Critical
Location
Coating No Coating
Far Mean Near Far Mean Near
Hang-off angle (o) Top 11 8 6 11 8 6
Effective Top Tension Top 1910 1859 1832 2225 2165 2133
Effective tension (kN)
Sag-bend 443 343 281 492 369 291
Hog-bend 440 339 276 493 370 292
TDP 439 338 275 492 369 291
Max. Bending Moment
(kN.m)
Sag-bend 145 201 272 144 202 277
Hog-bend 88 122 165 75 106 146
TDP 141 191 250 141 193 256
Max. DNV Utilization
(LRFD)
Sag-bend 0.36 0.44 0.54 0.36 0.44 0.55
Hog-bend 0.28 0.32 0.39 0.26 0.30 0.36
TDP 0.35 0.42 0.51 0.35 0.43 0.52
Discussion of SLWR Static Analysis Results:
The following is a general discussion of the SLWR response under functional loadings in the
far, mean and near vessel position:
It can be seen that the different offset positions do not change the TDP location. The
only change is identified in the configuration of the sag-bend and hog-bend. Thereby it
is important to establish sufficient vertical distances between lowest sag-bend and
highest hog-bend to maintain the same TDP position.
The effective tensions at the sag-bend, hog-bend, and TDP are fairly equal. This
indicates that the forces acting at the sag-bend, hog-bend and TDP are mainly
horizontal.
The SLWR without coating has more effective top tension than the SLWR with
coating since the SLWR without coating is heavier than the SLWR with coating.
The maximum bending moment at the hog-bend is fairly low compared to the
maximum bending moment at the sag-bend and the TDP. The maximum bending
moment at the hog-bend is lowest at the far offset position and is highest at the near
offset position.
The near offset position gives more bending moment than far offset position. This is
because the smaller curvature of lazy wave configuration is achieved at the near offset
position compared to the far offset position, see Figure 6-9.
The utilization at the sag-bend and the TDP are higher than the utilizations at the hog-
bend. This indicates that the sag-bend and TDP are more critical to extreme response
in the SLWR design.
The maximum utilization value is 0.55 at the sag-bend of the SLWR without coating.

Master Thesis Feasibility Study of Selected Riser Concepts in Deep Water and Harsh Environment
Gilang Muhammad Gemilang 100
6.3.4 Comparison - Static Results
In this section, the static results of three riser configurations with coating will be compared in
terms of effective tension and bending moment for entire riser length. Only mean position is
compared. The aim is to show different responses of the three riser configuration in terms of
static equilibrium. From the Figure 6-10, it can be analyzed that the WDSCR has the greatest
effective tension since it has the heavy cross sections.
On the other hand, the SLWR has the lightest riser configuration since it is equipped with the
buoyancy modules, giving net upward buoyancy to the riser. The effective tension at the
hang-off point is referred to as the top payload. Consideration should be given to the WDSCR
in terms of capacity of the floater to accommodate such top payload. It is also observed that
the static effective tension of WDSCR has a sudden drop in the area of the heavy cross
sections. This is because the region below heavy cross sections is not affected by the
contribution of axial loads from the heavy cross sections.
Figure 6-10 Comparison of Effective Tension – Mean Position – Static
Figure 6-11 Comparison of Bending Moment – Mean Position- Static

Master Thesis Feasibility Study of Selected Riser Concepts in Deep Water and Harsh Environment
Gilang Muhammad Gemilang 101
From the Figure 6-11, it can be analyzed that the SLWR has the greatest static bending
moment compared to the SCR and the WDSCR. These three peaks of bending moment
occurred at the sag-bend, hog-bend and TDP. This is the consequences of lazy wave
configuration resulting in small curvature at the sag-bend, hog-bend and TDP. The WDSCR
has greater static bending moments than the SCR in this case as discussed earlier.
6.4 Dynamic Analysis
The dynamic analysis was carried out considering ULS and ALS design to analyze the
dynamic response of the SCR, WDSCR and SLWR. The intact condition refers to ULS design
for 120 meter offsets and the damage condition refers to ALS design for 150 meter offsets.
The extreme response is estimated using time domain analysis based on many 3-hour long
random simulations. The riser integrity was then checked against the load cases as presented
in Table 6-1. The interest results from the dynamic analyses for the strength design are
dynamic effective tension force and dynamic bending moment. Compression is also one of
the interest results in the dynamic analysis, since it might result into riser buckle. The
compression can be identified as the negative effective tension or minimum effective tension.
The three riser configuration will be checked to see how it can accommodate the floater
motion induced from the load cases. The capability of the riser to cope with floater motion is
indicated by the utilization of the riser. If the utilization is less than unity, the riser is then
considered within the allowable design criteria and vice-versa. For the preliminary design, the
conventional SCR is checked against the load case 3. If the conventional SCR configuration is
still within the allowable design criteria, then the next load case is performed until the certain
load case where the SCR is not able to cope with.
Afterwards, the WDSCR configuration is checked against the load case which the SCR is not
able to cope with. Subsequently, the WDSCR configuration is checked against the next load
cases until the certain load case which the WDSCR is not able to cope with. Eventually, the
SLWR configuration is checked against the load case which WDSCR cannot cope with.
The SLWR will then be checked against all the rest of load cases until the load case 15. This
methodology is carried out since the SCR is the most sensitive configuration to the vessel
motion. The extreme analysis was carried out as described in section 5.6. The environmental
load of waves and current were applied in-plane with the riser‟s lay direction for both 0o and
180o direction with far and near position, respectively. This scenario is considered to capture
the worst scenario. The next section will discuss the dynamic analysis result for both with
coating and without coating to see how coating influences the dynamic responses of the riser.
6.4.1 Dynamic Analysis of Conventional SCR
Load Case 3
The summary of the dynamic analysis responses of the conventional SCR against the load
case 3 is presented in Table 6-6 for ULS and ALS design.

Master Thesis Feasibility Study of Selected Riser Concepts in Deep Water and Harsh Environment
Gilang Muhammad Gemilang 102
Table 6-6 SCR-Strength Response Summary for Load Case 3
Load Case 3 Semi Position
Coating Intact Damage
Far Near Far Near
Max. Effective Tension (kN) 3758 2455 3952 2356
Max. Compression (kN) 0 0 0 21
Max. Bending Moment (kN.m) 93 374 84 428
Max. DNV Utilization (LRFD) 0.43 0.77 0.37 0.71
No Coating
Max. Effective Tension (kN) 3922 2721 4121 2629
Max. Compression (kN) 0 0 0 0
Max. Bending Moment (kN.m) 77 287 67 333
Max. DNV Utilization (LRFD) 0.43 0.62 0.38 0.59
The maximum utilization is observed in near-ULS design. The maximum utilizations of the
SCR with coating and the SCR without coating are 0.77 and 0.62, respectively and are
observed in the TDA. This is an indication that the near-ULS design is more critical to
extreme response to the design. The compression is only identified in the near-ALS design of
the SCR with coating. The maximum downward velocity at the hang-off point is 1.75 m/s.
This showed that the SCR configuration can cope with downward velocity of 1.75 m/s.
Load Case 4
As the results of the SCR are within allowable design criteria for the load case 3, the next
analysis is to check the SCR integrity against the load case 4. The summary of the dynamic
analysis responses of the SCR against the load case 4 is presented in Table 6-7 for ULS and
ALS design.
Table 6-7 SCR-Strength Response Summary for Load Case 4
Load Case 4 Semi Position
Coating Intact Damage
Far Near Far Near
Max. Effective Tension (kN) 4019 2530 4232 2421
Max. Compression (kN) 0 80 0 107
Max. Bending Moment (kN.m) 124 466 104 529
Max. DNV Utilization (LRFD) 0.47 0.91 0.40 0.85
No Coating
Max. Effective Tension (kN) 4123 2784 4338 2685
Max. Compression (kN) 0 0 0 0
Max. Bending Moment (kN.m) 89 345 77 401
Max. DNV Utilization (LRFD) 0.46 0.72 0.41 0.68
The near-ALS design has more compression than the near-ULS design. The maximum
utilization is observed in the near-ULS design. Both the SCR with coating and the SCR
without coating have maximum utilization of 0.91 and 0.72, respectively which are still

Master Thesis Feasibility Study of Selected Riser Concepts in Deep Water and Harsh Environment
Gilang Muhammad Gemilang 103
within allowable design criteria. The maximum downward velocity at the hang-off point is
2.04 m/s. This showed that, the SCR configuration can cope with downward velocity of 2.04
m/s.
Load Case 5
As the results of the SCR are within the allowable design criteria for the load case 4, the next
analysis is to check the SCR integrity against the load case 5. The summary of the dynamic
analysis responses of the SCR against the load case 5 is presented in Table 6-8 for ULS and
ALS design.
Table 6-8 SCR-Strength Response Summary for Load Case 5
Load Case 5 Semi Position
Coating Intact Damage
Far Near Far Near
Max. Effective Tension (kN) 4305 2604 4537 2485
Max. Compression (kN) 0 181 0 206
Max. Bending Moment (kN.m) 173 586 146 654
Max. DNV Utilization (LRFD) 0.51 1.14 0.44 1.01
No Coating
Max. Effective Tension (kN) 4345 2847 4576 2741
Max. Compression (kN) 0 14 0 52
Max. Bending Moment (kN.m) 110 422 94 487
Max. DNV Utilization (LRFD) 0.50 0.85 0.43 0.79
The SCR with coating has maximum utilization of 1.14 which is no longer within the
allowable design criteria for the near-ULS design. In contrast, the SCR without coating has
the maximum utilization of 0.85 which is still within the allowable design criteria for the
near-ULS design. This showed that the SCR without coating can cope with higher downward
velocity at the hang-off point compared to the SCR with coating. The maximum downward
velocity at the hang-off point is 2.33 m/s in this case. The maximum utilization at the TDP
and the maximum downward velocity at the hang-off point occurred at the same time.
This is an indication that the maximum downward velocity at the hang-off point induces the
maximum utilization at the TDP for the SCR with coating. To see how the responses of the
SCR with coating associate with the vertical velocity at the hang-off point, the vertical
velocity at the hang-off point and the SCR responses (i.e. bending moment and the effective
tension) at the TDP are then plotted over time history for the near-ULS design, see Figure
6-12.
From the upper part of Figure 6-12, it can be seen from the graph that the vertical velocities at
the hang-off point and the effective tensions at the TDP synchronize with respect to the “rise”
and “fall”, while the maximum downward velocity at the hang-off point associates directly
with the minimum effective tension (compression) at the TDP. This is an indication that the
maximum downward velocity at the hang-off point induces the maximum compression at the
TDP.

Master Thesis Feasibility Study of Selected Riser Concepts in Deep Water and Harsh Environment
Gilang Muhammad Gemilang 104
From the lower part of Figure 6-12, it can be seen from the graph that the vertical velocities at
the hang-off point and bending moments at the TDP synchronize with respect to the “rise”
and “fall” in the opposite direction, while the maximum downward velocity at the hang-off
point associates directly with the maximum bending moment at the TDP. This is an indication
that the maximum downward velocity at the hang-off point induces the maximum bending
moment at the TDP.
It can be concluded that the maximum downward velocity at the hang-off point induces both
the maximum bending moment (586 kN.m) and the maximum compression (181 kN) at the
TDP simultaneously. The combination of the maximum bending moment and the maximum
compression results in the excessive buckling utilization to riser. The maximum downward
velocity at the hang-off point can be concluded as a key driving parameter of riser integrity.
To sum up, the SCR with coating is not able to cope with maximum downward velocity of
2.33 m/s.
Figure 6-12 Time History: Effective Tension and Bending Moment -SCR-Coating-LC5- Near-ULS Design
Load Case 6
As the results of the SCR without coating is within allowable design criteria for the load case
5, the SCR without coating is then checked against the load case 6. The summary of the
-3
-2
-1
0
1
2
3
-400
-200
0
200
400
600
800
5460 5480 5500 5520 5540 5560 5580 5600 5620 5640 5660
Ver
tica
l Vel
oci
ty (m
/s)
Effe
ctiv
e Te
nsi
on
(kN
)
Time (s)
Effective Tension Vertical Velocity
-3
-2
-1
0
1
2
3
0
100
200
300
400
500
600
700
5460 5480 5500 5520 5540 5560 5580 5600 5620 5640 5660
Ver
tica
l Vel
oci
ty (m
/s)
Ben
din
g M
om
en
t (k
N.m
)
Time (s)
Bending Moment Vertical Velocity
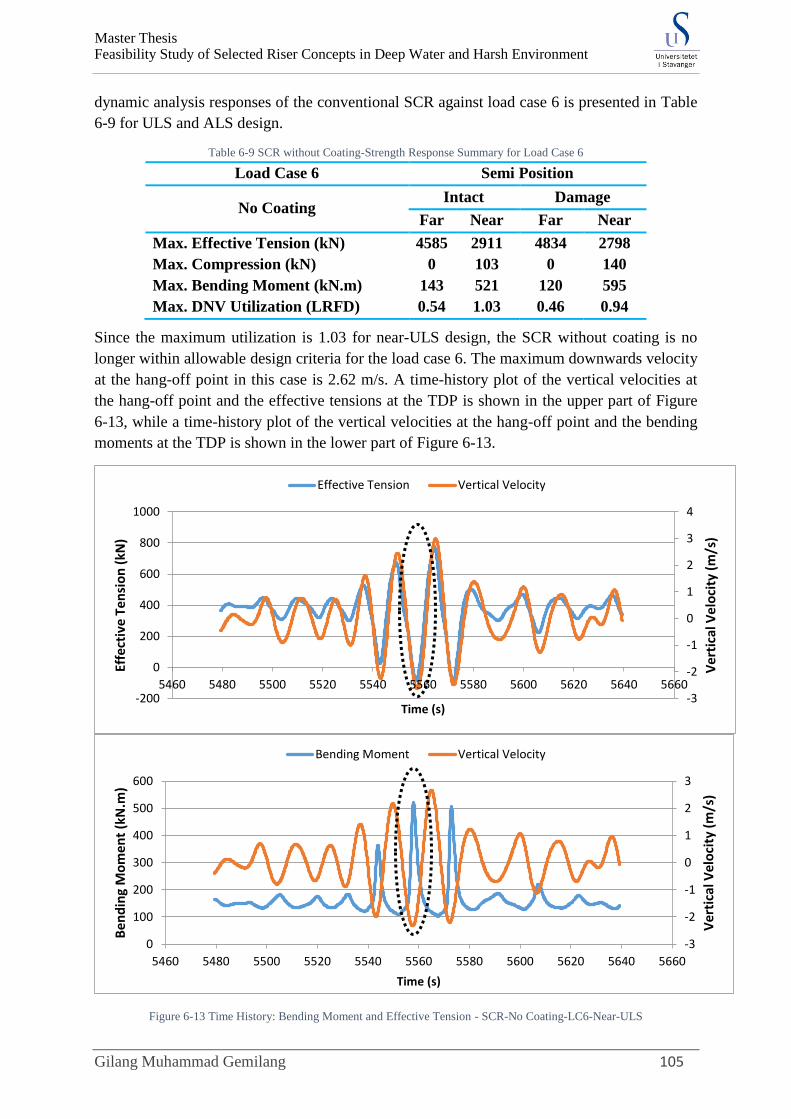
Master Thesis Feasibility Study of Selected Riser Concepts in Deep Water and Harsh Environment
Gilang Muhammad Gemilang 105
dynamic analysis responses of the conventional SCR against load case 6 is presented in Table
6-9 for ULS and ALS design.
Table 6-9 SCR without Coating-Strength Response Summary for Load Case 6
Load Case 6 Semi Position
No Coating Intact Damage
Far Near Far Near
Max. Effective Tension (kN) 4585 2911 4834 2798
Max. Compression (kN) 0 103 0 140
Max. Bending Moment (kN.m) 143 521 120 595
Max. DNV Utilization (LRFD) 0.54 1.03 0.46 0.94
Since the maximum utilization is 1.03 for near-ULS design, the SCR without coating is no
longer within allowable design criteria for the load case 6. The maximum downwards velocity
at the hang-off point in this case is 2.62 m/s. A time-history plot of the vertical velocities at
the hang-off point and the effective tensions at the TDP is shown in the upper part of Figure
6-13, while a time-history plot of the vertical velocities at the hang-off point and the bending
moments at the TDP is shown in the lower part of Figure 6-13.
Figure 6-13 Time History: Bending Moment and Effective Tension - SCR-No Coating-LC6-Near-ULS
-3
-2
-1
0
1
2
3
4
-200
0
200
400
600
800
1000
5460 5480 5500 5520 5540 5560 5580 5600 5620 5640 5660
Ve
rtic
al V
elo
city
(m
/s)
Effe
ctiv
e T
en
sio
n (
kN)
Time (s)
Effective Tension Vertical Velocity
-3
-2
-1
0
1
2
3
0
100
200
300
400
500
600
5460 5480 5500 5520 5540 5560 5580 5600 5620 5640 5660
Ver
tica
l Vel
oci
ty (
m/s
)
Ben
din
g M
om
en
t (k
N.m
)
Time (s)
Bending Moment Vertical Velocity

Master Thesis Feasibility Study of Selected Riser Concepts in Deep Water and Harsh Environment
Gilang Muhammad Gemilang 106
From the upper part of Figure 6-13, it can be seen from the graph that the vertical velocities at
the hang-off point and the effective tensions at the TDP synchronize with respect to the “rise”
and “fall”, while the maximum downward velocity at the hang-off point associates directly
with the minimum effective tension (compression) at the TDP. From the lower part of Figure
6-13, it can be seen from the graph that the vertical velocities at the hang-off point and the
bending moments at the TDP synchronize with respect to the “rise” and “fall” in the opposite
direction, while the maximum downward velocity at the hang-off point associates directly
with the maximum bending moment at the TDP.
Together with the maximum bending moment and the maximum compression, riser is
subjected to buckling, giving excessive buckling utilization to the riser. These responses
explain how the maximum downward velocity determines the maximum utilization. This
phenomenon is identical with the previous case. In summary, the SCR without coating is not
able to cope with maximum downward velocity of 2.62 m/s.
In general, the following are summarized from the conventional SCR response:
The difference between the static utilization and the dynamic utilization is more than 0.7
for the near-ULS design for the load case 5. This difference can be even higher in harsher
environment. This is an indication that the SCR is very sensitive to floater heave motion.
The SCR with coating has higher utilization than the SCR without coating. This is an
indication that coating makes riser lighter and more sensitive to the floater heave motion.
Thus, it can be concluded that the heavier the riser, the less sensitive riser to the floater
heave motion for SCR configuration.
For near-ULS design with load case 5, the maximum compression of the SCR with coating
is 181 kN and the maximum compression of the SCR without coating is 14 kN, see Figure
6-14. The compression (negative effective tension) is unwanted as compression might
result into riser buckle. This is an indication that the lighter SCR has more compression
than the heavier SCR. The SCR needs to be heavy enough to avoid compression.
Figure 6-14 Minimum Dynamic Effective Tension SCR-LC5

Master Thesis Feasibility Study of Selected Riser Concepts in Deep Water and Harsh Environment
Gilang Muhammad Gemilang 107
The near-ULS design always gives the maximum utilization. This is an indication that the
near-ULS design is the critical to the design for SCR configuration.
From the Figure 6-12 and the Figure 6-13, it can be seen that the upward velocity increases
the effective tensions and decreases the bending moments at the TDP. Oppositely, the
downward velocity decreases the effective tension and increases the bending moment.
The maximum downward velocity induces the combination of the maximum compression
and the maximum bending moment. The combination of the maximum compression
(negative effective tension) and the maximum bending moment induces the maximum
utilization.
The maximum utilization and maximum downward velocity at the hang-off point occurred
simultaneously. This is an indication that the maximum downward velocity at the hang-off
point can be concluded as a key driving parameter of riser integrity.
6.4.2 Dynamic Analysis of WDSCR
Load Case 5
The WDSCR integrity is checked against the load case 5. The summary of the dynamic
analysis responses of the WDSCR against load case 5 is presented in Table 6-10 for ULS and
ALS design.
Table 6-10 WDSCR-Strength Response Summary for Load Case 5
Load Case 5 Semi Position
Coating Intact Damage
Far Near Far Near
Max. Effective Tension (kN) 4902 3097 5163 2963
Max. Compression (kN) 0 0 0 0
Max. Bending Moment (kN.m) 111 297 96 372
Max. DNV Utilization (LRFD) 0.59 0.64 0.50 0.64
No Coating
Max. Effective Tension (kN) 4976 3365 5231 3240
Max. Compression (kN) 0 0 0 0
Max. Bending Moment (kN.m) 80 244 69 297
Max. DNV Utilization (LRFD) 0.58 0.55 0.50 0.54
In general, the following are summarized from the WDSCR response against load case 5:
In dynamic analysis, providing heavy cross sections at the bottom of straight section could
improve significantly the riser integrity by reducing the maximum utilization from 1.14 to
0.64. The maximum utilization of the SCR and the WDSCR are then plotted over the entire
length in Figure 6-15 for near-ULS design. It is seen clearly how WDSCR improve the
riser integrity by having much less utilization at the TDP.
Figure 6-16 presents the comparison of the SCR and the WDSR in terms of maximum
dynamic bending moment over entire riser length for near-ULS design. It is seen from
Figure 6-16, the heavy cross section reduces the dynamic bending moment at the TDP. The

Master Thesis Feasibility Study of Selected Riser Concepts in Deep Water and Harsh Environment
Gilang Muhammad Gemilang 108
dynamic bending moment is reduced significantly about 300 kN.m by introducing heavy
cross section for the WDSCR.
It is observed that no compression occurred in the WDSCR for load case 5, while
compression occurred in the SCR for load case 5 as described in Table 6-8. This is an
indication that the heavy cross section reduces the dynamic behavior of the riser; thereby
the negative effective tension can be eliminated or reduced.
The WDSCR becomes less sensitive to floater heave motion compared to the SCR. This is
the consequences of adding the heavy cross section at the bottom of straight section.
The maximum utilization is 0.64 and 0.55 for coating and no coating respectively, for near-
ULS design. This has been identified that the coating makes riser lighter and more
sensitive to the floater heave motion, thus the WDSCR with coating has higher utilization
than the WDSCR without coating.
In this case, the maximum downward velocity at the hang-off point is 2.33 m/s. This shows
that the WDSCR can cope with downward velocity of 2.33 m/s at the hang-off point.
Figure 6-15 Maximum Dynamic Utilization of SCR and WDSCR with Coating
0
0.2
0.4
0.6
0.8
1
1.2
0 500 1000 1500 2000 2500 3000
Max
imu
m U
tiliz
atio
n
Arc length (m)
Utilization Near-ULS Design LC5
LC5 WDSCR Coating LC5 SCR Coating

Master Thesis Feasibility Study of Selected Riser Concepts in Deep Water and Harsh Environment
Gilang Muhammad Gemilang 109
Figure 6-16 Maximum Dynamic Bending Moment Comparison of SCR and WDSCR with Coating
To further investigate the strength improvement of the WDSCR compared to the conventional
SCR for load case 5, the range of dynamic motions along the entire riser length is
investigated. The best interest from dynamic motions for strength analysis is the maximum
downward velocity at the TDP where the maximum utilization occurred. The maximum
downward velocity along the entire riser length for the SCR with coating and the WDSCR
with coating is presented in Figure 6-17.
Figure 6-17 Maximum Downward Velocity Range for WDSCR and Conventional SCR – Load Case 5
0
100
200
300
400
500
600
700
0 500 1000 1500 2000 2500 3000Max
imu
m B
end
ing
Mo
me
nt
(kN
.m)
Arclength (m)
Bending Moment Near-ULS Design LC5
LC5 WDSCR Coating LC5 SCR Coating
0
0.5
1
1.5
2
2.5
3
3.5
0 500 1000 1500 2000 2500 3000
Max
imu
m D
ow
nw
ard
Vel
oci
ty (
m/s
)
Arc length (m)
SCR WDSCR
SCR TDP
WDSCR TDP

Master Thesis Feasibility Study of Selected Riser Concepts in Deep Water and Harsh Environment
Gilang Muhammad Gemilang 110
From the Figure 6-17, it can be analyzed that the ballast modules are effective to reduce the
dynamic motion at the TDP, resulting in lower utilization. Even though the WDSCR and SCR
have the same downward velocity at the hang-off point, the WDSCR configuration has much
lower dynamic motion at the TDP compared to the SCR as seen in Figure 6-17. This lower
dynamic motion of the WDSCR is also beneficial from a fatigue point of view. This explains
why heavy cross sections can improve the SCR response in the critical area. This gives a good
understanding that the WDSCR configuration has more capability to cope with floater heave
motion with significantly lower utilization at the TDP compared to the SCR.
Load Case 6
The summary of the dynamic analysis responses of the WDSCR against the load case 6 is
presented in Table 6-11 for ULS and ALS design.
Table 6-11 WDSCR-Strength Response Summary for Load Case 6
Load Case 6 Semi Position
Coating Intact Damage
Far Near Far Near
Max. Effective Tension (kN) 5219 3180 5504 3038
Max. Compression (kN) 0 72 0 83
Max. Bending Moment (kN.m) 159 372 137 414
Max. DNV Utilization (LRFD) 0.65 0.77 0.54 0.69
No Coating
Max. Effective Tension (kN) 5227 3439 5502 3310
Max. Compression (kN) 0 0 0 0
Max. Bending Moment (kN.m) 101 299 86 317
Max. DNV Utilization (LRFD) 0.63 0.65 0.53 0.56
The maximum utilization is observed in near-ULS design. The maximum utilizations are 0.77
and 0.65 for the WDSCR with coating and the WDSCR without coating, respectively. In this
case, the maximum downward velocity at the hang-off point is 2.62 m/s. This shows that
WDSCR can cope with downward velocity of 2.62 m/s at the hang-off point.
Load Case 7
The summary of the dynamic analysis responses of the WDSCR against the load case 7 is
presented in Table 6-12 for ULS and ALS design.
Table 6-12 WDSCR-Strength Response Summary for Load Case 7
Load Case 7 Semi Position
Coating Intact Damage
Far Near Far Near
Max. Effective Tension (kN) 5560 3270 5869 3120
Max. Compression (kN) 23 179 0 195
Max. Bending Moment (kN.m) 235 468 204 463
Max. DNV Utilization (LRFD) 0.71 0.94 0.59 0.76

Master Thesis Feasibility Study of Selected Riser Concepts in Deep Water and Harsh Environment
Gilang Muhammad Gemilang 111
No Coating
Max. Effective Tension (kN) 5500 3522 5795 3386
Max. Compression (kN) 0 18 0 52
Max. Bending Moment (kN.m) 133 369 113 387
Max. DNV Utilization (LRFD) 0.68 0.77 0.57 0.66
The maximum utilization is observed in near-ULS design. The maximum utilizations are 0.94
and 0.77 for the WDSCR with coating and the WDSCR without coating respectively. In this
case, the maximum downward velocity at the hang-off point is 2.91 m/s. This shows that the
WDSCR can cope with downward velocity of 2.91 m/s at the hang-off point.
Load Case 8
The summary of the dynamic analysis responses of the WDSCR against the load case 8 is
presented in Table 6-13 for ULS and ALS design.
Table 6-13 WDSCR-Strength Response Summary for Load Case 8
Load Case 8 Semi Position
Coating Intact Damage
Far Near Far Near
Max. Effective Tension (kN) 5546 3309 5757 3137
Max. Compression (kN) 335 373 465 433
Max. Bending Moment (kN.m) 298 661 311 591
Max. DNV Utilization (LRFD) 0.71 1.28 0.57 0.93
No Coating
Max. Effective Tension (kN) 5499 3557 5718 3400
Max. Compression (kN) 0 196 0 247
Max. Bending Moment (kN.m) 180 531 187 556
Max. DNV Utilization (LRFD) 0.68 1.05 0.56 0.88
The maximum utilizations are no longer within allowable design criteria. The maximum
utilization of the WDSCR with coating is 1.28, while the maximum utilization of the WDSCR
without coating is 1.05. The WDSCR is not feasible for load case 8. In this case, the
maximum downward velocity at the hang-off point is 3.27 m/s. The vertical velocities at the
hang-off point and the bending moments at the TDP are plotted over time history for the
WDSCR with coating and for the WDSCR without coating in Figure 6-18 and Figure 6-19
respectively. It is seen from the graph that the vertical velocities at the hang-off point and the
bending moments at the TDP synchronize with respect to the “rise” and “fall” in the opposite
direction, while the maximum downward velocity at the hang-off point associates directly
with the maximum bending moment at the TDP. This is an indication that the maximum
downward velocity at the hang-off point induces the maximum bending moment at the TDP.
It can be analyzed, from comparing both Figure 6-18 and Figure 6-19, that the maximum
bending moment of the WDSCR with coating is greater than the maximum bending moment
of the WDSCR without coating. This is an indication that the WDSCR without coating, which
is heavier, is better to avoid excessive bending moment than the WDSCR with coating.

Master Thesis Feasibility Study of Selected Riser Concepts in Deep Water and Harsh Environment
Gilang Muhammad Gemilang 112
Figure 6-18 Vertical Velocity VS Bending Moment, WDSCR, LC8, coating
Figure 6-19 Vertical Velocity VS Bending Moment, WDSCR, LC8, No Coating
The vertical velocities at the hang-off point and effective tensions at the TDP are plotted over
time history for the WDSCR with coating and the WDSCR without coating in Figure 6-20
and Figure 6-21 respectively. It is seen from the graph that the vertical velocities at the hang-
off point and the effective tensions at the TDP synchronize with respect to the “rise” and
“fall”, while the maximum downward velocity at the hang-off point associates directly with
the minimum effective tension (compression) at the TDP. This is an indication that the
maximum downward velocity at the hang-off point induces the maximum compression at the
TDP. It can also be analyzed that the maximum compression of the WDSCR with coating is
373 kN, while the maximum compression of the WDSCR without coating is 196 kN. This is
an indication that the WDSCR without coating, which is heavier, is better to avoid excessive
compression than the WDSCR with coating.
-4
-3
-2
-1
0
1
2
3
4
0
100
200
300
400
500
600
700
1900 1920 1940 1960 1980 2000 2020 2040 2060 2080 2100 2120
Ver
tica
l Vel
oci
ty (
m/s
)
Ben
din
g M
om
en
t (k
N.m
)
Time (s)
Bending Moment Vertical Velocity at riser hang-off
-4
-3
-2
-1
0
1
2
3
4
0
100
200
300
400
500
600
1900 1920 1940 1960 1980 2000 2020 2040 2060 2080 2100 2120V
ert
ical
Ve
loci
ty (
m/s
)
Be
nd
ing
Mo
me
nt
(kN
.m)
Time (s)
Bending Moment Vertical Velocity at riser hang-off

Master Thesis Feasibility Study of Selected Riser Concepts in Deep Water and Harsh Environment
Gilang Muhammad Gemilang 113
The combination of the maximum compression and maximum bending moment results in
excessive utilization. Therefore, the utilization of WDSCR is more than unity which is not
within the allowable criteria. This is a good understanding that the downward velocity at the
hang-off point dominates the WDSCR‟s critical responses in the global strength design.
Figure 6-20 Vertical Velocity VS Effective Tension, WDSCR, LC8, Coating
Figure 6-21 Vertical Velocity VS Effective Tension, WDSCR, LC8, No Coating
6.4.3 Dynamic Analysis of SLWR
As the results of the WDSCR are not within allowable design criteria for the load case 8, the
next analysis is to check SLWR integrity against the load case 8. The summary of the
dynamic analysis responses of SLWR against the load case 8 is presented in Table 6-14 for
ULS and ALS design.
-4
-3
-2
-1
0
1
2
3
4
-600
-400
-200
0
200
400
600
800
1000
1200
1900 1920 1940 1960 1980 2000 2020 2040 2060 2080 2100 2120
Ver
tica
l Vel
oci
ty (
m/s
)
Effe
ctiv
e Te
nsi
on
(kN
)
Time (s)
Effective Tension Vertical Velocity at riser hang-off
-4
-3
-2
-1
0
1
2
3
4
-400
-200
0
200
400
600
800
1000
1200
1900 1920 1940 1960 1980 2000 2020 2040 2060 2080 2100 2120
Ver
tica
l Vel
oci
ty (
m/s
)
Effe
ctiv
e Te
nsi
on
(kN
)
Time (s)
Effective Tension Vertical Velocity at riser hang-off

Master Thesis Feasibility Study of Selected Riser Concepts in Deep Water and Harsh Environment
Gilang Muhammad Gemilang 114
Table 6-14 Summary result of SLWR against LC8
Load Case 8 Semi Position
Coating Intact Damage
Far Near Far Near
Max. Effective Top Tension (kN) 2547 2296 2552 2307
Sag-bend
Max. Effective Tension (kN) 775 314 832 292
Max. Bending Moment (kN.m) 166 331 161 353
Max. DNV Utilization (LRFD) 0.40 0.66 0.36 0.61
Hog-bend
Max. Effective Tension (kN) 763 289 824 273
Max. Bending Moment (kN.m) 139 228 138 245
Max. DNV Utilization (LRFD) 0.36 0.51 0.33 0.47
TDP
Max. Effective Tension (kN) 763 257 824 246
Max. Bending Moment (kN.m) 166 325 163 345
Max. DNV Utilization (LRFD) 0.41 0.66 0.36 0.60
Load Case 8 Semi Position
No Coating Intact Damage
Far Near Far Near
Max. Effective Top Tension (kN) 2747 2532 2763 2537
Sag-bend
Max. Effective Tension (kN) 807 355 869 332
Max. Bending Moment (kN.m) 161 329 154 352
Max. DNV Utilization (LRFD) 0.39 0.66 0.35 0.61
Hog-bend
Max. Effective Tension (kN) 794 308 858 290
Max. Bending Moment (kN.m) 120 202 117 216
Max. DNV Utilization (LRFD) 0.34 0.47 0.30 0.43
TDP
Max. Effective Tension (kN) 793 275 857 260
Max. Bending Moment (kN.m) 166 323 161 342
Max. DNV Utilization (LRFD) 0.40 0.65 0.36 0.60
In general, the following are observed from the SLWR response against the load Case 8:
All utilizations are within allowable design criteria. The maximum utilization is 0.66 at the
sag-bend area for the near-ULS design.
It can be concluded that the near-ULS design is more critical to extreme response in the
SLWR design.

Master Thesis Feasibility Study of Selected Riser Concepts in Deep Water and Harsh Environment
Gilang Muhammad Gemilang 115
The difference between the static utilization and dynamic utilization is only 0.12 for near-
ULS design, and 0.05 for far-ULS design. This indicates that the SLWR is not sensitive to
floater heave motion, thereby the static equilibrium dominates the global strength design.
Results of utilization from both SLWR with coating and SLWR without coating are fairly
equal. This indicates that the coating does not influence the SLWR integrity significantly.
The comparison of the maximum utilization between the SLWR with coating and the
WDSCR with coating is presented in Figure 6-22 for near-ULS design with load case 8. It can
be analyzed from Figure 6-22, although the SLWR configuration introduces utilization at the
sag-bend, hog-bend and TDP, the maximum utilization of the SLWR is much lower than the
maximum utilization of the WDSCR. This is an indication that the lazy wave configuration
can distribute the stress over the riser length efficiently with buoyancy modules and result in
lower utilizations compared to the WDSCR.
Figure 6-22 Maximum Dynamic Utilization of WDSCR and SLWR with Coating
To further investigate the strength improvement for the SLWR compared to the WDSCR with
load case 8, the range of dynamic motions along the entire riser length is investigated. The
best interest from the dynamic motions of riser is the maximum downward velocity at the
TDP. The maximum downward velocity along the entire riser length for the WDSCR and the
SLWR is presented in Figure 6-23.
From the Figure 6-23, it can be analyzed that the buoyancy modules are effective to isolate
the dynamic motion of the floater from the TDP motion, resulting in lower utilizations. The
“lazy wave” configuration efficiently absorbs the floater heave motion. Even though the
WDSCR and the SLWR have the same downward velocity at the hang-off point, the SLWR
configuration has much lower dynamic motion at the TDP compared to the WDSCR. This
lower dynamic motion of SLWR is also beneficial from a fatigue point of view. This gives a
0
0.2
0.4
0.6
0.8
1
1.2
1.4
0 500 1000 1500 2000 2500 3000
Max
imu
m U
tiliz
atio
n
Arc length (m)
Utilization Near-ULS Design - Load Case 8
LC8 WDSCR Coating LC8 SLWR Coating
WDSCR TDP
SLWR Sag-bend SLWR TDP SLWR Hog-bend

Master Thesis Feasibility Study of Selected Riser Concepts in Deep Water and Harsh Environment
Gilang Muhammad Gemilang 116
good understanding that the SLWR configuration has more capability to cope with floater
heave motion with significantly lower motion at the TDP compared to the WDSCR.
Figure 6-23 Maximum Downward Velocity Range for SLWR and WDSCR – Load Case 8
The next analysis is to check SLWR integrity against the rest of all load cases, the summary
of the analysis is presented in Table 6-15. The results showed that the SLWR configuration
can cope with the rest of all load cases. The detail analysis results for the SLWR against the
rest of all load cases (9, 10, 11, 12, 13, 14, 15) are provided in Appendix B.
Table 6-15 SLWR- Dynamic analysis Summary
SLWR Summary Result Semi Position
Load
Case Max. DNV Utilization (LRFD)
Intact Damage
Far Near Far Near
LC9 Coating 0.42 0.67 0.37 0.62
No Coating 0.41 0.66 0.36 0.61
LC10 Coating 0.44 0.68 0.38 0.62
No Coating 0.41 0.67 0.37 0.62
LC11 Coating 0.47 0.68 0.41 0.62
No Coating 0.45 0.68 0.4 0.62
LC12 Coating 0.46 0.69 0.41 0.63
No Coating 0.44 0.69 0.39 0.63
LC13 Coating 0.52 0.72 0.48 0.64
No Coating 0.47 0.72 0.43 0.64
LC14 Coating 0.64 0.73 0.59 0.66
No Coating 0.52 0.73 0.48 0.65
LC15 Coating 0.76 0.75 0.73 0.67
No Coating 0.6 0.75 0.58 0.67
0
0.5
1
1.5
2
2.5
3
3.5
4
4.5
0 500 1000 1500 2000 2500 3000
Max
imu
m D
ow
nw
ard
Ve
loci
ty (
m/s
)
Arc length (m)
WDSCR SLWR
WDSCR TDP
SLWR TDP

Master Thesis Feasibility Study of Selected Riser Concepts in Deep Water and Harsh Environment
Gilang Muhammad Gemilang 117
The SLWR integrity is still within allowable criteria for load case 15. The maximum
downward velocity at the hang-off point is 6 m/s in load case 15, which means that the SLWR
can cope with a maximum downward velocity of 6 m/s at the hang-off point.
6.5 Summary
The conventional SCR, WDSCR and SLWR responses have been screened with different
maximum downward velocity at the hang-off point. The capability of riser to cope with
floater motion is assessed with LRFD utilization. The maximum bending moment and the
maximum compression at the TDP have been identified when the maximum downward
velocity at the hang-off point occurred at the same time. The combination of the maximum
bending moment and the maximum compression may result into riser buckle. Therefore, it
can be concluded that the downward velocity at the hang-off point is the main driving factor
for riser integrity.
However, for SLWR configuration, the floater motion can be isolated from the TDP motion
very well by introducing buoyancy modules at the hog-bend area. The SLWR configuration
can cope with the downward velocity of 6 m/s at the hang-off point. Figure 6-24 presents the
result of the utilization as y-axis and the downward velocity at the hang-off point as the x-axis
for each riser configuration. Figure 6-24 is obtained from the results of the resulting
maximum utilization and the maximum downward velocity from each load case.
By considering the allowable design criteria, the threshold of the maximum downward
velocity at the hang-off point is identified for each riser configuration. The feasible SCR with
coating can be obtained if the downward velocity at the hang-off point is restricted below 2.15
m/s as the line crossing the value of unity in y-axis. On the other hand, the feasible SCR
without coating can be obtained if the downward velocity at hang-off point is restricted below
2.6 m/s.
The feasible WDSCR with coating can be obtained if the downward velocity at the hang-off
point is restricted below 3 m/s. On the other hand, the feasible WDSCR without coating can
be obtained if the downward velocity at the hang-off point is restricted below 3.2 m/s. The
SLWR has shown superior performance over the SCR and the WDSCR as the SLWR can
cope with the downward velocity of 6 m/s at the hang-off point.
From the results, it can also be analyzed that the SCR without coating can cope with greater
downward velocity at the hang-off point than the SCR with coating. It also can be seen that
the WDSCR without coating can cope with greater downward velocity at the hang-off point
than the WDSCR with coating. However, the SLWR configuration with coating and the
SLWR without coating give fairly equal results. It can be concluded that the uniform external
coating influence the riser integrity for the SCR/WDSCR. The heavier the SCR/WDSCR, the
better riser integrity is achieved to cope with the large motion of the host platform. On the
other hand, the effect of uniform external coating is not significant for the SLWR.
The next analysis is to analyze the threshold of downward velocity in the touchdown area for
the SCR and the WDSCR. The interest location is at 50 meters above seabed when vessel is
in mean position, which is referred to as point B. Figure 6-25 presents the result of the

Master Thesis Feasibility Study of Selected Riser Concepts in Deep Water and Harsh Environment
Gilang Muhammad Gemilang 118
maximum utilization as the y-axis and the downward velocity at point B as x-axis for the SCR
and the WDSCR. It is found from a separate study that the feasible SCR can be obtained, if
the downward velocity at point B is restricted below 2.54 m/s for the SCR with coating and
3.03 m/s for the SCR without coating. Furthermore, the downward velocity at point B is
restricted below 3.07 m/s for the WDSCR with coating and 3.43 m/s for the WDSCR without
coating. These thresholds of downward velocity are summarized in Table 6-16.
Table 6-16 Summary of Downward Velocity Threshold
Threshold of downward velocity (m/s)
Riser Configuration Hang off point Point B
SCR with coating 2.15 2.54
SCR without coating 2.60 3.03
WDSCR with coating 3.00 3.07
WDSCR without coating 3.20 3.43
Figure 6-24 Utilization VS Max. Downward Velocity at the Hang-off Point
0
0.2
0.4
0.6
0.8
1
1.2
1.4
0 1 2 3 4 5 6 7
Uti
lizat
ion
Downward Velocity at the hang-off Point (m/s)
SCR Coating SCR Nocoating WDSCR Coating
WDSCR Nocoating SLWR Coating SLWR Nocoating

Master Thesis Feasibility Study of Selected Riser Concepts in Deep Water and Harsh Environment
Gilang Muhammad Gemilang 119
Figure 6-25 Utilization VS Max. Downward Velocity at Point B
6.6 SLWR for Northern North Sea Condition
6.6.1 Introduction
Since only the SLWR configuration can cope with severe dynamic motions of the floater, the
extreme response analysis is carried out for the SLWR in the North Sea environment. The aim
is to confirm that the SLWR application in extreme sea-states of North Sea satisfies the
strength requirement. The SLWR without coating is selected for this analysis. The extreme
response calculation is carried out using non-linear time domain analysis. The design storm
approach of single wave data is considered in this analysis since it is relevant in connection
with nonlinear action effects (Norsok, 2007). As the study location is in the North Sea, the
JONSWAP spectrum is applied to model irregular wave as described in section 4.2.4.
To make sure that the extreme value distribution of the storm condition is appropriately
accounted for, the 90% percentile response from the 20 realizations of „3-hour storm‟ period
is considered as the extreme response value for the extreme response analysis. The objective
of the long simulation time and consideration of 20 realizations in this study is to ensure the
extreme response analysis is performed in accordance with DNV-OS-F201 for satisfactory
statistical confidence. The interest responses of the SLWR are bending moment, effective
tension, compression and utilization in critical locations, i.e. the sag-bend, hog-bend and TDP.
The static results of the SLWR were established in section 6.3.3. For dynamic analysis,
environmental load of waves and current were applied in-plane with the riser‟s lay direction
in both 0o and 180
o direction for far and near offset position, respectively.
0
0.2
0.4
0.6
0.8
1
1.2
1.4
0 0.5 1 1.5 2 2.5 3 3.5 4
Uti
lizat
ion
Downward Velocity at Point B (m/s)
SCR Coating SCR Nocoating WDSCR Coating WDSCR Nocoating

Master Thesis Feasibility Study of Selected Riser Concepts in Deep Water and Harsh Environment
Gilang Muhammad Gemilang 120
6.6.2 Environmental Data
The strength analyses were performed with 100-year waves and 10-year currents for intact
condition and damage condition. The 10-year current profile is presented in Table 5-2. The
significant wave height of 17 m and corresponding peak period of 18.8 seconds are the wave
parameters for the design storm combination in the North Sea. Peak shape parameter (ϒ) is
determined based on the relationship of significant wave and peak period as described in
section 4.2.4.
In summary, the extreme sea-state is modeled by irregular waves of JONSWAP with 100-year
sea-state as follows:
Significant wave height (Hs) : 17.0 m
Corresponding wave peak period (Tp) : 18.8 s
Peak shape parameter (ϒ) : 1.66
6.6.3 Results and Discussion
The SLWR satisfies the strength requirement both for ULS and ALS design. The summary of
the strength analysis is presented in Table 6-17.
Table 6-17 Strength Analysis Summary
North Sea Semi Position
Intact Damage
No Coating Far Near Far Near
Max. Top Angle 15.83 17.83 16.85 18.19
Min. Top Angle 0.22 3.76 0.83 3.78
Effective Top Tension (kN) 3086 2777 3177 2793
Sag-bend
Max. Effective Tension (kN) 1132 415 1278 392
Max. Compression (kN) 0 6 0 4
Max. Bending Moment (kN.m) 237 351 238 370
DNV Utilization (LRFD) 0.51 0.70 0.46 0.64
Hog-bend
Max. Effective Tension (kN) 1153.675 364 1311 343
Max. Compression (kN) 0 0 0 0
Max. Bending Moment (kN.m) 224 224 231 232
DNV Utilization (LRFD) 0.51 0.51 0.45 0.45
TDP
Max. Effective Tension (kN) 1153 299 1311 278
Max. Compression (kN) 0 0 0 0
Max. Bending Moment (kN.m) 240 380 242 395
DNV Utilization (LRFD) 0.51 0.75 0.46 0.67

Master Thesis Feasibility Study of Selected Riser Concepts in Deep Water and Harsh Environment
Gilang Muhammad Gemilang 121
Overall, the following are observed from the SLWR response when exposed to extreme sea-
state condition:
The SLWR top angle varies as the responses to extreme sea-state conditions. The static top
angle is 8o relative to vertical. The range of the top angle‟s variations in dynamic analysis
is between -7.8o to +10.2
o. The variation of the top angle of SLWR is plotted over time
history in Figure 6-26.
The maximum effective top tension is 3177 kN and is observed at the top end of the riser
for the far-ALS design.
There are no significant residual compression loads in the riser for all limit states.
The maximum bending moment is 395 kN.m and is observed at the TDP for the near-ALS
design.
Maximum utilizations for all limit states are kept below allowable limits. The most critical
buckling utilization is 0.75 and is observed at the TDP for near-ULS design.
The difference between the static utilization and the dynamic utilization is around 0.2 for
corresponding offset position. This indicates that the SLWR is insensitive to the floater
heave motions; hence the static equilibrium dominates the global strength design.
In summary, the extreme response has been performed with extensive study for the SLWR
without coating. The result of extreme response analysis is within the allowable design
criteria and the SLWR is feasible to be applied in typical Northern North Sea condition.
Figure 6-26 Variation of Top Angle in Time History

Master Thesis Feasibility Study of Selected Riser Concepts in Deep Water and Harsh Environment
Gilang Muhammad Gemilang 122
6.6.4 Comparison of Critical Sections
It can be analyzed from Table 6-17 that the SLWR responses at the sag-bend, hog-bend and
TDP are different. To see the differences between those sections, the maximum dynamic
response of SLWR is plotted over the entire length for far-ULS design and near-ULS design.
The compared responses are the maximum dynamic effective tension, the maximum dynamic
bending moment and maximum dynamic utilization.
It can be analyzed from the Figure 6-27, the effective tension at the sag-bend, hog-bend and
TDP is fairly equal in far offset position. This is an indication, that the effective tension is
horizontally distributed along sag-bend, hog-bend and TDP. On the other hand, the effective
tension is gradually reduced from the sag-bend to the TDP in near offset position.
Figure 6-27 Maximum Effective Tension over entire riser length, far and near offset-ULS
From Figure 6-28, it can be analyzed that the bending moments at the sag-bend and the TDP
are greater than the bending moment at the hog-bend in the near offset position. This indicates
that the sag-bend and the TDP are more critical to extreme response in design. However, the
bending moment at the hog-bend is at its peak when the vessel is in the far offset position.
The maximum bending moment at the hog-bend is almost identical with the maximum
bending moment at the sag-bend and the TDP in the far offset position.
Figure 6-29 shows the maximum utilization over entire riser length. It can be seen that, the
maximum utilization envelope is identical to the maximum bending moment envelope. This is
because the riser has structurally less capacity to withstand lateral load than axial load. It is
analyzed from Figure 6-29, the maximum utilization occurs in the near offset position. This
indicates that the near offset position is more critical to extreme response in the design. The
maximum utilization in the top region also occurred in the far offset position, since the
maximum effective tension occurred in the far offset position.
0
500
1000
1500
2000
2500
3000
3500
0 500 1000 1500 2000 2500 3000
Effe
ctiv
e T
en
sio
n (
kN.m
)
Arc length (m)
Maximum Effective Tension at Far and Near offset position
ULS NEAR ULS FAR

Master Thesis Feasibility Study of Selected Riser Concepts in Deep Water and Harsh Environment
Gilang Muhammad Gemilang 123
Figure 6-28 Maximum Bending Moment over entire riser length, far and near offset-ULS
Figure 6-29 Maximum Utilization over entire riser length, far and near offset-ULS
From all results of the extreme response analysis, the SLWR is feasible for deployment in
deep water and harsh environment, in typical Northern North Sea condition. The fatigue
analysis will be performed to assess the fatigue performance of the SCR, the WDSCR and the
SLWR against the FLS design criteria in the next section.
0
50
100
150
200
250
300
350
400
450
0 500 1000 1500 2000 2500 3000
Ben
din
g M
om
en
t (k
N.m
)
Arc length (m)
Maximum Bending Moment at Far and Near offset position
ULS NEAR ULS FAR
0
0.1
0.2
0.3
0.4
0.5
0.6
0.7
0.8
0 500 1000 1500 2000 2500 3000
Uti
lizai
on
Arc length (m)
Maximum Utilization at Far and Near offset position
ULS NEAR ULS FAR

Master Thesis Feasibility Study of Selected Riser Concepts in Deep Water and Harsh Environment
Gilang Muhammad Gemilang 124
Chapter 7. Fatigue Analysis
7.1 Introduction
A slender structure is subjected to dynamic environmental actions in deep water and harsh
environment. Random waves and current generate oscillatory motions to the riser and the host
platform. The riser is being lifted up and laid down repeatedly upon the seabed as responses
to the floater heave motion. These environmental loads and vessel motions induce
continuously cyclic stresses on the riser system. In addition, Vortex Induced Vibrations (VIV)
contributes to fatigue damage due to the current. The current creates unsteady and turbulent
vortex flow patterns around the cylinder section.
This is referred to as vortex shedding. If the vortex shedding frequency and the eigen
frequency of the riser are matched, the structure would start to vibrate in either cross-flow or
in-flow direction. According to DNV (2010a), the main sources causing fatigue damage to
riser are addressed as follows:
• Wave-induced stress cycles;
• Low-frequency stress cycles;
• Vortex-induced vibrations (VIV) stress cycles;
The fatigue life at a point of riser pipe is defined as the time to grow a crack over the wall
thickness. The critical region of riser for fatigue damage is located at the welded joint
connection near the touchdown point since there is a complex interaction between the
dynamic motion of the riser and the seabed on that region (Karunakaran et al., 2005). Thereby
the welded joint connection at the TDP is the most susceptible to crack initiation due to
fatigue damage. An inadequate fatigue life might cause fatigue failure of the riser system
during service life. Therefore, it is important to ensure that the riser system has an adequate
fatigue life during service life.
The calculations of fatigue life are carried out by using the ORCAFLEX software for wave
induced fatigue analysis, while the calculations of fatigue life are carried out using VIVANA
software for fatigue VIV analysis. The objective of this study is to analyze the fatigue
performance of the conventional SCR, the WDSCR and the SLWR. The conventional SCR,
the WDSCR and the SLWR without coating are selected in this fatigue analysis. Thereby
wave induced fatigue analysis is performed for the three riser configurations to understand the
different fatigue behavior of them and check against the FLS design criteria.
Afterwards, the fatigue VIV analysis is performed. The analysis methodology for wave
induced fatigue analysis is a nonlinear time domain applying irregular wave models. The
analysis methodology for fatigue VIV analysis is a combination of nonlinear time domain and
frequency domain procedure. The fatigue response is very critical for SCR in harsh
environment (Karunakaran and Baarholm, 2013). Thereby a very comprehensive fatigue
analysis is performed with reliable data from typical Northern North Sea location.

Master Thesis Feasibility Study of Selected Riser Concepts in Deep Water and Harsh Environment
Gilang Muhammad Gemilang 125
7.2 Wave Induced Fatigue
7.2.1 Design Data
Riser data
In wave induced fatigue analysis, the mean vessel position is considered. The conventional
SCR, the WDSCR and the SLWR without coating are selected in this fatigue analysis. The
properties of riser are presented in Table 5-7.
S-N Curve
The S-N curve methodology is used in performing fatigue analysis in this study. The S-N
curve is generally the stress range versus number of cycles to failure (DNV, 2010a). The S-N
curves determine the fatigue capacity of riser in seawater with cathodic protection. The S-N
curves determine the number of stress cycles to failure (N) for a given constant stress range
(S). The S-N curve is given in following formula (DNV, 2010a):
(
)
Where:
N = number of stress cycle to failure
S = stress range
, m = empirical constant
So = nominal stress range
SCF = stress concentration factor
tref = reference wall thickness equal 25mm for welded connection
t = thickness through which a crack will most likely grow.
=tref is used for thickness less than tref.
k = thickness exponent on fatigue strength
= 0.10 for tubular butt welds made from one side
= 0.25 for threaded bolts subjected to stress variation in the axial direction
The S-N curve data are based on fatigue testing of small specimens subjected to dynamic
loading in test laboratories (DNV, 2010c). Based on DNV (2010c), different S-N curves for
seawater environments with cathodic protection are given in Figure 7-1. The selection of S-N
curves is determined from the weld detail and quality. This study will consider C2-curve and
D-curve for fatigue analysis, the basis for this is demonstrated in previous work by

Master Thesis Feasibility Study of Selected Riser Concepts in Deep Water and Harsh Environment
Gilang Muhammad Gemilang 126
Karunakaran et al. (2006). The C2-curve is expected to give more fatigue life compared to the
D-curve for the riser sections.
Figure 7-1 S-N curves in seawater with cathodic protection (DNV, 2010c)
Fatigue Limit
The fatigue limit, so-called endurance limit, is established for calculating fatigue damage.
Fatigue limit is determined as a cutoff stress range, which the stress ranges below this limit
can be omitted from fatigue assessment. Based on DNV (2010c), the application of the fatigue
limit is illustrated in Figure 7-2. From the figure, a detailed fatigue analysis can be omitted if
the largest stress cycle is below the fatigue limit. However, if the stress cycle is above the
fatigue limit, the stress cycle is included in the fatigue assessment.
Figure 7-2 Stress cycling where further fatigue assessment can be omitted (DNV, 2010c)
The fatigue limit is set at 107 cycles from S-N curve. Consequently, each curve has different
fatigue limit. The fatigue limit for D-curve and C2-curve are presented in table 7-1 as per
DNV-RP-C203.

Master Thesis Feasibility Study of Selected Riser Concepts in Deep Water and Harsh Environment
Gilang Muhammad Gemilang 127
Table 7-1 Fatigue limit (DNV, 2010c)
S-N Curve Fatigue Limit at 107 cycles
Curve C2 58.48 Mpa
Curve D 52.63 Mpa
Selection of Stress Concentration Factor (SCF)
The SCF is used to account for the concentrated stress at connection points due to a local
increase in the intensity of a stress area. The SCF is obtained by application of finite element
analyses over the cross section of the pipe. This factor is used to account for a possible local
increase in the stress field due to the geometric stress amplifier of two adjacent joints, which
occur in the riser component (DNV, 2010a). SCF may be defined as the ratio of hot spot
stress range to local nominal range (DNV, 2010c). According to DNV (2010c), SCF value
can be assessed based on the following analytical expression:
√
Where:
t = wall thickness of pipe
D = outer diameter of pipe
= representative eccentricity due to imperfections in geometry
Based on that expression, an estimated SCF value of 1.2 is considered to calculate fatigue
damage for C2-curve and D-curve.
Sea-state Data
The assessment of fatigue performance requires procedure of a long-term model to account
for the variability in sea-states (Norsok, 2007). A typical wave scatter diagram from the
Northern North Sea environment is used for fatigue analysis. The sea-state will be subdivided
into 18 representative blocks to account for possible sea-state condition at the site as shown in
Figure 7-3. The “star” in the Figure 7-3 denotes the selected representative sea-state blocks at
which the non-linear dynamic response is simulated.
18 representative sea-states blocks in 12 directions are selected to calculate total fatigue
damage. 18 representative sea-states in 12 directions are performed in 1-hour time simulation.
Each representative sea-state block has the highest occurrence rate within that block. The
lumped probability of occurrence is presented in Table 7-2. The lumped probability of
occurrence is a percentage of occurrences of each block over all occurrences.
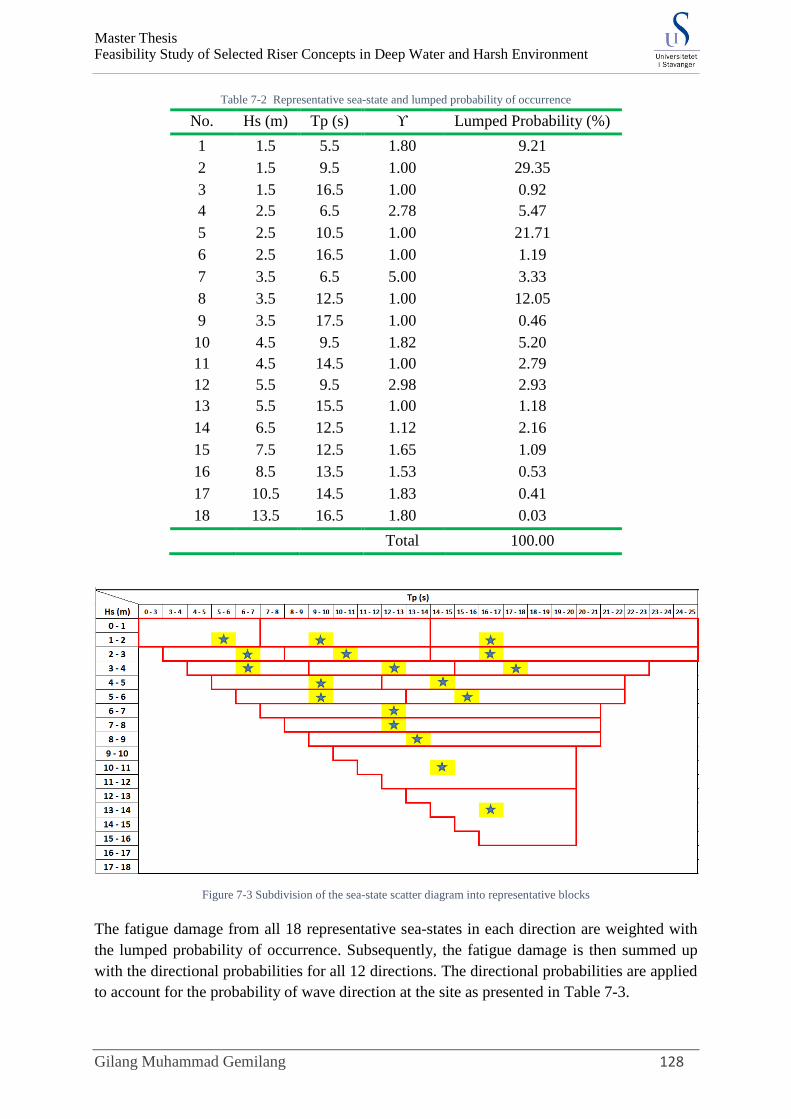
Master Thesis Feasibility Study of Selected Riser Concepts in Deep Water and Harsh Environment
Gilang Muhammad Gemilang 128
Table 7-2 Representative sea-state and lumped probability of occurrence
No. Hs (m) Tp (s) ϒ Lumped Probability (%)
1 1.5 5.5 1.80 9.21
2 1.5 9.5 1.00 29.35
3 1.5 16.5 1.00 0.92
4 2.5 6.5 2.78 5.47
5 2.5 10.5 1.00 21.71
6 2.5 16.5 1.00 1.19
7 3.5 6.5 5.00 3.33
8 3.5 12.5 1.00 12.05
9 3.5 17.5 1.00 0.46
10 4.5 9.5 1.82 5.20
11 4.5 14.5 1.00 2.79
12 5.5 9.5 2.98 2.93
13 5.5 15.5 1.00 1.18
14 6.5 12.5 1.12 2.16
15 7.5 12.5 1.65 1.09
16 8.5 13.5 1.53 0.53
17 10.5 14.5 1.83 0.41
18 13.5 16.5 1.80 0.03
Total 100.00
Figure 7-3 Subdivision of the sea-state scatter diagram into representative blocks
The fatigue damage from all 18 representative sea-states in each direction are weighted with
the lumped probability of occurrence. Subsequently, the fatigue damage is then summed up
with the directional probabilities for all 12 directions. The directional probabilities are applied
to account for the probability of wave direction at the site as presented in Table 7-3.
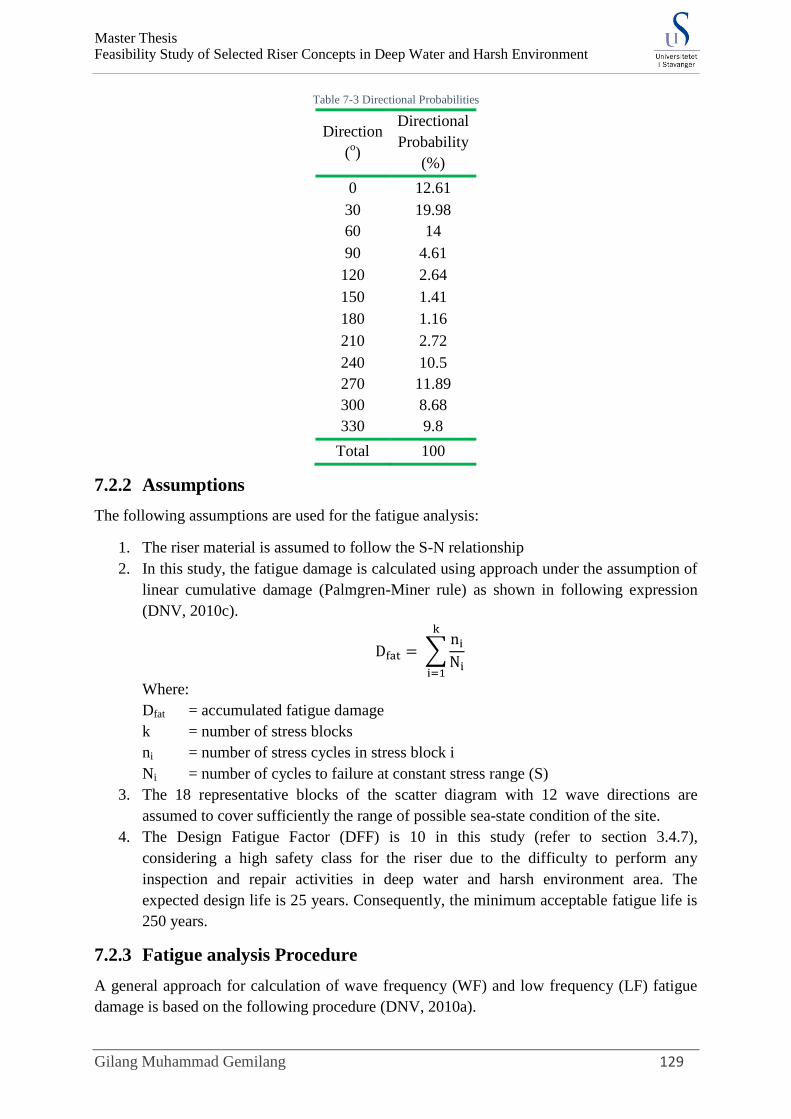
Master Thesis Feasibility Study of Selected Riser Concepts in Deep Water and Harsh Environment
Gilang Muhammad Gemilang 129
Table 7-3 Directional Probabilities
Direction
(o)
Directional
Probability
(%)
0 12.61
30 19.98
60 14
90 4.61
120 2.64
150 1.41
180 1.16
210 2.72
240 10.5
270 11.89
300 8.68
330 9.8
Total 100
7.2.2 Assumptions
The following assumptions are used for the fatigue analysis:
1. The riser material is assumed to follow the S-N relationship
2. In this study, the fatigue damage is calculated using approach under the assumption of
linear cumulative damage (Palmgren-Miner rule) as shown in following expression
(DNV, 2010c).
∑
Where:
Dfat = accumulated fatigue damage
k = number of stress blocks
ni = number of stress cycles in stress block i
Ni = number of cycles to failure at constant stress range (S)
3. The 18 representative blocks of the scatter diagram with 12 wave directions are
assumed to cover sufficiently the range of possible sea-state condition of the site.
4. The Design Fatigue Factor (DFF) is 10 in this study (refer to section 3.4.7),
considering a high safety class for the riser due to the difficulty to perform any
inspection and repair activities in deep water and harsh environment area. The
expected design life is 25 years. Consequently, the minimum acceptable fatigue life is
250 years.
7.2.3 Fatigue analysis Procedure
A general approach for calculation of wave frequency (WF) and low frequency (LF) fatigue
damage is based on the following procedure (DNV, 2010a).

Master Thesis Feasibility Study of Selected Riser Concepts in Deep Water and Harsh Environment
Gilang Muhammad Gemilang 130
The wave environment scatter diagram is divided into 18 representative blocks. Each
representative sea-state block has the highest occurrence rate within that block.
The non-linear time domain analysis is performed to calculate the stress time series for
each representative blocks. A total time simulation of 1 hour and time step of 0.25
seconds is used for this analysis.
The fatigue damage is estimated with all representative blocks using deterministic
rain-flow-counting technique. This was completed in ORCAFLEX. The fatigue
damage is assessed at 16 points around the circumference of the pipe distributed
uniformly 360o.
The fatigue damage from each representative sea-state block is weighted with the
corresponding lumped probability of occurrence.
The total fatigue damage in that direction is obtained from the summation of the
weighted fatigue damage over 18 representative sea-state blocks.
This procedure is repeated for all 12 directions and the total fatigue damage from all
directions are obtained by applying directional probabilities as described in the
following expression.
∑
Where:
DL = long-term cumulative fatigue damage
Ns = number of total wave direction
Di = short time cumulative fatigue damage
Pi = directional probabilities of corresponding wave direction, given in Table 7-3.
The fatigue life in years is obtained as the reciprocal of the total fatigue damage.
7.2.4 Fatigue Analysis Results
Conventional SCR
The critical locations of the fatigue performance of the SCR are located at the TDP and below
the flex joint. The fatigue life of the SCR is presented in Table 7-4 for the critical locations.
The total fatigue damage over entire riser length is presented in Figure 7-4. It can be seen that
the critical fatigue life occurred in a very short span at the TDP. It is observed that the
minimum fatigue life is satisfactory for the location where the flex joint is occupied.
However, the minimum fatigue life at the TDP is less than the minimum acceptable fatigue
life. The D-curve showed more fatigue damage compared to C2-curve. The minimum fatigue
life considering D-curve is 80 years and the minimum fatigue life considering C2-curve is 159
years. These are less than 250 years. It can be concluded that the SCR is not feasible for
satisfying the minimum criteria of the fatigue performance in this location.
Table 7-4 Fatigue Life Summary of SCR
SCR Critical Location D-curve C2-curve
Below flex joint 522 years 927 years
TDP 80 years 159 years

Master Thesis Feasibility Study of Selected Riser Concepts in Deep Water and Harsh Environment
Gilang Muhammad Gemilang 131
Figure 7-4 Total Fatigue Damage of SCR
WDSCR
The critical locations of the fatigue performance of the WDSCR are located at the TDP and
below the flex joint. The total fatigue damage of the WDSCR over entire riser length is
presented in Figure 7-5. It is seen that the critical fatigue damage of the WDSCR is lower than
critical fatigue damage of the SCR. Table 7-5 presents fatigue life of the WDSCR for the
critical riser sections. It is observed that the minimum fatigue life is satisfactory for the
critical location where the flex joint is occupied.
It is seen that the fatigue performance is improved very well at the TDP for the WDSCR
compared to the SCR. The minimum fatigue life considering D-curve is 247 years and the
minimum fatigue life considering C2-curve is 533 years. This is an indication that the heavy
cross section reduces the fatigue damage at the TDP very well. The cyclic stresses at the TDP
is reduced, thereby, the more fatigue life is achieved with the heavy cross section at the
bottom of straight section for the WDSCR.
Table 7-5 Fatigue Life Summary of WDSCR
WDSCR Critical Location D-curve C2-curve
Below flex joint 646 years 1179 years
TDP 247 years 533 years
0.0000001
0.000001
0.00001
0.0001
0.001
0.01
0.1
1
0 500 1000 1500 2000 2500 3000 3500 4000
Fati
gue
Dam
age
(1
/yea
r)
Arc Length (m)
Total Damage (Sum of all direction) -SCR
Curve-D Curve-C2

Master Thesis Feasibility Study of Selected Riser Concepts in Deep Water and Harsh Environment
Gilang Muhammad Gemilang 132
Figure 7-5 Total Fatigue Damage of WDSCR
SLWR
The critical locations of the fatigue performance of the SLWR are located at the TDP, hog-
bend, sag-bend and below the flex joint. The fatigue life of the SLWR is presented in Table
7-6 for the critical locations. The total fatigue damage over entire riser length is presented in
Figure 7-6. It is observed that all critical locations of the SLWR have satisfactory fatigue
performance. The fatigue life at the critical location, where the flex joint is occupied, is 1164
years considering D-curve and is 2310 years considering C2-curve.
The fatigue life at the sag-bend and the hog-bend are more than 10000 years considering both
D-curve and C2-curve. The minimum fatigue life at the TDP considering D-curve is 874
years and the minimum fatigue life at the TDP considering C2-curve is 1628 years. The
results of minimum fatigue life are well above the minimum acceptable limit. It can be
concluded that the SLWR has robust fatigue wave performance.
Table 7-6 Fatigue Life Summary of SLWR
SLWR Critical Location D-curve C2-curve
Below flex joint 1164 years 2310 years
Sag-bend >10000 years >10000 years
Hog-bend >10000 years >10000 years
TDP 874 years 1628 years
0.0000001
0.000001
0.00001
0.0001
0.001
0.01
0.1
1
0 500 1000 1500 2000 2500 3000 3500 4000
Fati
gue
Dam
age
(1
/yea
r)
Arc Length (m)
Total Damage (Sum of all direction) - WDSCR
Curve D Curve C2

Master Thesis Feasibility Study of Selected Riser Concepts in Deep Water and Harsh Environment
Gilang Muhammad Gemilang 133
Figure 7-6 Total Fatigue Damage of SLWR
7.2.5 Discussion of Wave Induced Fatigue Performance
It can be seen that the most critical location of fatigue performance is located at the TDP. It is
also noted that the hang-off area presented very low fatigue performance. In order to solve
this, this section will, in practice, be occupied with flex joint and there are proven measures to
manage it. Therefore, the hang-off area is not critical in the riser feasibility as it can be solved
with proven measures. The critical fatigue performance at the TDP determines the riser
feasibility since the method of controlling this section is limited. Thus, the major areas of
concern for fatigue performance of the riser are the minimum fatigue life at the TDP.
The D - curve is identified to give more fatigue damage than C2-curve. The minimum fatigue
life of the SCR is 80 years considering D-curve, which is less than the minimum acceptable
fatigue life. The wave loads induce the vessel heave motion, which results in excessive cyclic
stresses along the entire riser length, especially at TDP where the SCR is affected by soil-riser
interaction.
This is an indication that the SCR is very sensitive to the vessel heave motion. Therefore, it is
not feasible to develop the SCR for this harsh environmental condition. On the other hand, the
WDSCR has better fatigue performance compared to the SCR. This is an indication that the
heavy cross section at the bottom of straight section improves the fatigue performance very
well. The heavy cross section reduces the dynamic motion and cyclic stresses at the TDP;
1E-09
1E-08
0.0000001
0.000001
0.00001
0.0001
0.001
0.01
0.1
1
0 500 1000 1500 2000 2500 3000 3500 4000
Fati
gue
Dam
age
(1
/yea
r)
Arc Length (m)
Total Damage (Sum of all direction) - SLWR
Curve-D Curve-C2

Master Thesis Feasibility Study of Selected Riser Concepts in Deep Water and Harsh Environment
Gilang Muhammad Gemilang 134
hence the fatigue performance is improved. However, the minimum fatigue life is 247 years
considering D-curve which is slightly less than minimum acceptable fatigue life of 250 years.
The SLWR has most robust fatigue performance compared to the WDSCR and the SCR. It
has the minimum fatigue life of 857 years at the TDP, considering D-curve. This indicates
that the SLWR is feasible to satisfy the minimum acceptable fatigue life stipulated in
acceptance criteria in this location. This study does not consider factors such as different
floater offsets, floater drafts, and marine growth, which may contribute to fatigue damage at
the TDP. Therefore, these fatigue results are conservative, as those factors are not considered.
The total fatigue damage is calculated from the summation of long-term damages by
considering each wave direction and directional probabilities. The summary of fatigue
damage for each direction is given in Appendix D.
7.3 Vortex Induced Vibration (VIV)
7.3.1 Fatigue Analysis Procedure
The investigation of fatigue damage due to VIV is performed for only SLWR in this study,
since only SLWR is feasible in this location. The consideration for VIV analysis is given to
unidirectional current profiles, acting in parallel and perpendicular direction to the riser‟s
plane. The parallel current direction is referred to as in-plane current and the perpendicular
current direction is referred as out-of-plane current.
The VIV analysis is performed using VIVANA, a computer program designed to calculate the
response of a slender structure excited by vortex shedding due to a current profile. VIVANA
requires INPMOD and STAMOD as input data from RIFLEX. The input is the description of
current profiles, structure and its static equilibrium which is established in INPMOD and
STAMOD.
Therefore, the SLWR is remodeled in RIFLEX to establish the INPMOD and STAMOD as
the input data for VIVANA. More detail information of this software program is provided in
Appendix C. The resulting static configuration obtained in RIFLEX is checked and compared
to the resulting static configuration obtained in ORCAFLEX. It was confirmed that both
configurations are the same in respect to the response of the configurations such as effective
tension and bending moment.
The VIV analysis procedure is based on VIVANA – theory manual (Vivana, 2005). The S-N
curve is specified in this analysis. The D-curve and C2-curve with SCF of 1.2 are considered
as used in the wave induced fatigue analysis. The VIV analysis was performed considering 14
current profiles. The surface current velocities range from 0.1 to 0.8 m/s. The 14 current
profiles are provided in VIVANA script in Appendix C. The fatigue damage from each
current profile was weighted with corresponding lumped probability of occurrence as
presented in Table 7-7. The weighted fatigue damage accumulation from all current profiles
can be expressed in the following formula.
∑

Master Thesis Feasibility Study of Selected Riser Concepts in Deep Water and Harsh Environment
Gilang Muhammad Gemilang 135
Where:
DL = total fatigue damage
Ns = number of considered current profiles
Di = fatigue damage for current i
Pi = lumped probability of occurrence
This procedure is performed for in-plane and out-of-plane unidirectional current. The
directional probability used in this analysis is 50% for both in-plane and out-of-plane
unidirectional currents. Taking into account the 14 current profiles and the 2 unidirectional
currents, the total fatigue damage is calculated. The fatigue life in years was then calculated as
the reciprocal of total fatigue damage. The minimum acceptable fatigue life due to VIV is at
least 20 times the SLWR design life. The design life of SLWR is 25 years; therefore, the
minimum acceptable fatigue life is 500 years.
Table 7-7 Lumped Probability of Occurrence
Current Profile
No.
Lumped Probability of
Occurrence
1 2 %
2 2 %
3 2 %
4 2 %
5 2 %
6 10 %
7 10 %
8 10 %
9 10 %
10 10 %
11 10 %
12 10 %
13 10 %
14 10 %
Total 100 %
7.3.2 Fatigue Analysis Results
The summation of total fatigue damage is presented in Figure 7-7. The minimum fatigue life
is then calculated from the reciprocal of the maximum fatigue damage as presented in Table
7-8.
Table 7-8 Minimum VIV Fatigue Life
S-N Curve Minimum Fatigue Life
D-curve 113 years
C2-curve 156 years

Master Thesis Feasibility Study of Selected Riser Concepts in Deep Water and Harsh Environment
Gilang Muhammad Gemilang 136
Figure 7-7 Total Fatigue Damage due to VIV over Entire Riser Length
7.3.3 Discussion of Fatigue Analysis due to VIV
The VIV fatigue damage is induced by cyclic stresses due to ocean currents. As the water
flows towards the leading edge of the riser, vortices are shed from both sides of the riser,
resulting in vibration on to the riser. These vortices are referred to as vortex shedding. The
shedding frequency is defined as a full periodic cycle between two vortices occurred on
alternate sides of the riser. The vortices change the velocity and pressure distribution,
resulting in development of forces around the riser as seen in Figure 7-8. Vortex induced
vibration (VIV) consists of two modes according to flow direction; in-line and cross-flow.
Figure 7-8 Vortex Shedding
-0.001
0
0.001
0.002
0.003
0.004
0.005
0.006
0.007
0.008
0.009
0.01
0 500 1000 1500 2000 2500 3000
Fati
gue
Dam
age
(1
/yea
r)
Arc length (m)
Summation Total Fatigue Damage
Curve D Curve C2

Master Thesis Feasibility Study of Selected Riser Concepts in Deep Water and Harsh Environment
Gilang Muhammad Gemilang 137
The minimum fatigue life is 113 years considering D-curve and 156 years considering C2-
curve, which are less than the minimum acceptable fatigue life due to VIV. The minimum
fatigue life is found at the lower catenary of the SLWR between arc lengths 2300 m to 2400
m. It is also observed that the sag-bend and hog-bend sections are subjected to fatigue damage
due to VIV.
It is observed that the out-of-plane current impacts more fatigue damage on to riser compared
to the in-plane current. This is an indication that out-of-plane current, or also called as
transverse current, is more critical to give worst fatigue damage on the riser. The detail fatigue
results from each current profile for both in-plane and out-plane current are provided in
Appendix D.
Although the fatigue life of the SLWR is less than the minimum acceptable fatigue life, the
fatigue performance of the SLWR can still be improved by installing the VIV suppression
along a specific length of the riser, such as helical strakes and fairings as shown in Figure 2-9.
The geometry of the VIV suppression can disrupt the generated vortex on the downstream
side of the flow, such that the fatigue damage can be reduced and fatigue performance of
SLWR can be improved. The VIV suppression coverage length is expected to be around 50%
in the middle section of the upper catenary, where the straight section of the SLWR is
exposed to the current.
Fairing design allows to rotate freely such that they always align with the current's direction,
hence vortex shedding is suppressed. The geometry of fairings can reduce the vibration from
the vortex shedding without incurring an increase in riser‟s drag coefficient. The helical
strakes design consists of 3 helical lines along the suspended riser. The helical strakes are
widely used for suppressing vortex shedding, since helical strakes design is simple, effective,
and easy to be installed. Due to their helical body, they can provide quick distraction of
incoming flow pattern, reducing the vibrations from vortex shedding.
However, this helical design causes an increase in riser‟s drag coefficient. Careful
consideration should be taken to avoid excessive fatigue damage due to VIV, while also
optimize the length of helical strakes segment to avoid both excessive cost and excessive drag
loading as this may have both design and cost implications. However, the helical strakes have
been preferred option of the offshore industry compared to the fairings. The reasons are as
follows:
The helical strakes are fixed; meanwhile the fairings should be installed such that it
may weather-vane with incidental current direction which may have a problem if it
gets stuck during its design life.
Installation of the helical strakes is simpler than the fairings
The helical strakes have a longer track record than the fairings

Master Thesis Feasibility Study of Selected Riser Concepts in Deep Water and Harsh Environment
Gilang Muhammad Gemilang 138
Chapter 8. Riser Fabrication and Installation
8.1 Introduction
This chapter presents the general description of the fabrication and the installation of the steel
catenary riser (SCR), including the WDSCR and the SLWR. The content of this chapter is
according to practical works and industrial knowledge on the fabrication and the installation.
The technical feasibility of fabrication and installation of the steel catenary riser in deep water
and harsh environments are discussed. The method of fabrication and installation need to be
carefully selected during the initial design phases as major issues in total development cost.
In order to develop offshore oil and gas field, the operator faces the challenge in an effort to
reduce development cost and also to ensure the satisfactory quality of the offshore facilities,
especially for deep water riser systems. As developments move into deep water, the total
development costs increase, as does the effort to reduce them. One of the challenges of the
installation is the limit in the availability of installation vessels that have a good stability and
the ability to accommodate the riser top tension and a large number of riser sections on board.
The consideration of the fabrication includes welding processes to ensure that the high quality
welding is performed.
8.2 Fabrication
A steel catenary riser is made up of a series of welded pipe joints. The weld material
properties, joint dimensional tolerances, girth welds, welding procedure and inspection
criteria are the main factors of riser‟s fatigue performance (Burgess and Lim, 2006).
Therefore, an excellent quality welds are required so that the sufficient fatigue lives for SCR
is achieved. Fabrication of the SCRs can be accomplished onshore and/or offshore.
The fabrication in offshore is conducted on the installation vessel by S-lay or J-lay. The pipe
joints are welded together in the welding station. On the other hand, the fabrication in onshore
has an added benefit. The benefit is that the girth welds can be fabricated and inspected in
controlled surroundings in order to make sure that the required integrity of the welding of
riser is achieved (Karunakaran et al., 2013).
The fabrication material in this study is carbon steel of grade X65. The internal surface of the
pipe is exposed to the well fluids, which can be corrosive mainly due to CO2 and H2S.
Therefore, the fabrication of riser requires high quality of internal corrosion performance and
internal weld root by utilizing corrosion resistant alloys (CRA) and internal gas purge. The
selection of CRA material is based on the well fluids and mechanical properties (Karunakaran
et al., 2005).
The operators should also provide appropriate measures to ensure high quality coatings as
cathodic protection to reduce the risk of exposing welds to seawater and to ensure stringent
fabrication requirements. The challenge of welding of riser is significant due to the strict weld
acceptance criterion. The quality of girth weld is one of the key factors for the SCR fatigue

Master Thesis Feasibility Study of Selected Riser Concepts in Deep Water and Harsh Environment
Gilang Muhammad Gemilang 139
performance. According to Karunarakan et al. (2013), the following are the prerequisites for
welding processes of SCR:
Table 8-1 Prerequisite for Fabrication of SCR Weld (Karunakaran et al., 2013)
The following are some welding methods adopted for welding processes.
Pulsed Gas Metal Arc Welding (PGMAW)
Pulsed Gas Tungsten Arc Welding (PGTAW)
Flux Core Arc Welding (FCAW)
Gas Metal Arc Welding (GMAW)
Gas Tungsten Arc Welding (GTAW)
The welding process of PGTAW is capable to produce high integrity girth welds. A
mechanized PGTAW equipment and typical weld cap macro section are presented in Figure
8-1. The mechanized hot wire PGTAW process has been successfully performed for the BC-
10 project by Subsea 7. Even though, the mechanized PGTAW process is proficient to
manufacture high integrity girth welds, the welding production rates are limited.
Figure 8-1 Mechanized PGTAW Equipment in Operation and Weld Cap Macro Section (Karunakaran et al., 2013)

Master Thesis Feasibility Study of Selected Riser Concepts in Deep Water and Harsh Environment
Gilang Muhammad Gemilang 140
Therefore, the mechanized PGMAW (Pulsed Gas Metal Arc Welding) process was introduced
to attain higher production rates than the mechanized PGTAW. The mechanized PGMAW is
capable to provide acceptable integrity girth weld for riser‟s fabrication. This method utilizes
a feature of the Cold Metal Transfer (CMT) process for root welding. Such a feature allows
the root welding to be achieved with the minimum temperature input, giving a good control of
the weld root quality and profile (Karunakaran et al., 2013)
A pictorial representation showing typical mechanized PGMAW and CMT weld roots is
shown in Figure 8-2. In 2012, the Vigra Spool Base implements the PGMAW/CMT weld
solution for the fabrication of several clad and lined pipe projects, including Stjerne, Skuld,
Visund Sor and Tordis (Karunakaran et al., 2013).
Figure 8-2 Mechanized PGMAW in operation and typical girth weld showing CMT weld roots (Karunakaran et al., 2013)
For post weld inspection, the Automated Ultrasonic (AUT) inspection should be performed to
girth weld to prove the accuracy of the welding processes. The Non Destructive Test (NDT) is
also carried out to verify the welding and coating quality. From those inspections, a reliable
detection of very small defects is expected to ensure high fatigue performance of the SCR.
8.3 Installation
The driving factors of SCR installation include weather windows, vessel capability,
installation method, water depth, environmental conditions, size and weight of the riser pipe.
The harsh environment can limit the weather window and induce large motion of the
installation vessel, which may harm the installation activities. Thus, the installation schedule
will be established and agreed as weather restricted operation in harsh environment. In
addition, the appropriate vessel installation is important to give a good stability and
accommodation of riser top tension during the installation activity.
There are a limited number of companies in the world, providing pipe laying services in deep
water and ultra-deep water. Some leading international installation companies that provide
pipe-laying service are Allseas, McDermott, Saipem, Subsea 7, and Technip. The seven
Oceans and Seven Borealis are the installation vessels which have been used for SCRs
installation, owned by Subsea 7. The design of Seven Oceans and Seven Borealis makes the

Master Thesis Feasibility Study of Selected Riser Concepts in Deep Water and Harsh Environment
Gilang Muhammad Gemilang 141
pipe-laying activities able to withstand installation conditions in harsh environments as shown
in Figure 8-3.
Figure 8-3 The Seven Oceans and Seven Borealis Pipe-lay Vessel, Figure from Subsea 7
This section contains the following of SCR installation aspects:
Pipe-lay methods,
Riser hook-up and
Installation of modules.
8.3.1 Pipe-lay Methods
There are many methods for laying SCR into deep water. This study focuses on three
installation methods, which are S-Lay, J-lay and reel-lay method.
S-lay Method
The S-lay method is widely used due to the abilities of quick installation for large diameter
pipe. Commonly, the S-Lay method is suitable for shallow and intermediate water depths. The
stinger is a frame structure located at stern with roller track to support the pipe during sliding
down the pipe. The stinger controls the curvature of the pipe in order to avoid excessive
deflection in an over-bend region.
Figure 8-4 Sketch of S-Lay Method
As the installation vessel moves forward, the tensioners will be utilized to hold the entire pipe
so it won‟t slide down to the seabed due to its self-weight during the installation process. Pipe
leaves the stern of the ramp at the end of the vessel almost horizontally, going over the stinger

Master Thesis Feasibility Study of Selected Riser Concepts in Deep Water and Harsh Environment
Gilang Muhammad Gemilang 142
in an over bend region and going further down through the sea as a suspended span and then
reaches the seabed at the touchdown point in the sag-bend region (Palmer and King, 2008).
The sag-bend and over-bend area will form like the letter "S" as shown in Figure 8-4.
It is necessary to ascertain that the pipe can withstand the combined load of bending, external
and internal pressure at the sag-bend and over-bend region. Normally, the pipe is installed
empty to minimize the tension requirements. The benefits of using this method are the high
production rate as it has several welding stations. In addition, it has the ability to install large
diameter pipe with coating layer.
The S-Lay method can be utilized for pipe-lay operation in deep water, but it will require a
long stinger and adequate tensioner capacity in order to hold the entire pipeline during the
installation process. A very long stinger is avoided since it might incur excessive force from
wave and current. It can be summarized that the S-lay is not preferred for the SCR installation
in this study since it encounters difficulties in very deep water.
J-lay Method
The SCR installation by J-lay has been well proven technology for pipe-lay operation. In this
method, the pipe shape resembles the “J” letter during installation, see Figure 8-5. Unlike the
S-lay, the J-lay does not introduce over-bend region since the pipe leaves the vessel nearly in
a vertical position. No stinger is required for J-lay method. The ramp angle can be prescribed
in line with the pipe catenary to the seabed. The J-Lay method is not appropriate for shallow
waters as shallow water requires a steeper departure angle for pipe-lay activity.
Figure 8-5 Sketch of J-lay Method (Chacko et al., 2005)
The installation vessel is equipped with J-lay collars to hold the pipe and also to act as buckle
arrestors during installation operation. This method requires lower tensioner capacity
compared to the S-lay method. However, compared to the S-lay methods, the J-Lay has a
fairly low production rate due to only one or two welding stations. The J-lay and the S-lay can

Master Thesis Feasibility Study of Selected Riser Concepts in Deep Water and Harsh Environment
Gilang Muhammad Gemilang 143
both be employed aboard the Subsea 7 installation vessel of Seven Borealis as shown in
Figure 8-3.
Reel-lay Method
The reel-lay method is preferred choice for installation of the SCR in deep water and harsh
environment in this study. The reel-lay method is chosen as a proposal in this study. This is
because it is cost effective and offers a reliable production rate of installation. This method is
suitable for installing a small diameter ranging from 4 inches to 18 inches. The coating
thickness is limited to 100 mm for reeled installation (Karunakaran et al., 2005). This method
is conducive with a small weather window which is associated with harsh environments. This
method allows the whole riser length to be fabricated onshore and installed by a reeling lay
vessel.
This is advantageous since the welding process can be performed onshore in a controlled
environment to make sure that the required integrity of the welding of the riser is achieved
(Karunakaran et al., 2013). Spool base is used to weld the pipeline stocks; Figure 8-6 shows a
picture of spool bases of Vigra in Norway. After the pipe is fabricated and welded onshore, the
pipe is reeled from the dock onto the reels on the vessel. However, the riser and its joint welds
may undergo significant plastic deformation which may generate wrinkles during the reeling,
unreeling and straightening processes (Hatton and Willis, 1998).
Therefore, a system of internal pressurization is employed to avoid wrinkles on the riser and
an inspection is performed to verify if wrinkles have occurred during the reeling process
(Maneschy, 2015). The reel-lay method can be employed using the Seven Oceans vessel of
Subsea 7 as shown in Figure 8-3. The Roncador in Brazil, Guara & Lula in Brazil, and Blind
Faith in Gulf of Mexico (GoM) have applied reel lay method to install many SCRs.
Figure 8-6 Spool Base Vigra of Subsea 7, Figure from Subsea 7
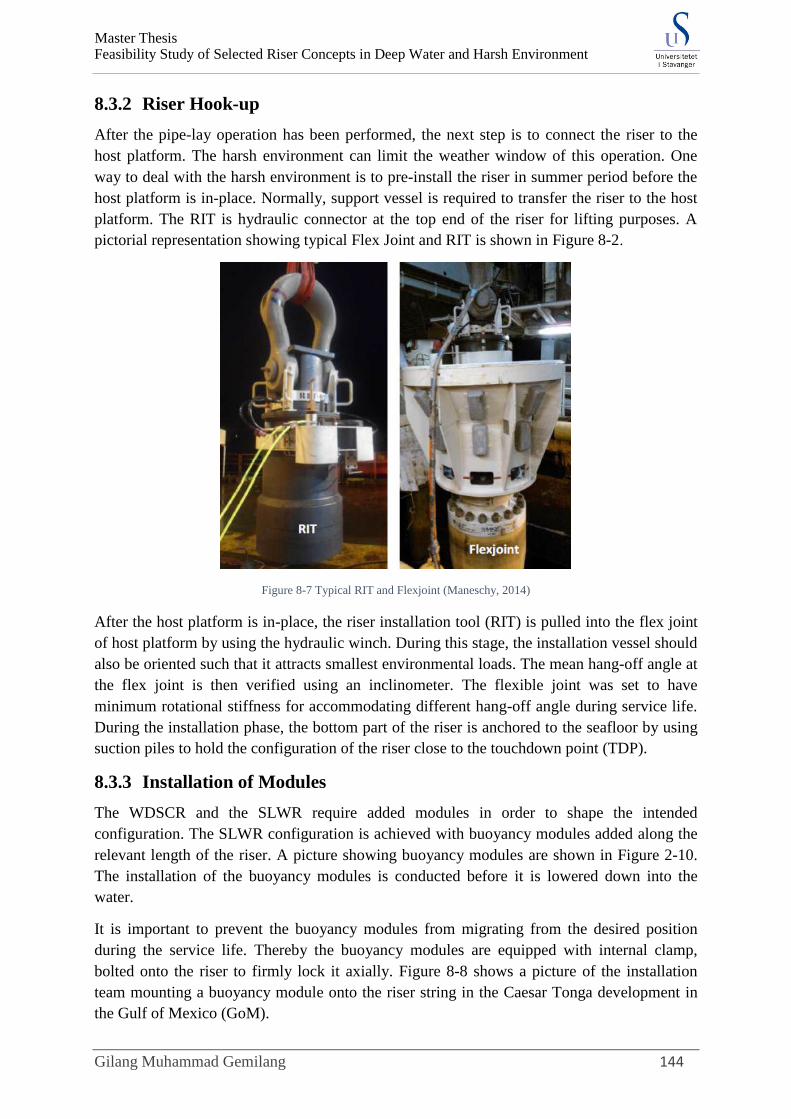
Master Thesis Feasibility Study of Selected Riser Concepts in Deep Water and Harsh Environment
Gilang Muhammad Gemilang 144
8.3.2 Riser Hook-up
After the pipe-lay operation has been performed, the next step is to connect the riser to the
host platform. The harsh environment can limit the weather window of this operation. One
way to deal with the harsh environment is to pre-install the riser in summer period before the
host platform is in-place. Normally, support vessel is required to transfer the riser to the host
platform. The RIT is hydraulic connector at the top end of the riser for lifting purposes. A
pictorial representation showing typical Flex Joint and RIT is shown in Figure 8-2.
Figure 8-7 Typical RIT and Flexjoint (Maneschy, 2014)
After the host platform is in-place, the riser installation tool (RIT) is pulled into the flex joint
of host platform by using the hydraulic winch. During this stage, the installation vessel should
also be oriented such that it attracts smallest environmental loads. The mean hang-off angle at
the flex joint is then verified using an inclinometer. The flexible joint was set to have
minimum rotational stiffness for accommodating different hang-off angle during service life.
During the installation phase, the bottom part of the riser is anchored to the seafloor by using
suction piles to hold the configuration of the riser close to the touchdown point (TDP).
8.3.3 Installation of Modules
The WDSCR and the SLWR require added modules in order to shape the intended
configuration. The SLWR configuration is achieved with buoyancy modules added along the
relevant length of the riser. A picture showing buoyancy modules are shown in Figure 2-10.
The installation of the buoyancy modules is conducted before it is lowered down into the
water.
It is important to prevent the buoyancy modules from migrating from the desired position
during the service life. Thereby the buoyancy modules are equipped with internal clamp,
bolted onto the riser to firmly lock it axially. Figure 8-8 shows a picture of the installation
team mounting a buoyancy module onto the riser string in the Caesar Tonga development in
the Gulf of Mexico (GoM).

Master Thesis Feasibility Study of Selected Riser Concepts in Deep Water and Harsh Environment
Gilang Muhammad Gemilang 145
Figure 8-8 the Installation of buoyancy Module onto the Riser (Beattie et al., 2013)
The WDSCR configurations can be achieved with ballast modules at the bottom of the riser
straight section. A pictorial view showing the ballast module is shown in Figure 2-11. The
installation of ballast modules is similar to the installation of buoyancy modules. They are
installed using an effective, firm and safe offshore installation procedure. The internal clamp
is bolted directly onto the riser to securely lock the ballast module axially onto the riser
(Karunakaran et al., 2013). The clamp is stiffened around the riser, and the both sides of the
ballast module are strapped onto the internal clamp adjoining together with kevlar strap.
Balmoral Offshore Engineering and Trelleborg are two qualified vendor of buoyancy modules
and ballast modules.

Master Thesis Feasibility Study of Selected Riser Concepts in Deep Water and Harsh Environment
Gilang Muhammad Gemilang 146
Chapter 9. Conclusion and Recommendation
9.1 Conclusion
This study outlines the feasibility of selected riser concepts in terms of capability to cope with
the large motion from the Semi-submersible in deep water and harsh environment. The
selected riser concepts are the conventional SCR, the Weight Distributed SCR (WDSCR) and
the Steel Lazy Wave Riser (SLWR). The considered risers have an internal diameter of 10
inches and are made of low carbon steel of grade X65.
The riser concepts have been modeled using ORCAFLEX. The appropriate static
configurations of riser concepts are achieved by performing several optimizations and
evaluations. The static responses have been found satisfactory, which is within the allowable
design criteria. After establishing the appropriate static configurations with satisfactory static
responses, the riser concepts were subjected to extreme response analysis.
Extreme Response Analysis
The main challenge of riser system is the large motion from the host platforms due to the
harsh environment for application in deep water. The large motion of the host platforms may
induce excessive buckling and fatigue at the touchdown point. The key component of the
large motion of the host platform is the downward velocity at the hang-off point where the
top-end of the riser is attached to the host platform. The concern is also on the downward
velocity in the touchdown area since a feasible configuration can be addressed by controlling
the dynamic stresses at the TDP. It has been investigated that the downward velocity in the
touchdown area is mainly caused by the downward velocity at the hang-off point.
By screening the downward velocities at the hang-off point in the time history graph, the time
at which the critical responses (i.e. buckling utilization, bending moment and compression)
peak is identified. The downward velocity at the hang-off point induces the bending moment
and negative effective tension (compression) at the TDP. A combination of excessive bending
moment and compression at the TDP may result in an incapability of the riser to satisfy the
strength design requirement.
To assess the feasibility of the risers, an integrated system approach was adopted where the
different downward velocities at the hang-off point was investigated to capture the limitations
of riser integrity. The extreme response analysis was performed using load cases based on the
different downward velocities at the hang-off point in the screening process.
The Conventional SCR has difficulty in meeting the strength design requirement in the harsh
environment. The concept of weight distributed SCR showed a significant improvement to the
SCR by establishing “near-bottom support” of heavy cross section at the bottom of straight
section. Although the WDSCR and the conventional SCR has the same downward velocity at
the hang-off point, the WDSCR has less downward velocity at the TDP compared to the
conventional SCR. The heavy cross section of WDSCR reduces the critical responses (i.e.
bending moment, compression and utilization) at the TDP and extend the feasibility of the

Master Thesis Feasibility Study of Selected Riser Concepts in Deep Water and Harsh Environment
Gilang Muhammad Gemilang 147
SCR. The study concludes that there is a significant improvement of strength design for the
WDSCR compared to the conventional SCR.
The concept of “steel lazy” wave riser (SLWR) showed superior performance over the
conventional SCR and the WDSCR. The lazy wave configuration can distribute the bending
stress along the riser efficiently. The buoyancy modules are effective to isolate the dynamic
motion of the floater from the TDP which results in lower bending stress at the TDP
compared to both WDSCR and conventional SCR.
Overall, from the extreme response analysis study, the results showed that a feasible
conventional SCR configuration can be obtained if the downward velocity at the hang-off
point is restricted below 2.6 m/s. It is also found that the downward velocity at the sag-bend
of the SCR is restricted below 3.03 m/s. On the other hand, a feasible WDSCR configuration
can be obtained, if the downward velocity at the hang-off point is restricted below 3.2 m/s. It
is also found that the downward velocity at the sag-bend of the WDSCR is restricted below
3.43 m/s.
The results showed that the SLWR configuration can cope with even downward velocity of 6
m/s at the hang-off point. Thereby the SLWR configuration is proven to be the most robust
configuration to cope with large motion of the host platform in respect to strength and fatigue
performance.
From a separate study, the SCR/WDSCR with uniform external coating showed less riser
integrity compared to the SCR/WDSCR without uniform external coating. The density of
uniform external coating is less than the density of sea water, resulting in a net buoyancy
force on the riser structure. Thus, it can be concluded that the heavier the SCR/WDSCR, the
better riser integrity is achieved to cope with the large motion of the host platform. The effect
of uniform external coating is significant for free hanging configuration of SCR and WDSCR.
On the other hand, the effect of uniform external coating is not significant for the SLWR.
Fatigue Performance
The wave induced fatigue analysis of three riser concepts were performed using a
comprehensive time domain analysis. A total of 216 load cases from 12 wave directions and
18 non-linear dynamic analyses, applying irregular sea states of JONSWAP, were considered.
The results of the conventional SCR showed unsatisfactory wave induced fatigue
performance. A minimum fatigue life of 80 years was observed at the TDP, considering D-
curve.
The investigation of the WDSCR resulted in a better wave induced fatigue performance than
the conventional SCR. The minimum fatigue life of 247 years was observed at the TDP,
considering D-curve. However, this result is still under the acceptable limit of 250 years. On
the other hand, the results of the SLWR showed satisfactory wave induced fatigue
performance with the minimum fatigue life of 874 years, considering D-curve. This result is
well above the acceptable limit of 250 years.
It is noted that the hang-off area presented very low fatigue performance. In order to solve
this, this section will, in practice, be occupied with flex joint and there are proven measures to

Master Thesis Feasibility Study of Selected Riser Concepts in Deep Water and Harsh Environment
Gilang Muhammad Gemilang 148
manage it. Therefore, this result is useful for planning an appropriate design of the flex joint
and other measures in order to reduce the fatigue damage in the hang-off area.
The VIV fatigue analysis of the SLWR was performed using a total of 28 load cases from 14
current profiles in in-plane and out-of-plane current directions. The results showed the
minimum fatigue life of 113 years at the TDP, considering D-curve. This result is much
below the acceptable limit of 500 years. However, this problem can be solved by introducing
some proven measures to suppress the vortex shedding around the riser. The helical strakes
have been proposed as a solution to mitigate the fatigue damage due to VIV. The helical
strake coverage length is estimated to be approximately 50% in the middle section of the
upper catenary, where the straight section of the SLWR is exposed to the current.
Summary
In summary, several types of the SCR configurations have been developed by installing either
buoyancy or ballast modules at the lower part of the riser. Each configuration has
characteristics which make it better suited for particular applications. An optimization of riser
configuration by combining ballast modules, which is known as the WDSCR, results in more
applicable concept than the conventional SCR, while an optimization riser configuration by
combining buoyancy modules, which is known as the SLWR, results in more applicable riser
concept than both conventional SCR and WDSCR.
9.2 Recommendation
In this study, the feasibility of the conventional SCR, weight distributed SCR and steel lazy
wave configuration in terms of capability to cope with the large motion of the host platform
has been investigated. The study was extensive with different load cases to see how riser
concepts can cope with the different downward velocity at the hang-off point. However, there
is abundant room for further work of this study. The following are recommendations for
further works that need to be carried out in this study.
The investigation of other riser concepts is recommended for further work of this
study in order to understand the feasibility of other riser concepts in terms of
capability to cope with the vessel heave motion.
The riser is flooded with oil in this study, sensitivity study can be carried out in order
to consider the empty riser condition.
A uniform hydrodynamic coefficient was considered in this study, sensitivity study
can be carried out in order to consider different hydrodynamic coefficient due to
marine growth and Reynolds number along the suspended riser.
Wave induced fatigue analysis may be performed with different vessel offsets and
different vessel drafts to see how these factors contribute to the fatigue performance of
the riser.
VIV fatigue analysis may be performed with the introduction of helical strakes in the
middle section of the upper SLWR catenary to have sufficient fatigue life within the
FLS design criteria.

Master Thesis Feasibility Study of Selected Riser Concepts in Deep Water and Harsh Environment
Gilang Muhammad Gemilang 149
References
1. Alderton, N. and Thethi, R. (1998). Choosing the Most Appropriate Rigid Catenary
Riser Design for Various Deepwater and Harsh Environments. Advances in Riser
Systems & Subsea Technologies for Deepwater. Aberdeen, UK.
2. Alliot, V., Legras, J.L., Perinet, D. (2005). Ultra-deepwater riser choice requires
careful analysis. Available at: <http://www.offshore-mag.com/articles/print/volume-
65/issue-6.html > [accessed on 11th March 2015]
3. API. (2006). Design of Risers for Floating Production Systems (FPSs) and Tension-
Leg PLatforms (TLPs). Recommended Practice, API-RP-2RD. American Petroleum
Institute.
4. BALMORAL. 2014. Distributed Buoyancy Modules (Online). Balmoral Offshore
Engineering. Available:<http://www.balmoral-offshore-engineering/2-surf-
distributed-buoyancy.php> (Accessed 06 June 2014).
5. Baltrop, N. D. P. (1998). Floating Structure: A Guide for Design and Analysis (Vol.
2). London: The Center for Marine and Petroleum Technology.
6. Bai, Y. and Bai, Q. (2010a). Subsea Pipelines and Risers. Houston, USA: Elsevier Inc.
7. Bai, Y. and Bai, Q. (2010b). Subsea Engineering Handbook, USA: Elsevier Inc.
8. Beattie, M., Lahey, E., Burke R. W. and Balch, E. R. (2013). Caesar-Tonga Project
Steel Lazy-Wave Riser Design. OTC 24232. Proceeding Offshore Technology
Conference. Houston, Texas, USA.
9. Bell, J.M. and Chin, Y.D., Hanrahan, S. (2005). State of The Art of Ultra Deepwater
Production Technologies. OTC 17615. Prepared for presentation at the OTC. Houston,
Texas, U.S.A.
10. Burgess, M. and Lim, F. (2006). Installation of Deepwater Risers, 2H Offshore, UK.
11. Calqlata. 2010. Vessel Motion Calculator (displacements velocities accelerations).
(image online) Available at: <http://www.calqlata.com/productpages/00059-
help.html> (Accessed 10 March 2015).
12. Chacko, J., Ghalambor, A., Guo, B., and Song, S. (2005). Offshore Pipelines.
Burlington, USA: Gulf Professional Publishing.
13. Chen, J., Cao, P., Zhu, H., and Jukes, P. (2009). Time Trace Window Based Approach
for SCR Strength Analysis in Ultra Deepwater of Gulf of Mexico, OMAE
Paper79529, Honolulu, Hawai, USA.
14. Chen, J. and Cao, P. (2013). Design of Steel Lazy Wave Riser for Disconnectable
FPSO. SBM Offshore.OTC24166. Prepared for presentation at the OTC. Houston,
USA.
15. DNV. (2010a). DNV-OS-F201: Dynamic Riser. Norway: Det Norske Veritas.
16. DNV. (2010b). DNV-RP-C205: Environmental Conditions and Environmental Loads.
Norway: Det Norske Veritas.
17. DNV. (2010c). DNV-RP-C203: Fatigue Design of Offshore Steel Structures. Norway:
Det Norske Veritas.

Master Thesis Feasibility Study of Selected Riser Concepts in Deep Water and Harsh Environment
Gilang Muhammad Gemilang 150
18. DNV. (2010d). DNV-RP-F205: Global Performance Analysis of Deepwater Floating
Structures. Norway: Det Norske Veritas.
19. DNV. (2011). DNV-OS-H101: Marine Operations, General. Norway: Det Norske
Veritas.
20. DNV. (2013). DNV-OS-E301: Position Mooring. Norway: Det Norske Veritas
21. Foyt, E., Griffin, C. and Campbell, M. (2007). Weight Optimized SCR – Enabling
Technology for Turret Moored FPSO Developments. Proceedings of the 26th
International Conference on Offshore Mechanics and Arctic Engineering, 10-15 June
2007. San Diego, California, USA.
22. Hatton, S. A. and Howells, H. (1996). Catenary and Hybrid Risers for Deepwater
Locations worldwide. 2H Offshore Engineering Limited Woking, Surrey, UK.
23. Hatton, S. A. and Willis N. (1998). Steel Catenary Risers for Deepwater
Environments. OTC 8607. Proceeding Offshore Technology Conference. Houston,
Texas, USA.
24. Haver, S. K. (2010). Prediction of Characteristic Response for Design Purpose.
Norway: Statoil.
25. Howells, H. and Hatton, S. A. (1997). Challenges for Ultra-deep Water Riser Systems.
Floating Production Systems IIR, London.
26. Journée, J.M.J. and Massie, W. W. (2001). Introduction in Offshore Hydromechanics
(OT3600). Delft, Netherland: Delft University of Technology.
27. Karunakaran, D. and Baarholm, R. (2013). COBRA: An Uncoupled Riser System for
Ultra-deep Water in Harsh Environment, OTC-23986-MS. Paper presented at the
OTC, Houston, Texas, USA.
28. Karunakaran, D., Legras, J. and Jones, R. (2013). Fatigue Enhancement of SCRs:
Design Applying Weight Distribution and Optimized Fabrication. OTC-23945-MS.
Prepared for presentation at the OTC. Houston, Texas, USA: Subsea 7.
29. Karunakaran, D., Nordsve, N. T. and Olufsen, A. (1996). An Efficient Metal Riser
Configuration for Ship and Semi Based Production Systems. International Offshore
and Polar Engineering Conference 1996 Los Angeles.
30. Karunakaran, D., Meling T. S., Kristoffersen S. and Lund, K. M. (2005): Weight
Optimized SCRs for Deepwater Harsh Environments. Proceedings Offshore
Technology Conference, 2-5 May. Houston, Texas, USA.
31. Karunakaran, D. and Meling, T. S. (2006). Robust SCR Design against Fatigue in
Deep water Harsh Environments, Proceedings Offshore Technology Conference,
Houston, Texas, USA.
32. Kavanagh, W. K., Lou, J. & Hays, P. (2003). Design of Steel Risers in Ultra Deep
Water – The Influence of Recent Code Requirements on Wall Thickness Design for
10,000ft Water Depth. Offshore Technology Conference. Houston, Texas.
33. Lien, T. (2010). Riser System. Retrieved from http://subsea1.com website:
http://subsea1.com/index/page?page_id=11018
34. Maneschy, M., Romanelli, B., Butterworth, C., Pedrosa, J., Escudero, C. and Vargas
T. (2015). Steel Catenary Risers (SCRs): from design to installation of the first reel
CRA lined pipes. Part II: Fabrication and Installation. OTC-25857-MS. Proceedings
Offshore Technology Conference, 5-8 May. Houston, Texas, USA.

Master Thesis Feasibility Study of Selected Riser Concepts in Deep Water and Harsh Environment
Gilang Muhammad Gemilang 151
35. Masturi, L. M. (2012). Comparison Study of Selected Uncoupled Riser Concepts in
Deep Water and Harsh Environment. (MSc), University of Stavanger, Norway.
36. Nurwanto, T. (2012). COBRA Riser Concept for Ultra Deepwater Condition. (MSc),
University of Stavanger, Norway.
37. NORSOK. (2007). N-003: Action and Action Effects. Norway: Standards Norway.
38. Odland, J. 2013. Offshore Field Development: Platform concepts and design issues.
OFF500 - Lecture Notes. Stavanger, Norway: University of Stavanger.
39. Olufsen, A., Loland, G., Gorf, P. and Webb, S. 2003. Evaluation Ranks Deepwater,
Harsh Environments Floater, Riser Concepts. Oil and Gas Journal, 101, 39-46.
40. OGJ. (2010). Strategic Development on the Outer Edge. (Internet) Available at: <
http://www.ogj.com/articles/shell/perdido/2010/04/strategic-development-on-the-
outer-edge.html> (Accessed 12 February 2015).
41. Olufsen, A., Loland, G., Gorf, P. & Webb, S. 2003. Evaluation Ranks Deepwater,
Harsh Environments Floater, Riser Concepts. Oil and Gas Journal, 101, 39-46.
42. Orcina. (2010). ORCAFLEX Manual (Version 9.4a). Cumbria, UK: Orcina Ltd.
43. Orimolade, A. P. (2014). Steel Lazy Wave Risers from Turret Moored FPSO. (MSc),
University of Stavanger, Norway.
44. Palmer, A.C., and King, R.A. (2008). Subsea Pipeline Engineering. Tulsa, Oklahoma,
USA: Penwell Corporation.
45. Perinet, D., and Frazer, I. (2007). J-Lay and Steep S-Lay: Complementary Tools for
Ultra deep Water, Proceedings Offshore Technology Conference. Houston, Texas,
USA.
46. Petruzka, D. J., Zimmermann, C. A., Krafft, K. M., Thurmond, B. F., Duggal, A.
(2002) Riser System Selection and Design for a Deepwater FSO in the Gulf of
Mexico. Offshore Technology Conference - OTC 14154. Houston, Texas.
47. Phifer, E. H., Kopp, F., Swanson, R. C., Allen, D. W. & Langner, C. G. (1994).
Design and Installation of Auger Steel Catenary Risers. Offshore Technology
Conference - OTC 7620. Houston, Texas.
48. Riflex. (2011). Riflex User Manual, V3.4. Høvik, Norway: Marintek.
49. Rodrigues, M. V., Hansen, V. L., Bahiense, R.A., and Raposo, C.V. (2008). Steel
Catenary Riser Design Based on Prescribed Motions from Coupled Analysis
Methodology. Proceedings Offshore Technology Conference, 5-8 May. Houston,
Texas, USA.
50. Senra, S. F., Andrade, E. Q., Mourelle, M. M. and Torres, A. L. F. L. (2011).
Challenges Faced in the Design of References SLWR Configuration for the Pre-Salt
Area. Ocean, Offshore and Arctic Engineering, OMAE2011, 2011 Rotterdam,
Netherlands.
51. St. Denis, M. and Pierson, W. J. (1953). On the Motion of Ships in Confused Seas.
Transactions SNAME, 61:1–53.
52. Tawekal, R. L. (2010). Bangunan Lepas Pantai 2. Bandung, Indonesia: Institut
Teknologi Bandung.
53. Vivsolutions. 2015 (Internet) Available at: <http://www.vivsolutions.com/about-
us/who-we-are/management/> (Accessed 14 February 2015).

Master Thesis Feasibility Study of Selected Riser Concepts in Deep Water and Harsh Environment
Gilang Muhammad Gemilang 152
54. Vivana. (2005). VIVANA Theory Manual Version 3.4. Trondheim, Norway:
Marintek.
55. Yue, B., Walters, D., Yu, W., Raghavan, K. and Thompson, H. (2011). Lazy wave
SCRon Turret Moored FPSO. 2H offshore. Houston., USA.

Master Thesis Feasibility Study of Selected Riser Concepts in Deep Water and Harsh Environment
Gilang Muhammad Gemilang 153
Appendix A - Wall Thickness Calculation

Master Thesis Feasibility Study of Selected Riser Concepts in Deep Water and Harsh Environment
Gilang Muhammad Gemilang 154
Appendix B - Sensitivity Analysis Results
This section gives the summary results of the SLWR with coating and the SLWR without
coating for load case 9, 10, 11, 12, 13, 14 and 15.
Load Case 9 Semi Position
Intact Damage
Coating Far Near Far Near
Effective Top Tension (kN) 2657 2396 2729 2395
Sag-bend
Max. Effective Tension (kN) 854 335 948 316
Max. Bending Moment (kN.m) 167 333 165 354
DNV Utilization (LRFD) 0.40 0.67 0.36 0.62
Hog-bend
Max. Effective Tension (kN) 849 305 946 291
Max. Bending Moment (kN.m) 141 231 144 247
DNV Utilization (LRFD) 0.36 0.51 0.34 0.47
TDP
Max. Effective Tension (kN) 848 258 946 246
Max. Bending Moment (kN.m) 166 331 167 347
DNV Utilization (LRFD) 0.42 0.67 0.37 0.60
Load Case 9 Semi Position
Intact Damage
No Coating Far Near Far Near
Max. Effective Tension (kN) 2829 2622 2899 2620
Sag-bend
Max. Effective Tension (kN) 877 372 974 352
Max. Bending Moment (kN.m) 161 331 156 354
DNV Utilization (LRFD) 0.40 0.66 0.35 0.61
Hog-bend
Max. Effective Tension (kN) 875 322 972 306
Max. Bending Moment (kN.m) 121 203 121 217
DNV Utilization (LRFD) 0.33 0.47 0.31 0.43
TDP
Max. Effective Tension (kN) 874 277 971 262
Max. Bending Moment (kN.m) 168 329 164 344
DNV Utilization (LRFD) 0.41 0.66 0.36 0.60

Master Thesis Feasibility Study of Selected Riser Concepts in Deep Water and Harsh Environment
Gilang Muhammad Gemilang 155
Load Case 10 Semi Position
Intact Damage
Coating Far Near Far Near
Effective Top Tension (kN) 2784 2483 2787 2505
Sag-bend
Max. Effective Tension (kN) 915 353 989 331
Max. Bending Moment (kN.m) 172 335 176 356
DNV Utilization (LRFD) 0.40 0.67 0.38 0.62
Hog-bend
Max. Effective Tension (kN) 895 318 980 302
Max. Bending Moment (kN.m) 149 233 161 250
DNV Utilization (LRFD) 0.38 0.52 0.36 0.48
TDP
Max. Effective Tension (kN) 895 259 980 247
Max. Bending Moment (kN.m) 169 337 177 353
DNV Utilization (LRFD) 0.42 0.68 0.38 0.61
Load Case 10 Semi Position
Intact Damage
No Coating Far Near Far Near
Max. Effective Tension (kN) 2935 2698 2951 2710
Sag-bend
Max. Effective Tension (kN) 928 389 1006 366
Max. Bending Moment (kN.m) 164 333 163 356
DNV Utilization (LRFD) 0.40 0.67 0.36 0.62
Hog-bend
Max. Effective Tension (kN) 917 335 998 316
Max. Bending Moment (kN.m) 125 207 131 220
DNV Utilization (LRFD) 0.34 0.48 0.32 0.44
TDP
Max. Effective Tension (kN) 916 278 998 262
Max. Bending Moment (kN.m) 169 332 169 351
DNV Utilization (LRFD) 0.41 0.67 0.37 0.61
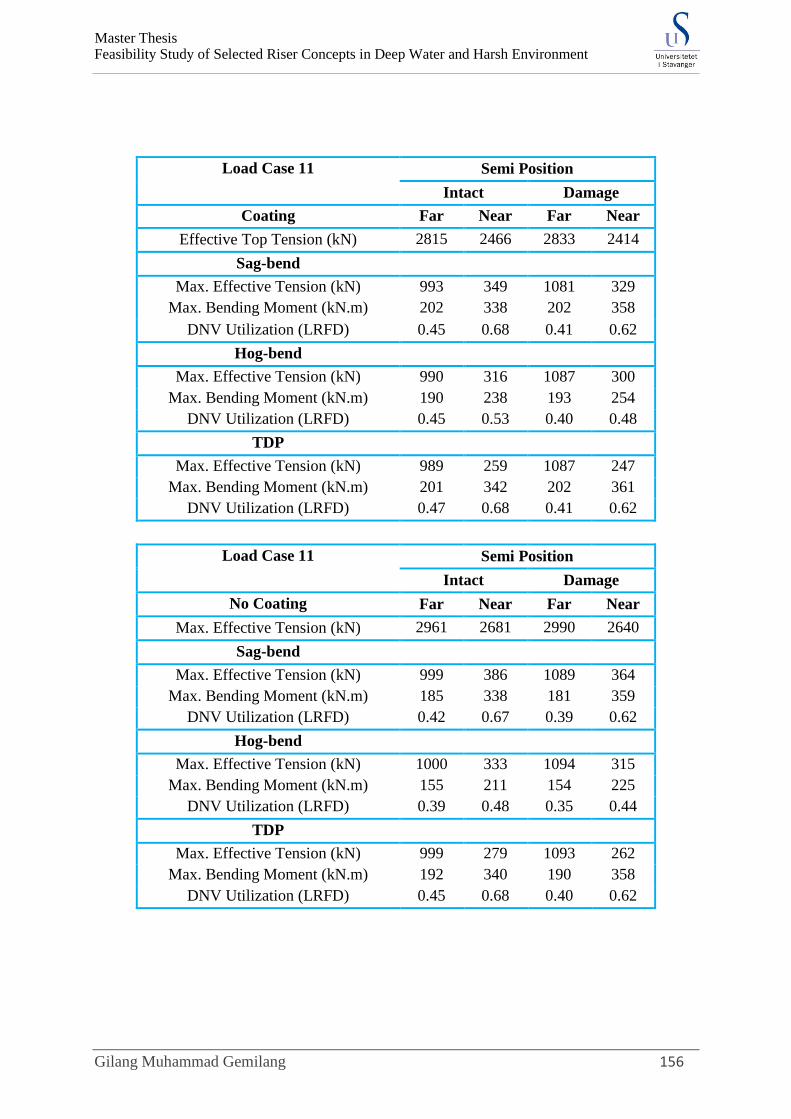
Master Thesis Feasibility Study of Selected Riser Concepts in Deep Water and Harsh Environment
Gilang Muhammad Gemilang 156
Load Case 11 Semi Position
Intact Damage
Coating Far Near Far Near
Effective Top Tension (kN) 2815 2466 2833 2414
Sag-bend
Max. Effective Tension (kN) 993 349 1081 329
Max. Bending Moment (kN.m) 202 338 202 358
DNV Utilization (LRFD) 0.45 0.68 0.41 0.62
Hog-bend
Max. Effective Tension (kN) 990 316 1087 300
Max. Bending Moment (kN.m) 190 238 193 254
DNV Utilization (LRFD) 0.45 0.53 0.40 0.48
TDP
Max. Effective Tension (kN) 989 259 1087 247
Max. Bending Moment (kN.m) 201 342 202 361
DNV Utilization (LRFD) 0.47 0.68 0.41 0.62
Load Case 11 Semi Position
Intact Damage
No Coating Far Near Far Near
Max. Effective Tension (kN) 2961 2681 2990 2640
Sag-bend
Max. Effective Tension (kN) 999 386 1089 364
Max. Bending Moment (kN.m) 185 338 181 359
DNV Utilization (LRFD) 0.42 0.67 0.39 0.62
Hog-bend
Max. Effective Tension (kN) 1000 333 1094 315
Max. Bending Moment (kN.m) 155 211 154 225
DNV Utilization (LRFD) 0.39 0.48 0.35 0.44
TDP
Max. Effective Tension (kN) 999 279 1093 262
Max. Bending Moment (kN.m) 192 340 190 358
DNV Utilization (LRFD) 0.45 0.68 0.40 0.62

Master Thesis Feasibility Study of Selected Riser Concepts in Deep Water and Harsh Environment
Gilang Muhammad Gemilang 157
Load Case 12 Semi Position
Intact Damage
Coating Far Near Far Near
Effective Top Tension (kN) 2861 2521 2877 2520
Sag-bend
Max. Effective Tension (kN) 1034 364 1127 338
Max. Bending Moment (kN.m) 193 341 200 361
DNV Utilization (LRFD) 0.43 0.68 0.41 0.62
Hog-bend
Max. Effective Tension (kN) 1031 325 1138 307
Max. Bending Moment (kN.m) 179 239 192 256
DNV Utilization (LRFD) 0.43 0.53 0.40 0.49
TDP
Max. Effective Tension (kN) 1030 259 1137 247
Max. Bending Moment (kN.m) 192 343 200 363
DNV Utilization (LRFD) 0.46 0.69 0.41 0.63
Load Case 12 Semi Position
Intact Damage
No Coating Far Near Far Near
Max. Effective Tension (kN) 3004 2725 3023 2726
Sag-bend
Max. Effective Tension (kN) 1033 400 1121 371
Max. Bending Moment (kN.m) 179 340 179 362
DNV Utilization (LRFD) 0.41 0.68 0.38 0.63
Hog-bend
Max. Effective Tension (kN) 1030 343 1127 321
Max. Bending Moment (kN.m) 146 211 153 227
DNV Utilization (LRFD) 0.37 0.48 0.35 0.45
TDP
Max. Effective Tension (kN) 1029 278 1126 262
Max. Bending Moment (kN.m) 187 344 187 363
DNV Utilization (LRFD) 0.44 0.69 0.39 0.63

Master Thesis Feasibility Study of Selected Riser Concepts in Deep Water and Harsh Environment
Gilang Muhammad Gemilang 158
Load Case 13 Semi Position
Intact Damage
Coating Far Near Far Near
Effective Top Tension (kN) 3042 2609 3161 2593
Sag-bend
Max. Effective Tension (kN) 1215 393 1379 363
Max. Bending Moment (kN.m) 233 344 247 364
DNV Utilization (LRFD) 0.50 0.69 0.47 0.63
Hog-bend
Max. Effective Tension (kN) 1232 349 1402 327
Max. Bending Moment (kN.m) 232 243 252 259
DNV Utilization (LRFD) 0.52 0.53 0.48 0.49
TDP
Max. Effective Tension (kN) 1232 258 1401 246
Max. Bending Moment (kN.m) 226 361 235 377
DNV Utilization (LRFD) 0.51 0.72 0.45 0.64
Load Case 13 Semi Position
Intact Damage
No Coating Far Near Far Near
Max. Effective Tension (kN) 3139 2807 3252 2796
Sag-bend
Max. Effective Tension (kN) 1189 426 1343 396
Max. Bending Moment (kN.m) 206 345 209 367
DNV Utilization (LRFD) 0.45 0.69 0.42 0.63
Hog-bend
Max. Effective Tension (kN) 1210 365 1363 342
Max. Bending Moment (kN.m) 182 214 192 229
DNV Utilization (LRFD) 0.44 0.49 0.40 0.45
TDP
Max. Effective Tension (kN) 1209 280 1363 263
Max. Bending Moment (kN.m) 212 360 215 375
DNV Utilization (LRFD) 0.47 0.72 0.43 0.64

Master Thesis Feasibility Study of Selected Riser Concepts in Deep Water and Harsh Environment
Gilang Muhammad Gemilang 159
Load Case 14 Semi Position
Intact Damage
Coating Far Near Far Near
Effective Top Tension (kN) 3208 2655 3325 2708
Sag-bend
Max. Effective Tension (kN) 1339 415 1516 384
Max. Bending Moment (kN.m) 284 347 311 367
DNV Utilization (LRFD) 0.59 0.69 0.56 0.63
Hog-bend
Max. Effective Tension (kN) 1362 365 1548 342
Max. Bending Moment (kN.m) 299 246 334 262
DNV Utilization (LRFD) 0.64 0.54 0.59 0.49
TDP
Max. Effective Tension (kN) 1361 259 1547 247
Max. Bending Moment (kN.m) 256 368 270 386
DNV Utilization (LRFD) 0.57 0.73 0.50 0.66
Load Case 14 Semi Position
Intact Damage
No Coating Far Near Far Near
Max. Effective Tension (kN) 3269 2846 3377 2885
Sag-bend
Max. Effective Tension (kN) 1292 446 1455 416
Max. Bending Moment (kN.m) 237 350 249 371
DNV Utilization (LRFD) 0.51 0.70 0.48 0.64
Hog-bend
Max. Effective Tension (kN) 1325 380 1489 356
Max. Bending Moment (kN.m) 225 215 245 231
DNV Utilization (LRFD) 0.51 0.49 0.47 0.45
TDP
Max. Effective Tension (kN) 1324 279 1489 262
Max. Bending Moment (kN.m) 234 366 243 383
DNV Utilization (LRFD) 0.52 0.73 0.47 0.65

Master Thesis Feasibility Study of Selected Riser Concepts in Deep Water and Harsh Environment
Gilang Muhammad Gemilang 160
Load Case 15 Semi Position
Intact Damage
Coating Far Near Far Near
Effective Top Tension (kN) 3420 2812 3483 2779
Sag-bend
Max. Effective Tension (kN) 1510 448 1684 429
Max. Bending Moment (kN.m) 340 352 397 371
DNV Utilization (LRFD) 0.69 0.70 0.67 0.64
Hog-bend
Max. Effective Tension (kN) 1536 392 1725 376
Max. Bending Moment (kN.m) 369 245 439 262
DNV Utilization (LRFD) 0.76 0.54 0.73 0.49
TDP
Max. Effective Tension (kN) 1536 267 1725 254
Max. Bending Moment (kN.m) 279 381 303 398
DNV Utilization (LRFD) 0.61 0.75 0.55 0.67
Load Case 15 Semi Position
Intact Damage
No Coating Far Near Far Near
Max. Effective Tension (kN) 3449 2971 3526 2946
Sag-bend
Max. Effective Tension (kN) 1452 475 1617 455
Max. Bending Moment (kN.m) 275 359 309 376
DNV Utilization (LRFD) 0.57 0.71 0.56 0.64
Hog-bend
Max. Effective Tension (kN) 1489 406 1657 388
Max. Bending Moment (kN.m) 275 228 323 236
DNV Utilization (LRFD) 0.60 0.52 0.58 0.46
TDP
Max. Effective Tension (kN) 1488 291 1656 273
Max. Bending Moment (kN.m) 257 382 275 399
DNV Utilization (LRFD) 0.56 0.75 0.51 0.67

Master Thesis Feasibility Study of Selected Riser Concepts in Deep Water and Harsh Environment
Gilang Muhammad Gemilang 161
Appendix C - Description of Software Used
C.1 ORCAFLEX Software Program
Introduction
This section will give the general description of the ORCAFLEX software that is used in this
thesis. The content of this section is mainly based on the ORCAFLEX Manual. ORCAFLEX
is a fully 3D non-linear time domain finite element program, which is capable to deal with
random large deflections of the flexible line from the initial configuration. ORCAFLEX is a
program developed by Orcina for static and dynamic analysis of a wide range of marine
facilities. This software comprises the main analyses of global analysis, moorings,
installation, and towed system analysis. The software model several objects (i.e. Lines,
Vessels, and Buoys) that can be built up and interlocked with special objects such as Link,
Winch, and Shape to create a proper model of the system (Orcina, 2010).
This software is user-friendly and using a user interface system in order to input data easily.
At initial startup, ORCAFLEX presents a 3D view window showing a blue line representing
the sea surface and a brown line representing the seafloor. At the top of the screen are menus,
a toolbar and a status bar arranged in the manner common to most Windows software. The
menu bar has a number of commands such as commands for opening, saving, printing and
exporting. The menu bar provides ease to edit input data, run the simulation and present
results. It provides commands to perform modeling, starting, stopping, and replaying
analyses. It also provides access to change views of the model. The toolbar is used as a
shortcut to the menu bar; it provides a shortcut to access of the most commonly used
commands. The status bar is used to see the current work state of ORCAFLEX such as the
time of the simulation, completion of the simulation, etc. Figure C.1 below shows the sample
of 3D model in ORCAFLEX. Table C.1 also shows the list of toolbar features, which is
holding a selection of button that offer quick access to the most commonly used in menu bars.
Figure C.1 3D View ORCAFLEX Computer Model (Orcina, 2010)

Master Thesis Feasibility Study of Selected Riser Concepts in Deep Water and Harsh Environment
Gilang Muhammad Gemilang 162
Table C.1 ORCAFLEX Tools (Orcina, 2010)
Model States
ORCAFLEX builds and analyzes a mathematical model of the system for static and dynamic
analysis. The model can be built up from a series of interconnected objects, (i.e. Lines,
Vessels and Buoys). ORCAFLEX perform static and dynamic analysis through a sequence of
states, the status bar shows the current state of the simulation. The figure C.2 presents a
flowchart diagram of states and actions. Based on ORCAFLEX manual, the description of
how model states work is presented as follows:
1. In Reset state, new model from a data file can be modeled or current model can be used as
the starting point for analysis.
2. In Reset state, modification of the model can be performed by adding or removing objects
to make it as required for the new model. It is normally better to use a very simple model in
the early stages of design.

Master Thesis Feasibility Study of Selected Riser Concepts in Deep Water and Harsh Environment
Gilang Muhammad Gemilang 163
3. Run a static analysis to get the equilibrium of static state and prescribe the static position
results. Make any corrections to the model, if needed. Any modification will automatically
reset the model. Steps (2) and (3) are then repeated to get a proper model as required.
4. Run a simulation and monitor the results during the simulation (in Simulating state).
5. If the simulation is unstable, then reset the model and edit the model accordingly. Steps (2)
to (5) are then repeated to get a proper model as required.
6. Complete the simulation of the model, and obtain the results. If more detail results are
needed, then improve the discretization by reducing the time step sizes or increasing the
number of segments used for Lines.
Figure C.2 Sequential Flowchart of ORCAFLEX (Orcina, 2010)
Coordinate System
There are two coordinate systems that used by ORCAFLEX. They are global coordinate
system (GX, GY, and GZ) and local coordinate system (x, y, and z). These coordinate
systems are a right-handed system and normally its Z-axis are heading to the positive
upwards. The Figure C.3 shows the description of the global coordinate systems and local
coordinate system in ORCAFLEX.

Master Thesis Feasibility Study of Selected Riser Concepts in Deep Water and Harsh Environment
Gilang Muhammad Gemilang 164
Figure C.3 Coordinate system (Orcina, 2010)
Directions and headings are specified in ORCAFLEX by giving the azimuth angle of the
direction, in degrees, measured positive from the positive x-axis towards the positive y-axis,
as shown in the following figure.
Figure C.4 Direction and Headings (Orcina, 2010)
Directions for waves, current and wind are specified by giving the azimuth direction, relative
to global axes.
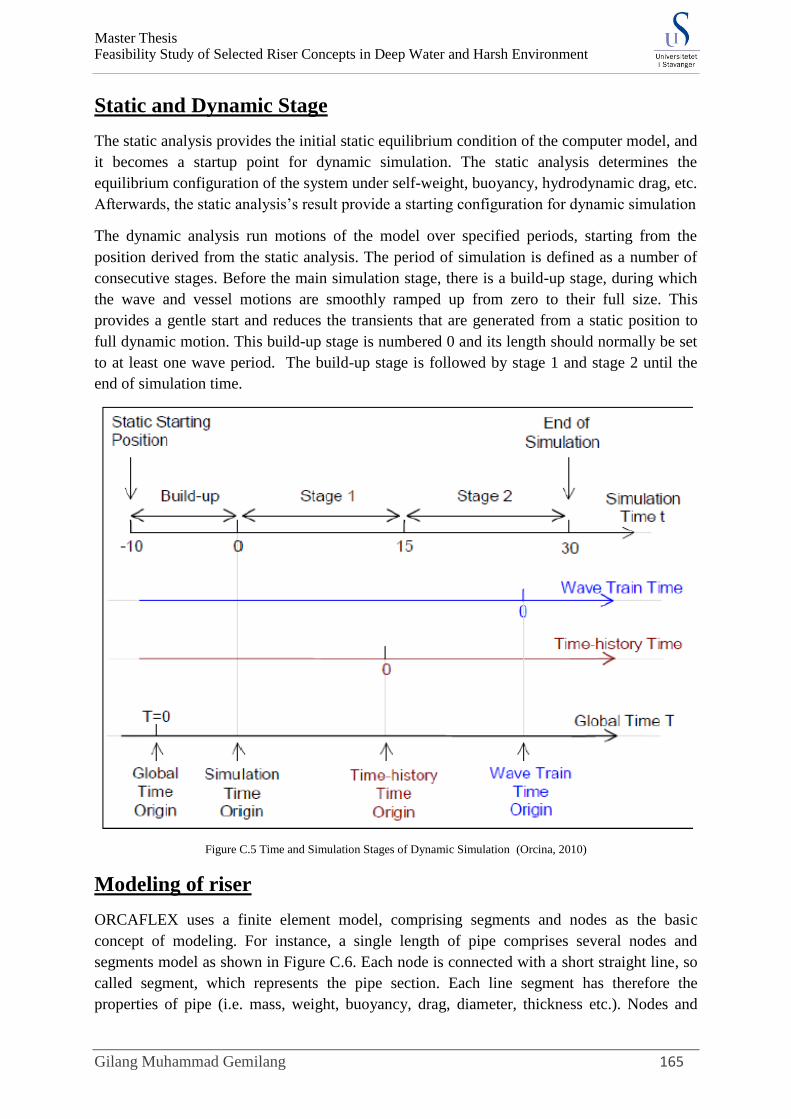
Master Thesis Feasibility Study of Selected Riser Concepts in Deep Water and Harsh Environment
Gilang Muhammad Gemilang 165
Static and Dynamic Stage
The static analysis provides the initial static equilibrium condition of the computer model, and
it becomes a startup point for dynamic simulation. The static analysis determines the
equilibrium configuration of the system under self-weight, buoyancy, hydrodynamic drag, etc.
Afterwards, the static analysis‟s result provide a starting configuration for dynamic simulation
The dynamic analysis run motions of the model over specified periods, starting from the
position derived from the static analysis. The period of simulation is defined as a number of
consecutive stages. Before the main simulation stage, there is a build-up stage, during which
the wave and vessel motions are smoothly ramped up from zero to their full size. This
provides a gentle start and reduces the transients that are generated from a static position to
full dynamic motion. This build-up stage is numbered 0 and its length should normally be set
to at least one wave period. The build-up stage is followed by stage 1 and stage 2 until the
end of simulation time.
Figure C.5 Time and Simulation Stages of Dynamic Simulation (Orcina, 2010)
Modeling of riser
ORCAFLEX uses a finite element model, comprising segments and nodes as the basic
concept of modeling. For instance, a single length of pipe comprises several nodes and
segments model as shown in Figure C.6. Each node is connected with a short straight line, so
called segment, which represents the pipe section. Each line segment has therefore the
properties of pipe (i.e. mass, weight, buoyancy, drag, diameter, thickness etc.). Nodes and

Master Thesis Feasibility Study of Selected Riser Concepts in Deep Water and Harsh Environment
Gilang Muhammad Gemilang 166
segments are ordered with a number from 1 to n, in which n is the total number of the nodes
or segments sequentially from End A of the line to End B.
Figure C.6 Line Model in ORCAFLEX (Orcina, 2010)
Forces and moments are applied at the nodes. Each segment is represented as two co-axial
telescoping rods that are connected by axial and torsional spring with dampers. The bending
properties of the line are represented by rotational spring with dampers at each end of the
segment. The model segments only model the axial and torsional properties of the line. Figure
C.7 shows the structural detail of the line model.
Figure C.7 Structural Detail of Line Model in ORCAFLEX (Orcina, 2010)

Master Thesis Feasibility Study of Selected Riser Concepts in Deep Water and Harsh Environment
Gilang Muhammad Gemilang 167
C.2 RIFLEX Software Program
In this thesis, The SLWR is remodeled in RIFLEX in order to find fatigue damage due to VIV
with VIVANA. RIFLEX is used to establish INPMOD and STAMOD of the SLWR to be
applied as input to VIVANA. This section describes the general description of applied
feature of RIFLEX, according to RIFLEX manual. RIFLEX is a computer program for
analysis of slender structures, such as mooring lines, fish cage systems, pipelines and risers. It
is a product of MARINTEK. RIFLEX comprises five modules communicating by a file
system as shown in Figure C.8.
Figure C.8 RIFLEX Program Structure (Riflex, 2011)
Each module is described in the following table.
Table C.2 Description of Modules (Riflex, 2011)
Module Description
INPMOD
The INPMOD module reads most input data and organizes a data base for use during
subsequent analyses. Once the INPMOD module has been run, several analyses can be
performed by the other modules without rerun of INPMOD.
STAMOD
The STAMOD module performs several types of static analyses. The results may be used
directly in parameter studies etc., and are also used to define the initial configuration for a
succeeding dynamic analysis. Element mesh, stressfree configuration and key data for
finite element analysis are also generated by STAMOD based on system data given as
input to INPMOD.
DYNMOD
The DYNMOD module carries out time domain dynamic analyses based on the final static
configuration, environment data and data to define motions applied as forced
displacements in the analysis. It is possible to perform several dynamic analyses without
rerun of INPMOD and STAMOD. Response time series are stored on file for further
postprocessing by OUTMOD and PLOMOD. In addition to dynamic response, natural
frequencies and modeshapes can be calculated.
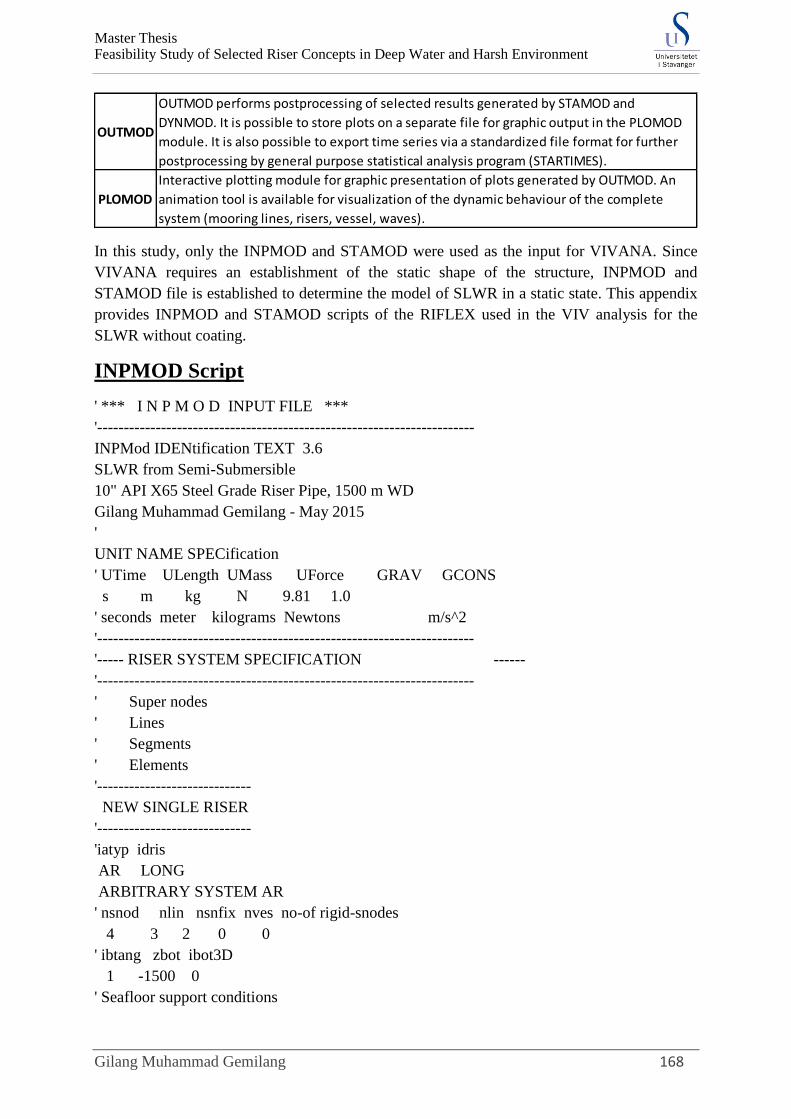
Master Thesis Feasibility Study of Selected Riser Concepts in Deep Water and Harsh Environment
Gilang Muhammad Gemilang 168
In this study, only the INPMOD and STAMOD were used as the input for VIVANA. Since
VIVANA requires an establishment of the static shape of the structure, INPMOD and
STAMOD file is established to determine the model of SLWR in a static state. This appendix
provides INPMOD and STAMOD scripts of the RIFLEX used in the VIV analysis for the
SLWR without coating.
INPMOD Script
' *** I N P M O D INPUT FILE ***
'-----------------------------------------------------------------------
INPMod IDENtification TEXT 3.6
SLWR from Semi-Submersible
10" API X65 Steel Grade Riser Pipe, 1500 m WD
Gilang Muhammad Gemilang - May 2015
'
UNIT NAME SPECification
' UTime ULength UMass UForce GRAV GCONS
s m kg N 9.81 1.0
' seconds meter kilograms Newtons m/s^2
'-----------------------------------------------------------------------
'----- RISER SYSTEM SPECIFICATION ------
'-----------------------------------------------------------------------
' Super nodes
' Lines
' Segments
' Elements
'-----------------------------
NEW SINGLE RISER
'-----------------------------
'iatyp idris
AR LONG
ARBITRARY SYSTEM AR
' nsnod nlin nsnfix nves no-of rigid-snodes
4 3 2 0 0
' ibtang zbot ibot3D
1 -1500 0
' Seafloor support conditions
OUTMOD
OUTMOD performs postprocessing of selected results generated by STAMOD and
DYNMOD. It is possible to store plots on a separate file for graphic output in the PLOMOD
module. It is also possible to export time series via a standardized file format for further
postprocessing by general purpose statistical analysis program (STARTIMES).
PLOMOD
Interactive plotting module for graphic presentation of plots generated by OUTMOD. An
animation tool is available for visualization of the dynamic behaviour of the complete
system (mooring lines, risers, vessel, waves).

Master Thesis Feasibility Study of Selected Riser Concepts in Deep Water and Harsh Environment
Gilang Muhammad Gemilang 169
' stfbot stfaxi stflat friaxi frilat
1.0E6 1.0E5 1.0E0 0.3 0.5
' ilinty isnod1 isnod2
1 1 2
2 2 3
3 3 4
'
' Boundary Conditions - upper end
' isnod ipos ix iy iz irx iry irz
1 0 1 1 1 0 0 0 GLOBAL
' x0 y0 z0 x1 y1 z1 rot dir
0 0 -500 48 0 -21 82
'
' Boundary Conditions - lower end
' isnod ipos ix iy iz irx iry irz
4 0 1 1 1 1 1 1 GLOBAL
' x0 y0 z0 x1 y1 z1 rot dir
2842 0 -500 1850 0.0 -1500
'
'Free nodes
'isnod X Y Z
2 1680 0 -500
3 2180 0 -500
'-----------------------------------------------------------------------
'----- LINE DATA -----
'-----------------------------------------------------------------------
NEW LINE DATA
'-----------------------------
' ilinty nseg icnlty ifluty
1 5 0 98
'icmpty icn1ty iexwty nelseg slgth
1 0 0 4 2
1 0 0 16 8
1 0 0 254 1270
1 0 0 125 250
1 0 0 150 150
'-----------------------------------------------------------------------
NEW LINE DATA
'-----------------------------
' ilinty nseg icnlty ifluty
2 3 0 98
'icmpty icn1ty iexwty nelseg slgth
1 0 3 100 100
1 0 3 300 300

Master Thesis Feasibility Study of Selected Riser Concepts in Deep Water and Harsh Environment
Gilang Muhammad Gemilang 170
1 0 3 100 100
'-----------------------------------------------------------------------
NEW LINE DATA
'-----------------------------
' ilinty nseg icnlty ifluty
3 3 0 98
'icmpty icn1ty iexwty nelseg slgth
1 0 0 100 100
1 0 0 200 200
1 0 0 181 362
'
' ----- -------
'Total 2842
'
'10" Pipe with coating and Cd=1.1
'------------------------------------------------------
NEW COMPONENT CRS1
' icmpty temp
1 10
' ams ae ai rgyr ast wst dst thst
172.014 0.072583 0.050671 0.0990 0.021913 0.001414 0.3040 0.0250
' iea iej igt ipress imf
1 1 1 0
' ea
4.536E9
' ej
4.449E7
' gt
3.422E7
' Hydrodynamic force coefficients
' cqx cqy cax cay clx cly icode d
0.0 1.0 0. 1.0 0. 0. 2 0.304
' tb ycurmx
1 1
'
'Distributed Buoyancy Module
'------------------------------------------------------
NEW COMPONENT EXT1
' icmpty
3
' AMS AE RGYR FRAC
876.359 2.21863 0.433711 0.142333
'
' Hydrodynamic force coefficients

Master Thesis Feasibility Study of Selected Riser Concepts in Deep Water and Harsh Environment
Gilang Muhammad Gemilang 171
' CDX CDY AMX AMY CDLX CDLY
1.0 1.0 0.5 1.0 0 0
'
'------INTERNAL FLUID OIL----------------
NEW COMPONENT FLUID
' icmpty
98
' rhoi vveli pressi dpress idir
800.0 0.0 50.0e3 0.0 2
'
'----------INTERNAL FLUID SEA WATER-------------------------
NEW COMPONENT FLUID
' icmpty
99
' rhoi vveli pressi dpress idir
1025.0 0.0 0.0 0.0 2
'----- ENVIRONMENTAL DESCRIPTION -----
'-----------------------------------------------------------------------
ENVIronment IDENtification
Current conditions
'idenv
ENVIRONMENT
'
WATErdepth AND WAVEtype
'wdepth noirw norw ncusta
1500 0 0 14
'
ENVIronment CONStants
'airden watden wakivi
1.3 1025 1.35E-6
'--------------------------------------------------------------------
' ------------ Case1
NEW CURRENT STATE
' icusta ncuelv
1 6
' curelv curdir curvel
-10.0 180 0.067
-50.0 180 0.058
-200.0 180 0.044
-500.0 180 0.039
-1000.0 180 0.034
-1500.0 180 0.022
'
' ------------ Case2

Master Thesis Feasibility Study of Selected Riser Concepts in Deep Water and Harsh Environment
Gilang Muhammad Gemilang 172
NEW CURRENT STATE
' icusta ncuelv
2 6
' curelv curdir curvel
-10.0 180 0.105
-50.0 180 0.092
-200.0 180 0.081
-500.0 180 0.069
-1000.0 180 0.060
-1500.0 180 0.042
'
' ------------ Case3
NEW CURRENT STATE
' icusta ncuelv
3 6
' curelv curdir curvel
-10.0 180 0.139
-50.0 180 0.122
-200.0 180 0.112
-500.0 180 0.093
-1000.0 180 0.081
-1500.0 180 0.057
'
' ------------ Case4
NEW CURRENT STATE
' icusta ncuelv
4 6
' curelv curdir curvel
-10.0 180 0.174
-50.0 180 0.152
-200.0 180 0.141
-500.0 180 0.115
-1000.0 180 0.099
-1500.0 180 0.071
'
' ------------ Case5
NEW CURRENT STATE
' icusta ncuelv
5 6
' curelv curdir curvel
-10.0 180 0.210
-50.0 180 0.182
-200.0 180 0.171
-500.0 180 0.137

Master Thesis Feasibility Study of Selected Riser Concepts in Deep Water and Harsh Environment
Gilang Muhammad Gemilang 173
-1000.0 180 0.116
-1500.0 180 0.085
'
' ------------ Case6
NEW CURRENT STATE
' icusta ncuelv
6 6
' curelv curdir curvel
-10.0 180 0.251
-50.0 180 0.215
-200.0 180 0.202
-500.0 180 0.160
-1000.0 180 0.135
-1500.0 180 0.100
'
' ------------ Case7
NEW CURRENT STATE
' icusta ncuelv
7 6
' curelv curdir curvel
-10.0 180 0.297
-50.0 180 0.253
-200.0 180 0.238
-500.0 180 0.185
-1000.0 180 0.155
-1500.0 180 0.116
'
' ------------ Case8
NEW CURRENT STATE
' icusta ncuelv
8 6
' curelv curdir curvel
-10.0 180 0.355
-50.0 180 0.300
-200.0 180 0.281
-500.0 180 0.215
-1000.0 180 0.178
-1500.0 180 0.135
'
' ------------ Case9
NEW CURRENT STATE
' icusta ncuelv
9 6
' curelv curdir curvel

Master Thesis Feasibility Study of Selected Riser Concepts in Deep Water and Harsh Environment
Gilang Muhammad Gemilang 174
-10.0 180 0.435
-50.0 180 0.363
-200.0 180 0.339
-500.0 180 0.254
-1000.0 180 0.208
-1500.0 180 0.160
'
' ------------ Case10
NEW CURRENT STATE
' icusta ncuelv
10 6
' curelv curdir curvel
-10.0 180 0.510
-50.0 180 0.422
-200.0 180 0.391
-500.0 180 0.290
-1000.0 180 0.235
-1500.0 180 0.182
'
' ------------ Case11
NEW CURRENT STATE
' icusta ncuelv
1 6
' curelv curdir curvel
-10.0 180 0.545
-50.0 180 0.449
-200.0 180 0.415
-500.0 180 0.306
-1000.0 180 0.247
-1500.0 180 0.192
'
' ------------ Case12
NEW CURRENT STATE
' icusta ncuelv
2 6
' curelv curdir curvel
-10.0 180 0.591
-50.0 180 0.484
-200.0 180 0.445
-500.0 180 0.326
-1000.0 180 0.262
-1500.0 1800 0.205
'
' ------------ Case13

Master Thesis Feasibility Study of Selected Riser Concepts in Deep Water and Harsh Environment
Gilang Muhammad Gemilang 175
NEW CURRENT STATE
' icusta ncuelv
3 6
' curelv curdir curvel
-10.0 180 0.658
-50.0 180 0.535
-200.0 180 0.490
-500.0 180 0.355
-1000.0 180 0.283
-1500.0 180 0.223
'
' ------------ Case14
NEW CURRENT STATE
' icusta ncuelv
4 6
' curelv curdir curvel
-10.0 180 0.793
-50.0 180 0.636
-200.0 180 0.577
-500.0 180 0.412
-1000.0 180 0.325
-1500.0 180 0.259
END
STAMOD Script
' *** S T A M O D INPUT FILE ***
STAMod CONTrol INFOrmation 3.6
SLWR from Semi-Submersible
10" API X65 Steel Grade Riser Pipe, 1500 m WD
Gilang Muhammad Gemilang - May 2015
'-----------------------------------------------------------------------
'irunco idris ianal iprdat iprcat iprfem iprform iprnor
1 LONG 1 5 1 1 0 0
'-------------------------------------------------------
RUN IDENtification
'idres
SHAPE
'------------------------------------------------------
ENVIronment REFErence IDENtifier
'idenv
ENVIRONMENT
'------------------------------------------------------
STATic CONDition INPUt

Master Thesis Feasibility Study of Selected Riser Concepts in Deep Water and Harsh Environment
Gilang Muhammad Gemilang 176
'nlcomp icurin curfac lcons
0 1 1.0 1
'-------------------------------------------------------
COMPutational PROCedure
FEM
FEM ANALysis PARAmeters
'-------------------------------------------------------
LOAD GROUP DATA
' nstep maxit racu
10 500 1.E-6
' lotype
VOLU
'--------------------------------------------------------
LOAD GROUP DATA
' nstep maxit racu
100 500 1.E-6
' lotype
DISP
'--------------------------------------------------------
LOAD GROUP DATA
' nstep maxit racu
10 500 1.E-6
' lotype
FRIC
'--------------------------------------------------------
LOAD GROUP DATA
' nstep maxit racu
10 500 1.E-6
' lotype
CURR
'--------------------------------------------------------
END
C.3 VIVANA Software Program
The computer program VIVANA is used to calculate the fatigue damage due to the response
of a slender structure excited by vortex shedding due to current. This response type is often
referred to as vortex induced vibrations (VIV). The description in this section is based on
VIVANA user manual. VIVANA is linked to RIFLEX to obtain the static state of slender
structure. The two RIFLEX modules INPMOD and STAMOD are required by VIVANA
program system. The general structure of the application between RIFLEX and VIVANA is
shown in Figure C.9.

Master Thesis Feasibility Study of Selected Riser Concepts in Deep Water and Harsh Environment
Gilang Muhammad Gemilang 177
Figure C.9 VIVANA and RIFLEX overall structure (Vivana, 2005)
To obtain fatigue damage over the entire riser length due to VIV, the following are
considered:
• An initial model is established in RIFLEX using the INPMOD and STAMOD modules.
• The VIVEIG module computes normal modes and eigen-frequencies.
• Calculation of some initial important parameters in INIVIV module.
• The dynamic analysis is carried out in VIVRES module.
• The results from VIVRES are then used to calculate fatigue damage in VIVFAT module.
• Final fatigue damage is calculated in VIVDRG module.
This appendix provides VIVANA script of the RIFLEX used in VIV analysis for SLWR
without coating as follows.
VIVANA Script
VIVANA CONTROL INFORMATION
'
SLWR from Semi-Submersible
10" API X65 Steel Grade Riser Pipe, 1500 m WD
Gilang Muhammad Gemilang - May 2015
'

Master Thesis Feasibility Study of Selected Riser Concepts in Deep Water and Harsh Environment
Gilang Muhammad Gemilang 178
' idris idstat idenv temp
LONG SHAPE ENVIRONMENT 10
' -----------------------------------------------------------
WORK ARRAY DIMENSION
' nwiwa
9000000
'---------------------------------------------------------
EIGENVALUE ANALYSIS PARAMETERS
' neig nvec
125 125
' eps1 eps2 eps3 ksr maxit kex shift maxniv
0.0 0.0 0.0 1 7 0 0.0 0
' -----------------------------------------------------------
EIGENVALUE PRINT OPTIONS
' npeig npvec
125 125
' -----------------------------------------------------------
SECTION PROPERTY SPECIFICATION
' nsegp
11
' isegp iexczo iaddma iliftc idampg istrou
1 0 0 0 0 1
2 0 0 0 0 1
3 0 0 0 0 1
4 0 0 0 0 1
5 0 0 0 0 1
6 0 0 0 0 1
7 0 0 0 0 1
8 0 0 0 0 1
9 0 0 0 0 1
10 0 0 0 0 1
11 0 0 0 0 1
'
' -----------------------------------------------------------
'
PROPERTY EXCITATION ZONE
' nexzon
2
' iprono cprpid fhmin fhmax
2 Exc_norm 0.125 0.2
1 Excit_02 0.125 0.2
' -----------------------------------------------------------
PROPERTY DAMPING FACTORS
' ndpfac

Master Thesis Feasibility Study of Selected Riser Concepts in Deep Water and Harsh Environment
Gilang Muhammad Gemilang 179
4
' iprono cprpid fstill flowv fhighv
1 Dmp_norm 1.0 1.0 1.1
2 Damp_01 1.0 0.8 1.14
3 Damp_02 1.0 0.9 1.13
4 Damp_03 1.2 0.3 1.12
' -----------------------------------------------------------
PROPERTY STROUHAL SPECIFICATION
' nstrsp
2
' iprono cprpdi npudsc strou
1 Strou_01 18 0.18
' reynum strnum
40. 0.1
100. 0.18
200. 0.19
400. 0.195
1000. 0.20
4000. 0.205
10000. 0.21
40000. 0.215
100000. 0.22
200000. 0.4
300000. 0.45
500000. 0.45
800000. 0.25
1000000. 0.23
4000000. 0.25
10000000. 0.27
20000000. 0.30
38000000. 0.34
'
' iprono cprpid npudsc strou
2 Strou_02 0 0.17
' -----------------------------------------------------------
PROPERTY ADDED MASS
' nadcur
2
' iprono cprpid nampt
1 Admas_01 12
' fhat addmco
0.0 -0.6
0.15 -0.6
0.16 -0.3

Master Thesis Feasibility Study of Selected Riser Concepts in Deep Water and Harsh Environment
Gilang Muhammad Gemilang 180
0.17 1.7
0.18 2.0
0.2 2.2
0.21 2.0
0.24 1.7
0.27 1.5
0.33 1.2
0.40 1.0
0.5 1.0
'
' iprono cprpid nampt
2 Admas_02 10
' fhat addmco
0.0 -0.4
0.16 -0.2
0.17 1.5
0.18 2.0
0.2 2.2
0.21 2.0
0.24 1.7
0.27 1.5
0.33 1.2
0.5 1.2
' -----------------------------------------------------------
PROPERTY LIFT COEFFICIENT
' nlccur
1
' iprono cprpid nlcpt
1 Test_211 26
' fhat acl0 aclmax clmax cla0
0.120 0.149 0.100 0.10 0.000
0.125 0.266 0.200 0.10 0.000
0.127 0.400 0.214 0.10 0.016
0.130 0.451 0.235 0.10 0.040
0.135 0.505 0.270 0.10 0.080
0.140 0.530 0.350 0.14 0.110
0.150 0.588 0.450 0.20 0.180
0.160 0.658 0.500 0.35 0.240
0.165 0.746 0.500 0.50 0.300
0.168 0.890 0.460 0.78 0.350
0.172 0.900 0.430 0.80 0.400
0.175 0.837 0.400 0.70 0.200
0.180 0.761 0.400 0.40 0.100
0.185 0.706 0.400 0.30 0.000

Master Thesis Feasibility Study of Selected Riser Concepts in Deep Water and Harsh Environment
Gilang Muhammad Gemilang 181
0.190 0.666 0.400 0.20 0.000
0.200 0.615 0.380 0.10 0.000
0.210 0.592 0.350 0.10 0.000
0.220 0.575 0.313 0.10 0.000
0.230 0.539 0.275 0.10 0.000
0.240 0.504 0.238 0.10 0.000
0.250 0.420 0.200 0.10 0.000
0.270 0.312 0.160 0.10 0.000
0.280 0.247 0.140 0.10 0.000
0.290 0.186 0.120 0.10 0.000
0.300 0.160 0.100 0.10 0.000
0.310 0.136 0.090 0.10 0.000
' -----------------------------------------------------------
RESPONSE ANALYSIS PARAMETERS
'
' reldam gives damping as fraction of critical damping
' reldam conlim max_iter iprint ilim iuddf
0.01 0.010 30 1 2
'
' idomfrq
' 2
' 1
' -----------------------------------------------------------
VIVRESPONSE FATIGUE DAMAGE
' nsect npcs ioppr
0 4 0
' dscfa dscfy dscfz asi wsti
1.2 1.2 1.2 0.0305 0.00355
'
' nosl limind fatlim rfact
1 0 0.0 .000001
' rmi1 rci1
3.0 11.764
' -----------------------------------------------------------
VIVANA RESULT PRINT
' iprelf iprstf iprdrg iprrsp iprcng
0 0 0 0 0
'------------------------------------------------------------
'
END

Master Thesis Feasibility Study of Selected Riser Concepts in Deep Water and Harsh Environment
Gilang Muhammad Gemilang 182
Appendix D - Fatigue Results
D.1 Wave Induced Fatigue
This section gives details of the fatigue results from wave induced fatigue analysis. The
fatigue life of critical location where worst fatigue damage occurred is summarized in table
for 12 wave direction. The detail fatigue result is presented for D-curve and C2-curve.
SCR Critical Location Curve-D Curve-C2 SCR Critical Location Curve-D Curve-C2
Below flex joint 405 years 692 years Below flex joint 1353 years 2968 years
TDP 61 years 120 years TDP 174 years 367 years
WDSCR Critical Location Curve-D Curve-C2 WDSCR Critical Location Curve-D Curve-C2
Below flex joint 551 years 998 years Below flex joint 1595 years 3686 years
TDP 180 years 376 years TDP 632 years 1621 years
SLWR Critical Location Curve-D Curve-C2 SLWR Critical Location Curve-D Curve-C2
Below flex joint 1676 years 3645 years Below flex joint 2074 years 4790 years
Sag Bend >10000 years >10000 years Sag Bend >10000 years >10000 years
Hog Bend >10000 years >10000 years Hog Bend >10000 years >10000 years
TDP 554 years 1022 years TDP 4390 years 10531 years
SCR Critical Location Curve-D Curve-C2 SCR Critical Location Curve-D Curve-C2
Below flex joint 859 years 1654 years Below flex joint 371 years 668 years
TDP 130 years 267 years TDP 64 years 126 years
WDSCR Critical Location Curve-D Curve-C2 WDSCR Critical Location Curve-D Curve-C2
Below flex joint 990 years 1931 years Below flex joint 442 years 789 years
TDP 442 years 997 years TDP 194 years 407 years
SLWR Critical Location Curve-D Curve-C2 SLWR Critical Location Curve-D Curve-C2
Below flex joint 1279 years 2622 years Below flex joint 657 years 1235 years
Sag Bend >10000 years >10000 years Sag Bend >10000 years >10000 years
Hog Bend >10000 years >10000 years Hog Bend >10000 years >10000 years
TDP 2914 years 5905 years TDP 728 years 1337 years
SCR Critical Location Curve-D Curve-C2 SCR Critical Location Curve-D Curve-C2
Below flex joint 186 years 305 years Below flex joint 158 years 263 years
TDP 28 years 39 years TDP 21 years 30 years
WDSCR Critical Location Curve-D Curve-C2 WDSCR Critical Location Curve-D Curve-C2
Below flex joint 199 years 334 years Below flex joint 158 years 269 years
TDP 82 years 122 years TDP 65 years 93 years
SLWR Critical Location Curve-D Curve-C2 SLWR Critical Location Curve-D Curve-C2
Below flex joint 445 years 806 years Below flex joint 309 years 557 years
Sag Bend >10000 years >10000 years Sag Bend >10000 years >10000 years
Hog Bend 4168 years 8728 years Hog Bend 2800 years 6002 years
TDP 249 years 436 years TDP 218 years 380 years
Wave Heading 0 Wave Heading 30
Wave Heading 60 Wave Heading 90
Wave Heading 120 Wave Heading 150

Master Thesis Feasibility Study of Selected Riser Concepts in Deep Water and Harsh Environment
Gilang Muhammad Gemilang 183
SCR Critical Location Curve-D Curve-C2 SCR Critical Location Curve-D Curve-C2
Below flex joint 180 years 301 years Below flex joint 299 years 517 years
TDP 40 years 76 years TDP 59 years 115 years
WDSCR Critical Location Curve-D Curve-C2 WDSCR Critical Location Curve-D Curve-C2
Below flex joint 198 years 341 years Below flex joint 350 years 622 years
TDP 113 years 230 years TDP 178 years 375 years
SLWR Critical Location Curve-D Curve-C2 SLWR Critical Location Curve-D Curve-C2
Below flex joint 306 years 543 years Below flex joint 508 years 948 years
Sag Bend >10000 years >10000 years Sag Bend >10000 years >10000 years
Hog Bend 7355 years >10000 years Hog Bend >10000 years >10000 years
TDP 408 years 733 years TDP 636 years 1183 years
SCR Critical Location Curve-D Curve-C2 SCR Critical Location Curve-D Curve-C2
Below flex joint 450 years 796 years Below flex joint 515 years 917 years
TDP 77 years 154 years TDP 88 years 173 years
WDSCR Critical Location Curve-D Curve-C2 WDSCR Critical Location Curve-D Curve-C2
Below flex joint 568 years 1001 years Below flex joint 672 years 1236 years
TDP 242 years 523 years TDP 284 years 614 years
SLWR Critical Location Curve-D Curve-C2 SLWR Critical Location Curve-D Curve-C2
Below flex joint 836 years 1606 years Below flex joint 1081 years 2104 years
Sag Bend >10000 years >10000 years Sag Bend >10000 years >10000 years
Hog Bend >10000 years >10000 years Hog Bend >10000 years >10000 years
TDP 895 years 1707 years TDP 994 years 1885 years
SCR Critical Location Curve-D Curve-C2 SCR Critical Location Curve-D Curve-C2
Below flex joint 593 years 1056 years Below flex joint 561 years 984 years
TDP 77 years 151 years TDP 67 years 135 years
WDSCR Critical Location Curve-D Curve-C2 WDSCR Critical Location Curve-D Curve-C2
Below flex joint 828 years 1526 years Below flex joint 790 years 1415 years
TDP 236 years 517 years TDP 206 years 441 years
SLWR Critical Location Curve-D Curve-C2 SLWR Critical Location Curve-D Curve-C2
Below flex joint 2316 years 4921 years Below flex joint 2521 years 5406 years
Sag Bend >10000 years >10000 years Sag Bend >10000 years >10000 years
Hog Bend >10000 years >10000 years Hog Bend >10000 years >10000 years
TDP 734 years 1363 years TDP 601 years 1103 years
Wave Heading 300 Wave Heading 330
Wave Heading 180 Wave Heading 210
Wave Heading 240 Wave Heading 270

Master Thesis Feasibility Study of Selected Riser Concepts in Deep Water and Harsh Environment
Gilang Muhammad Gemilang 184
D.2 Fatigue due to VIV
This section gives details of the raw fatigue results from VIV analysis; in-plane current and
out-of-plane current.
-0.002
0
0.002
0.004
0.006
0.008
0.01
0.012
0.014
0.016
0.018
0 500 1000 1500 2000 2500 3000
Fati
gue
Dam
age
(1
/yea
r)
Arc length (m)
Raw Fatigue Damage for In-Plane Current D-curve
Current1
Current2
Current3
Current4
Current5
Current6
Current7
Current8
Current9
Current10
Current11
Current12
Current13
Current14
-0.01
0
0.01
0.02
0.03
0.04
0.05
0.06
0 500 1000 1500 2000 2500 3000
Fati
gue
Dam
age
(1
/yea
r)
Arc length (m)
Raw Fatigue Damage for Out-of-Plane Current D-curve
Current1
Current2
Current3
Current4
Current5
Current6
Current7
Current8
Current9
Current10
Current11
Current12
Current13
Current14

Master Thesis Feasibility Study of Selected Riser Concepts in Deep Water and Harsh Environment
Gilang Muhammad Gemilang 185
-0.002
0
0.002
0.004
0.006
0.008
0.01
0.012
0.014
0 500 1000 1500 2000 2500 3000
Fati
gue
Dam
age
(1
/yea
r)
Arc length (m)
Raw Fatigue Damage for In-Plane Current C2-curve
Current1
Current2
Current3
Current4
Current5
Current6
Current7
Current8
Current9
Current10
Current11
Current12
Current13
Current14
-0.005
0
0.005
0.01
0.015
0.02
0.025
0.03
0.035
0.04
0.045
0 500 1000 1500 2000 2500 3000
Fati
gue
Dam
age
(1
/yea
r)
Arc length (m)
Raw Fatigue Damage for Out-of-Plane Current C2-curve
Current1
Current2
Current3
Current4
Current5
Current6
Current7
Current8
Current9
Current10
Current11
Current12
Current13
Current14