1. Reduce your ECM Costs by 90% Thibaut Mallet Channel Manager.
Upload
thibaut-grancherCategory
view
84download
2
THE ECONOMIC CONSEQUENCES OF TERRORISM
THIBAUT GRANCHER

MOTIVATIONS
Finding a subject tying defence and security issues to the economy
A topical topic after the last tragic events
Very few litterature on the subject
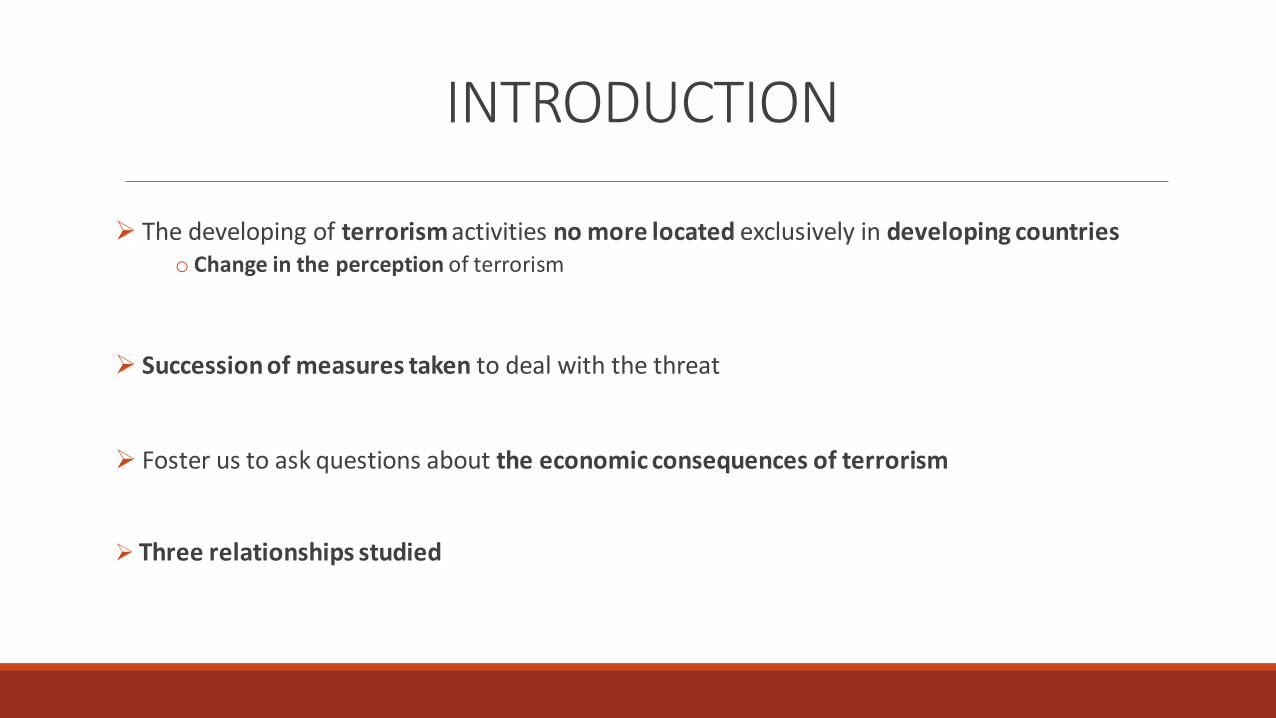
INTRODUCTION
The developing of terrorism activities no more located exclusively in developing countrieso Change in the perception of terrorism
Succession of measures taken to deal with the threat
Foster us to ask questions about the economic consequences of terrorism
Three relationships studied

PLAN
INTRODUCTION
LITTERATURE REVIEW
MEASURES OF THE IMPACT OF TERRORISM
EMPIRICAL METHOD
EMPRICICAL RESULTS
0 - Descriptive statistics
1 - Impact of terrorism on consumption
2 - Impact of terrorism on tourism industry
3 - Military expenditures in response to attacks
CONCLUSION

Who are the terrorists?
No universal definition but two generally used :
o The US Department of State in 1983 : “premeditated, politically motivated violence perpetrated against non-combatant targets by subnational groups or clandestine agents, usually intended to influence an audience”
o Current definition according to the US Code : “involve violent acts or acts dangerous to human life that violate federal or state law; appear to be intended to intimidate or coerce a civilian population; to influence the policy of a government by intimidation or coercion; or to affect the conduct of a government by mass destruction, assassination, or kidnapping”
Krueger (2008) oTerrorists are generally issued from richer families and better educated than those at the
same age in their origin country.
LITTERATURE REVIEW

Why do they attack us?
Popular explanations from political leaders or experts :
o Hate our way of life; lack of education; the illiteracy
To avenge against foreign interventions
Religious reasons

What are the economic consequences?
LITTLE EFFECT
Horwich (2000) Comparison with natural disasters (Kobe earthquake of 1995)
Becker and Murphy (2001), Krueger (2001)
Little impact on physical and human capitals, and strong capacity of adaptation of businesses and people
Karolyi and Martell (2005) Impact very localised on the company (uncertainty on stock values)
BIG EFFECT
Abadie and Gardeazabal (2001) Negative impact on the GDP per capita (Basque region / Spain)
Bloom (2009) Uncertainty on the financial market with a high volatility
Clark and Stancanelli (2016) Effect on the well-being (gender gap)
CRISIS MANAGEMENT EFFECT
Lenain et al. (2001)Depend of measures taken by the governments (confidence, financial system etc.)Bigger effects on specific industries

MEASURES OF THE IMPACT OF TERRORISM Data selection :
o 5 countries : France, Belgium, Spain, the United Kingdom, the United States
o Data from 2001 to 2015
o All our data come from the Global Terrorism Database (GTD), the Organisation for Economic Co-operation and Development (OECD), the World Development Indicator (WDI), World Travel & Tourism Council (WTTC).
oThree levels of measurement :LEVELS OF MEASUREMENT DEPENDENT VARIABLES
The consumption expendituresThe household spending (OECD)
The consumer confidence index (OECD)
The tourism industry
Total contribution of travel and tourism on GDP (World Travel & Tourism Council [WTTC])
The number of international tourist arrivals (WDI)
The number of resident tourists departures to international destinations (WDI)
The military expenditures
The military expenditures in percentage of GDP (WDI)
The consumer confidence index (OECD)
The number of international tourist arrivals (WDI)
The number of resident tourists departures to international destinations (WDI)
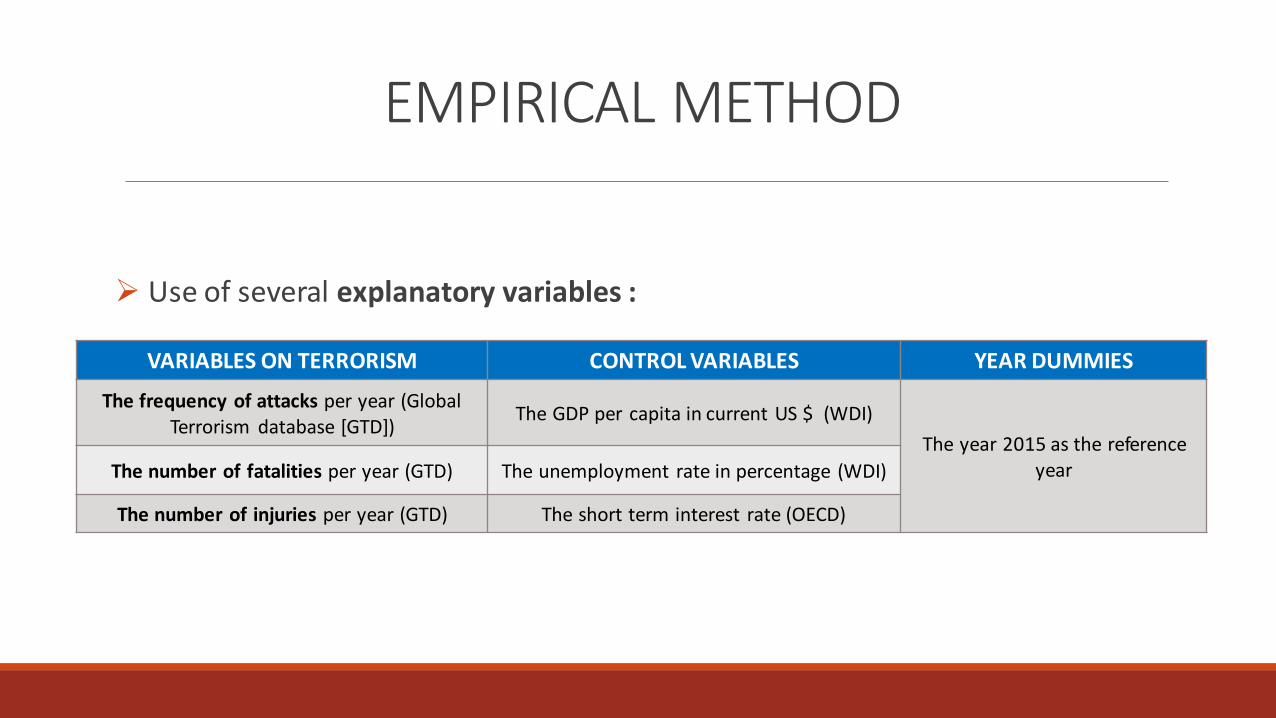
EMPIRICAL METHOD
Use of several explanatory variables :
VARIABLES ON TERRORISM CONTROL VARIABLES YEAR DUMMIES
The frequency of attacks per year (Global Terrorism database [GTD])
The GDP per capita in current US $ (WDI)
The year 2015 as the reference yearThe number of fatalities per year (GTD) The unemployment rate in percentage (WDI)
The number of injuries per year (GTD) The short term interest rate (OECD)
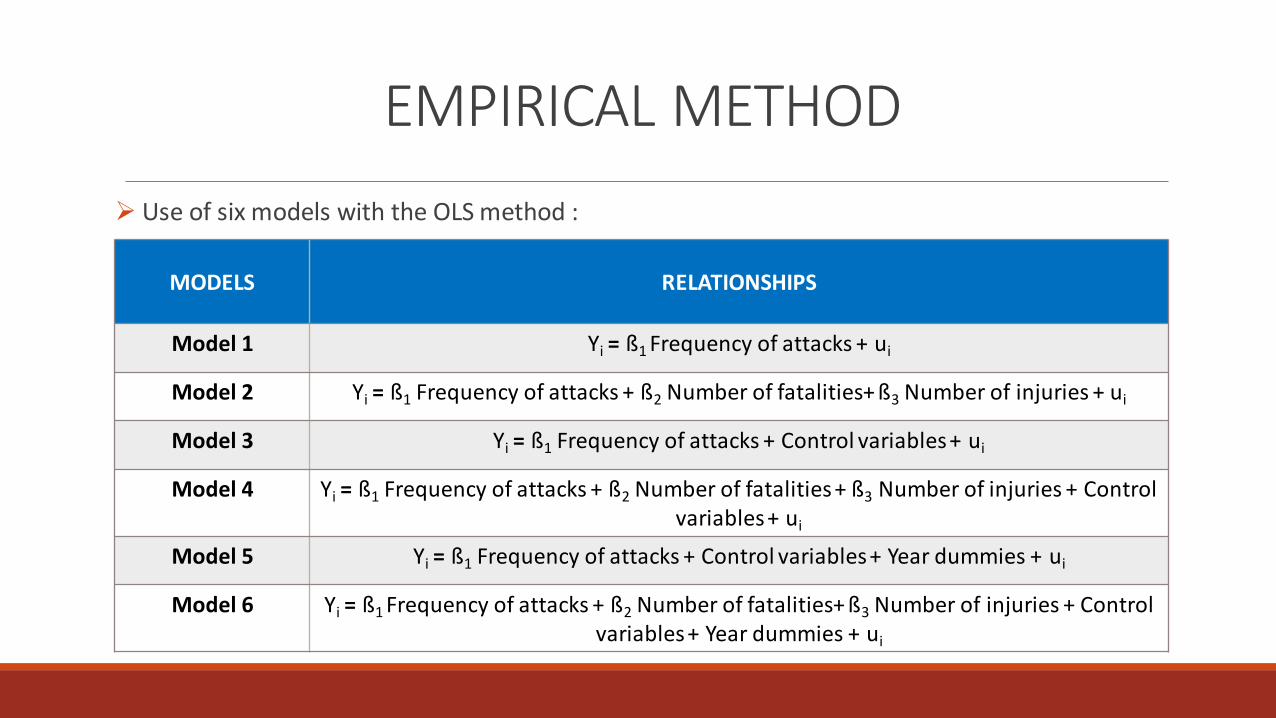
EMPIRICAL METHOD
Use of six models with the OLS method :
MODELS RELATIONSHIPS
Model 1 Yi = ß1 Frequency of attacks + ui
Model 2 Yi = ß1 Frequency of attacks + ß2 Number of fatalities+ ß3 Number of injuries + ui
Model 3 Yi = ß1 Frequency of attacks + Control variables + ui
Model 4 Yi = ß1 Frequency of attacks + ß2 Number of fatalities + ß3 Number of injuries + Control variables + ui
Model 5 Yi = ß1 Frequency of attacks + Control variables + Year dummies + ui
Model 6 Yi = ß1 Frequency of attacks + ß2 Number of fatalities+ ß3 Number of injuries + Control variables + Year dummies + ui

EMPIRICAL RESULTS0 - Descriptive statistics
0
10
20
30
40
50
60
70
2001 2002 2003 2004 2005 2006 2007 2008 2009 2010 2011 2012 2013 2014 2015
Figure 1Frequency of terrorist attacks per year
France
USA
UK
Spain
Belgium

Frequency of
attacks
Number of
fatilities
Number of
injuries
Household
spending
Consumer
confidence
Tourism contribution
to GDP
International
tourist arrivals
Resident tourist
departures
Military
expenditures
Frequency of attacks 1.0000
Number of fatilities 0.2175 1.0000
Number of injuries 0.1942 0.1037 1.0000
Household spending 0.1895 0.0847 0.2120 1.0000
Consumer confidence 0.0495 0.0654 0.1065 0.6584* 1.0000
Tourism contribution to GDP 0.2917* -0.0431 0.2364* 0.0542 0.0102 1.0000
International tourist arrivals 0.3481* 0.0493 0.0746 0.0232 -0.3127* 0.5092* 1.0000
Resident tourist departures 0.1193 0.1156 -0.1308 0.1203 -0.1315 -0.1692 0.3461* 1.0000
Military expenditures 0.1517 0.0865 -0.0512 0.1594 -0.2801* -0.2035 0.5159* 0.7816* 1.0000
legend : * p<.05
Correlation between terrorism variables and the dependant variables
Figure 4

1 - Impact of terrorism on consumptionHousehold expenditures
H1 H2 H3 H4 H5 H6
Frequency of attacks 0,083*** 0,075*** 0,035** 0,029* 0,031** 0,029**
Number of fatalities 0,000 -0,000 -0,000
Number of injuries 0,002 0,002* 0,001
GDP per capita in US$ 0,000*** 0,000*** 0,000** 0,000**
Unemployment in total % of labour
force-0,125*** -0,131*** -0,114*** -0,112***
ST interest rates per annum 0,369*** 0,352*** 0,293* 0,273*
year==2002 0,576 0,396
year==2003 0,614 0,410
year==2004 1,376* 0,894
year==2005 0,822 0,481
year==2006 0,222 0,007
year==2007 -0,043 -0,252
year==2008 -2,488*** -2,711***
year==2009 -2,689*** -2,984***
year==2010 0,359 0,059
year==2011 -0,854 -1,160
year==2012 -1,291 -1,579
year==2013 -0,692 -1,060
year==2014 0,278 -0,045
o._Iyear_2015 Ref Ref
Number of observations 74 74 70 70 70 70
Adjusted R2 0,261 0,268 0,553 0,564 0,755 0,754
note: *** p<0.01, ** p<0.05, * p<0.1
Table 4 Household expenditures in terms of annual growth rates

Consumer confidence
C1 C2 C3 C4 C5 C6
Frequency of attacks 4,411*** 4,363*** 0,311*** 0,300** 0,268*** 0,273***
Number of fatalities -0,009 -0,002 0,001
Number of injuries 0,021 0,005 -0,002
GDP per capita in US$ 0,002*** 0,002*** 0,001*** 0,001***
Unemployment in total % of
labour force2,071*** 2,041*** 1,525*** 1,517***
ST interest rates per annum 5,871*** 5,829*** 8,828*** 8,889***
year==2002 17,082*** 17,774***
year==2003 22,512*** 23,281***
year==2004 21,228*** 22,788***
year==2005 14,024** 15,196**
year==2006 4,866 5,675
year==2007 -4,573 -3,780
year==2008 -6,792 -5,947
year==2009 20,319*** 21,389***
year==2010 23,101*** 24,193***
year==2011 19,064** 20,170**
year==2012 16,880** 17,966**
year==2013 19,698** 21,015**
year==2014 21,142** 22,327**
o._Iyear_2015 (dropped) (dropped)
Number of observations 75 75 70 70 70 70
Adjusted R2 0,411 0,398 0,987 0,987 0,993 0,992
note: *** p<0.01, ** p<0.05, * p<0.1
Table 5 Consumer confidence, in long-term average with 100 as basis and the amplitude adjusted

2 - Impact of terrorism on tourism industryTourism state
T1 T2 T3 T4 T5 T6
Frequency of attacks 0,498*** 0,488*** 0,121*** 0,120*** 0,105*** 0,104***
Number of fatalities -0,002 -0,001 -0,000
Number of injuries 0,005 0,002* 0,001
Domestic tourism spending in billion
US$-0,006 -0,004 -0,007* -0,007
Foreign tourism spending in billion
US$0,033 0,027 0,062*** 0,060***
GDP per capita in US$ 0,000 0,000 -0,000*** -0,000***
Unemployment in total % of labour
force0,552*** 0,560*** 0,367*** 0,375***
ST interest rates per annum 1,122*** 1,113*** 2,486*** 2,456***
year==2002 4,136*** 3,939***
year==2003 5,887*** 5,650***
year==2004 6,327*** 5,906***
year==2005 4,844*** 4,520***
year==2006 3,300** 3,080*
year==2007 1,118 0,925
year==2008 1,276 1,065
year==2009 8,637*** 8,299***
year==2010 9,091*** 8,747***
year==2011 8,985*** 8,652***
year==2012 8,389*** 8,038***
year==2013 10,001*** 9,595***
year==2014 10,687*** 10,317***
o._Iyear_2015 (dropped) (dropped)
Number of observations 75 75 70 70 70 70
Adjusted R2 0,461 0,460 0,952 0,953 0,964 0,963
note: *** p<0.01, ** p<0.05, * p<0.1
Table 6 Tourism contribution to GDP
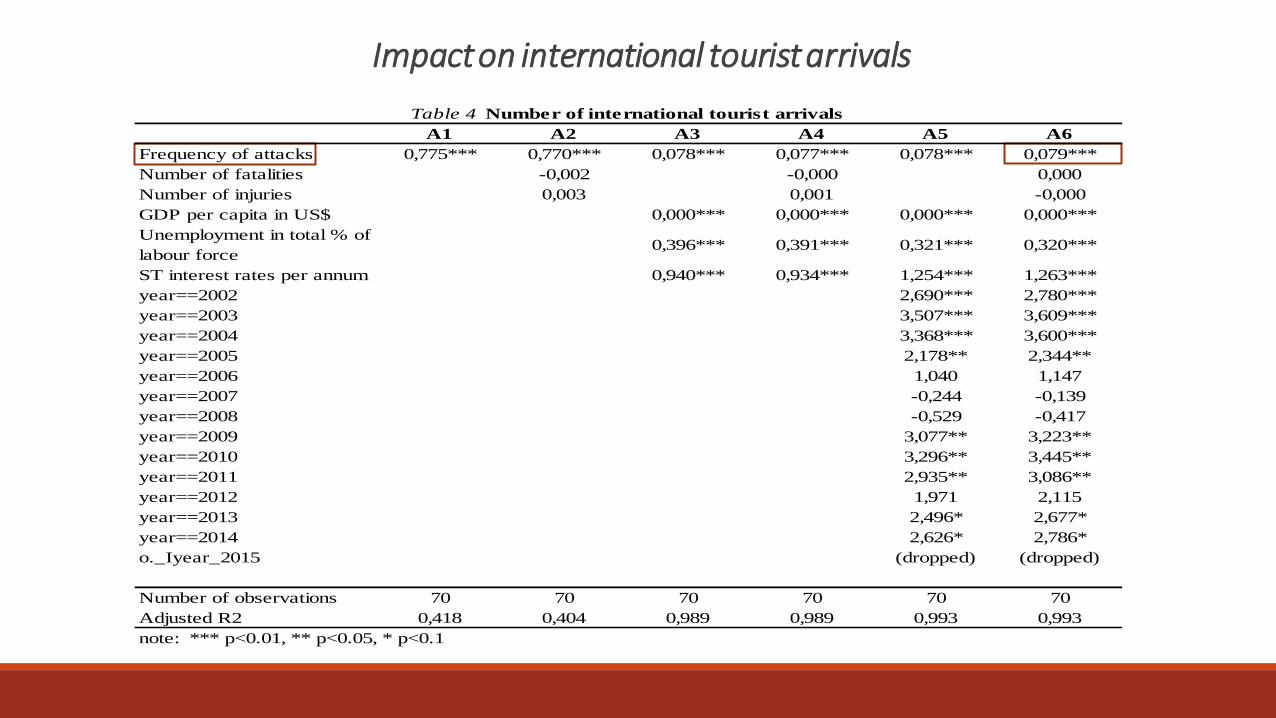
Impact on international touristarrivals
A1 A2 A3 A4 A5 A6
Frequency of attacks 0,775*** 0,770*** 0,078*** 0,077*** 0,078*** 0,079***
Number of fatalities -0,002 -0,000 0,000
Number of injuries 0,003 0,001 -0,000
GDP per capita in US$ 0,000*** 0,000*** 0,000*** 0,000***
Unemployment in total % of
labour force0,396*** 0,391*** 0,321*** 0,320***
ST interest rates per annum 0,940*** 0,934*** 1,254*** 1,263***
year==2002 2,690*** 2,780***
year==2003 3,507*** 3,609***
year==2004 3,368*** 3,600***
year==2005 2,178** 2,344**
year==2006 1,040 1,147
year==2007 -0,244 -0,139
year==2008 -0,529 -0,417
year==2009 3,077** 3,223**
year==2010 3,296** 3,445**
year==2011 2,935** 3,086**
year==2012 1,971 2,115
year==2013 2,496* 2,677*
year==2014 2,626* 2,786*
o._Iyear_2015 (dropped) (dropped)
Number of observations 70 70 70 70 70 70
Adjusted R2 0,418 0,404 0,989 0,989 0,993 0,993
note: *** p<0.01, ** p<0.05, * p<0.1
Table 4 Number of international tourist arrivals

Impact on residenttouristdepartures
D1 D2 D3 D4 D5 D6
Frequency of attacks 0,747*** 0,742*** 0,058*** 0,057*** 0,051*** 0,054***
Number of fatalities -0,001 -0,000 0,000
Number of injuries 0,003 0,000 -0,001
GDP per capita in US$ 0,000*** 0,000*** 0,000*** 0,000***
Unemployment in total % of
labour force0,259*** 0,257*** 0,165*** 0,163***
ST interest rates per annum 0,877*** 0,874*** 1,423*** 1,444***
year==2002 2,539*** 2,751***
year==2003 3,519*** 3,758***
year==2004 3,307*** 3,851***
year==2005 2,221*** 2,611***
year==2006 0,653 0,905
year==2007 -0,889 -0,643
year==2008 -0,927 -0,666
year==2009 3,699*** 4,041***
year==2010 4,020*** 4,368***
year==2011 3,451*** 3,806***
year==2012 3,043*** 3,380***
year==2013 3,449*** 3,875***
year==2014 3,523*** 3,891***
o._Iyear_2015 (dropped) (dropped)
Number of observations 69 69 69 69 69 69
Adjusted R2 0,410 0,395 0,990 0,990 0,995 0,994
note: *** p<0.01, ** p<0.05, * p<0.1
Table 8 Number of resident tourist departures

3 - Military expenditures in response to attacksImpact on militaryexpenditures
M1 M2 M3 M4 M5 M6
Frequency of attacks 0,105*** 0,104*** 0,013 0,013 0,014* 0,016*
Number of fatalities -0,000 0,000 -0,000
Number of injuries 0,000 -0,000 -0,000
GDP per capita in US$ 0,000*** 0,000*** 0,000*** 0,000***
Unemployment in total % of
labour force-0,055*** -0,054*** -0,014 -0,011
ST interest rates per annum -0,005 -0,005 -0,261*** -0,265***
year==2002 -0,556 -0,735
year==2003 -0,728 -0,913*
year==2004 -0,793 -0,934*
year==2005 -0,975** -1,156**
year==2006 -0,972** -1,168**
year==2007 -0,866* -1,060*
year==2008 -0,966* -1,174**
year==2009 -1,536** -1,757***
year==2010 -1,746*** -1,975***
year==2011 -1,782*** -2,007***
year==2012 -2,285*** -2,549***
year==2013 -2,561*** -2,815***
year==2014 -2,762*** -3,022***
o._Iyear_2015 (dropped) (dropped)
Number of observations 75 75 70 70 70 70
Adjusted R2 0,397 0,380 0,898 0,895 0,908 0,907
note: *** p<0.01, ** p<0.05, * p<0.1
Table 9 Military expenditures in percentage of GDP
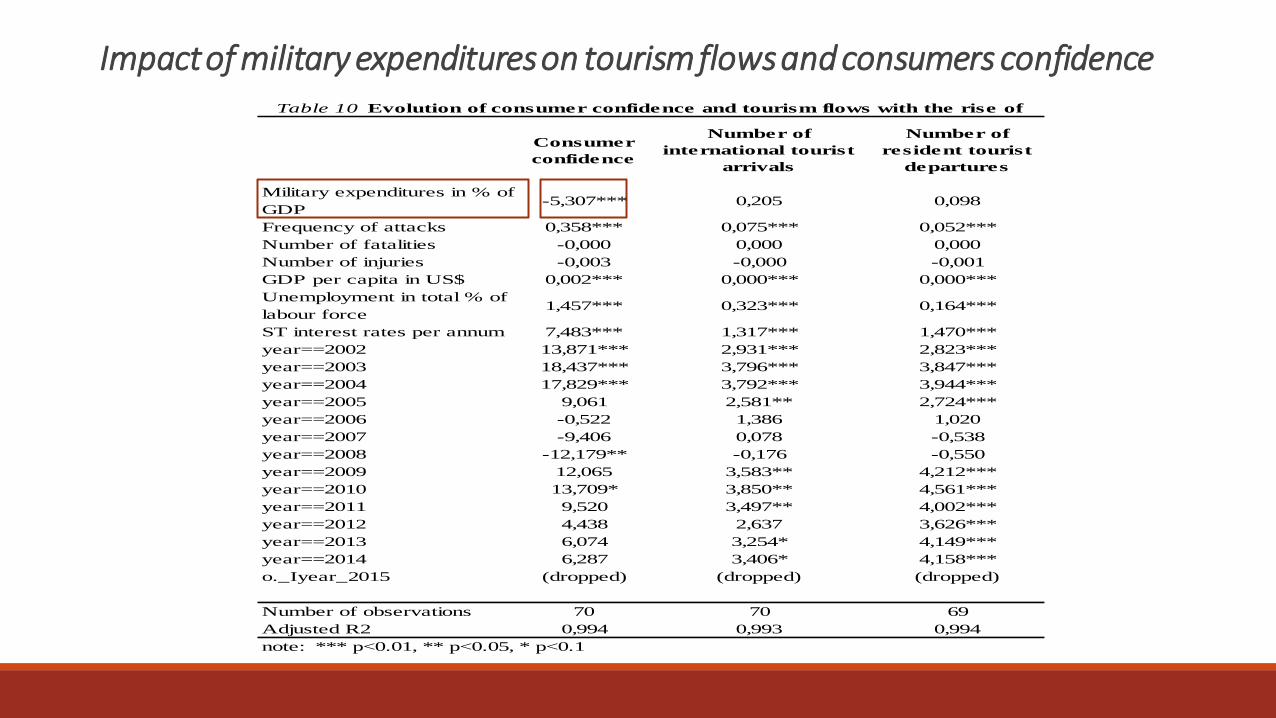
Impact of military expenditureson tourismflowsand consumers confidence
Consumer
confidence
Number of
international tourist
arrivals
Number of
resident tourist
departures
Military expenditures in % of
GDP-5,307*** 0,205 0,098
Frequency of attacks 0,358*** 0,075*** 0,052***
Number of fatalities -0,000 0,000 0,000
Number of injuries -0,003 -0,000 -0,001
GDP per capita in US$ 0,002*** 0,000*** 0,000***
Unemployment in total % of
labour force1,457*** 0,323*** 0,164***
ST interest rates per annum 7,483*** 1,317*** 1,470***
year==2002 13,871*** 2,931*** 2,823***
year==2003 18,437*** 3,796*** 3,847***
year==2004 17,829*** 3,792*** 3,944***
year==2005 9,061 2,581** 2,724***
year==2006 -0,522 1,386 1,020
year==2007 -9,406 0,078 -0,538
year==2008 -12,179** -0,176 -0,550
year==2009 12,065 3,583** 4,212***
year==2010 13,709* 3,850** 4,561***
year==2011 9,520 3,497** 4,002***
year==2012 4,438 2,637 3,626***
year==2013 6,074 3,254* 4,149***
year==2014 6,287 3,406* 4,158***
o._Iyear_2015 (dropped) (dropped) (dropped)
Number of observations 70 70 69
Adjusted R2 0,994 0,993 0,994
note: *** p<0.01, ** p<0.05, * p<0.1
Table 10 Evolution of consumer confidence and tourism flows with the rise of

CONCLUSION
Positive effect between the frequency of terrorist attacks and :o The household spending
o The consumer confidence
o The tourism flows
o The military expenditures
Non significance of the number of dead or injured people
=> Psychological impact and importance of measures taken by the governments
Negative relationship between military expenditures and the consumer confidence
=> Necessity to review the actual response to terrorism? Are Vigipirate and Sentinelle plans really efficient?

REFERENCES
Abadie, Alberto and Gardeazabal, Javier (2001), “The Economic Costs of Conflict: A Case Study of the Basque Country”, NBER Working Paper, N° 8478, NBER Publishing.
Abadie, Alberto and Gardeazabal, Javier (2008), “Terrorism and the World Economy”, European Economic Review, vol. 52, pages 1-27.
Barro, Robert and Lee, Jong-Wha (2000), “International Data on Educational Attainment Updates and Implications”, NBER Working paper, N° 7911, NBER Publishing.
Becker, Gary and Rubinstein, Yona (2011), “Fear and the Response to Terrorism: An Economic Analysis”, CEP Discussion Paper, N° 1079, Centre for Economic Performance andLondon School of Economics and Political Science Publishing.
Bloom, Nicholas (2009), “The Impact of Uncertainty Shocks”, NBER Working Paper, N° 13385, NBER Publishing.
Chernick, Howard, (2005), Resilient City: The Economic Impact of 9/11, Russel Sage Foundation.
Clark, Andrew and Stancanelli, Elena (2016), “Individual Well-Being and the Allocation of Time Before and After the Boston Marathon Terrorist Bombing”, PSE Working paper,N° 2016 – 07, Paris School of Economics Publishing.
Egger, Roman and Maurer, Christian (2016), ISCONTOUR 2016 Tourism Research Perspectives, Books on Demand.
Hines, James and Jaramillo, Christian (2004), “The Impact of Large Natural Disasters on National Economies”, Mimeo, The University of Michigan Publishing.
Horwich, George (2000), “Economic Lessons of the Kobe Earthquake”, Economic Development and Cultural Change, vol. 48, pages 521 – 42, The University of Chicago Press.
Karolyi, Georges Andrew and Martell, Rodolfo (2005), “Terrorism and the Stock Market”, Charles A. Dice Center for Research in Financial Economics Working Paper, N° 2005 –19, Charles A. Dice Center for Research in Financial Economics Publishing.
Krueger, Alan, (2008), What Makes a Terrorist: Economic and the Root of Terrorism, Princeton University Press.
Lenain, Patrick; Bonturi, Marcos and Koen, Vincent (2001), “The economic consequences of terrorism”, Economics Department Working Paper, N° 334, OECD Publishing.