
Master Thesis Gustav Claesson - DiVA portal429509/FULLTEXT01.pdf · valuation process is...
78
Firm valuation Which model gives me the most accurate share price, the Dividend Discount Model or the Free Cash Flow to Equity model? “What is a cynic? A man who know the price of everything and the value of nothing” – [Oscar Wilde, 1892] Master Thesis in Finance Author: Gustav Claesson Tutors: Johan Eklund Andreas Högberg Jönköping June 2011
Transcript of Master Thesis Gustav Claesson - DiVA portal429509/FULLTEXT01.pdf · valuation process is...

Firm valuation Which model gives me the most accurate share price, the Dividend
Discount Model or the Free Cash Flow to Equity model? “What is a cynic? A man who know the price of everything and the value of nothing” – [Oscar Wilde, 1892]
Master Thesis in Finance
Author: Gustav Claesson
Tutors: Johan Eklund
Andreas Högberg
Jönköping June 2011

i
Acknowledgements I would hereby like to acknowledge the following persons for their help and guidance along the way: My tutors Johan Eklund and Andreas Högberg who have encouraged me for a deeper understanding for the subject, while at the same time providing valuable feedback during this whole process. My opponents that have been giving me support and valuable critique during the seminars we have had. Finally, I would like to acknowledge a special thank to my family and friends for their support and patience. Jönköping, 2011-06-01 ___________________________ Gustav Claesson
ii
Master Thesis in Finance Title Firm Valuation
Authors Gustav Claesson
Tutors Johan Eklund and Andreas Högberg
Date 2011-06-01
Subject terms Stock valuation, future growth prospects, and valuation models
Abstract
Purpose:
The purpose of this thesis is to investigate the applicability of the Free Cash Flow to Equity Model and the Dividend Discount Model on ten large cap firms on the Stockholm Stock Exchange. Moreover the author intends to examine whether these valuation methods differs in regards of the companies’ operational segment, business cycle and turnover. The target prices will hereafter be benchmarked with actual closing prices and professional analysts to observe similarities and deviations.
Method:
The focus lies on Swedish companies listed on Nasdaq OMX Stockholm’s Large Cap list. The companies are valued by collecting financial information from 2006-2010 in order to find out what the share price in the beginning of 2011 should be. The models that are used to value the share are the Dividend Discount Model, which basically discounts actual dividends in order to find the present value of the share, and the Free Cash Flow to Equity model, which is discounting the firms’ cash flow available to its stockholders, i.e. the potential dividends. Since both of the valuation models require assumptions on future growth to be made, a combination of calculations and goals presented by the companies has been made in order to assume growth rates.
Findings:
The findings reveal that out of the twenty valuations that were made half of the most accurate ones came from the Dividend Discount Model, and half came from the Free Cash Flow to Equity model. It was however the Dividend Discount Model that provided the most accurate share prices, in comparison to the actual share prices from January 2011. It is also concluded that the turnover of the firm being evaluated does not have an impact on the valuation process, whilst the industry in which the firm operates as well as its payout ratio are factors that need to be taken into consideration when choosing between the Dividend Discount Model and the Free Cash Flow to Equity model.

iii
Abbreviations and explanations
Market Capitalization – The market value of a company’s equity, share price times the number of shares outstanding ROE – The Return on Equity FCFE – The Free Cash Flow to Equity DDM – The Dividend Discount Model DCF – Discounted Cash Flow SCB – Swedish Statistical Service P/E ratio – Price-to-earnings ratio Large Cap – Stockholm Stock Exchange’s list of companies with a market capitalization of over one billion euros Due Diligence – A process whereby an individual, or an organization, seeks sufficient information about a business entity to reach an informed judgement as to its value for a specific purpose Intrinsic Value – The fundamental value, or the present value of all future cash flows DPS – Dividends per Share EPS – Earnings per Share GDP – Gross domestic product GWP – Gross world product PV – Present Value CAPM – Capital Asset Pricing Model

iv

v
Table of Contents 1 INTRODUCTION ......................................................................................................... 1
1.1 BACKGROUND INFORMATION ......................................................................................... 1 1.2 PROBLEM DISCUSSION ...................................................................................................... 3 1.3 PURPOSE .......................................................................................................................... 5 1.4 DELIMITATIONS ............................................................................................................... 5 1.5 OUTLINE OF THE THESIS .................................................................................................. 5
2 METHODOLOGY ......................................................................................................... 6 2.1 METHOD APPROACHES .................................................................................................... 6
2.1.1 Inductive vs. Deductive .................................................................................................... 6 2.1.2 Quantitative vs. Qualitative ............................................................................................. 7
2.2 THE CASE STUDY ............................................................................................................. 8 2.3 COLLECTION OF THE DATA ............................................................................................. 8 2.4 LIMITATIONS .................................................................................................................... 8
3 THEORETICAL FRAMEWORK .................................................................................. 9 3.1 OUTLINE OF THE THEORETICAL FRAMEWORK ................................................................ 9 3.2 MOTIVES FOR VALUATION ............................................................................................... 9
3.2.1 Who Values Stocks? ................................................................................................... 10 3.3 RELATED CONCEPTS ...................................................................................................... 11
3.3.1 The Concept of Value .................................................................................................. 11 3.3.2 Due Diligence ............................................................................................................. 11 3.3.3 Capital Market Efficiency ............................................................................................. 12 3.3.4 Capital structure and firm value ...................................................................................... 13
3.4 FINANCIAL MODELS & VALUATION .............................................................................. 13 3.4.1 Dividend Discount Model .............................................................................................. 13 3.4.2 Free Cash Flow to Equity ............................................................................................. 17 3.4.3 Related concepts and formulas connected with DDM & FCFE ............................................ 19
3.5 THE COMPANIES ............................................................................................................ 22 3.6 PREVIOUS RESEARCH ..................................................................................................... 23 3.7 ASSUMPTIONS PRIOR TO EMPIRICAL FINDINGS & ANALYSIS ......................................... 23
4 EMPIRICAL FINDINGS & ANALYSIS ..................................................................... 25 4.1 FUTURE GROWTH ASSUMPTIONS ................................................................................... 25 4.2 ABB (INDUSTRIAL GOODS & SERVICES – LARGE CAP) ................................................... 25
4.2.1 Financials & Assumptions ........................................................................................... 26 4.2.2 The Gordon Growth Model ........................................................................................... 26 4.2.3 Constant Growth FCFE Model ..................................................................................... 26 4.2.4 Summary Analysis ...................................................................................................... 26
4.3 ASSA ABLOY (INDUSTRIAL GOODS & SERVICES – LARGE CAP) ..................................... 27 4.3.1 Financials & Assumptions ........................................................................................... 27 4.3.2 The Gordon Growth Model ........................................................................................... 28 4.3.3 Constant Growth FCFE Model ..................................................................................... 28 4.3.4 Summary Analysis ...................................................................................................... 28
4.4 ASTRAZENECA (HEALTH SERVICE – LARGE CAP) .......................................................... 29 4.4.1 Financials & Assumptions ........................................................................................... 29 4.4.2 Two-stage Dividend Discount Model ............................................................................... 30 4.4.3 Two-stage FCFE Model ............................................................................................... 30 4.4.4 Summary Analysis ...................................................................................................... 30
4.5 ATLAS COPCO (INDUSTRIAL GOODS & SERVICES – LARGE CAP) .................................... 31 4.5.1 Financials & Assumptions ........................................................................................... 31
vi
4.5.2 Two-stage Dividend Discount Model ............................................................................... 32 4.5.3 Two-stage FCFE Model ............................................................................................... 32 4.5.4 Summary Analysis ...................................................................................................... 32
4.6 AXFOOD (FAST MOVING CONSUMER GOODS – LARGE CAP) .......................................... 33 4.6.1 Financial & Assumptions ............................................................................................ 33 4.6.2 Two-stage Dividend Discount Model ............................................................................... 34 4.6.3 Two-stage FCFE Model ............................................................................................... 34 4.6.4 Summary Analysis ...................................................................................................... 35
4.7 GETINGE (HEALTH SERVICE – LARGE CAP) .................................................................. 35 4.7.1 Financials & Assumptions ........................................................................................... 35 4.7.2 Two-stage Dividend Discount Model ............................................................................... 36 4.7.3 Two-stage FCFE Model ............................................................................................... 36 4.7.4 Summary Analysis ...................................................................................................... 36
4.8 MEDA (HEALTH SERVICE – LARGE CAP) ........................................................................ 37 4.8.1 Financials & Assumptions ........................................................................................... 37 4.8.2 The Gordon Growth Model ........................................................................................... 38 4.8.3 Constant Growth FCFE Model ..................................................................................... 38 4.8.4 Summary Analysis ...................................................................................................... 38
4.9 NCC (INDUSTRIAL GOODS & SERVICES – LARGE CAP) .................................................. 39 4.9.1 Financials & Assumptions ........................................................................................... 39 4.9.2 Two-stage Dividend Discount Model ............................................................................... 40 4.9.3 Two-stage FCFE Model ............................................................................................... 40 4.9.4 Summary Analysis ...................................................................................................... 40
4.10 ORIFLAME (FAST MOVING CONSUMER GOODS – LARGE CAP) ..................................... 41 4.10.1 Financials & Assumptions ......................................................................................... 41 4.10.2 Two-stage Dividend Discount Model .............................................................................. 41 4.10.3 Two-stage FCFE Model ............................................................................................. 42 4.10.4 Summary Analysis .................................................................................................... 42
4.11 SWEDISH MATCH (FAST MOVING CONSUMER GOODS – LARGE CAP) ........................... 42 4.11.1 Financials & Assumptions ......................................................................................... 43 4.11.2 Two-stage Dividend Discount Model .............................................................................. 43 4.11.3 Two-stage FCFE Model ............................................................................................. 44 4.11.4 Summary Analysis .................................................................................................... 44
4.12 SUMMARIZING THE ANALYSES ..................................................................................... 44
5 CONCLUSION ............................................................................................................ 49 5.1 CONCLUSIONS IN RELATION TO THE PURPOSE .............................................................. 49 5.2 IMPLICATIONS AND SUGGESTIONS FOR FUTURE STUDIES .............................................. 50
6 REFERENCES ............................................................................................................ 51
APPENDICES ................................................................................................................... 57 APPENDIX 1 ............................................................................................................................ 57 APPENDIX 2 ............................................................................................................................ 57 APPENDIX 3 ............................................................................................................................ 57 APPENDIX 4 ............................................................................................................................ 58 APPENDIX 5 ............................................................................................................................ 58 APPENDIX 6 ............................................................................................................................ 59 APPENDIX 7 ............................................................................................................................ 59 APPENDIX 8 ............................................................................................................................ 60 APPENDIX 9 ............................................................................................................................ 61 APPENDIX 10 .......................................................................................................................... 61

vii
APPENDIX 11 .......................................................................................................................... 61 APPENDIX 12 .......................................................................................................................... 62 APPENDIX 13 .......................................................................................................................... 62 APPENDIX 14 .......................................................................................................................... 63 APPENDIX 15 .......................................................................................................................... 63 APPENDIX 16 .......................................................................................................................... 63 APPENDIX 17 .......................................................................................................................... 64 APPENDIX 18 .......................................................................................................................... 65 APPENDIX 19 .......................................................................................................................... 65 APPENDIX 20 .......................................................................................................................... 65 APPENDIX 21 .......................................................................................................................... 66 APPENDIX 22 .......................................................................................................................... 66 APPENDIX 23 .......................................................................................................................... 66 APPENDIX 24 .......................................................................................................................... 67 APPENDIX 25 .......................................................................................................................... 67 APPENDIX 26 .......................................................................................................................... 68 APPENDIX 27 .......................................................................................................................... 69 APPENDIX 28 .......................................................................................................................... 69 APPENDIX 29 .......................................................................................................................... 69 APPENDIX 30 .......................................................................................................................... 70
1
1 Introduction
In the introductory chapter is a background given to the thesis. It provides information about the stock market and why it has become such a popular topic in recent years, the importance of correct valuation is highlighted. A problem discussion and the purpose of the thesis are also included. An outline of the thesis and its limitations finishes the Introduction part.
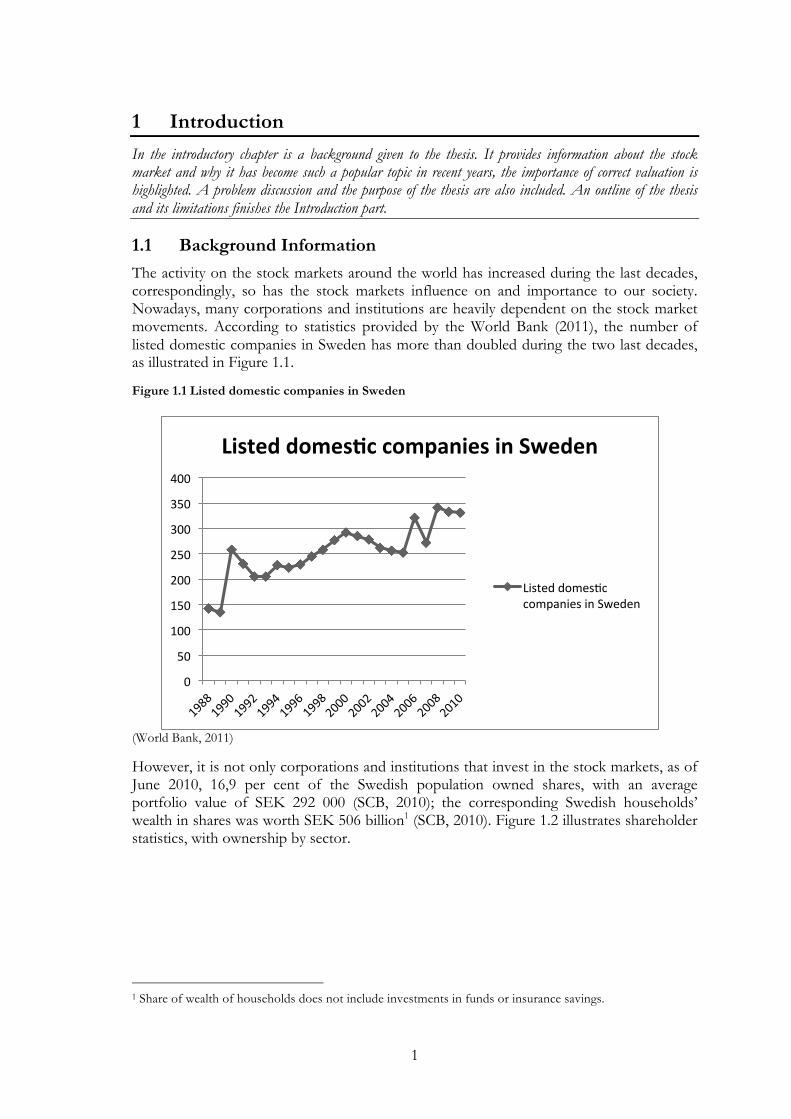
1.1 Background Information The activity on the stock markets around the world has increased during the last decades, correspondingly, so has the stock markets influence on and importance to our society. Nowadays, many corporations and institutions are heavily dependent on the stock market movements. According to statistics provided by the World Bank (2011), the number of listed domestic companies in Sweden has more than doubled during the two last decades, as illustrated in Figure 1.1.
Figure 1.1 Listed domestic companies in Sweden
(World Bank, 2011)
However, it is not only corporations and institutions that invest in the stock markets, as of June 2010, 16,9 per cent of the Swedish population owned shares, with an average portfolio value of SEK 292 000 (SCB, 2010); the corresponding Swedish households’ wealth in shares was worth SEK 506 billion1 (SCB, 2010). Figure 1.2 illustrates shareholder statistics, with ownership by sector.
1 Share of wealth of households does not include investments in funds or insurance savings.
0
50
100
150
200
250
300
350
400
Listed domes2c companies in Sweden
Listed domes5c companies in Sweden

2
Figure 1.2 Shareholder statistics, June 2010 [Ownership by sector (SCB, 2010)]
In order for the stock market to function properly, there has to exist a confidence amongst the investors in techniques for valuing a publicly traded stock. It is crucial to know the true value of a stock before deciding whether to sell it or buy it. Often there are uncertainties related to the valuation process, not only from the specific asset being valued, but also related to the valuation model in particular. With too much uncertainty, actors in the stock market would not be able to arrive at conclusions on what price to buy or sell an asset and bad decisions, leading to bad investments, would be made.
A postulate of healthy investing is that an investor does not pay more for an asset than it is worth, which has to be backed up by reality, i.e. the price paid for any asset should be reflected by the future cash flow it is expected to create. (Damodaran, 2002)
In order to manage a portfolio, consisting of investments that are held long term, the valuation process is fundamental were firm-specific analyses are made. Scott Hoover, the author of Stock Valuation – An Essential Guide to Wall Street’s Most Popular Valuation Models (2006), claims that individuals most often are better off investing in an index fund rather than trying to pick stocks themselves. One way for a passive investor, such as regular people investing in stocks for the long run, pension funds or bonds, is to rely on professional stock (fundamental) analysts. A fundamental stock analysis most often concerns its financial characteristics, such as growth forecasts, risk profiles, and cash flows. Financial analysts play a crucial role in today’s society, either as investment bankers whose goal is to match companies with investors or as equity researchers making assessments of the true value of companies allowing them to make recommendations both to public and private investors. (Hoover, 2006)
Some analysts’ use discounted cash flow models in the valuation process, while others use different financial multiples (e.g. P/E ratio) in order to find out if a stock is under- or overvalued. (Damodaran, 2002)
When looking at different analysts’ results of specific firm valuations, the value often differs. If looking at the target price recommendations for Swedbank AB made by four

3
different investment banks/equity research firms, it is clearly demonstrated how different they can be.
As shown in the table below, the differences in the target prices are resulting in a substantial difference in the market value of Swedbank.
Table 1.1 Price target of Swedbank in accordance with four analytical firms
Investment Bank
Target price (SEK) Date Market
Capitalization Deutsche Bank 126 9Feb2011 119,992,753,314
Goldman, Sachs & Co 108 9Feb2011 102,850,931,412
UBS 112 9Feb2011 106,660,225,168
Nomura Equity 130 9Feb2011 123,802,047,070
www.di.se - Stockwatch, retrieved 2011-02-16
How come that the firm value ends up being so different from each other? One can assume that these analysts were influenced by the same kind of information, publicly available that is. The different target price could however derive from the analysts’ different perceptions of the future, resulting in different forecasts hence the different target prices. It could also be the case that the firms have used different models with different inputs, leading to dissimilar target prices.
How can one know which of these values that is the most accurate? Which one is reliable enough to make me invest in the Swedbank stock? Basically, it is not possible to tell that and this is one of the difficulties involved in the process of firm valuation since assumptions often had to be made.
Brett Arends, a journalist on The Wall Street Journal, recently published an article about this particular “trust-issue”. He looked at the 10 stocks that Wall Street analysts rated most highly a year ago to see how it actually turned out. He found that the 10 highest rated stocks had a 24 per cent return, which is good. However, the 10 least preferred stocks by the same analysts had a 32 per cent return, which is better. After his findings, Arends decided to look back one year before that, on 2009. His results from 2009 were even more interesting, the 10 most preferred stocks had a 22 per cent return, while the 10 least preferred had an incredible 70 per cent return.
As proven by Arends, the analysts have to find a way to improve their forecasts in order to win the publics trust yet again. Perhaps the problem lies within their different valuation methods, using different inputs results in different prices.
1.2 Problem discussion As introduced in the background, there are several ways to value a firm. It exists numerous ways of coping with the process of obtaining a firm value, different models and methods including a wide range of inputs. The result of this is that depending on whom and which method he or she uses, the resulting firm value will vary. To investigate all different approaches to the firm valuation process would demand extremely large quantities of information, which would be both difficult and time consuming to analyse, leading to results harder to interpret.
4
The underlying idea behind this thesis is that the payoff achieved from evaluate every firm with each and every available model would not be worth the extra time and effort needed for finding and evaluating all necessary information, why this thesis will use two of the major models, the Dividend Discount Model and the Free Cash Flow to Equity Model, hence only focusing on financial information that are used as inputs in the models. Both these models are built on information that often is easily accessible from for instance annual and sustainability reports.
The Free Cash Flow to Equity (FCFE) model is the most used fundamental method in firm valuation (Perrakis, 1999). This method is designed to incorporate different types of information we hold about a company, like its future prospects. The basic of the FCFE method is that you forecast internal cash flows and then discount them in order to determine the value of the company today. (Hoover, 2006)
Consequently, one of the problems discussed in this thesis is: What are the different forms of the FCFE model and what are their weaknesses and limitations?
The FCFE method is an internal, absolute valuation model. Its goal is to establish what the stock is worth rather than whether it is better or worse than other stocks. It examines the operational activities and cash flows of the company rather than simply examine the cash flows that are paid directly from the company to investors (Hoover, 2006). It is designed to facilitate a decision-making situation, its purpose is to help decision makers reach optimal decisions.
The Dividend Discount Model (DDM) deals with the firm value, or the stock value equivalently, a little bit different compared to the FCFE methods. The basic idea of the model is that the stock value of a company is the present value of future external cash flows, discounted at a rate in line with the riskiness of the expected cash flows discounted. The inputs used in the DDM, the basic inputs, are expected dividends and the cost of equity. Since the cost of equity, or the required rate of return, on the stock is calculated by using for example the capital asset pricing model (CAPM) the assumptions built into the model is on the expected dividends (numerator in the equation) which is obtained by making several assumptions about future pay-out ratios and expected growth rates in earnings. (Damodaran, 2002)
Although the goals of both models are alike, their inputs and course of action differs. This creates the basis for the next problem: How to decide which model to use?
A study will be made on ten companies listed on the Nasdaq OMX Stockholm. The companies are picked based on their different financial attributes; the selection will lead to variations when it comes to size, establishment, age and industry. A series of calculations will be made on each company for a certain period of time in order to establish a current market value (stock price) of their shares. The aim of the case study is to compare the stock prices that the two models result in. The results will then be analysed in order to see if there are any patterns present, there might be companies that are more suitable for the DDM (or vice versa). The findings will further be compared to the shares actual market price and to what analysts’ believe their target prices to be.
If an improved understanding of the models is made and if one could learn when to use which one of them, the models would perhaps be more accurate and user-friendly, and furthermore, it would be an applicable way for people to analyse companies and their stock-prices, perhaps leading to better and more profitable investments.
5
Answers to these questions, at least an attempt to answer them, will be accomplished by conducting, (1) a literature study of related academic theories and previous studies on the DDM and the FCFE method, and (2) a case study where the suitable theoretical findings will be applied on a group of case companies.
1 How will the results differ when calculating stock prices for firms when using DDM compared to FCFE and what does the possible differences tell us?
2 Is there a specific payout ratio where the DDM works better than FCFE? 3 Does the result vary with different models for different firm sizes and their properties? 4 Which results are closest to actual the market values?
1.3 Purpose The purpose of this thesis is to investigate the applicability of the Free Cash Flow to Equity Model and the Dividend Discount Model on ten large cap firms on the Stockholm Stock Exchange. Moreover the author intends to examine whether these valuation methods differs in regards of the companies’ operational segment, business cycle and turnover. The target prices will hereafter be benchmarked with actual closing prices and professional analysts to observe similarities and deviations.
1.4 Delimitations A delimitation with this thesis is that the study will not make use of the three-stage models for the examination, which can be used for both the Free Cash Flow to Equity Model and the Dividend Discount Model.
1.5 Outline of the thesis The first chapter of the thesis has presented a brief introduction to the importance of correct share valuations, and how small differences in share prices can result in major differences in a firm’s total value. The chapter ends with a problem presentation as well as an idea of the purpose of the thesis.
The second chapter, Methodology, gives the reader an idea behind the choice of research method, data collection and literature search. The chapter ends with an explanation of the case study that will form the basis of the empirical findings. The purpose of Chapter 2 is to give the thesis reliability and validity.
The third chapter is the Theoretical framework, which explains the models and concepts associated with the valuation process. This chapter is based on a literature study.
The forth chapter presents a combination of empirical results and an analysis of them, this chapter is based on theories and concepts explained in Chapter 3.
The fifth and last chapter of this thesis consists of conclusions drawn from the analysis in accordance with the problem discussion and purpose of the thesis.
6
2 Methodology This chapter includes statements that will give the reader an insight to how the research area was approached, why it was conducted in this way, how the work progressed, and finally, the author’s own critical opinions of the study. The goal with this is to give the reader a chance to acquire a personal perception concerning the dependability of the study. The reader should also be able to decide whether, in his or her opinion, the study has been conducted properly. This chapter ends with information regarding the literature that have been used and an introduction to the case study.
2.1 Method Approaches The approach to the research problem is a fundamental process of the study, before the study begins it is therefore important to consider the direction of thought. This section of the thesis includes a brief description of the inductive and deductive approach, qualitative and quantitative approach, which, ultimately, ends up with a description of how the approach of this thesis was developed. Easterby-Smith et al. (2008) argue that if you possess enough knowledge about the different research approaches it enables you to adapt the design of your research in order to be able to confront constraints, such as limited access to data or lack of prior knowledge of the subject. (Saunders et al, 2009)
2.1.1 Inductive vs. Deductive
When writing a thesis or any other research papers there are essentially two approaches to regard, either the deductive approach or the inductive approach. The deductive reasoning, or the “hypothetico-deductive method” as it is sometimes referred to, is a “theory comes first” approach. Hypotheses and/or theoretical propositions are generated before the actual research process takes place. They are then adapted and modified by the empirical research. This is often characterized as moving from the general to the particular (Mason, 2002). Holme & Solvang (1997) describes the process as a coherent system of claims, which derives new hypotheses. These deduced hypotheses can then examine means of empirical investigation. The empirical studies can then either strengthen or weaken the belief of the theory. The deductive approach can be seen as a rigorous test, often ending up with cyclical verification techniques (Saunders et al, 2009).
The inductive reasoning on the other hand is more of a “theory comes last” view, in a process which can be seen as moving from the particular to the general, where the researcher develops theoretical propositions or explanations based on a set of collected data. This approach is most commonly associated with “grounded theorizing” (Glaser & Strauss, 1967), where theory is reflected by the data analysis, using what Glaser & Strauss call the “constant comparative method” (Mason, 2002). The inductive approach is more suitable for small samples, as compared to the deductive approach that better copes with larger samples. As opposed to deductive reasoning, this is a theory building process and it is more suitable for qualitative data than it is for quantitative data (Saunders et al, 2009).
It is in an analytical way possible to distinguish between these two approaches, just as described in the previous parts, however, it is in the contradiction or combination of the approaches that new and exciting information and knowledge develops (Holme & Solvang, 1997). It is often the case that a combination of deduction and induction within the same research project is advantageous (Saunders et al, 2009). This combination is often referred to as the abductive research method. Whilst induction relates to empiricism and deduction to theory, the abductive method relates to empirical data but does not fully reject the theoretical pre-positions. The abductive research process is thus an alternation between

7
theory and empiricism, which are constantly reinterpreted in the light of each other (Alvesson & Sköldberg, 2008).
According to the aim and purpose of this thesis, the research approach of it has features of both the deductive and inductive approach. At the same time as the previous knowledge possessed by the author and the theoretical framework has been accommodating, the actual salvage and analytical part of the data has itself helped facilitate a more hands-on comprehension of the theories. The DDM and FCFE models and their different forms and components has been used to examine the batch of companies in the case study in order to find whether there are any characteristics of the companies that drive the way one should apply the valuation model(s) and to establish, in some sense, an idea of how the financial analysts go about when valuing shares. Since both models include many different steps and theories, it could very well be the case that not all of them are relevant, at least not in every case and company. That awareness was obtained while assessing existing theories and applying them to the different scenarios. With that in mind, the abductive research approach where most appropriate and therefore adopted in this thesis.
2.1.2 Quantitative vs. Qualitative
When writing a thesis or conducting other studies it is most likely linked to numerical data or data of other any form that, if quantified, will help the author to answer the research question and the purpose of the work. Quantitative data therefore refers to all such data; it can be anything from simple calculations such as the occurrence of an event to more multifaceted data such as test scores, dividend yield or return on equity. However, this kind of data, in its raw form, unanalysed and unprocessed, does not reveal that much to most people. Hence, it is crucial to analyse and process your quantitative data using different quantitative analysis techniques. It exists many different such techniques, one could for example create diagrams and tables or using statistics in order to demonstrate relationships between the variables. (Saunders et al, 2009)
The qualitative data is on the other hand non-numerical data or data that have not been enumerated. Such data could be for example responses from open-ended questions2 to more complex such as transcripts of in-depth interviews. In order for you to draw any conclusions or build theories from your qualitative data it has to be analysed. In some sense, qualitative analysis is constantly pending between data collection and analysis (Svenning, 2003). The qualitative analysis methods, including both deductive and inductive approaches, vary from simple categorisation of interview-responses to the process of identifying relationships between categories. (Saunders et al, 2009)
The following table further distinguishes the differences between qualitative and quantitative data.
Table 2.1 – Qualitative vs. Quantitative Data
Qualitative Data Quantitative Data
Based on meanings expressed through words
Based on meanings derived from numbers
Collection of results in non-standardised data requiring classification into categories
Collection of results in numerical and standardised data
2 Typically begins with the word “Why” or “How”, or the phrase “Tell me about.”

8
Analysis which is conducted through the use of conceptualisation
Analysis conducted through the use of diagrams and statistics
Source: Dey (1993); Healey and Rawlinson (1994), cited in Saunders et al (2009)
There is however nothing that states that a research project cannot make use of both quantitative and qualitative techniques. The choice to use them both is gradually encouraged within business and management research. The general term for this is mixed methods approach and that is the approach of which this thesis is adopting (Saunders et al, 2009). First, the literature study will be performed in order to find possible weaknesses and limitations of the valuation models and to examine different possible forms of the models.
2.2 The Case Study The study that is conducted in this thesis is performed in order for the author to illustrate the different values that derive from the choice of which valuation model to use, and it takes the form of a quantitative case study. The study will consist of 10 companies currently listed on the Nasdaq OMX Stockholm, who are valued in accordance with what professionals and prior author’s recommend. The companies are picked based on their financial attributes, with size, business cycle and turnover as the main attributes. The idea is that the results of the study will highlight the importance of the valuation model-selection one has to consider before analysing a company and its stock. It is important to highlight that the firm-values that will be derived from the case study should not be perceived as recommendations or target prices for the 10 companies.
2.3 Collection of the Data All primary data that has been collected throughout the process of this thesis comes either directly from reports published by the case companies or from databases specialized on financial information. In some cases the collected data have been in need of adjustments in order for it to match with the inputs of the model. It is on this aspect that I have found it to be an advantage of writing this thesis on my own, since I have been able to keep a consistent way of modifying in order for it to properly fit the valuation models.
2.4 Limitations The main constraint when writing a thesis is the limited amount of time you are given, why some necessary limitations are vital for the quality of the thesis to maintain high throughout the whole process. In the case of this thesis, only two models are used for the valuations, this means that the literature study that provides the basis of the Theoretical Framework is limited. The companies selected for the study are all Swedish companies, listed as Large Cap on Nasdaq OMX Stockholm. The reason for only picking Large Cap companies is that the valuation models used are dependent on substantial dividends payouts, and since not all Small Cap companies even pay dividends they are excluded from this thesis. Another important delimitation is that the assumptions made on the future growth rates are mainly based on my own calculations, and only to some extent based on information provided by the companies themselves. Further timesaving delimitations made are that only ten companies will be analysed and in the case of shares with different voting rights, the shares valued are basically the most traded ones. When it comes to the risk-free rate and market risk premium that are incorporated in the Capital Asset Pricing Model used to calculate the cost of equity for the companies they are both assumed to be the same for each and every company, meaning that no adjustments are made due to the companies different features.

9
3 Theoretical framework In this section of the thesis incentives for valuation are presented as well as basic concepts and theories associated with a company’s value. The section also includes a thorough explanation of the valuation models and their various forms used in the thesis. The theoretical framework ends with a short financial presentation of the case companies are given in combination with an assumption strategy for the Empirical Findings & Analysis section.
3.1 Outline of the Theoretical Framework This section begins with a discussion and definitions on related concepts that will be needed in order to implement the analysis. The following part will cover different financial models applicable to firm valuation. It narrows down the perspective by focusing on the DDM and FCFE methods in particular. This step will explain the basics of both the DDM and the FCFE model and highlight some of their inadequacies when it comes to firm valuation.
The intention of this first theoretical part of the literature study is to give the reader an insight into the process of valuation, highlighting important concepts and definitions from a broad perspective. It then narrows down to the valuation models and their forecasting implications.
Next part of the theoretical frameworks will discuss some relevant, and in the firm valuation aspect relatively undeveloped related academic theories around firm valuation. These theories are relevant since they are part of the discussions mentioned in the previous steps, and it could be useful to analyse them in order to examine different approaches and perhaps improvements to the process of firm valuation. This part will furthermore cover some non-financial aspect of the valuation process, which in most cases are just as important in the decision-making.
In the next step a more comprehensive explanation is given to the valuation process when applying the valuation models. The models and their various versions explained in this part are the ones that are going to be applied on the case study as the thesis progresses. The formulas for the two valuation models are general versions, why the reference has been left out.
The final part of the theoretical framework will consist of an analysis based on the theories discussed and developed in the previous steps. This analysis will be the founding source for the final conclusions.
3.2 Motives for Valuation A basic belief is that managers who put emphasis on creating value for shareholders will generate healthier companies than managers who do not. Healthier companies leads to healthier economies, more business and career opportunities or individuals, this leading to higher living standards (Copeland, et. al, 2000).
The Swedish professor, Sven-Eric Johansson, who was a supporter of the development of a theoretical foundation for how businesses should be valued had the opinion that one should treat every acquisition as an investment (Hult, 1998). A more theoretical definition of a company’s value based on this investment theory is the present value of future distributable earnings from the company. The future cash flows provide the limits of the company’s survival and future development. These cash flows, or dividends, are the

10
foundation for share value of the company. On the basis of this is the intention of an external stakeholder, such as a shareholder (or a prospective one), to form an opinion about the company’s ability to generate cash flow (Hult, 1998).
This cash flow can take the form of income, dividends paid by the company, or capital, which is realized by a sale of the shares (Barker, 2001).
3.2.1 Who Values Stocks?
As mentioned in the previous part, there are several categories of people with an interest of value stocks. Since these people are different they also have different reasons for undertaking stock valuations. Some of the motives can be the desire to form effective economic policies in order to better understand and manage companies, the potential to profit from trading with stocks, and the need to communicate correct yet simplified information to the public (Hoover, 2005). The following part will further explain why financial analysts, corporate managers, asset managers, economic policymakers or regular individuals would have an interest in the stock valuation process.
3.2.1.1 Financial Analysts
There are two kinds of financial analysts, investment bankers and equity researcher. As this section explains, whilst their techniques are somewhat similar their intentions with the valuation differs. The investment banker’s main role is to pair companies with potential investors; their goal is to help companies find ways to raise money for different projects. In this process, the investment banker does not only have to evaluate the company’s shares, but also try to convince the company that their valuation is justified. In other words, the investment banker’s goal is not to find a “true” stock value, but at what price the investment bank can sell the stock in order to raise the money needed. The equity researchers on the other hand have to follow and assess companies in order to find a true stock price of those companies. These assessments and the stock values are then used to make recommendations to both public and private investors. The recommendations can publicly take the form of buy/sell recommendations, or downgrades and upgrades of the stocks. (Hoover, 2005)
3.2.1.2 Corporate Managers
Managers both have an interest in valuing their own company and other, perhaps possible mergers or acquisitions, companies. To know the value of their own stock can be helpful for managers in order to properly raise money. If they, for instance, believe that their stock is currently overvalued in the market they can make money on selling some of their shares, if they on the other hand believe that their stock is currently undervalued in the market they normally would not want to issue more shares. The same reasons holds for knowing the value of other company’s stocks, if a manager thinks that a company’s stock presently is undervalued in the market, and plans on acquiring that company exists, now could be a good time to go through with the acquisition. (Hoover, 2005)
3.2.1.3 Asset Managers
An asset manager is someone who is hired by companies or individuals with the objective to invest their money. They invest this money in their own constructed portfolios, whose main goal is to outperform benchmark portfolios (typically the “market”) in the long run. It is evident that an asset manager who lacks the ability to find stocks that are misaligned in the market, for his portfolio, will in the long run not be able to outperform the market, thus lose current and potential customers. (Hoover, 2005)
11
3.2.1.4 Economic Policymakers
The objectives of policymakers in different economic institutions over the world are somewhat different to the ones previously mentioned. Their focus is usually not on specific companies and their stocks, but at the value of the whole stock market compared to its “true” value. By knowing if the stock market as a whole is currently over- or undervalued allows them to, for example, in a more accurate way evaluate the stability of the financial market, which forms a foundation in their interest rate policies. They could for example increase interest rates to slow down the market or contrary decrease interest rates to generate economic growth. (Hoover, 2005)
3.2.1.5 Individuals
In recent years, is has become more and more popular amongst individuals to invest in the stock market. In order for them to do so, an understanding of how the valuation process can be conducted is therefore crucial. Since this process can be, especially for non-professionals, both challenging and time-consuming, individuals are typically better off investing in an index fund, rather than trying to choose stocks themselves. (Hoover, 2005)
3.3 Related Concepts The goal of this part of the theoretical framework is to give the reader an idea of some related concepts to the valuation process one have to be aware of. This part is however not only associated with valuation, it serves as a basics for how the capital structure of a firm can be designed as well as the different forms of market efficiency.
3.3.1 The Concept of Value
As mentioned in the previous part, value can take the form as either dividends or by acquiring capital through share transactions. The value that stakeholders obtain is determined by future returns that the company is expected to get, as well as the risk that the returns deviates from those expected. Hence, it is not unusual that different parties have different perceptions of value. This difference often originates from different assessments regarding the plausibility of the forecast development in relation to what has historically been achieved by the company (Öhrlings PricewaterhouseCoopers, 2007).
3.3.2 Due Diligence
The authors, William M. Crilly and Andrew J. Sherman, of “The AMA Handbook of Due Diligence” (2010) defines due diligence as a process whereby an individual, or an organization, seeks sufficient information about a business entity to reach an informed judgement as to its value for a specific purpose.
A good example of an organization with the need of proper due diligence are consultant firms that often assists, either the buyer or the seller, in the case of an acquisition. The following part of the due diligence section consist of a brief explanation of the global consulting firm PriceWaterCoopers’s take on the due diligence process.
This process often affects the buyer’s view of the company and gives him or her a sense of what demands to give the seller in their negotiations. An analysis of this kind is often categorised in to the following areas:
• Commercial Analysis • Operational Analysis
12
• Financial Analysis • Tax Issues • Legal Issues • Environmental Issues
(Öhrlings PricewaterhouseCoopers, 2007)
This thesis is mainly focusing on the financial part of an acquisition (whether it is an entire company or a fraction of its shares), thus is the Financial Analysis the area of focus. The Financial Analysis normally includes an in-depth review of the company’s continuous level of profitability and cash flows (both historic and forecasts), an overview of customer and supplier dependency and an overview of the balance sheet (in order to identify any possible surplus or deficit). (Öhrlings PricewaterhouseCoopers, 2007)
In light of the fact that buyers are increasing the use of due diligence, the need for the sellers to prepare both themselves and their company for a pre-acquisition analysis has increased. This is a so called “sell-side due diligence”, through which the seller gains increased knowledge of the object up for acquisition and thereby get an advantage in the coming negotiations. (Öhrlings PricewaterhouseCoopers, 2007)
3.3.3 Capital Market Efficiency
If prices in a specific market, for example the Swedish stock market, are adjusting rapidly and correctly in accordance with new information available the market is said to be efficient. Hence, in an efficient capital market, such as the stock market, there is no reason to believe that the current stock prices are too high or too low, provided that all information is available. (Ross et al, 2008)
The next following part of this section of the thesis will provide a simple explanation to the different forms of market efficiency, forms that differ when it comes to what information is reflected in the stock prices.
3.3.3.1 Strong Form Efficiency
In the case of a strong form of market efficiency, all information, both public and private, is reflected in the stock prices. In recent years, the topic of inside information has been widely discussed. In this form of efficiency there is no such thing, as inside information, everyone knows everything that there is to know about the stock or company. Common sense tells us that this cannot always be the case; there are several situations when people do in fact hold private information or knowledge to themselves. This means that it may exist private (inside) information about a stock that is not currently reflected in its price. (Ross et al, 2008)
3.3.3.2 Semi-Strong Form Efficiency
The semi-strong efficiency differs from the strong form since only publicly available information is believed to reflect current stock prices. This form of efficiency suggest that there is no idea trying to analyse the price of a stock, or looking for mispriced stocks, since all public information already reflects the stock price. (Ross et al, 2008)
3.3.3.3 Weak Form Efficiency
The last of the three forms is the weak form efficiency, in which the stock prices are only reflected by historical prices of that stock. This means that if the market is weak form
13
efficient there is no gain in looking for mispriced stocks by studying past stock prices. (Ross et al, 2008)
3.3.4 Capital structure and firm value
Fundamental to the discussion on company valuation, the Miller-Modigliani theorem, which states that the value of a firm is independent of its capital structure, is essential to discuss when writing a thesis on firm valuation. That is, the level of debt, the split of debt into claims with different levels of collateral and different seniorities in the case of bankruptcy, dividend distribution policies, and many other characteristics or policies relative to the financial “pie” have no impact on the total firm value. This means that if a firm decides to do, an increase in total debt or a dividend distribution dilutes the debt-holder’s claim and benefits the shareholders, but the latter’s gain exactly offset the former’s loss. (Tirole, 2006)
In mathematical terms, where !! = operating assets, !!"# = tax shields, D = debt and E = equity, the correlation between the value of firm and its capital structure can be displayed in an equation as follows,
!! + !!"# = !"#!"#"$%! !"#$% = ! + !
(Koller et al, 2010)
3.4 Financial Models & Valuation It exists many different models on valuation and with them a lot of assumptions one have to make before putting them to use. This section will cover information about two specific models, the dividend discount model and the free cash flow to equity model, and their different areas of use. Important aspects concerning the models (growth rates, payout ratios, cost of equity etc.) are further discussed in order for the reader to get an idea of the reasoning behind the forthcoming firm valuations.
3.4.1 Dividend Discount Model
The Dividend Discount Model (DDM) is the simplest tool for valuing equity. Whilst some analysts view the DDM as out-dated and inadequate there are still a lot of companies where the DDM still is viewed as a convenient instrument for estimating value (Damodaran, 2002). The dividend discount model estimates the equity value based on the idea that the value of the equity equals all future dividends discounted back to today, using an appropriate cost of capital as discount rate. The cost of capital used in each calculation is reflecting the integrated risk in that particular cash flow (Frykman & Tolleryd, 2003).
Author Roberg G. Hagstrom describes, in his book “The Warren Buffett way” (2005), how one of the world’s greatest investors believes that the dividend discount model (created over sixty years ago by John Burr Williams) is the best system for determining the intrinsic value of a company.
3.4.1.1 The General Model
When an individual buys stock, there are two types of cash flows that he or she can expect to receive – namely the dividend that the stock will pay during the time it is owned and the expected price at which the stock can be sold. The general equation for stock value can be expressed as:
14
!"#$% !"# !ℎ!"# = !! =!(!"#!)(1+ !!)!
!!!
!!!
where !"#! = Expected dividends per share
!! = Cost of equity
In order to obtain the numerator, expected dividends per share, assumptions regarding future payout ratios and growth rates have to be made. The denominator, the cost of equity or required rate of return, is determined by its riskiness and is measured differently in different models (the market beta in capital asset pricing model (CAPM) and the factor betas in the arbitrage and multifactor models).
Since the model just presented cannot be applied on “real” dividend projections, due to the assumption of an infinite timeline, numerous varieties of the dividend discount model have been established which are constructed around different assumptions about future growth. (Damodaran, 2002)
3.4.1.2 Gordon Growth Model
The Gordon Growth Model is used mainly to value firms that are in stable growth with dividends growing at a rate that can be maintained for all eternity.
!! =!"#!!! − !
where !"#! = Expected dividends next year
!! = Cost of equity
! = Growth rate in dividends forever
Since the model assumes that the firm’s growth rate in dividends is expected to last forever, the term stable growth is widely discussed and questioned. One of the aspects of the Gordon growth model and its “stable growth” is that other performance measures, such as earnings, also can be projected to have the same annual growth rate as dividends. Hence, if a company’s earnings are growing faster than its dividend payout in the long run, the company’s payout ratio will slowly approach zero, and that is not a feature of a company in a steady state of growth. Furthermore, a firm in a “steady state” cannot have a growth rate that exceeds the growth rate of the economy in which the firm operates. (Damodaran, 2002)
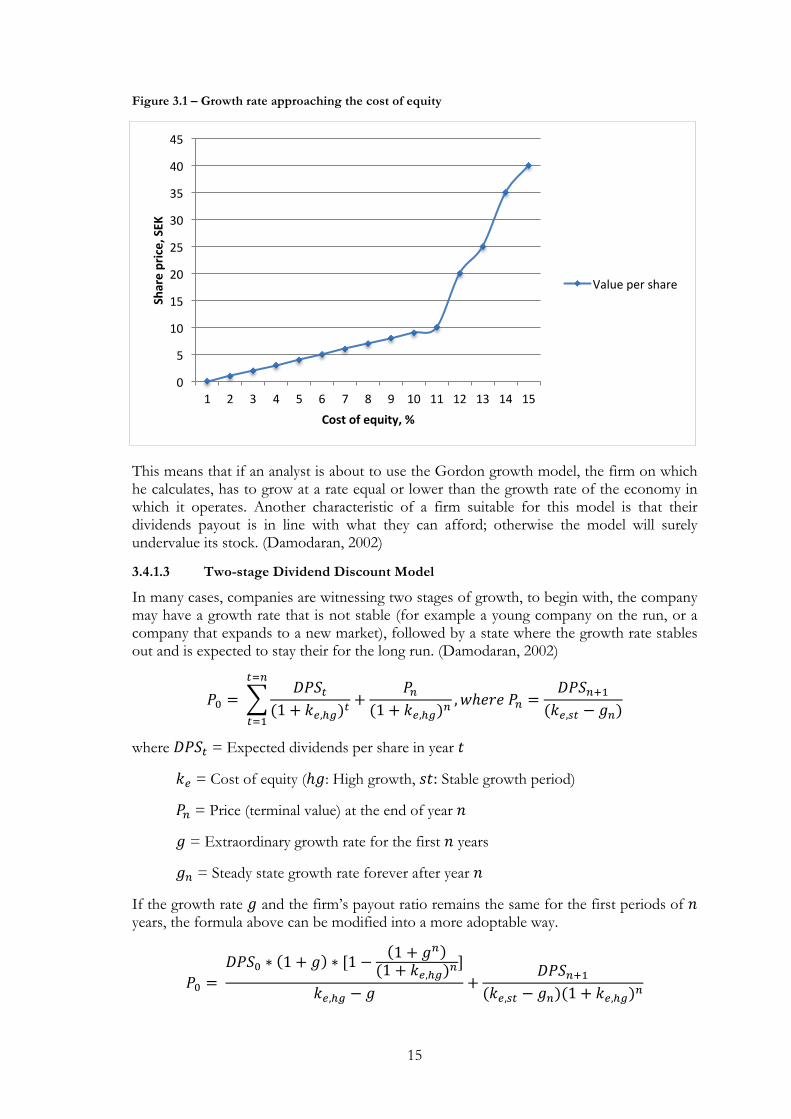
It is clear that the growth rate plays a crucial role in the model, and if used wrong, the resulting value will be incorrect or misleading. Given the equation, one can see that if a firm’s growth rate goes towards the cost of equity the value per share will approach infinity, and if the growth rate in fact surpasses the cost of equity the resulting value per share instantly turns negative. The phenomenon is further displayed in the figure below.
15
Figure 3.1 – Growth rate approaching the cost of equity
This means that if an analyst is about to use the Gordon growth model, the firm on which he calculates, has to grow at a rate equal or lower than the growth rate of the economy in which it operates. Another characteristic of a firm suitable for this model is that their dividends payout is in line with what they can afford; otherwise the model will surely undervalue its stock. (Damodaran, 2002)
3.4.1.3 Two-stage Dividend Discount Model
In many cases, companies are witnessing two stages of growth, to begin with, the company may have a growth rate that is not stable (for example a young company on the run, or a company that expands to a new market), followed by a state where the growth rate stables out and is expected to stay their for the long run. (Damodaran, 2002)
!! = !"#!
(1+ !!,!!)!+
!!(1+ !!,!!)!
,!ℎ!"! !! =!"#!!!
(!!,!" − !!)
!!!
!!!
where !"#! = Expected dividends per share in year !
!! = Cost of equity (ℎ!: High growth, !": Stable growth period)
!! = Price (terminal value) at the end of year !
! = Extraordinary growth rate for the first ! years
!! = Steady state growth rate forever after year !
If the growth rate ! and the firm’s payout ratio remains the same for the first periods of ! years, the formula above can be modified into a more adoptable way.
!! = !"#! ∗ 1+ ! ∗ [1− 1+ !!
(1+ !!,!!)!]
!!,!! − !+
!"#!!!(!!,!" − !!)(1+ !!,!!)!
0
5
10
15
20
25
30
35
40
45
1 2 3 4 5 6 7 8 9 10 11 12 13 14 15
Share price, SEK
Cost of equity, %
Value per share

16
The terminal growth rate, !!, has to have the same characteristics as the growth rate used in the Gordon growth model and cannot exceed the growth rate in the economy where the firm operates. Furthermore, the estimated growth rate and the payout ratio have to be consistent with each other. This means that if the expectation is that the growth rate will drop considerably after the first period of growth, and then the payout ratio must be higher in the later, stable growth period, than it is in the initial growth phase. The idea behind this is that a firm that are currently in a stable growth phase is able to pay out more of their earnings as dividends compared to a firm that is growing. (Damodaran, 2002)
According to Damodaran (2002) some guidelines concerning a firm’s beta-value and its return on equity exists. He states that a firm in high growth can be assumed to have a beta of 2.0, when entering stable growth – a firm’s beta-value should be somewhere between 0,8 and 1,2. The same assumptions holds for the return on equity, which can be high during the high growth phase, and then decrease as the firm, enter its stable growth phase.
Although a two-stage dividend discount model is applicable on many firms, the model do has some important limitations that have to be considered. The first problem is to define the length of the initial high growth period. This is an important aspect to consider since the value of an investment will increase, as this initial period is made longer. The second problem is connected with the transition period (when the firm goes from high growth to stable growth), where the two-stage dividend discount model assumes this to happen over night when in fact this process may happen gradually in real life. The last limitation with the model concerns the dividend payout policy of the firm being valued. A firm that does not pay out as much dividends as they could afford (they might chose to reinvest), tends to be undervalued when valued with the two-stage dividend discount model.
A firm most suitable for the two-stage dividends discount model is a firm that are in high growth for a specific time period, and then is expected to assume a stable growth forever. As mentioned, the payout policy is important, to get as a fair value of a firm as possible, it should maintain a policy of paying out its cash (after paying debts and doing the necessary reinvestments) as dividends. (Damodaran, 2002)
Damodaran (2002) is further providing a troubleshooting guide that could be useful if the value per share his extremely high or low:
• If you get a extremely low value: - The stable period payout ratio is too low for a stable firm (<0.40) - The beta in the stable period is too high for a stable firm - The two-stage model is being used when the three-stage model is more
appropriate • If you get an extremely high value:
- The growth rate in the stable period is too high for a stable firm (Damodaran, 2002)
3.4.1.4 Three-stage Dividend Discount Model
The three-stage dividend discount model tackles one of the limitations of the two-stage dividend discount model since it includes not only an initial phase of high growth and an infinite lower stable growth, but in between them it includes third a phase where the growth rate declines, a transitional period. (Damodaran, 2002)

17
!! =!"#! ∗ (1+ !!)! ∗ !!
(1+ !!,!!)!
!!!!
!!!
+!"#!
(1+ !!,!)!
!!!!
!!!!!!
+!"#!! ∗ 1+ !! ∗ !!(!!,!" − !!)(1+ !)!
where !"#! = Earnings per share in year !
!"#! = Dividends per share in year !
!! = Growth rate in high growth phase (lasts !2 periods)
!! = Growth rate in stable phase
!! = Payout ratio in high growth phase
!! = Payout ratio stable growth phase
!! = Cost of equity in high growth (ℎ!), transition ! and stable growth (!")
Since this formula consists of more inputs than the other two dividend discount models, possible noise connected with the estimation process may affect the ending value wrongly even though the model is more flexible than others. The mentioned flexibility that the model has makes it suitable for firms that have very high growth rates3 in their earnings, which are expected to grow at those rates for an early period, but are later expected to drop progressively towards a stable rate. (Damodaran, 2002)
3.4.2 Free Cash Flow to Equity
Compared to the dividend discount models, which assumes dividends to be the only cash flow received by and available to stockholders, the free cash flow to equity models defines the payable amount as the cash left over, after meeting all financial obligations. The cash flow available to be paid out as dividends is best explained by illustrating how the financial obligations are considered in a mathematical formula. Apart from the obvious difference (dividends vs. FCFE) there are a lot of similarities between how to conduct valuations with the two different models.
!"!# = !"# !"#$%& − !"#$%"& !"#$%&'()*$+ − !"#$"%&'(&)*− !ℎ!"#$ !" !"!#$%ℎ !"#$%&' !"#$%"& + (!"# !"#$ !""#$%− !"#$ !"#$%&"'())
This means that instead of discounting the actual dividends paid, we discount the potential dividends in the free cash flow to equity models. The assumption is, thus, that we assume the FCFE to be paid out to the companies’ stockholders. (Damodaran, 2002)
3.4.2.1 Constant growth FCFE
The constant growth model is similar to the Gordon growth model used for discounting dividends. The applied growth rate has to be rational and cannot be greater than the growth rate of the economy in which the company is active.
!! =!"!#!!! − !!
3 As a rule of thumb, growth rates over 25 percent would qualify as very high when the stable growth rate is between 6 and 8 percent. (Damodaran, 2002)

18
where !! = Value of stock today
!"!#! = Expected FCFE next year
!! = Cost of equity of the firm
!! = Growth rate in FCFE for the firm forever
Compared to the Gordon growth model this constant growth FCFE model is more suited for stable firms that are paying out dividends that deviates significantly from its free cash flow to equity. If a firm pays out exactly its free cash low to equity as dividends, the value obtained will be exactly the same as if we have used the Gordon growth model. (Damodaran, 2002)
If you after using the Constant Growth FCFE model believe that your value is either too high or too low, Damodaran (2002) has a troubleshooting guide for finding out what is wrong with the valuation.
• If you get a low value from this model, it may be because: - Capital expenditures are too high relative to depreciation - Working capital as a percent of revenues is too high - The beta is high for a stable firm
• If you get too high a value, it is because: - Capital expenditures are lower than depreciation - Working capital ratio as percent of revenue is negative - The expected growth rate is too high for a stable firm
3.4.2.2 Two-stage FCFE
The same type of growth applies on the two-stage FCFE model as the two-stage DDM model, namely that the growth rate will be constantly high during an initial phase and then drop down to a stable growth rate that will go on forever. It is appropriate to use the model when valuing firms with dividends levels that are unmaintainable or below what the firm actually can afford to pay out. The value of a stock is calculated by taking the present value of the FCFE per year (for the high growth period) plus the present value of the terminal price at the end of the period. (Damodaran, 2002)
!! = !" !" !"!# + !" !" !"#$%&'( !"#$% =!"!#!
(1+ !!,!!)!+
!!(1+ !!,!!)!
!!!
!!!
where !"!#! = Free cash flow to equity in year !
!! = Price at the end of the high growth period
!! = Cost of equity in high growth (ℎ!) and stable growth (!")
The ending, or terminal price !! is calculated by using the infinite growth rate !!.
!! =!"!#!!!(!!,!" − !!)
Damodaran (2002) is as for the previous models providing a troubleshooting guide if your deriving share price is either to be considered too low or too high:

19
• If you get a extremely low value: - Earnings are depressed due to some reasons (economy etc.) - Capital expenditures are significantly higher than depreciation in stable growth
phase - The beta in the stable period is too high for a stable firm - Working capital as percent of revenue is too high to sustain - The use of the two-stage model when the three-stage model is more
appropriate • If you get a too high a value:
- Earnings are inflated above normal levels - Capital expenditure offset or lag depreciation during high-growth period - The growth rate in the stable growth period is too high for stable firm
(Damodaran, 2002)
3.4.2.3 Three-stage FCFE
As of the three-stage DDM model, this model is most suitable for firms which are going through three stages of growth, an initial high growth period which through a transitional growth period ends up in a infinite stable growth rate. (Damodaran, 2002)
!! =!"!#!
(1+ !!,!!)!+
!"!#!(1+ !!,!")!
+!!!
(1+ !!,!")!!
!!!!
!!!!!!
!!!!
!!!
where !! = Value of stock today
!"!#! = FCFE in year t
!! = Cost of equity in high growth(ℎ!), transitional growth(!") and stable growth(!")
!!! = Terminal price at the end of transitional period = !"!#!!!!(!!!!!)
!1 = End of initial high growth period
!2 = End of transition period
When using a model that assumes three different stages of growth it is important that assumptions about other financial variables are coherent with those of the growth rates. (Damodaran, 2002)
3.4.3 Related concepts and formulas connected with DDM & FCFE
As opposed to the relevant theories and concept in section 3.3 of the theoretical framework, this section will cover concepts and mathematical formulas in direct connection with the valuation models used in the thesis.
3.4.3.1 Estimating Growth
When estimating the appropriate growth rate there are several aspects to consider, based on if you use dividend discount models or free cash flow to equity models. When estimating growth for the FCFE model, focus lies on the return on equity (ROE) of the firm and at what rate the firm reinvests its net income. The formula for expected growth in FCFE is expressed as follows,
20
!"#$%&$' !"#$%ℎ !"#$ !" !"!# = !"#$%& !"#$%"&'("$' !"#$ ∗ !"#$%&ℎ !"#
where !"#$%& !"#$%"&'("$' !"#$ = 1 − (!"# !"#$%"& !"#!$%&'()!!!!!"#$ !" !"#$%&' !"#$%"&!!"# !"#$ !""#$%!"# !"#$%&
!"#$%&ℎ !"# = !"# !"#$!"!!"#$%!!"# !"#$%& !"#$ !"#! !"# !"#$%&"'(%) !"#$%&'&"!!""# !"#$% !" !"#$%&!!"#! !"# !"#$%&"'(% !"#$%&'&"!
When applying the dividend discount model, however, the fundamental growth rate calculations does not demand for any modifications of the return on equity, since the assumption of dividend discount models is that there do, or could, exist excess cash left in the firm which is not paid out as dividends. The expected growth rate in the dividend discount model is therefore expressed as follows,
!"#$%&$' !"#$%ℎ !"#$ = !"#"$#%&$ !"#$% ∗ !"#$%& !" !"#$%&
3.4.3.2 Firm life cycle
Since the process of valuating a firm with both the DDM and the FCFE model requires assumptions on future growth it is important to realize in what stage of maturity the company is in. When a company grows and matures, its cash flows and different risk exposures will follow a rather likely pattern. As Damodaran (2001) explains, the life cycle of a firm can be divided into five different stages (also see Figure 3.2):
1. Start-up: The first stage for a newly founded company, a stage where the company most likely is a private business that is funded by owner’s equity and bank loans. The focus at this stage will however be on gaining customers and establish the company instead of raising capital.
2. Expansion: When a firm is successfully established in the market and a customer base is built, the focus is now on raising capital in order for the company to expand its operations. Some firms will during its expansion stage convert the company into a publicly traded one and raise the needed capital through issuing common stock. In general though, since the investment need is high and internal cash flows are low, the owners will turn to private equity or venture capitalists.
3. High Growth: At this stage of the cycle, the company’s revenues are rapidly growing, with revenues lagging behind, and cash flows that does not make up for the company’s reinvestment needs. If the firm when from a private firm to a publicly traded firm the capital needed will most likely be generated from issuing more common stock, warrants and other variants of equity. If the company has debt, convertible debt is most likely to be used to raise the capital needed.
4. Maturity Growth: This is the stage when the corporation’s growth levels off and the lagging cash flows and earnings will increase rapidly, and the need to invest in new projects will decrease accordingly. During this stage the funding needs will be highly covered by internal financing and external financing will change from being mainly an equity based financing to a bank debt or corporate bonds financing policy.
5. Decline: When a firm is in the decline stage they will find that both earnings and revenues are starting to decline, as their operations mature and new competitors occurs, taking market shares from them. The needs for new investments are low and any existing investments will continue to produce cash flows, however at a declining rate. Firms at this stage are unlikely to be making

21
new stock or bond issues but likely to retire old debt and do stock buy-backs, which means that the company in some sense has started to liquidate itself.
Damodaran (2001) stresses that the five-stage life cycle just presented does not hold for every company, and the choices made through the stages may differ from company to company. There are numerous examples of firms that never make it past the start-up stage, and even if they do, not all of them turn into publicly traded companies because they manages to raise enough capital to continue growing over long periods.
Figure 3.2 – A graphical explanation of a firm’s life cycle (Damodaran, 2001)
3.4.3.3 Capital Asset Pricing Model
The expected return, or the cost of equity, can be computed by using the Capital Asset Pricing Model, the CAPM. It captures all the market risk in a beta-value relative to a market portfolio, a portfolio that, at least theoretically thinking, includes every traded asset in the market held in proportion to their market value. The expected return is assumed to be a function of a firms risk free rate and its beta value. (Damodaran, 2002)
! !! = !! + !! ! !! − !!
where ! !! = Expected return on asset !
!! = Risk-free rate
! !! = Expected return on market portfolio
!! = Beta of asset !
Basically, the three inputs can be defined as:
• Risk-free rate: An asset of which the investor knows the expected return with certainty
• Return on market portfolio: Defined as the market risk premium, the premium that gives investors incentives to invest in the market portfolio instead of a riskless asset

22
• Beta value: Measures what extra risk the investment brings to the total market portfolio
The Capital Asset Pricing Model, according to Damodaran (2002), is the standard model today, and has been for a long time, for estimating risk and return on any asset.
Since the companies that this thesis considers are all listed on the Nasdaq OMX Stockholm, the risk free interest rate that will be used is the Swedish Treasury bond rate. When this thesis was conducted, the rate was by the Swedish National Bank set to 3.30% (SCB Treasury Bond rate, 2011). A yearly study made by PriceWaterCooper (PWC Riskpremiestudien, 2011), shows that the majority (79%) of the respondents in their study uses the 10-year t-bond rate.
The beta value for every one of the companies in this thesis will be collected from the online stockbroker firm Avanza Bank. The beta values are further assumed to move towards 1 when firms growth at stable perpetual rates (Damodaran, 2002).
The worldwide operating consulting firm PWC performs annual studies on the Swedish stock market with the intention of identifying its market risk premium. The last study was conducted in March 2011, and indicates that the Swedish stock market risk premium is 4.5% (PWC Riskpremiestudien, 2011).
3.4.3.4 Dividend Payout ratio
The dividend payout ratio is calculated by dividing total common dividends by net income available to common shareholders, or by dividing dividends per share by earnings per share. (Koller et al, 2010)
!"#"$%&$ !"#$%& !"#$% = !"#"$%&$' !"# !ℎ!"#(!"#)!"#$%$&' !"# !ℎ!"#(!"#)
This is the conventional way of looking at the payout ratio; it gives us the value of dividends as a proportion of earnings. In contrast, Damodaran (2001) presents an approach that measures the total cash returned to stockholders as a proportion of the free cash flow to equity, with the formula:
!"#ℎ !" !"#$%ℎ!"#$%& !" !"!# !"#$% =!"#"$%&$' + !"#$%& !"#$%&ℎ!"#"
!"!#
If this ratio is equal or close to 1, the firm is paying out all its available cash to the stockholders. If the ratio on the other hand is significantly less than 1, the firm is paying out less than it can afford to and is most likely using the cash to increase its balance or reinvesting it in various projects, either way they are ploughing back the cash into their businesses. If the payout ratio instead turns out to be greater than 1, the firm is paying out more cash to its stockholder than it can afford and are most likely drawing that cash from its balance or raising new equity. (Damodaran, 2001)
3.5 The Companies This section of the thesis covers some basic financial information about the companies on which the study is conducted. The selection of companies was made entirely from companies listed on the Nasdaq OMX Stockholm, however, from different industries and states of maturity. The idea behind the selection is to find out if there exists companies that respond to valuation methods in different ways, based on their different financial

23
attributes. The study covers ten companies in total, all of them listed as Large Cap on Nasdaq OMX Stockholm. The following information has been collected from the respective homepage of every company, a more thorough and non-financial description of the companies can be found in the Empirical Findings & Analysis section of the thesis.
Table 3.1 – Basic financial information, case companies
Year 2010 Turnover (MSEK)
Net Income (MSEK)
Share price (3/1 2011, SEK)
Shares Outst.
Market Cap. (SEK)
ABB 215,516 20,488 152.20 256,565,586 39,049,282,189
ASSA Abloy 36,823 4,080 193.99 349,075,055 67,717,069,919 Astra
Zeneca 226,978 30,840 312.00 242,757,885 75,740,460,120
Atlas Copco 69,875 9,944 154.60 839,394,096 129,770,327,242
Axfood 34,260 862 254.30 52,467,678 13,342,530,515
Getinge 22,406 2,280 144.80 222,383,327 32,201,105,750
Meda 11,571 1,428 53.00 302,243,065 16,018,882,445
NCC 54,942 1,527 150.10 31,173,625 4,679,161,113
Oriflame 13,656 1,573 362.70 55,473,512 20,120,242,802 Swedish Match 13,606 2,958 196.40 231,000,000 45,368,400,000
3.6 Previous Research The main part of the theoretical framework is based on the Stern School of Business’s professor Aswath Damodaran’s descriptions and views on how to go about with different valuation processes. In his book “Investment Valuation – Tools and Techniques for Determining the Value of Any Asset” (2002) he publish a range of company attributes that makes the companies more suitable for certain valuation models. For the Dividend Discount Model Damodaran states that the model is preferable for firms with a high dividends payout ratio and that it cannot be used to value a stock that pays low or no dividends. He also explains how the model works well at finding undervalued stocks and that when used on a five-year period the stocks seems to be undervalued. The Free Cash Flow to Equity on the other hand is according to Damodaran best suited for firms with low dividends payout ratios, since the model, rather than discounting actual dividends, discounts potential dividends.
3.7 Assumptions prior to Empirical Findings & Analysis Since this thesis only focus on the process of calculating the firm value and not the specific operations of the firm, although to some extent this is taken into account, the empirical findings and analysis will be based on assumptions concerning the growth rates of the companies in the study. The assumptions will be divided into two possible scenarios:
1. The first scenario is that the companies are in the middle and end of Damodaran’s life cycle, namely that they are in a mature state with stable growth and earnings starting to decline, with a low need for new investments. The rates at which the firms are growing are not exceeding the growth rate of the economy in which they operate and this rate is expected to last forever. The basic forms of the DDM and the FCFE model will be used since the firms are in this stable growth.
2. The second scenario that will be used is one where the companies are in a current state of stable high growth, and are expected to be so for a specific period of time, after which the sources of the high growth are expected to disappear and the

24
companies growth rates drops to a perpetual rate below the economy growth rate in which they operates. Since the growth rates in the second scenario most likely will exceed the cost of equity, the Two- or Three-stage version of the DDM and FCFE model will be applied in this scenario.
The underlying reasoning behind these scenarios is that it would be very time-consuming to assess every one of the ten companies in the study to find out at what exact stage of their life cycle they currently are. By picturing the above scenarios this thesis will cover the possibility that a company can be well established and mature as well as in the phase of expansion or periodical growth.
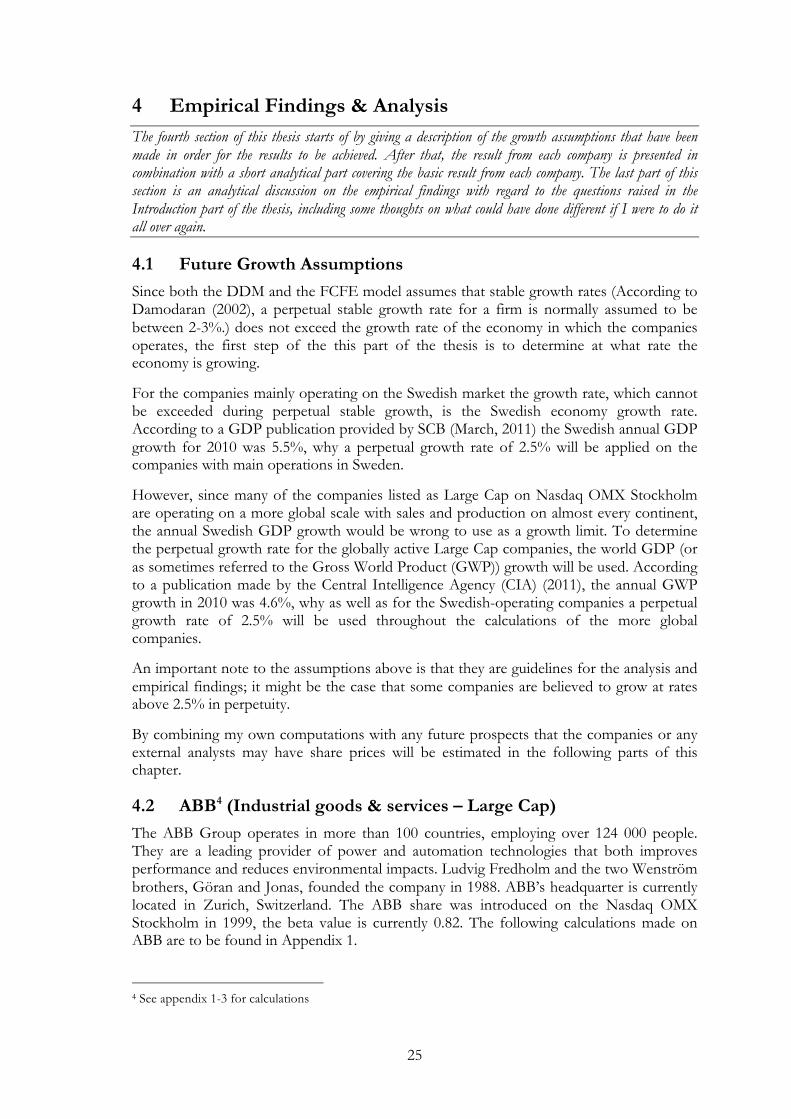
25
4 Empirical Findings & Analysis The fourth section of this thesis starts of by giving a description of the growth assumptions that have been made in order for the results to be achieved. After that, the result from each company is presented in combination with a short analytical part covering the basic result from each company. The last part of this section is an analytical discussion on the empirical findings with regard to the questions raised in the Introduction part of the thesis, including some thoughts on what could have done different if I were to do it all over again.
4.1 Future Growth Assumptions Since both the DDM and the FCFE model assumes that stable growth rates (According to Damodaran (2002), a perpetual stable growth rate for a firm is normally assumed to be between 2-3%.) does not exceed the growth rate of the economy in which the companies operates, the first step of the this part of the thesis is to determine at what rate the economy is growing.
For the companies mainly operating on the Swedish market the growth rate, which cannot be exceeded during perpetual stable growth, is the Swedish economy growth rate. According to a GDP publication provided by SCB (March, 2011) the Swedish annual GDP growth for 2010 was 5.5%, why a perpetual growth rate of 2.5% will be applied on the companies with main operations in Sweden.
However, since many of the companies listed as Large Cap on Nasdaq OMX Stockholm are operating on a more global scale with sales and production on almost every continent, the annual Swedish GDP growth would be wrong to use as a growth limit. To determine the perpetual growth rate for the globally active Large Cap companies, the world GDP (or as sometimes referred to the Gross World Product (GWP)) growth will be used. According to a publication made by the Central Intelligence Agency (CIA) (2011), the annual GWP growth in 2010 was 4.6%, why as well as for the Swedish-operating companies a perpetual growth rate of 2.5% will be used throughout the calculations of the more global companies.
An important note to the assumptions above is that they are guidelines for the analysis and empirical findings; it might be the case that some companies are believed to grow at rates above 2.5% in perpetuity.
By combining my own computations with any future prospects that the companies or any external analysts may have share prices will be estimated in the following parts of this chapter.
4.2 ABB4 (Industrial goods & services – Large Cap) The ABB Group operates in more than 100 countries, employing over 124 000 people. They are a leading provider of power and automation technologies that both improves performance and reduces environmental impacts. Ludvig Fredholm and the two Wenström brothers, Göran and Jonas, founded the company in 1988. ABB’s headquarter is currently located in Zurich, Switzerland. The ABB share was introduced on the Nasdaq OMX Stockholm in 1999, the beta value is currently 0.82. The following calculations made on ABB are to be found in Appendix 1.
4 See appendix 1-3 for calculations
26
4.2.1 Financials & Assumptions
ABB’s free cash flow to equity has fluctuated over the analysed five-year period. The reason for this derives from changes in the company’s working capital and interest-bearing liabilities, since net income and their net capital expenditure has been somewhat stable throughout the period. The average growth in free cash flow to equity during the period was found to be 1.1%, with an expected growth in 2011 of 12.5%.
The company has managed to increase their payout ratio by almost 300% during the last five years, with a dividend payout ratio of 0.41 in 2010. ABB’s earnings per share have had a geometric average growth rate of 14.6% and an arithmetic average growth rate of 29.7% during the last five years.
For the cost of equity calculations, the 10-year government bond rate of 3,0% was used, in combination with a market risk premium of 4.5% and a beta value of 0.82. ABB’s cost of equity was found to be 6.7%.
ABB is, with its operative maturity and size, a typical Scenario 1-company. However, the company’s historical growth rates in both earnings per share and free cash flow to equity gives me good reason to assume a higher future growth rate than the Scenario 1 rate of 2.5%. For ABB, a perpetual growth rate is assumed to be the same as the GWP, namely 4.6%.
4.2.2 The Gordon Growth Model
With the Gordon Growth model I got a target price of 182.17 SEK for ABB, which could be compared to the financial analysts that have target prices ranging from 153 SEK to 248 SEK, in the end of 2010 and beginning of 2011. The closest analyst was ING Financial Markets, with a target price of 184 SEK (15/12-2010). The applied growth rate of 4.6% was indeed reasonable, considering me ending up right in the middle of what the financial analysts believe. My target price of 182.17 gives ABB a corresponding market capitalization of 46 740 MSEK.
The actual closing stock price of ABB on the 3rd of January 2011 was 152.20 SEK, with a corresponding market capitalization of 39 049 MSEK.
4.2.3 Constant Growth FCFE Model
With the Constant Growth FCFE Model I got a target price of 1023.72 SEK, which is significantly higher than my target price from the Gordon Growth model as well as the target prices ranging from 153 SEK to 248 SEK set by the financial analysts. This target price would result in a market capitalization of 262 651 MSEK.
The reason behind this high target price achieved by the Constant Growth FCFE model is most likely connected with the growth rate applied. A quick sensitivity analysis shows that if I apply a perpetual growth rate of 1.1%, which has been the average growth in free cash flow to equity the last five years and use a beta value of 1 instead of 0.82, I get a target price of 323.12 SEK. The target price is still higher than the actual share price in January 2011 of 152.20 SEK, but closer to the target price set by Goldman, Sachs & Co of 248 SEK, in the end of January 2011.
4.2.4 Summary Analysis
Both the Gordon Growth model and the Constant Growth FCFE model are highly sensitive to the implied growth rate, and in ABB’s case extra sensitive since their cost of
27
equity of 6.7% is close to the implied growth rate of 4.6%. The Gordon Growth model turned out to give the most accurate target price, compared to actual market price and other analysts target prices.
By using the troubleshooting guide provided by Damodaran (2002), a sensitivity analysis helped me find a more proper share price when using the Constant Growth FCFE model, by lowering the growth rate and by using a beta value closer to 1.
Figure 4.1 – ABB Share price
4.3 ASSA Abloy5 (Industrial goods & services – Large Cap) ASSA Abloy is the world leading provider of door opening solutions, represented on both mature and emerging markets, with leading positions in much of Europe, North America, Asia and the Pacific. The Group has a leading position in the fast-growing segment of access control, entrance automation, and identification technology and hotel security. The company was formed in 1994 after ASSA AB acquired the Finnish lock manufacturer Abloy Oy, and was introduced on the Stockholm Stock Exchange later that year. The Group’s headquarter is located in Stockholm, and the Group is currently employing around 37 000 people worldwide. The Group reported sales of 36 823 MSEK in 2010, and its shares have a current beta value of 0.92.
4.3.1 Financials & Assumptions
ASSA Abloy have experienced a tremendous growth in net income during the last five years, growing from being 1 756 MSEK in 2006 to 4 080 MSEK in 2010. Their free cash flow to equity have on the other hand experienced an annual decrease, except from 2009 to 2010 when the free cash flow to equity increased more with 27%, with an average growth of –27.9%. The expected growth in free cash flow to equity between 2010-2011 is 12.9%, based on a return on equity of 20.3% and a retention ratio of 0.633 in 2010.
The Group’s earnings per share have also grown during the last five years, with a geometric average growth of 8% and an arithmetic average growth of 8.3%. Dividends per share have 5 See appendix 10-12 for calculations
0 80
160 240 320 400 480 560 640 720 800 880 960
1040 1120
DDM FCFE Market
Shar
e pr
ice
in S
EK
ABB Share price
28
also increased, not in the same pace as earnings per share though, why the payout ratio has declined during the last five years, ending up at 0.37 in 2010.
The cost of equity calculations are based on the 10-year government bond rate of 3% and the market risk premium of 4.5% in combination with a beta value of 0.92, leading to a cost of equity of 7.1%.
In the annual report from 2010, ASSA Abloy presents a financial target of a 10% annual growth through a combination of organic and acquired growth. As the Group’s CEO explains, the 10% growth target is long-term and not in any way an indicator for investors.
My assumptions are, since ASSA Abloy already have gained substantial market shares in both mature and emerging markets, and the fact that they have the highest sales in the business, that they will continue to grow with 5% in perpetuity. They will not go through any initial high growth period and therefore will Scenario 1 be used, with the constant growth models associated with it.
4.3.2 The Gordon Growth Model
The share price achieved from using the Gordon Growth Model was 196.26 SEK, with a corresponding market capitalization of 68 510 MSEK. The target prices set by analysts range from 165 SEK to 230 SEK, and the closest target price of 195 SEK, was set by JP Morgan in January 2011. The actual closing share price on the 3rd of January of 193.00 SEK and market capitalization of 67 371 MSEK was just a fraction lower than my Gordon Growth target price.
4.3.3 Constant Growth FCFE Model
The price from using the Constant Growth FCFE Model was both higher than the Gordon Growth price and the closing price from 3rd of January, and amounted to 242.04 SEK with market capitalization of 84 491 MSEK. The closest target price from the range between 165 and 230 SEK was the target price set by CA Cheuvreux of 230 SEK.
4.3.4 Summary Analysis
It seems as my assumptions of a constant stable perpetual growth rate of 5% got me share prices in line with some of the analysts target prices and the Gordon Growth Model proved to generate a share price very close to the actual closing share price on the 3rd of January. It was also the Gordon Growth Model that came closest to any of the target prices provided by the analysts, and it was the JP Morgan target price from the 10th of January 2011 of 195 SEK that was closest.

29
Figure 4.2 – ASSA Abloy Share price
4.4 AstraZeneca6 (Health service – Large Cap) AstraZeneca is one of the world’s leading pharmaceutical companies whose products are sold in more than 100 countries. The company was formed in 1999 after a merger between two pharmaceutical groups, the Swedish group Astra and the British group Zeneca. AstraZeneca’s headquarter is located in London, UK, and they currently employ around 61 000 people (the majority of them in Europe). The merged company AstraZeneca was introduced on the stock market in 1999 (at the time of the merger) and has a current beta value of 0.09.
4.4.1 Financials & Assumptions
AstraZeneca has had a stable dividends payout ratio during the five-year period from 2006 to 2010, with a ratio of 0.42 in 2010. Their earnings per share have had a steady annual growth, with a geometric average growth rate of 10.6% and an arithmetic average growth rate of 11.8% for the last five years.
The company’s free cash flow to equity on the other hand has decreased during the last couple of years, going from a free cash flow of 22 600 MSEK in 2006 to 14 065 MSEK in 2010. During the five-year period that this thesis examines the free cash flow to equity has had an average annual growth of -20.2%, whilst the net income has been stable and actually increased during 2009-2010, it is changes in the working capital and the interest bearing liabilities that are the reason for the decreased free cash flow to equity. Although AstraZeneca has had this historical negative growth in free cash flow to equity, a return on equity (2010) of 37.84% and a retention ratio (2010) of 0.58 implies on an expected growth rate in the free cash flow to equity in 2011 of 22%.
For the cost of equity in stable growth calculations, the 10-year government bond rate of 3% has been used on all companies, as well as the market risk premium of 4.5%. With a beta value of 0.90, the cost of equity for AstraZeneca is 7.1%.
Although AstraZeneca is a Large Cap-listed company that normally would fall under the Scenario 1 alternative, the fact that they adopt a strategy of constantly entering new markets and launching new products make them more suited for Scenario 2. In their
6 See appendix 4-6 for calculations
0 25 50 75
100 125 150 175 200 225 250
DDM FCFE Market
Shar
e pr
ice
in S
EK
ASSA Abloy Share price

30
annual report from 2010 the Chief Executive Officer (CEO) stresses their efforts of gaining market shares in emerging markets, markets that has given an average revenue growth of 14% during the last years, nearly three times as much as the more established markets. With this in mind I will adopt the Scenario 2 calculations on AstraZeneca, with the believe that they have the ability to growth at a higher rate than the economy, while exploiting the emerging markets, after which they will fall back to a lower stable growth rate beneath the economy growth rate of 4.6%. According to the CEO of AstraZeneca and my own calculations, an initial stable high growth for five years of 12%, after which their growth will decline into a stable perpetual rate of 2.5%. Another assumption that is being made along with the Scenario 2 is that when AstraZeneca moves from high to stable growth their beta value will move towards 1, leading to a cost of equity in stable perpetual growth of 7.5%.
4.4.2 Two-stage Dividend Discount Model
When applying the Two-stage Dividend Discount Model on the numbers of AstraZeneca I get a resulting share price of 551.84 SEK. Amongst the professional analysts Deutsche Bank sets the lowest target price of 339 SEK, while Bank of America Merrill Lynch sets the highest of 362 SEK, so I value the share of AstraZeneca significantly higher when using the Two-stage Dividend Discount Model. The reason for this high share price could derive from the perpetual growth rate assumed to take place after five years. According to Damodaran (2002), this is the common reason for high values in the Two-stage Dividend Discount Model. A sensitivity analysis shows that if I instead assume a perpetual growth rate of 1% after the initial five-year high growth period the share price is estimated to 442.01 SEK. Although the share price is still higher than the analysts target prices, it seems more reasonable than 551.84 SEK.
With a share price of 551.84 SEK, the market capitalization for AstraZeneca would be 133 964 MSEK, and with the adjusted stable growth rate the market capitalization would be 110 064 MSEK. The actual closing stock price of AstraZeneca on the 3rd of January 2011 was 312.00 SEK, with a corresponding market capitalization of 75 740 MSEK.
4.4.3 Two-stage FCFE Model
When computing the share price of AstraZeneca using the Two-stage FCFE Model the price was 387.98 SEK, which is more in line with the target prices provided by the analysts, ranging from 339 SEK to 362 SEK. Bank of America Merrill Lynch is the closest analyst with a target price of 362 SEK. My share price of 387.98 SEK results in a market capitalization of 94 186 MSEK, compared to the actual closing share price on the 3rd of January 2011 of 312.00 SEK with a market capitalization of 75 740 MSEK.
4.4.4 Summary Analysis
The formulas of both the Two-stage DDM and the Two-stage FCFE allows for applying growth rates exceeding the cost of equity, which is not the case for the One-stage models used previously on ABB. Despite of this ability the Two-stage DDM gave me a significantly higher price than what seems reasonable, Damodaran’s troubleshooting guide did in some sense shed some light to the reason, a sensitivity analysis showed that by assuming a lower stable growth rate in perpetuity the share price moved towards both analysts target prices and the actual closing price early in January 2011.
The Two-stage FCFE model did however give me a price that is in line with both the analysts and the closing price in January 2011, it would be reasonable to assume that my

31
projections about AstraZeneca’s future are in line with those of the professional analysts. The firm that is most likely to share my projections is Bank of America Merrill Lynch, which recommend a target price of 362 SEK.
Figure 4.3 – AstraZeneca Share price
4.5 Atlas Copco7 (Industrial goods & services – Large Cap) Atlas Copco is a world-leading supplier of different productivity solutions to industry customers. Their products and services range from compressed air and gas compressors, generators, construction and mining equipment, industrial tools and assembly systems related to aftermarket and the rental market. The company was founded in 1873 and employs about 33 000 people in more than 170 countries. The Atlas Copco share has a current beta value of 1.24.
4.5.1 Financials & Assumptions
The company’s free cash flow to equity has fluctuated heavily during the last five-year period, and the impact of the financial crisis has left its mark, the free cash flow to equity went from being 1 377 MSEK in 2009 to 12 763 MSEK in 2010. The average growth in free cash flow to equity between 2006 and 2010 is 14.6%, and return on equity in 2010 of 36.3% in combination with a retention ratio of 0.51 gives an expected growth in free cash flow to equity from 2010 to 2011 of 18.5%.
The year of 2009 looked like a rough year for Atlas Copco when considering their net income as well, which increased from being 6 363 MSEK in 2009 to 9 944 MSEK in 2010. The dividends during the period have however been somewhat consistent, with an increase to 4 SEK (3) per share in 2010. The company’s earnings per share have had a geometric average growth of -9.7% and an arithmetic average growth of 1.7% over the last five years.
For the cost of equity calculations, the 10-year government bond rate of 3% was used, as well as the market risk premium of 4.5%. In combination with a beta value of 1.24 the computed cost of equity for Atlas Copco was 8.6%.
7 See appendix 7-9 for calculations
0 35 70
105 140 175 210 245 280 315 350 385 420 455 490 525 560
DDM FCFE Market
Shar
e pr
ice
in S
EK
AstraZeneca Share price
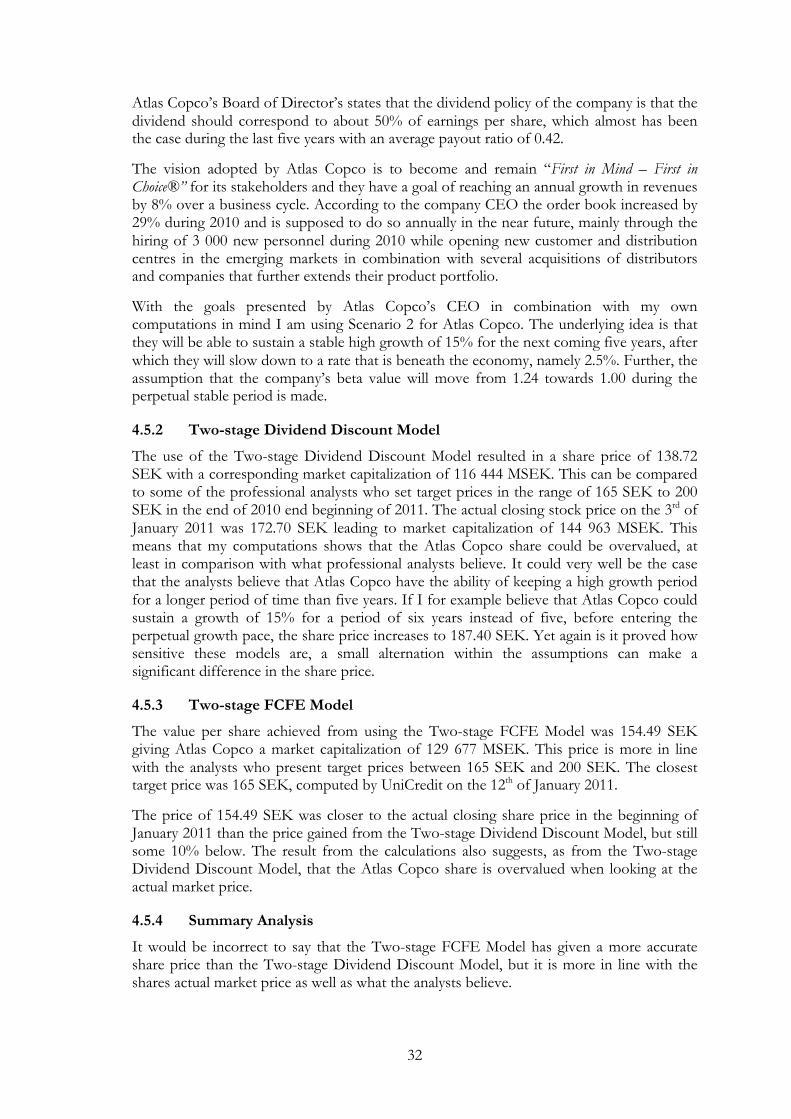
32
Atlas Copco’s Board of Director’s states that the dividend policy of the company is that the dividend should correspond to about 50% of earnings per share, which almost has been the case during the last five years with an average payout ratio of 0.42.
The vision adopted by Atlas Copco is to become and remain “First in Mind – First in Choice®” for its stakeholders and they have a goal of reaching an annual growth in revenues by 8% over a business cycle. According to the company CEO the order book increased by 29% during 2010 and is supposed to do so annually in the near future, mainly through the hiring of 3 000 new personnel during 2010 while opening new customer and distribution centres in the emerging markets in combination with several acquisitions of distributors and companies that further extends their product portfolio.
With the goals presented by Atlas Copco’s CEO in combination with my own computations in mind I am using Scenario 2 for Atlas Copco. The underlying idea is that they will be able to sustain a stable high growth of 15% for the next coming five years, after which they will slow down to a rate that is beneath the economy, namely 2.5%. Further, the assumption that the company’s beta value will move from 1.24 towards 1.00 during the perpetual stable period is made.
4.5.2 Two-stage Dividend Discount Model
The use of the Two-stage Dividend Discount Model resulted in a share price of 138.72 SEK with a corresponding market capitalization of 116 444 MSEK. This can be compared to some of the professional analysts who set target prices in the range of 165 SEK to 200 SEK in the end of 2010 end beginning of 2011. The actual closing stock price on the 3rd of January 2011 was 172.70 SEK leading to market capitalization of 144 963 MSEK. This means that my computations shows that the Atlas Copco share could be overvalued, at least in comparison with what professional analysts believe. It could very well be the case that the analysts believe that Atlas Copco have the ability of keeping a high growth period for a longer period of time than five years. If I for example believe that Atlas Copco could sustain a growth of 15% for a period of six years instead of five, before entering the perpetual growth pace, the share price increases to 187.40 SEK. Yet again is it proved how sensitive these models are, a small alternation within the assumptions can make a significant difference in the share price.
4.5.3 Two-stage FCFE Model
The value per share achieved from using the Two-stage FCFE Model was 154.49 SEK giving Atlas Copco a market capitalization of 129 677 MSEK. This price is more in line with the analysts who present target prices between 165 SEK and 200 SEK. The closest target price was 165 SEK, computed by UniCredit on the 12th of January 2011.
The price of 154.49 SEK was closer to the actual closing share price in the beginning of January 2011 than the price gained from the Two-stage Dividend Discount Model, but still some 10% below. The result from the calculations also suggests, as from the Two-stage Dividend Discount Model, that the Atlas Copco share is overvalued when looking at the actual market price.
4.5.4 Summary Analysis
It would be incorrect to say that the Two-stage FCFE Model has given a more accurate share price than the Two-stage Dividend Discount Model, but it is more in line with the shares actual market price as well as what the analysts believe.

33
By comparing my share price of 154.49 SEK it would be reasonable to assume that UniCredit, with a target price of 165 SEK, have similar future growth prospects about Atlas Copco’s future to me. As the sensitivity analysis shows, the reason for their target price could derive from a belief in a longer initial high growth period than five years.
Figure 4.4 – Atlas Copco Share price
4.6 Axfood8 (Fast moving consumer goods – Large Cap) Axfood’s focus is on food retail and wholesale in Sweden; the retail is conducted through their own chains Willys, Hemköp and PrisXtra, with a total amount of stores of 229. Apart from their wholly owned stores, they are associated with around 840 franchise stores. Axfood has its origins in the company D&D Dagligvaror which in the year 2000 merged with the already publicly traded company Hemköp, and the Axfood Group forms and takes over Hemköp’s initial public offering. In 2010 the number of employees amounted to about 7 000, the Axfood share’s beta value is currently 0.50.
4.6.1 Financial & Assumptions
The free cash flow to equity of Axfood decreased during the years 2008-2009, but increased more than four times during 2010 to a level of 1 657 MSEK. The increase in 2010 is mainly a result from an increase in the net income as well as a decrease in capital expenditure from 1 158 MSEK in 2006 to 404 MSEK in 2010. The average growth rate in the free cash flow to equity has been 28.2% during the last five years, and are expected to grow by 8.3% in 2010-2011 based on a return on equity 2010 of 31% and a retention ratio 2010 of 0.27.
Axfood’s dividend policy is that dividends should amount at least 50% of after-tax profits, which has been the case during the period 2006-2010, with a dividends payout ratio of 0.73 in 2010. Although their payout ratio has increased during the last five years, their earnings per share have only had a geometric average growth of 0.6% and an arithmetic average growth rate of 0.9%.
8 See appendix 13-15 for calculations
0 10 20 30 40 50 60 70 80 90
100 110 120 130 140 150 160 170 180
DDM FCFE Market
Shar
e pr
ice
in S
EK
Atlas Copco Share price
34
Anders Strålman, the CEO of Axfood, in the 2010 annual report presents the future prospects of Axfood, where he states that Axfood believe that they can continue their historical growth pattern in the near future. The indicators show that even though interest rates are expected to increase, the Swedish household’s will still have a good year in terms of personal finances. The raw material prices are expected to be high during 2011, but the strong Swedish krona will have a damping effect on any price increases. Axfood are planning to establish another 14 stores and modernize approximately 40 during 2011 in order to increase their market share on the Swedish food retail market. They further believe that their e-commerce and ready-made meals will increase the near future profitability.
The number two Scenario will be applied on Axfood’s calculations, with assumptions of a continuous high growth pace of 6%, which is higher than the 5.5% growth rate of the Swedish economy during 2011 years, after which a perpetual growth rate of 3.0% is applied. The current high growth beta value of Axfood is 0.5, but is expected to move towards 1.0 during the perpetual stable growth.
The cost of equity of Axfood is 5.2% and is calculated by using the 10-year government bond rate of 3% and a market risk premium of 4.5% in combination with a beta value of 0.50.
4.6.2 Two-stage Dividend Discount Model
The result from the Two-stage Dividend Discount Model is a share price of 272.70 SEK for Axfood, leading to a market capitalization of 14 308 MSEK. That is higher than what the analysts’ target prices, where in the end of 2010 and beginning of 2011, which ranged from 215 SEK to 245 SEK. The closest target price was the one presented by SEB Enskilda on the 21th of January 2011 of 245 SEK, with a corresponding market capitalization of 12 855 MSEK.
The actual closing market price of the Axfood share on the 3rd of January 2011 was 254.30 SEK, with market capitalization of 13 343 MSEK.
One of the reasons for my high share price could be that my applied growth rate of 6% is excessive compared to average growth rates of Axfood’s earnings per share the previous five years. It might be the case that other analysts applied a lower growth rate, more in line with the earning per share growth rate.
4.6.3 Two-stage FCFE Model
The share price calculated with the Two-stage FCFE Model was 190.02 SEK, with market capitalization of 9 970 MSEK. Compared to the analysts with target prices ranging from 215 to 245 SEK, and a range of market capitalization from 11 281 MSEK to 12 855 MSEK.
The underlying assumptions for the applied high growth rate of 6% are that the competitiveness on the Swedish food retail market is too high for a higher growth rate to be achieved. If, however, Axfood manages to reach a growth rate of 8.3%, as my calculations shows, the target price from the Two-stage FCFE Model would be 202.74 SEK and a market capitalization of 10 637 MSEK, which would be closer to the closing market share price and the analysts target prices. If, on top of that, I change my assumption of a 1-year high growth stage, to a period of five years, the target price would increase to 206.85 SEK and a corresponding market capitalization of 10 853 MSEK.
35
4.6.4 Summary Analysis
Since Axfood’s main target market is the Swedish food retail market, the Swedish economy growth rate is used as the limit-rate for stable perpetual growth.
In the case of the Axfood valuation, the Two-stage FCFE Model gave me the result closest to the actual market share price and the analysts target prices. As shown in the calculations, the share price would increase if I assume a higher and longer high growth period.
Both the Two-stage Dividend Discount Model and the Two-stage FCFE Model provided share prices that are reasonable, compared to the actual market price and the analysts target prices, while the DDM Model suggests that the Axfood share is undervalued the FCFE Model suggests the opposite.
Figure 4.5 – Axfood Share price
4.7 Getinge9 (Health service – Large Cap) The Getinge Group was founded in 1904, Sweden, and currently employs over 11 500 people all over the world, the group’s headquarter is located in Getinge, Sweden. Getinge AB provides leading integrated, ergonomic, cost effective solutions for efficient cleaning, disinfection and sterilization in the healthcare and science sectors. In 1993 Getinge AB acquired the British company British Sterilizer and the French Stirn Industries while they at the same time were introduced on the Nasdaq OMX Stockholm. In 2009 Getinge Group reached sales of 23 billion SEK and the share has a current beta value of 0.78.
4.7.1 Financials & Assumptions
The free cash flow to equity for Getinge amounted to 4 162 MSEK in 2010, that is an increase of almost 20% since 2009, which is in line with my computations that shows that the average growth rate in free cash flow to equity during the last five years has been 20%. A return on equity of 17.7% combined with a retention ratio of 0.66 Capital expenditures have decreased since 2008 and the depreciation has increased during the whole five-year period, while Getinge’s net income has increased steadily since 2006, amounting to 2 280 MSEK in 2010.
With an annual increase in both dividends per share and earnings per share, the payout ratio has been somewhat stable, with an average five-year ratio of 0.36. The dividend policy 9 See appendix 16-18 for calculations
0 25 50 75
100 125 150 175 200 225 250 275
DDM FCFE Market
Shar
e pr
ice
in S
EK
Axfood Share price
36
assumed by the Board of Director’s states that dividends should, in the long-term, comprise approximately on third of the profit after financial items and taxes. Getinge’s earnings per share were 9.55 SEK in 2010, and have had a geometric average growth of 11.4% during the last five years.
The cost of equity for Getinge is 6.5% and is calculated by using the 10-year government bond rate of 3% and a market risk premium of 4.5% in combination with a beta value for Getinge of 0.78.
In the 2010 annual report, CEO Johan Malmquist, explains that the Group’s largest business area, Medical Systems, had an invoicing growth of 4.6% during 2010, which is considered low compared to their long-term growth ambitions and past figures. He believes that a combination of them launching new companies in the emerging markets as well as launching a new line of products in the late end of 2010, backed up by a maintained acquisition strategy will help them reach their financial target of a 15% annual growth rate.
My assumptions, based on a combination of my own calculations and the financial goals presented by the Group’s CEO, are that Scenario 2 will be the case for Getinge. An initial high growth period of 5 years, with a growth rate of 15%, followed by a perpetual stable growth rate of 4% will be used in the Two-stage models. The reason for not applying a 2.5% growth in perpetuity is that it is more reasonable to assume a growth rate of 4% after enduring a period of rates at 15%.
4.7.2 Two-stage Dividend Discount Model
The resulting share price after using the Two-stage Dividend Discount Model is 162.14 SEK, with a corresponding market capitalization of 36 057 MSEK. The actual closing market share price on the 3rd of January was lower, 144.80 SEK, and the corresponding market capitalization of 32 201 MSEK as well. My share price may have been higher than the actual closing price in the beginning of January 2011, but well in the range of the analysts target prices between 133 SEK and 175 SEK. The closest target price was set by Jefferies & Company on the 20th of January 2011 and was 155 SEK, giving the shares of Getinge a market value of 34 469 MSEK.
If Getinge does not reach their goal of growing by 15% during the next five years, and instead only reach a growth rate of 11.7% (expected growth rate in FCFE) the share price would be 141.17 SEK, which is significantly lower.
4.7.3 Two-stage FCFE Model
The result form the Two-stage FCFE Model was a share price of 137.52 SEK and a market value of Getinge’s shares of 30 582 MSEK, which was lower than the actual closing price of the share on the 3rd of January 2011 of 144.80 SEK. It was however in the range of the analysts target prices between 133 SEK and 175 SEK, with JP Morgan’s target price of 133 SEK and market capitalization of 29 577 MSEK as the closest one.
If for any reason Getinge does not manage to reach an annual growth of 15% for the next coming five years, and instead only grew by 11.7% (expected growth rate in FCFE), the share price would drop to 125.05 MSEK.
4.7.4 Summary Analysis
By combining my own computations concerning the future prospects for Getinge and the financial strategies and goals presented by the Group’s CEO both the Two-stage DDM

37
and the Two-stage FCFE Model resulted in share prices that could be assumed reasonable compared to the market price and the analysts target prices.
If, however, Getinge does not manage to reach their financial goal of an annual growth rate of 15%, the impact on the share price is substantial. This shows the importance and possible impact of the high growth assumptions built into the Two-stage models.
Figure 4.6 – Getinge Share price
4.8 Meda10 (Health service – Large Cap) Meda is an international specialty pharmacy company with subsidiaries in 50 countries. The group has about 1 700 people in their work force with sales in over 120 countries. Meda is currently the 50th largest pharmaceutical company in the world with an annual turnover of approximately 88 billion SEK (2010). During 2010 Meda invested about 197 million SEK in drug research and development, their pipeline has strengthened during the last couple of years and consists of products in late clinical stage in key therapy areas. The beta value that this thesis applies on Meda is 0.84.
4.8.1 Financials & Assumptions
Meda’s net income amounted to 1 428 MSEK in 2010, which compared to 2006 is an increase of over 80%. The free cash flow to equity on the other hand has decreased from being 1 224 MSEK in 2006 to 861 MSEK in 2010, with an average growth rate during the five-year period of -2.5%. Combined with a return on equity of 10.5% (2010) and a retention ratio of 58% (2010), the expected growth in free cash flow to equity 2010-2011 is 6%. The company had their highest dividend payout ratio in 2010 of 0.42, whilst the average payout ratio during the last five years has been 0.24. This increased payout ratio is the result of an increase in dividends per share and a decrease in the earnings per share. Both the geometric and arithmetic average growth rate in earning per share has been negative the last five years, the geometric -10.2% and the arithmetic -2.8%.
The cost of equity calculations are based on the 10-year government bond rate of 3% and the market risk premium of 4.5%, combined with a beta value of 0.84, and is for 2010 6.8%.
10 See appendix 19-21 for calculations
0 15 30 45 60 75 90
105 120 135 150 165 180
DDM FCFE Market
Shar
e pr
ice
in S
EK
Getinge Share price
38
In the 2010 annual report Meda’s CEO Anders Lönner explains that although the results achieved during 2010 did not exceed the ones from 2009, an underlying growth did occur, and amounted to 2-3% in 2010. Meda did experience an average sales increase of over 20% in the emerging growth markets including Mexico, Poland, Russia and Turkey, where new sales organizations are created in order to maintain the growth. Meda’s did loose two important patents during 2010, but the pipeline is about to be strengthened further, particularly with their products Dymista (epileptic medicine) and Retigabine/Exogabine (allergy medicine), which both are in the near-patent phase. The Over-the-Counter (OTC) market, according to Lönner, is still quite unexploited and Meda hopes that through the acquisition of Antula (a successful Nordic company with well-known OTC products) in February 2011 be able to increase their market shares on the OTC market.
In Meda’s case the future prospects are hard to predict, as for all medical companies, the patents on their major products are of high importance and if their two new products does not go through the patent process Meda could be in for some trouble. With the loss of patents during 2010 in mind, I think that their efforts on the OTC market and a possible pipeline increase only would act as a compensation for prior losses. I do not believe that Meda will experience any growth rate exceeding the rate of the economy in the near future, why Scenario 1 is applied. An annual perpetual growth rate of 2.5% will be used in the One-stage models.
4.8.2 The Gordon Growth Model
By using a perpetual stable growth rate of 2.5% in the Gordon Growth model a share price of 47.90 SEK, and a market capitalization of 14 477 MSEK, was achieved. It is somewhat lower than the closing share price on the 3rd of January 2011 of 53.00 SEK as well as the analyst’s targets prices with a range between 55 and 68 SEK. Swedbank Markets gave the closest target price on the 3rd of December 2010 of 55 SEK, with a corresponding market capitalization of 16 623 MSEK.
If my growth assumptions were to change and a perpetual growth rate of 3% could be achieved by the company, the share price would increase to 54.50 SEK with market capitalization of 16 471 MSEK, which is close to the numbers provided by Swedbank Markets in December 2010.
4.8.3 Constant Growth FCFE Model
As well as for the Gordon Growth Model, a 2.5% perpetual stable growth rate was used in the Constant Growth FCFE Model, resulting in a share price of 68.22 SEK and a market capitalization of 20 620 MSEK. It is higher than the actual closing share price in January 2011 of 53.00 SEK and almost the same as the target price set by SEB Enskilda on the 15th of January 2011 of 68.00 SEK (exactly the same if rounded off).
4.8.4 Summary Analysis
Both the DDM and the FCFE Model gives reasonable share prices for Meda, with the FCFE price of 68.22 SEK as the one closest to the analysts’ target prices. It seems as my assumptions of a constant growth period for Meda was in line with the assumptions made by the analysts, especially at Swedbank Markets.

39
Figure 4.7 – Meda Share price
4.9 NCC11 (Industrial goods & services – Large Cap) The Nordic Construction Company (NCC) was founded in 1988, through a merger between JCC and ABV, in Sweden. Two years later after NCC merged with Nordstjernan AB the NCC-share was introduced on the Nasdaq OMX Stockholm. Their main area of focus is on developing and building residential and commercial buildings, industrial facilities and public buildings, roads and other infrastructure, furthermore they further work with the maintenance of their properties and roads. Their main target market is the Nordic countries, but they are also present in the Baltic countries, Germany and to some extent in Russia. In 2010, NCC had an operating profit of approximately 2.3 billion SEK and employed about 17 000 people. Their dividend payout was 10 SEK/share (2010), almost back at the level (11 SEK/share) they held prior to the recent financial crisis. The stocks beta value is estimated to 1.04.
4.9.1 Financials & Assumptions
The highest net income for NCC is from 2007 and amounts to 2 252 MSEK, after which the net income has dropped to a level of 1 527 MSEK in 2010. The same holds for NCC’s free cash flow to equity that has decreased the last few years, down to a level of 902 MSEK in 2010. The average growth in free cash flow to equity since 2006 amounts to -3%, a return on equity of 20% (2010) and a retention ratio of 0.29 (2010) does however suggest an expected growth in the free cash flow to equity of 5.8% during 2010-2011.
The traces of the recent financial crisis is also visible on the company’s per share data, where both earnings and dividends are starting to get back at levels in line with the ones prior to the crisis. The geometric average for NCC’s earnings per share is -2.8% while the arithmetic average growth is 0.7%. The average payout ratio for the last five years has been 0.50, with a ratio in 2010 of 0.71 and in the year of the crisis, 2008, 0.24.
The cost of equity is calculated by using the CAPM, and with a risk-free 10-year government bond rate of 3% and a market risk premium of 4.5% in combination with a beta value of 1.04 that cost of equity for NCC is 7.7%. 11 See appendix 22-24 for calculations
0 5
10 15 20 25 30 35 40 45 50 55 60 65 70
DDM FCFE Market
Shar
e pr
ice
in S
EK
Meda Share price

40
The newly appointed CEO of NCC Peter Wågström is in the annual report from 2010 explaining how the housing market has experienced high growth during the last one and a half year, but that the growth rate is expected to decrease and stabilize in the near future. He explains how NCC expects some growth in construction investments for housing, offices and other buildings and that the increased demand in the construction market will result in increased demand for aggregates. He further explains how the property-leasing market has stabilized and that the number of property transactions is expected to increase.
In accordance with Wågström and my own computations I will assume Scenario 2 for NCC, with an initial five-year period of high growth of 6% after which NCC will have a perpetual stable growth rate of 2.5%.
4.9.2 Two-stage Dividend Discount Model
The resulting share price from the Two-stage DDM is 182.28 SEK, with a corresponding market capitalization of 5 682 MSEK. That is higher than the actual closing share price on the 3rd of January 2011 of 150.10 SEK with a market capitalization of 4 679 MSEK. It is however right in the middle of the target prices set by the analysts, ranging from 125 SEK to 218 SEK, with a target price of 175 SEK set by ABG Sundal Collier as the closest one.
4.9.3 Two-stage FCFE Model
The share price achieved from the Two-stage FCFE Model was 166.55 SEK, with a market capitalization of 5 192 MSEK. Just like the price from the Two-stage DDM it is higher than the closing share price from January and is right in the middle of the analysts target prices. The closest target price of 165 SEK was set by Swedbank Markets, which makes is possible to assume that their future prospect about NCC are similar to the ones I assumed.
4.9.4 Summary Analysis
As it turned out, both models resulted in share prices well in line with the NCC analysts’ target prices. The Two-stage FCFE Model share price of 166.55 SEK was only a fraction higher than the target price recommended by Swedbank Markets in the beginning of 2011.
The higher target price of 218 SEK computed by Deutsche Bank in the beginning of 2011 could be the result of a higher growth rate than 6%. An initial growth rate of 10% for five years would, by using the Two-stage DDM, result in a share price of 215.28 SEK according to my calculations.
Figure 4.8 – NCC Share price
0 15 30 45 60 75 90
105 120 135 150 165 180
DDM FCFE Market
Shar
e pr
ice
in S
EK
NCC Share price
41
4.10 Oriflame12 (Fast moving consumer goods – Large Cap) Oriflame Cosmetics was founded in Sweden in 1967 by the two brothers Jonas and Robert af Jochnich and their associate Bengt Hallsten. The company manufactures and sells cosmetic products, with sales of 1.5 billion Euros (2010) in over 60 countries. They own five factories located in Sweden, Poland, China, Russia and India. They offer 900 different products, and market them through 3.6 million independent consultants. The Oriflame Cosmetics share was listed on Nasdaq OMX Stockholm in 2004, and its share has a current beta of 1.23.
4.10.1 Financials & Assumptions
The net income of Oriflame has increased with a steady, but low, rate during the last five years to an amount of 1 573 MSEK in 2010. The free cash flow to equity on the other hand has fluctuated during the last five-year period, and has had an average growth of -12.3%. The free cash flow to equity in 2010 was 2 254 MSEK and is expected to grow by 24.3% during 2010-2011, according to a return on equity of 61.3% and a retention ratio of 0.40 during 2010.
The annual dividends paid per share have been the same for the last four years, 12.5 SEK, while the earnings per share have been volatile with an increase from 2009 to 2010. The geometric average growth rate in earnings per share is for 2006-2010 6.3% while the arithmetic average is 8.3%. This means that the dividends payout ratio has been volatile as well, with an average ratio of 0.65 and a 2010 ratio of 0.60, however well above the 0.5 ratio proposed as Oriflame’s payout policy by their Board of Directors.
The cost of equity for Oriflame is calculated to be 8.5%, by using the risk-free 10-year government bond rate of 3%, the market risk premium of 4.5% and the Oriflame beta value of 1.23.
Magnus Brännström, CEO of Oriflame Cosmetics, states in the 2010 annual report that one of the long-term financial targets is to achieve sales growth of around 10 percent annually, while sales growth for 2011 is expected to be 5-10 percent. In order for the Group to achieve its long-term financial targets they will continue to invest in growth in both organically, with capital expenditure on existing and new manufacturing facilities, and through expansion into new markets.
Since my computations are in line with the financial targets of Oriflame, Scenario 2 will be used. I am assuming that Oriflame will be able to reach their goal of an annual growth rate of 10%, for a five-year period, after which they will assume a perpetual stable growth rate of 3%.
4.10.2 Two-stage Dividend Discount Model
The share price achieved from the Two-stage Dividend Discount Model is 411.01 SEK, with market capitalization of 22 800 MSEK. The analysts’ target prices range from 330 SEK to 420 SEK, with the closest target price of 420 SEK and market capitalization of 23 299 MSEK by Deutsche Bank. The actual closing market price of the share was on the 3rd of January 362.70 SEK, which means that my price of 411.01 SEK is significantly higher.
12 See appendix 25-27 for calculations
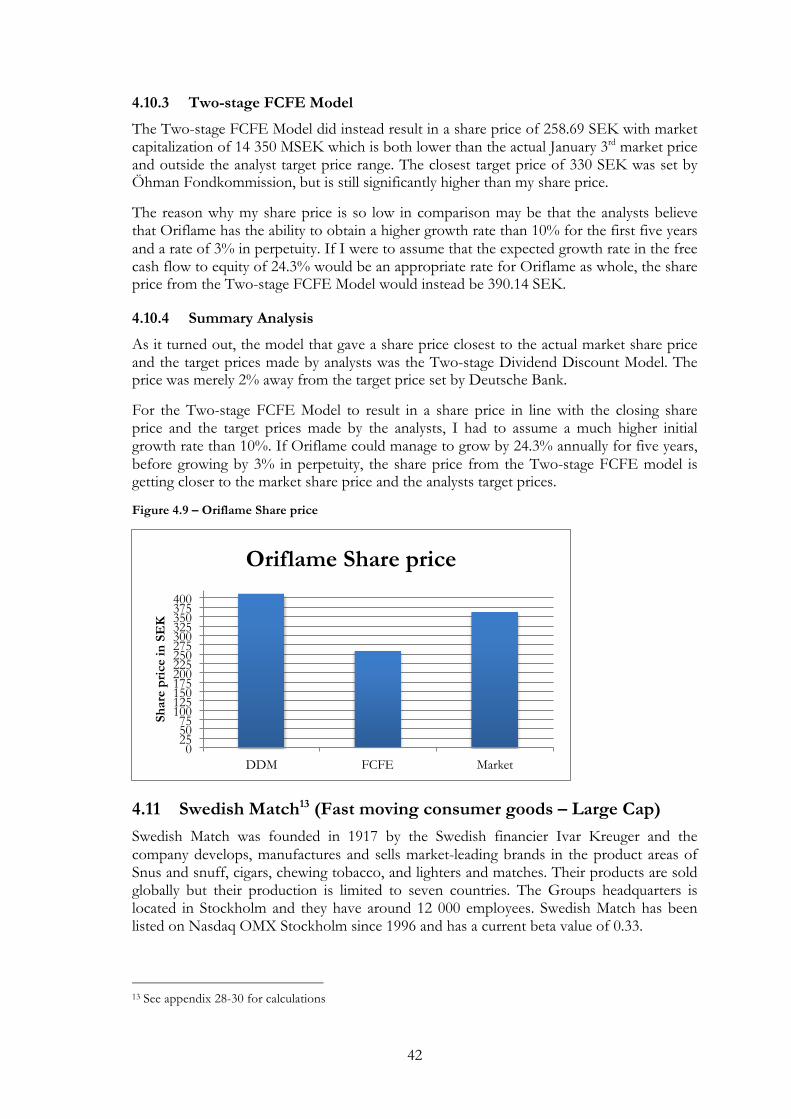
42
4.10.3 Two-stage FCFE Model
The Two-stage FCFE Model did instead result in a share price of 258.69 SEK with market capitalization of 14 350 MSEK which is both lower than the actual January 3rd market price and outside the analyst target price range. The closest target price of 330 SEK was set by Öhman Fondkommission, but is still significantly higher than my share price.
The reason why my share price is so low in comparison may be that the analysts believe that Oriflame has the ability to obtain a higher growth rate than 10% for the first five years and a rate of 3% in perpetuity. If I were to assume that the expected growth rate in the free cash flow to equity of 24.3% would be an appropriate rate for Oriflame as whole, the share price from the Two-stage FCFE Model would instead be 390.14 SEK.
4.10.4 Summary Analysis
As it turned out, the model that gave a share price closest to the actual market share price and the target prices made by analysts was the Two-stage Dividend Discount Model. The price was merely 2% away from the target price set by Deutsche Bank.
For the Two-stage FCFE Model to result in a share price in line with the closing share price and the target prices made by the analysts, I had to assume a much higher initial growth rate than 10%. If Oriflame could manage to grow by 24.3% annually for five years, before growing by 3% in perpetuity, the share price from the Two-stage FCFE model is getting closer to the market share price and the analysts target prices.
Figure 4.9 – Oriflame Share price
4.11 Swedish Match13 (Fast moving consumer goods – Large Cap) Swedish Match was founded in 1917 by the Swedish financier Ivar Kreuger and the company develops, manufactures and sells market-leading brands in the product areas of Snus and snuff, cigars, chewing tobacco, and lighters and matches. Their products are sold globally but their production is limited to seven countries. The Groups headquarters is located in Stockholm and they have around 12 000 employees. Swedish Match has been listed on Nasdaq OMX Stockholm since 1996 and has a current beta value of 0.33.
13 See appendix 28-30 for calculations
0 25 50 75
100 125 150 175 200 225 250 275 300 325 350 375 400
DDM FCFE Market
Shar
e pr
ice
in S
EK
Oriflame Share price

43
4.11.1 Financials & Assumptions
The net income for Swedish Match has fluctuated during the last five years and from 2009 to 2010 the net income dropped from 3 146 MSEK to 2 958 MSEK. Despite the recent drop in net income Swedish Match have still managed to increase their free cash flow to equity the last two years, with 6 224 MSEK of free cash flow to equity in 2010. The average growth in free cash flow to equity is -8.8% for the last five years, but the expected growth in free cash flow to equity during 2010-2011 is an astonishing 150%. The reason for such expectations derives from an impressive return on equity during 2010 of 261% combined with a retention ratio of 0.58.
Swedish Match’s have experienced substantial growth in their earnings per share, with a geometric average growth of 15.1% and an arithmetic average growth of 15.9%, the growth in earnings per share from 2009 to 2010 were 35.7% alone. Although this high growth in earnings per share, Swedish Match have still kept a dividends payout ratio of around 0.50 during the last five years, with an average of 0.42. The Swedish Match dividend payout policy states that the dividend should be within the range 40 to 60 percent of earnings per share.
The cost of equity calculations are done by using the CAPM with the 10-year government bond rate of 3% as the risk-free rate and a market risk premium of 4.5% in combination with a beta value of 0.33 leading to a cost of equity of 4.5%.
For the consideration of future prospects Swedish Match is the only out of the ten firms analysed in this thesis that has earnings estimates published on their webpage. An important note to these estimates is that it is not Swedish Match themselves that are providing them, but SME Direkt, a Swedish company with the goal of providing financial information. The estimates published by SME Direkt are however based on projections from analysts who cover Swedish Match, so the reliability should still be high.
The earnings estimates shows on a growth in net sales of 17.31% (2011), 4.12% (2012) and 3.79% (2013). This means that my projections, although they are even higher, seems to be in line with the ones made by the analysts covering Swedish Match, we share the belief of an excessive growth during 2011. One major factor to consider when making assumptions about Swedish Match’s future is the fact that their main product, snus, still is illegal within the EU, with the exception of Sweden. In the annual report from 2010 it is explained how the Swedish Government and the Swedish Parliament have asked for a new ruling in the case of legalizing snus within the European Union. Swedish Match expects the EU Commission to present their ruling in the end of 2011, and if snus were to be legalized there is a huge opportunity for potential growth for Swedish Match since they can enter the European market. This could stretch the high growth period for Swedish Match beyond 2011. I do however feel that it would be wrong to account for these possible growth opportunities in the calculations, since it is completely out of Swedish Match’s hands if snus will be legalized or not. My assumptions for Swedish Match’s future are however that they will experience an excessive growth rate during 2011 of 17%, after which they will have a perpetual growth rate of 3%. In order to compute a share price based on these assumptions, Scenario 2, with the Two-stage models will be applied.
4.11.2 Two-stage Dividend Discount Model
The share price derived from the Two-stage Dividend Discount Model is 243.08 SEK and a market capitalization of 56 152 MSEK. It is both higher than the closing share price on the 3rd of January 2011 of 196.40 SEK and the target prices set by the analysts, ranging
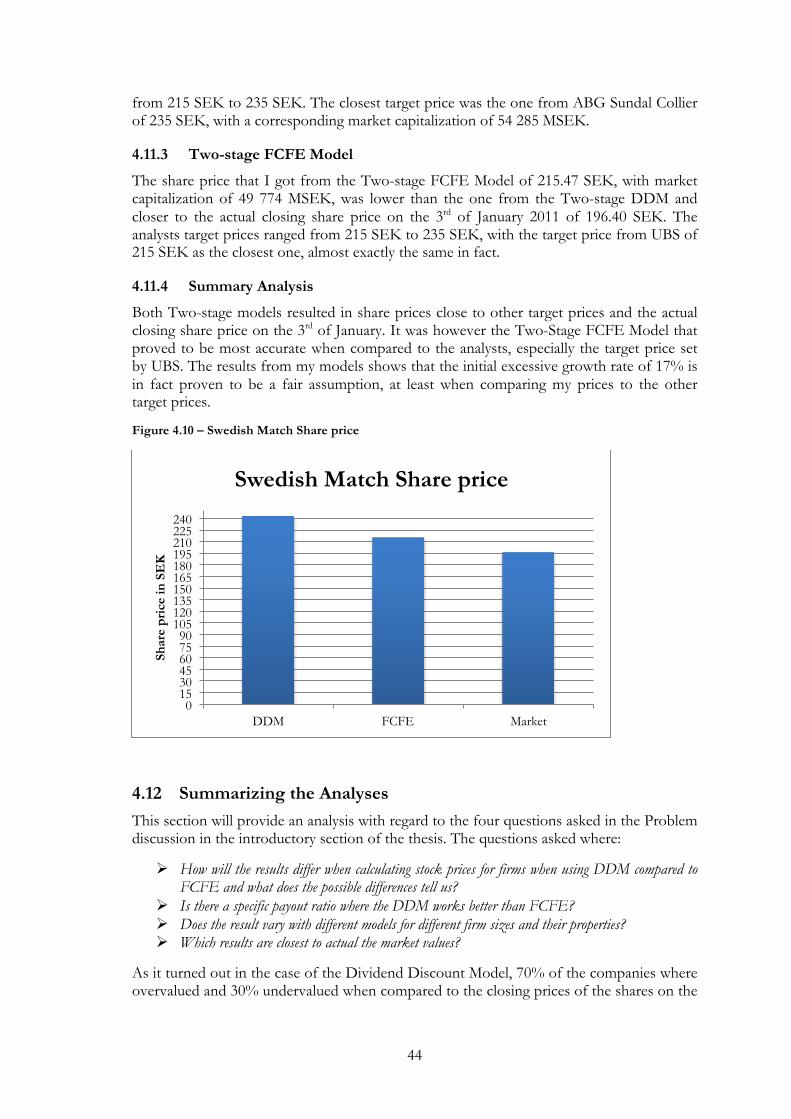
44
from 215 SEK to 235 SEK. The closest target price was the one from ABG Sundal Collier of 235 SEK, with a corresponding market capitalization of 54 285 MSEK.
4.11.3 Two-stage FCFE Model
The share price that I got from the Two-stage FCFE Model of 215.47 SEK, with market capitalization of 49 774 MSEK, was lower than the one from the Two-stage DDM and closer to the actual closing share price on the 3rd of January 2011 of 196.40 SEK. The analysts target prices ranged from 215 SEK to 235 SEK, with the target price from UBS of 215 SEK as the closest one, almost exactly the same in fact.
4.11.4 Summary Analysis
Both Two-stage models resulted in share prices close to other target prices and the actual closing share price on the 3rd of January. It was however the Two-Stage FCFE Model that proved to be most accurate when compared to the analysts, especially the target price set by UBS. The results from my models shows that the initial excessive growth rate of 17% is in fact proven to be a fair assumption, at least when comparing my prices to the other target prices.
Figure 4.10 – Swedish Match Share price
4.12 Summarizing the Analyses This section will provide an analysis with regard to the four questions asked in the Problem discussion in the introductory section of the thesis. The questions asked where:
Ø How will the results differ when calculating stock prices for firms when using DDM compared to FCFE and what does the possible differences tell us?
Ø Is there a specific payout ratio where the DDM works better than FCFE? Ø Does the result vary with different models for different firm sizes and their properties? Ø Which results are closest to actual the market values?
As it turned out in the case of the Dividend Discount Model, 70% of the companies where overvalued and 30% undervalued when compared to the closing prices of the shares on the
0 15 30 45 60 75 90
105 120 135 150 165 180 195 210 225 240
DDM FCFE Market
Shar
e pr
ice
in S
EK
Swedish Match Share price

45
3rd of January 2011. The result from the Free Cash flow to equity calculations where that 60% of the shares got overvalued and 40% undervalued compared to the market share values. In table 4.1 it is illustrated by how much each share was over- or undervalued with the Dividend Discount Model and the Free Cash Flow to Equity model.
Table 4.1 – Percentage over or under the market value from the 3rd of January 2011
Out of the twenty share prices that were calculated 65% got overvalued while the remaining 35% got valued under the shares market price. The most extreme deviation among the overvaluations is the FCFE price on the ABB share that suggests that the share is currently undervalued by 573% by the market and has an extreme potential for growth. Among the undervaluation results, the FCFE price on the Oriflame share stands out, suggesting that the share is currently traded 40.21% over its actual value.
The most accurate valuation by far was the DDM price on the ASSA Abloy share that only suggests that the share is overvalued by 0.38% in the market. Other valuations close to the market values where the FCFE share price for Swedish Match, 9.71% higher than its market price, and the FCFE share price for Getinge, 5.29% lower than its market price.
Now that it is established what model generated the most accurate share price in comparison to the market values of each and every company’s share the analysis can get into answering the problems states in the Introduction part of the thesis. Table 4.2 illustrates the different attributes of the companies and what model that generated the most accurate share price.
Overvaluation Undervaluation
Company DDM FCFE DDM FCFE
ABB 19.69% 573% ASSA Abloy 25.41% 0.38% AstraZeneca 76.87% 24.35% Atlas Copco 24.50% 11.79% Axfood 11.31% 28.93% Getinge 11.98% 5.29% Meda 28.72% 10.65% NCC 21.44% 10.96% Oriflame 13.32% 40.21% Swedish Match 23.77% 9.71%

46
Table 4.2 – Company attributes and accurate model
Company Industry Turnover (MSEK)
Payout ratio, 5y avg. Model closest to actual share price
ABB Industrial Goods & Services 215,516 0.25 DDM
ASSA Abloy Industrial Goods & Services 36,823 0.39 DDM
AstraZeneca Health Service 226,978 0.43 FCFE
Atlas Copco Industrial Goods & Services 69,875 0.42 FCFE
Axfood Fast Moving Consum. Goods 34,260 0.70 DDM
Getinge Health Service 22,406 0.36 FCFE
Meda Health Service 11,571 0.24 DDM
NCC Industrial Goods & Services 54,942 0.50 FCFE
Oriflame Fast Moving Consum. Goods 13,656 0.65 DDM
Swedish Match
Fast Moving Consum. Goods 13,606 0.44 FCFE
Out of the ten most accurate share prices for the companies in the study, five where achieved by using the Dividend Discount Model and the other five from using the Free Cash Flow to Equity model. At this point, which variation of the models that where used is irrelevant since the same assumptions where made on each of the companies, regardless of which model was used. If we compare the accuracy of the models with the industry in which the company operates the following figures illustrates the distribution of the results.
Figure 4.11 – Distribution of share prices in the industry “Industrial Goods & Services”
Amongst the companies operating within Industrial Goods & Services, the result from the case study was that 50% of the most accurate share prices where achieved by using the Dividend Discount Model and 50% achieved by using the Free Cash Flow to Equity Model. So the conclusion that can be made based on this study is that for companies operating within the industry of Industrial Goods & Services it is irrelevant which of the two models you are using, they are both as likely to provide an accurate share price.
Figure 4.12 – Distribution of share prices in the industry “Fast Moving Consumer Goods”
DDM 50%
FCFE 50%
Industrial Goods & Services
DDM 67%
FCFE 33%
Fast Moving Consumer Goods
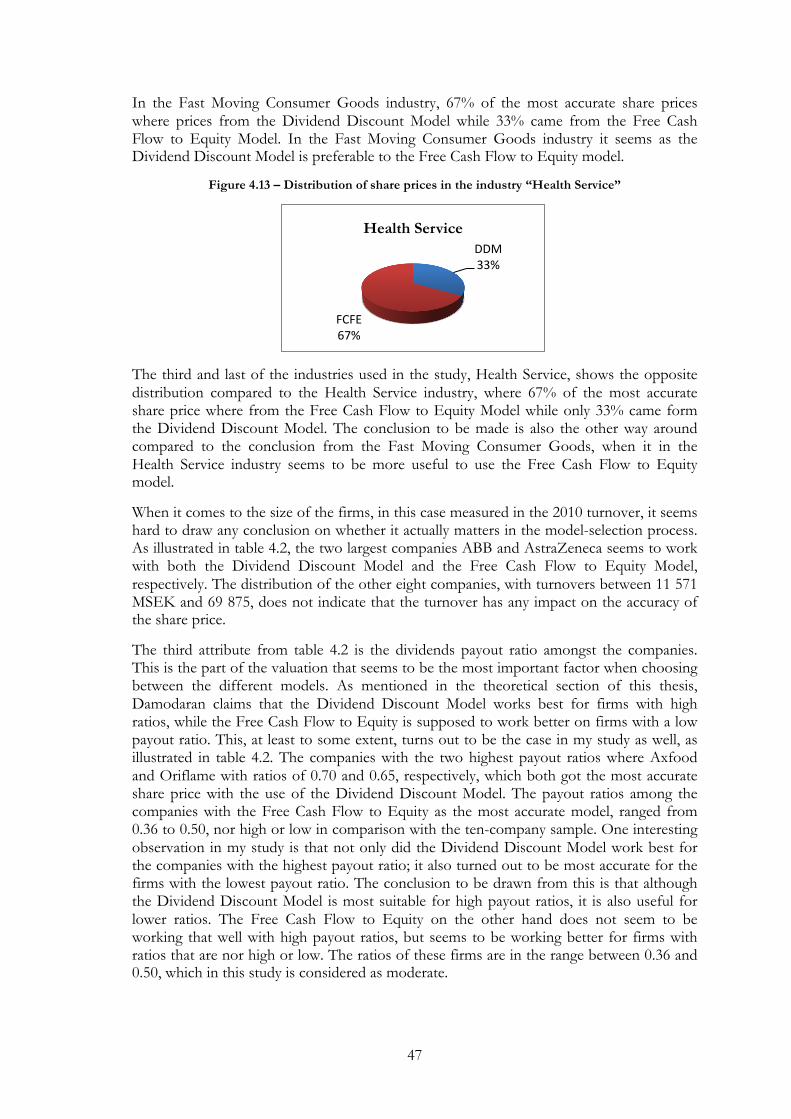
47
In the Fast Moving Consumer Goods industry, 67% of the most accurate share prices where prices from the Dividend Discount Model while 33% came from the Free Cash Flow to Equity Model. In the Fast Moving Consumer Goods industry it seems as the Dividend Discount Model is preferable to the Free Cash Flow to Equity model.
Figure 4.13 – Distribution of share prices in the industry “Health Service”
The third and last of the industries used in the study, Health Service, shows the opposite distribution compared to the Health Service industry, where 67% of the most accurate share price where from the Free Cash Flow to Equity Model while only 33% came form the Dividend Discount Model. The conclusion to be made is also the other way around compared to the conclusion from the Fast Moving Consumer Goods, when it in the Health Service industry seems to be more useful to use the Free Cash Flow to Equity model.
When it comes to the size of the firms, in this case measured in the 2010 turnover, it seems hard to draw any conclusion on whether it actually matters in the model-selection process. As illustrated in table 4.2, the two largest companies ABB and AstraZeneca seems to work with both the Dividend Discount Model and the Free Cash Flow to Equity Model, respectively. The distribution of the other eight companies, with turnovers between 11 571 MSEK and 69 875, does not indicate that the turnover has any impact on the accuracy of the share price.
The third attribute from table 4.2 is the dividends payout ratio amongst the companies. This is the part of the valuation that seems to be the most important factor when choosing between the different models. As mentioned in the theoretical section of this thesis, Damodaran claims that the Dividend Discount Model works best for firms with high ratios, while the Free Cash Flow to Equity is supposed to work better on firms with a low payout ratio. This, at least to some extent, turns out to be the case in my study as well, as illustrated in table 4.2. The companies with the two highest payout ratios where Axfood and Oriflame with ratios of 0.70 and 0.65, respectively, which both got the most accurate share price with the use of the Dividend Discount Model. The payout ratios among the companies with the Free Cash Flow to Equity as the most accurate model, ranged from 0.36 to 0.50, nor high or low in comparison with the ten-company sample. One interesting observation in my study is that not only did the Dividend Discount Model work best for the companies with the highest payout ratio; it also turned out to be most accurate for the firms with the lowest payout ratio. The conclusion to be drawn from this is that although the Dividend Discount Model is most suitable for high payout ratios, it is also useful for lower ratios. The Free Cash Flow to Equity on the other hand does not seem to be working that well with high payout ratios, but seems to be working better for firms with ratios that are nor high or low. The ratios of these firms are in the range between 0.36 and 0.50, which in this study is considered as moderate.
DDM 33%
FCFE 67%
Health Service

48
Although conclusions have been made in this last section it is important to note that they are based on this thesis alone and are not to be made general. The conclusions are based on a small sample of only ten companies, using only two models among hundreds available models for valuation. The previous studies that Damodaran (2002) provides are done by using a sample of 250 companies over a longer period of time, why the results may be more obvious. However, although only using ten companies, the study conducted in this thesis does indeed indicate that there are attributes among companies that may be important in the process of valuation. Further, as illustrated in table 4.1, the Dividend Discount Model has proven to be the model resulting in the most accurate share price (while the distribution of accurate prices where 50/50 between DDM and FCFE).

49
5 Conclusion The fifth and last part of this thesis consists of concluding thoughts on the thesis as a whole in relation to the purpose from the introduction section. Along with the concluding thoughts from the thesis, some of the implications that have been encountered will be discussed in this section in order to make suggestions for any future studies on the subject.
5.1 Conclusions in relation to the purpose
As states in the introductory part of the thesis, this thesis consists of a series of computations made on publicly traded companies from Sweden. The sample consists of ten Swedish companies currently listed on Nasdaq OMX Stockholm that which differ from each other when it comes to their size, maturity, line of business and other financial attributes as dividend policies and growth rates. Since the two valuation models used, the Dividend Discount Model and the Free Cash Flow to Equity, are both in need of assumptions on the companies’ future growth rates a quick analysis on each firm, based on my own calculations along with their own future prospects, were made. The empirical findings that have been made are based on the theoretical framework consisting of theories and models collected from different financial literature.
The purpose of the thesis was to establish which one of these two valuation models that gave me the most accurate share price, in comparison to the actual market price of each share. The computed share prices have further been compared to those computed and recommended by profession analysts this is done in order for me to see if my results were valid and reliable.
Although my sample only consisted of ten different firms I have been able to draw some valid conclusions about their share prices. I found that the Dividend Discount Model gave me the most accurate share prices when compared to the companies’ actual market share prices. When it comes to the different financial attributes held by the companies I conclude that the size of the firm, in terms of turnover, does not have any impact on the choice between using the Dividend Discount Model or the Free Cash Flow to Equity model. It does however seem that some industries are more suitable for specific valuation models, where the most accurate share prices amongst the Fast Moving Consumer Goods industry firms came from the Dividend Discount Model, the Health Service industry firms seems to more suited for the Free Cash Flow to Equity model. Based on my empirical findings it seems though that the firms in the Industrial Goods & Services industry are compatible with both the Dividend Discount Model and the Free Cash Flow to Firm. I further make the conclusion that the Dividend Discount Model is preferable for firms with a high dividend payout ratio, although it works just as good on firms with low ratios. The Free Cash Flow to Equity is however more suited for firms with dividend payout ratios in the range between 0.36 and 0.50. The final conclusion that was made from this is that the dividend payout ratio is more important to take into consideration than the sector in which the firm operates when evaluating the firm value.
As mentioned previously, since the conclusions are based on a sample of ten companies evaluated with two valuation models, the conclusions are in no way general, but they serve the purpose of this particular thesis and I therefore see them as valid and reliable.
50
5.2 Implications and suggestions for future studies Since this thesis was done during a predetermined period of time a series of delimitations have been made. The sample of companies got limited to only ten, and the valuation models to just two. Since the process of valuation requires a massive amount of data and a series of assumption delimitations also had to be made with the purpose of reducing the data and the margin of error.
Even though this thesis resulted in valid conclusions about the model-selection process when evaluating a firms share price there are a lot of things that could have been done differently, or can be in future studies in the line of firm valuation.
Since the results have been compared to the target prices set by different financial analysts it would have been interesting to perform an interview session with some of them in order to find out more about their process of valuation. In that case the theoretical framework could be based on a combination of literature and real hands-on information. Although they might hold back on their information, a more valid sense of their future prospects could have been obtained. It might be the case that they look at completely different attributes of the companies, since many of these analysts have it as their occupation to analyse that specific firm or industry.
As always when conducting a study on a sample it would be interesting to see if the same conclusions could be made if the sample were to increase. The aim can for example be to evaluate a whole industry, or the entire Swedish stock market, and see which of the two models that gives the most accurate share prices. Since I have been able to end up with valid results and conclusions from only a ten company sample it would have been interesting to see how it would look like with a larger sample, would the results be even clearer or is the ten company sample enough? If I were to do similar thesis on firm valuation, I would choose a larger sample of firms, and perhaps add some valuation models in order to further strengthen my conclusions.

51
6 References ABB, (2006). Annual report 2006. Retrieved 2011-04-01
ABB, (2007). Annual report 2007. Retrieved 2011-04-01
ABB, (2008). Annual report 2008. Retrieved 2011-04-01
ABB, (2009). Annual report 2009. Retrieved 2011-04-01
ABB, (2010). Annual report 2010. Retrieved 2011-04-01
ABB, (2011). About ABB. Retrieved 2011-04-01 from, http://www.abb.com/cawp/abbzh252/e1d71cc7979eaf7fc1256ae700474df0.aspx Alvesson, M., & Sköldberg, K., 2008. Tolkning och Reflektion – Vetenskapsfilosofi och kvalitativ metod, 2nd Edition, Lund: Studentlitteratur
Bureau Van Dijk, Amadeus Database, (2011). ABB. Retrieved 2011-04-01 from, http://www.bvdinfo.com/Home.aspx
Bureau Van Dijk, Amadeus Database, (2011). ASSA Abloy. Retrieved 2011-04-01 from, http://www.bvdinfo.com/Home.aspx
Bureau Van Dijk, Amadeus Database, (2011). AstraZeneca. Retrieved 2011-04-01 from, http://www.bvdinfo.com/Home.aspx
Bureau Van Dijk, Amadeus Database, (2011). Atlas Copco. Retrieved 2011-04-01 from, http://www.bvdinfo.com/Home.aspx
Bureau Van Dijk, Amadeus Database, (2011). Axfood. Retrieved 2011-04-01 from, http://www.bvdinfo.com/Home.aspx
Bureau Van Dijk, Amadeus Database, (2011). Getinge. Retrieved 2011-04-01 from, http://www.bvdinfo.com/Home.aspx
Bureau Van Dijk, Amadeus Database, (2011). Meda. Retrieved 2011-04-01 from, http://www.bvdinfo.com/Home.aspx
Bureau Van Dijk, Amadeus Database, (2011). NCC. Retrieved 2011-04-01 from, http://www.bvdinfo.com/Home.aspx
Bureau Van Dijk, Amadeus Database, (2011). Oriflame. Retrieved 2011-04-01 from, http://www.bvdinfo.com/Home.aspx
Bureau Van Dijk, Amadeus Database, (2011). Swedish Match. Retrieved 2011-04-01 from, http://www.bvdinfo.com/Home.aspx
Arends, B. “Can you trust Wall Street’s top picks?” 2011, Retrieved 2011-02-14 from, http://money.msn.com/how-to-invest/can-you-trust-wall-streets-top-stocks-wsj.aspx
ASSA Abloy, (2006). Annual report 2006. Retrieved 2011-04-01
ASSA Abloy, (2007). Annual report 2007. Retrieved 2011-04-01
ASSA Abloy, (2008). Annual report 2008. Retrieved 2011-04-01

52
ASSA Abloy, (2009). Annual report 2009. Retrieved 2011-04-01
ASSA Abloy, (2010). Annual report 2010. Retrieved 2011-04-01
ASSA Abloy, (2011). About ASSA Abloy. Retrieved 2011-04-01 from, http://www.assaabloy.com/en/com/About-ASSA-ABLOY/
AstraZeneca, (2006). Annual report 2006. Retrieved 2011-04-01
AstraZeneca, (2007). Annual report 2007. Retrieved 2011-04-01
AstraZeneca, (2008). Annual report 2008. Retrieved 2011-04-01
AstraZeneca, (2009). Annual report 2009. Retrieved 2011-04-01
AstraZeneca, (2010). Annual report 2010. Retrieved 2011-04-01
AstraZeneca, (2011). About Us. Retrieved 2011-04-01 from, http://www.astrazeneca.com/About-Us
Atlas Copco, (2006). Annual report 2006. Retrieved 2011-04-01
Atlas Copco, (2007). Annual report 2007. Retrieved 2011-04-01
Atlas Copco, (2008). Annual report 2008. Retrieved 2011-04-01
Atlas Copco, (2009). Annual report 2009. Retrieved 2011-04-01
Atlas Copco, (2010). Annual report 2010. Retrieved 2011-04-01
Atlas Copco, (2011). The Atlas Copco Group. Retrieved 2011-04-01 from, http://www.atlascopco.com/us/AtlasCopcogroup/
Avanza Bank, (2011). ABB. Retrieved 2011-04-01 from, https://www.avanza.se/aza/aktieroptioner/kurslistor/aktie.jsp?orderbookId=183834
Avanza Bank, (2011). ASSA Abloy. Retrieved 2011-04-01 from, https://www.avanza.se/aza/aktieroptioner/kurslistor/aktie.jsp?orderbookId=183833
Avanza Bank, (2011). AstraZeneca. Retrieved 2011-04-01 form, https://www.avanza.se/aza/aktieroptioner/kurslistor/aktie.jsp?orderbookId=183831
Avanza Bank, (2011). Atlas Copco. Retrieved 2011-04-01 from, https://www.avanza.se/aza/aktieroptioner/kurslistor/aktie.jsp?orderbookId=183832
Avanza Bank, (2011). Axfood. Retrieved 2011-04-01 from, https://www.avanza.se/aza/aktieroptioner/kurslistor/aktie.jsp?orderbookId=216967
Avanza Bank, (2011). Getinge. Retrieved 2011-04-01 from, https://www.avanza.se/aza/aktieroptioner/kurslistor/aktie.jsp?orderbookId=216088
Avanza Bank, (2011). Meda. Retrieved 2011-04-01 from, https://www.avanza.se/aza/aktieroptioner/kurslistor/aktie.jsp?orderbookId=214108
Avanza Bank, (2011). NCC. Retrieved 2011-04-01 from, https://www.avanza.se/aza/aktieroptioner/kurslistor/aktie.jsp?orderbookId=216953
53
Avanza Bank, (2011). Oriflame. Retrieved 2011-04-01 from, https://www.avanza.se/aza/aktieroptioner/kurslistor/aktie.jsp?orderbookId=216964
Avanza Bank, (2011). Swedish Match. Retrieved 2011-04-01 from, https://www.avanza.se/aza/aktieroptioner/kurslistor/aktie.jsp?orderbookId=184098
Axfood, (2006). Annual report 2006. Retrieved 2011-04-01
Axfood, (2007). Annual report 2007. Retrieved 2011-04-01
Axfood, (2008). Annual report 2008. Retrieved 2011-04-01
Axfood, (2009). Annual report 2009. Retrieved 2011-04-01
Axfood, (2010). Annual report 2010. Retrieved 2011-04-01
Axfood, (2011). About Axfood. Retrieved 2011-04-01 from, http://www.axfood.se/en/About-Axfood/
Barker, R, 2001. Determining Value – Valuation Models and Financial Statements, Harlow: Pearson Education Limited
BNP/Kvartal 2010:4, March 2011. Statistiska Centralbyrån (SCB). Retrieved 2011-05-05 from, http://www.scb.se/statistik/_publikationer/NR0103_2010K04_TI_NR01TI1101.pdf
Central Intelligence Agency (CIA). The World Factbook. Retrieved 2011-05-20 from, https://www.cia.gov/library/publications/the-world-factbook/
Copeland, T. et al., 2000. Valuation: Measuring and Managing the Value of Companies, 3rd Edition, New York: John Wiley & Sons
Damodaran, A, 2001. Corporate Finance, Theory and Practice, 2nd Edition, New York: John Wiley & Sons, Inc.
Damodaran, A, 2002. Investment Valuation, Tools and Techniques for Determining The Value of Any Asset, 2nd Edition, New York: John Wiley & Sons, Inc.
Frykman, D., & Tolleryd, J., 2003. Corporate Valuation – An Easy Guide to Measuring the Value of any Asset, 2nd Edition. Glasgow: Pearson Education Limited
Getinge, (2006). Annual report 2006. Retrieved 2011-04-01
Getinge, (2007). Annual report 2007. Retrieved 2011-04-01
Getinge, (2008). Annual report 2008. Retrieved 2011-04-01
Getinge, (2009). Annual report 2009. Retrieved 2011-04-01
Getinge, (2010). Annual report 2010. Retrieved 2011-04-01
Getinge, (2011). The Getinge Group in Brief. Retrieved 2011-04-01 from, http://www.getingegroup.com/en/About-Getinge-Group-name/
Hagstrom, R, 2005. The Warren Buffett Way, 2nd Edition, New Jersey: John Wiley & Sons
Holme, I., & Solvang, B., 1997. Forskningsmetodik – Om kvalitativa och kvantitativa metoder, 2nd Edition, Lund: Studentlitteratur
54
Hoover, S, 2005. Stock Valuation, An Essential Guide to Wall Street’s Most Popular Valuation Models, New York: McGraw-Hill
Hult, M, 1998. Värdering av företag, 3rd Edition, Malmö: Liber Ekonomi
Koller, T. et al., 2010. Valuation – Measuring and Managing the Value of Companies, 5th Edition, New Jersey: John Wiley & Sons
Mason, J, 2002. Qualitative Researching, 2nd Edition, London: SAGE Publications Ltd
Meda, (2006). Annual report 2006. Retrieved 2011-04-01
Meda, (2007). Annual report 2007. Retrieved 2011-04-01
Meda, (2008). Annual report 2008. Retrieved 2011-04-01
Meda, (2009). Annual report 2009. Retrieved 2011-04-01
Meda, (2010). Annual report 2010. Retrieved 2011-04-01
Meda, (2011). About Meda. Retrieved 2011-04-01 from, http://www.meda.se/about-meda/
NCC, (2006). Annual report 2006. Retrieved 2011-04-01
NCC, (2007). Annual report 2007. Retrieved 2011-04-01
NCC, (2008). Annual report 2008. Retrieved 2011-04-01
NCC, (2009). Annual report 2009. Retrieved 2011-04-01
NCC, (2010). Annual report 2010. Retrieved 2011-04-01
NCC, (2011). About the NCC Group. Retrieved 2011-04-01 from, http://ncc.se/en/About-NCC/
ÖhrlingsPricewaterhouseCoopers, 2007. Företagsvärdering – översikt av området baserat på erfarenhet, 2nd Edition, Hungary
Oriflame, (2006). Annual report 2006. Retrieved 2011-04-01
Oriflame, (2007). Annual report 2007. Retrieved 2011-04-01
Oriflame, (2008). Annual report 2008. Retrieved 2011-04-01
Oriflame, (2009). Annual report 2009. Retrieved 2011-04-01
Oriflame, (2010). Annual report 2010. Retrieved 2011-04-01
Oriflame, (2011). Om Oriflame. Retrieved 2011-04-01 from, http://se.oriflame.com/about-oriflame/index.jhtml
Perrakis, R. et al, 2000. Investment Analysis, New York: McGraw-Hill
PWC, “Riskpremien på den svenska aktiemarknaden, March 2011”. Retrieved 2011-04-12 from, http://www.pwc.com/sv_SE/se/publikationer/assets/pdf/riskpremiestudien-2011.pdf
Ross, S. et al, 2008. Corporate Finance Fundamentals, 8th Edition, New York: McGraw-Hill
55
Saunders, M., Lewis, P., & Thonhill, A., 2009. Research methods for business students, 5th Edition, Edinburgh: Pearson Education Limited
Statistics Sweden, SCB. “Shareholder statistics, June 2010”, Statistics Sweden and Swedish Financial Supervisory Authority, Vol. 2010, Issue 223, 2010
Statistics Sweden, SCB. The Swedish Economy. Retrieved 2011-05-02 from, http://www.scb.se/Pages/TableAndChart____32290.aspx
Swedish Match, (2006). Annual report 2006. Retrieved 2011-04-01
Swedish Match, (2007). Annual report 2007. Retrieved 2011-04-01
Swedish Match, (2008). Annual report 2008. Retrieved 2011-04-01
Swedish Match, (2009). Annual report 2009. Retrieved 2011-04-01
Swedish Match, (2010). Annual report 2010. Retrieved 2011-04-01
Swedish Match, (2011). Our Company. Retrieved 2011-04-01 from, http://www.swedishmatch.com/en/Our-company/
The World Bank 2011, Data by country: Sweden. Retrieved 2011-05-22 from, http://data.worldbank.org/country/sweden
Tirole, J, 2006. The Theory of Corporate Finance, Princeton: Princeton University Press
William, M. Crilly, & Andrew, J. Sherman, 2010. The AMA Handbook of Due Diligence, New York: American Management Association
Yahoo Finance, (2011). ABB. Retrieved 2011-04-01 from, http://finance.yahoo.com/q?s=ABB.ST&ql=0
Yahoo Finance, (2011). ASSA Abloy. Retrieved 2011-04-01 from, http://finance.yahoo.com/q?s=ASSA-B.ST&ql=0
Yahoo Finance, (2011). AstraZeneca. Retrieved 2011-04-01 from, http://finance.yahoo.com/q?s=AZN.ST&ql=0
Yahoo Finance, (2011). Atlas Copco. Retrieved 2011-04-01 from, http://finance.yahoo.com/q?s=ATCO-B.ST&ql=0
Yahoo Finance, (2011). Axfood. Retrieved 2011-04-01 from, http://finance.yahoo.com/q?s=AXFO.ST&ql=0
Yahoo Finance, (2011). Getinge. Retrieved 2011-04-01 from, http://finance.yahoo.com/q?s=GETI-B.ST&ql=0
Yahoo Finance, (2011). Meda. Retrieved 2011-04-01 from, http://finance.yahoo.com/q?s=MEDA-A.ST&ql=0
Yahoo Finance, (2011). NCC. Retrieved 2011-04-01 from, http://finance.yahoo.com/q?s=NCC-B.ST&ql=0
Yahoo Finance, (2011). Oriflame. Retrieved 2011-04-01 from, http://finance.yahoo.com/q?s=ORI-SDB.ST&ql=0

56
Yahoo Finance, (2011). Swedish Match. Retrieved 2011-04-01 from, http://finance.yahoo.com/q?s=SWMA.ST&ql=0

57
Appendices
Appendix 1
ABB 2006 2007 2008 2009 2010 (MSEK, except per share data)
Net Income 11120
30056
24944
23208
20488 Capital Expenditure 4448.00
6120.00
9368.00
7736.00
6720.00
Depreciation 4560.00
4816.00
5288.00
5240.00
5616.00
Change in WC 584.00
7328.00
7640.00
-11736.00
5872.00
Change in interest bearing liabilities -
6184.00
-8176.00
-1032.00
1304.00
-8264.00
Change
Change
Change
Change
Free cash-flow to equity 4464 8784 13248 -1056 12192 21560 33752 -
28504 5248
2006 2007 2008 2009 2010 Dividends per share (DPS) 0.72 1.34 2.79 3.34 3.64 Earnings per share (EPS) 5.20 13.28 10.88 10.16 8.96 Payout ratio 0.14 0.10 0.26 0.33 0.41
Total FCFE 68904 Total growth 784 Average growth 0.011
ROE 2010 0.21 Retention ratio 2010 0.59 Expected growth in FCFE 2010-
2011 0.125
Risk-free rate 0.030 Market risk premium 0.045
Beta 0.82
Cost of equity 0.067
Year EPS
Growth rate
2006 5.2 2007 13.28 1.554
2008 10.88 -0.181 2009 10.16 -0.066 2010 8.96 -0.118 Geometric average
0.146
Arithmetic average
0.297
Appendix 2 Gordon Growth
Value of stock
Stable growth 0.046 182.17 Market Cap
46740
Constant Growth FCFE Value of equity Value of stock
Stable growth 0.046 262651 1023.72
Shares outstanding 256565586
Appendix 3 Date Company Target Price 2-Dec-10 UBS 153 sek 15-Dec-10 ING Financial Markets 184 sek

58
18-Jan-11 Exane BNP Paribas 163 sek 21-Jan-11 Goldman, Sachs & Co 248 sek
Appendix 4
AstraZeneca 2006 2007 2008 2009 2010
(MSEK, except per share data)
Net Income 35136
45016
49040
21264
30840
Capital Expenditure 82856.00
129872.00
116912.00
91632.00
90231.00
Depreciation 59640.00
52280.00
60568.00
62888.00
74432.00
Change in WC -
10872.00
-3544.00
-14640.00
-10632.00
656.00
Change in interest bearing liabilities -192.00
66760.00
8528.00
3736.00
-320.00
Change
Change
Change
Change
Free cash-flow to equity 22600 15128 37728 -
21864 15864 -8976 6888 7177 14065
2006 2007 2008 2009 2010
Dividends per share (DPS) 12.20 12.10 15.38 16.84 17.11
Earnings per share (EPS) 27.41 27.18 38.21 37.99 41.00
Payout ratio 0.45 0.45 0.40 0.44 0.42 Average
0.43
Total FCFE 97145
Total growth -8535
Average growth -0.088
ROE 2010 0.3784
Retention ratio 2010 0.58 Expected growth in FCFE 2010-
2011 0.220
Risk-free rate 0.030
Market risk premium 0.045
Beta 0.90 1.00
Cost of equity 0.071 0.075
Year EPS Growth rate
2006 27.41
2007 27.18 -0.008
2008 38.21 0.406
2009 37.99 -0.006
2010 41 0.079
Geometric average
0.106
Arithmetic average
0.118
Appendix 5
Two-stage DDM
Initial 5-year High Growth 12%
Perpetual Stable Growth 2.50%
DPS 2010 17.11

59
Cost of equity high growth 0.034
PV of Dividends 109.42
Value at 2015
Expected EPS 2016 74.06
Expected DPS 2016 31.90
Terminal Price 637.98
PV of Terminal Price 453.81
Value of per share 563.22
Two-stage FCFE
EPS 2016 74.06
Equity reinv. 2016 42.16
Exp. FCFE 2016 31.90 Terminal Value of equity in
sek 701,072,438
PV
FCFE 2011 15753 14715
FCFE 2012 17643 16481
FCFE 2013 19760 18459
FCFE 2014 22132 20674
FCFE 2015 24787 23155
Sum of PV FCFE in sek 93,484,478,181
Shares outstanding 242,757,885
Cumulative value per share 94,185,550,619
Value per share 387.98
Appendix 6
Date Company Target Price
17-Dec-10 Deutsche Bank 339 SEK
21-Dec-10 Goldman, Sachs & Co 353 SEK
18-Jan-11 Royal Bank of Scotland 346 SEK
18-Jan-11 Bank of America Merrill Lynch 362 SEK
Appendix 7
Atlas Copco 2006 2007 2008 2009 2010 (MSEK, except per share data)
Net Income 6442
8446
9664
6363
9944 Capital Expenditure 2775.00
2950.00
3628.00
2428.00
1044.00
Depreciation 623.00
731.00
891.00
1005.00
3282.00
Change in WC -
2045.00
-2326.00
-2291.00
6715.00
-1730.00
Change in interest bearing liabilities -
1045.00
12401.00
1414.00
3152.00
4231.00
Change
Change
Change
Change
Free cash-flow to equity 5290 15664 20954
-10322 10632 -9255 1377 16766 18143

60
2006 2007 2008 2009 2010
Dividends per share (DPS) 2.38 3.00 3.00 3.00 4.00 Earnings per share (EPS) 12.24 6.09 8.33 5.13 8.15 Payout ratio 0.19 0.49 0.36 0.58 0.49 Average
0.42 Total FCFE 56396
Total growth 12853
Average growth 0.228
ROE 2010 0.363 Retention ratio 2010 0.509 Expected growth in FCFE 2010-
2011 0.185
Risk-free rate 0.030 Market risk premium 0.045 Beta 1.24 1.00
Cost of equity 0.086 0.075
Year EPS
Growth rate
2006 12.24 2007 6.09 -0.502
2008 8.33 0.368 2009 5.13 -0.384 2010 8.15 0.589 Geometric average
-0.097
Arithmetic average
0.017
Appendix 8
Two-stage DDM Initial 5-year High Growth 15%
Perpetual Stable Growth 2.50%
DPS 2010 4 Cost of equity high growth 0.086 PV of Dividends 23.84
Value at 2015 Expected EPS 2016 16.80
Expected DPS 2016 8.25 Terminal Price 164.93 PV of Terminal Price 114.88
Value of per share 138.72
Two-stage FCFE
EPS 2016 16.80 Equity reinv. 2016 9.67 Exp. FCFE 2016 per share 7.13 Terminal Value of equity in
sek 117,328,786
PV FCFE 2011 20864 19216 FCFE 2012 23994 22098 FCFE 2013 27593 25413 FCFE 2014 31732 29225 FCFE 2015 36492 33608

61
Sum of PV FCFE in sek 129,559,842,026
Shares outstanding 839,394,096
Cumulative value per share 129,677,170,812 Value per share 154.49
Appendix 9 Date Company Target Price 6-Dec-10 Morgan Stanley 190 SEK 8-Dec-10 Exane BNP Paribas 180 SEK 10-Jan-11 Societe Generale 200 SEK 12-Jan-11 UniCredit 165 SEK
Appendix 10
ASSA Abloy 2006 2007 2008 2009 2010 (MSEK, except per share data)
Net Income 1756
3368
2438
2659
4080 Capital Expenditure 739.00
751.00
829.00
664.00
1102.00
Depreciation 898.00
909.00
921.00
1014.00
421.00 Change in WC -‐704.00
-‐25.00
-‐5.00
1460.00
743.00
Change in interest bearing liabilities 3500.00
803.00
-‐345.00
-‐195.00
-‐934.00
Change
Change
Change
Change Free cash-‐flow to equity 6119 -‐1765 4354 -‐2164 2190 -‐836 1354 368 1722
2006 2007 2008 2009 2010
Dividends per share (DPS) 3.25 3.60 3.60 3.60 4.00 Earnings per share (EPS) 7.99 9.02 9.21 9.22 10.89
Payout ratio 0.41 0.40 0.39 0.39 0.37 Average
0.39
Total FCFE 15739 Total growth -‐4397 Average growth -‐0.279
ROE 2010 0.203 Retention ratio 2010 0.633 Expected growth in FCFE 2010-‐
2011 0.129
Risk-‐free rate 0.030 Market risk premium 0.045 Beta 0.92 1.00
Cost of equity 0.071 0.075
Year EPS
Growth rate
2006 7.99 2007 9.02 0.129
2008 9.21 0.021 2009 9.22 0.001 2010 10.89 0.181 Geometric average
0.080
Arithmetic average
0.083
Appendix 11
Gordon Growth Value of stock
Stable growth 5% 196.26

62
Market Cap
68510
Constant Growth FCFE
Value of equity
Value of stock
Stable growth 5% 84491 242.04
Shares outstanding 349,075,055
Appendix 12
Date Company Target Price
7-‐Dec-‐10 CA Cheuvreux 230 SEK 21-‐Dec-‐10 Credit Suisse 220 SEK 10-‐Jan-‐11 JP Morgan 195 SEK
11-‐Jan-‐11 SG Equity Research 165 SEK
Appendix 13
Axfood 2006 2007 2008 2009 2010 (MSEK, except per share data)
Net Income 852
781
737
793
862
Capital Expenditure 587.00
576.00
1158.00
633.00
404.00
Depreciation 458.00
459.00
508.00
513.00
843.00
Change in WC -10.00
6.00
-14.00
142.00
-214.00
Change in interest bearing liabilities -
261.00
500.00
427.00
-146.00
142.00
Change
Change
Change
Change Free cash-flow to equity 472 686 1158 -630 528 -143 385 1272 1657
2006 2007 2008 2009 2010
Dividends per share (DPS) 12.00 12.00 8.00 10.00 12.00 Earnings per share (EPS) 16.03 14.88 14.05 15.13 16.42
Payout ratio 0.75 0.81 0.57 0.66 0.73 Average
0.70 Total FCFE 4200
Total growth 1185
Average growth 0.282
ROE 2010 0.31 Retention ratio 2010 0.27 Expected growth in FCFE 2010-
2011 0.083
Risk-free rate 0.030 Market risk premium 0.045 Beta 0.50 1.00
Cost of equity 0.052 0.075
Year EPS
Growth rate
2006 16.03 2007 14.88 -0.072
2008 14.05 -0.056 2009 15.13 0.077 2010 16.42 0.085 Geometric average
0.006
Arithmetic average
0.009
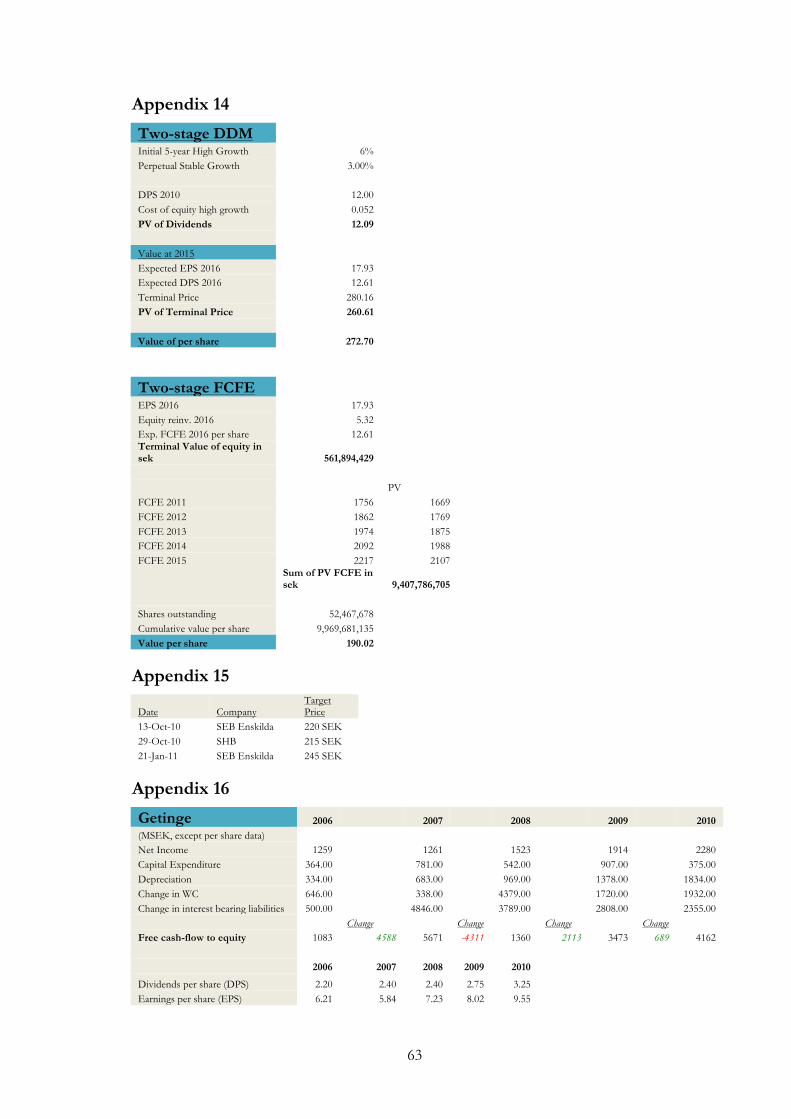
63
Appendix 14
Two-stage DDM Initial 5-year High Growth 6%
Perpetual Stable Growth 3.00%
DPS 2010 12.00 Cost of equity high growth 0.052 PV of Dividends 12.09
Value at 2015 Expected EPS 2016 17.93
Expected DPS 2016 12.61 Terminal Price 280.16 PV of Terminal Price 260.61
Value of per share 272.70
Two-stage FCFE
EPS 2016 17.93 Equity reinv. 2016 5.32 Exp. FCFE 2016 per share 12.61 Terminal Value of equity in
sek 561,894,429
PV FCFE 2011 1756 1669 FCFE 2012 1862 1769 FCFE 2013 1974 1875 FCFE 2014 2092 1988 FCFE 2015 2217 2107
Sum of PV FCFE in sek 9,407,786,705
Shares outstanding 52,467,678
Cumulative value per share 9,969,681,135 Value per share 190.02
Appendix 15
Date Company Target Price
13-Oct-10 SEB Enskilda 220 SEK 29-Oct-10 SHB 215 SEK 21-Jan-11 SEB Enskilda 245 SEK
Appendix 16
Getinge 2006 2007 2008 2009 2010 (MSEK, except per share data)
Net Income 1259
1261
1523
1914
2280 Capital Expenditure 364.00
781.00
542.00
907.00
375.00
Depreciation 334.00
683.00
969.00
1378.00
1834.00 Change in WC 646.00
338.00
4379.00
1720.00
1932.00
Change in interest bearing liabilities 500.00
4846.00
3789.00
2808.00
2355.00
Change
Change
Change
Change
Free cash-flow to equity 1083 4588 5671 -4311 1360 2113 3473 689 4162
2006 2007 2008 2009 2010 Dividends per share (DPS) 2.20 2.40 2.40 2.75 3.25 Earnings per share (EPS) 6.21 5.84 7.23 8.02 9.55

64
Payout ratio 0.35 0.41 0.33 0.34 0.34 Average
0.36
Total FCFE 15749 Total growth 3079
Average growth 0.20
ROE 2010 0.177 Retention ratio 2010 0.66 Expected growth in FCFE 2010-
2011 0.117
Risk-free rate 0.030 Market risk premium 0.045 Beta 0.78 1.00
Cost of equity 0.065 0.075
Year EPS
Growth rate
2006 6.21 2007 5.84 -1.370
2008 7.23 0.238 2009 8.02 0.109 2010 9.55 0.191 Geometric average
0.114
Arithmetic average
-0.208
Appendix 17
Two-stage DDM Initial 5-year High Growth 15%
Perpetual Stable Growth 4.00%
DPS 2010 3.25 Cost of equity high growth 0.065 PV of Dividends 20.57
Value at 2015 Expected EPS 2016 19.98
Expected DPS 2016 7.11 Terminal Price 203.24 PV of Terminal Price 141.57
Value of per share 162.14
Two-stage FCFE
EPS 2016 19.98 Equity reinv. 2016 12.86 Exp. FCFE 2016 per share 7.11 Terminal Value of equity in
sek 283,397,298
PV FCFE 2011 4786 4494 FCFE 2012 5504 5168 FCFE 2013 6330 5943 FCFE 2014 7279 6834 FCFE 2015 8371 7860
Sum of PV FCFE in sek 30,298,619,263
Shares outstanding 222,383,327

65
Cumulative value per share 30,582,016,561 Value per share 137.52
Appendix 18
Date Company Target Price
10-Dec-10 JP Morgan 133 SEK 20-Jan-11 Jefferies & Company 155 SEK 28-Jan-11 S&P Equity 175 SEK 18-Jan-11 Danske Markets Equities 150 SEK
Appendix 19
Meda 2006 2007 2008 2009 2010 (MSEK, except per share data)
Net Income 788
833
954
1537
1428 Capital Expenditure 1483.00
1871.00
2270.00
1663.00
3024.00
Depreciation 379.00
779.00
1123.00
1834.00
2245.00 Change in WC -297.00
-424.00
-53.00
-231.00
-156.00
Change in interest bearing liabilities 1243.00
9762.00
1857.00
-932.00
56.00
Change
Change
Change
Change
Free cash-flow to equity 1224 8703 9927 -8210 1717 -710 1007 -146 861
2006 2007 2008 2009 2010 Dividends per share (DPS) 1.00 0.75 0.75 1.00 2.00 Earnings per share (EPS) 7.25 3.36 3.49 5.09 4.72 Payout ratio 0.14 0.22 0.21 0.20 0.42 Average
0.24 Total FCFE 14736
Total growth -363
Average growth -0.025
ROE 2010 0.105 Retention ratio 2010 0.58 Expected growth in FCFE 2010-
2011 0.060
Risk-free rate 0.030 Market risk premium 0.045 Beta 0.84 1.00
Cost of equity 0.068 0.075
Year EPS
Growth rate
2006 7.25 2007 3.36 -0.537
2008 3.49 0.039 2009 5.09 0.458 2010 4.72 -0.073 Geometric average
-0.102
Arithmetic average
-0.028
Appendix 20 Gordon Growth Value of stock Stable growth 2.5% 47.90
Market Cap
14477
Constant Growth FCFE
Value of equity
Value of stock
Stable growth 2.5% 20620 68.22
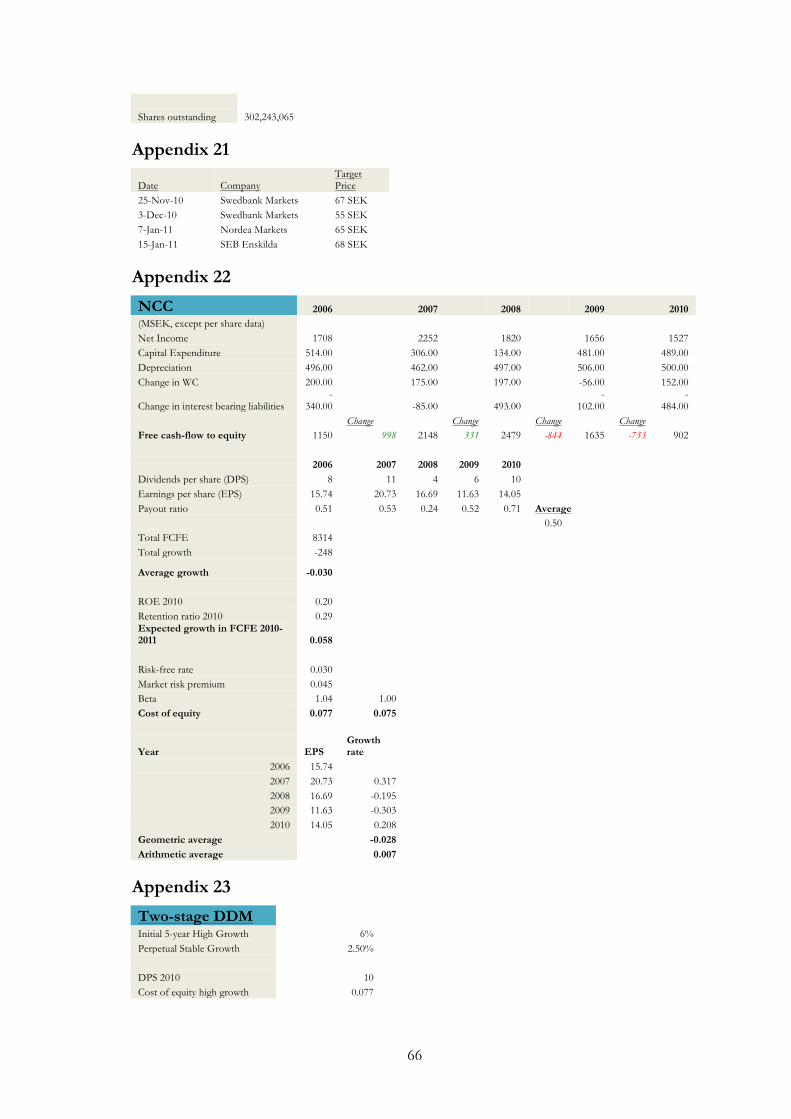
66
Shares outstanding 302,243,065
Appendix 21
Date Company Target Price
25-Nov-10 Swedbank Markets 67 SEK 3-Dec-10 Swedbank Markets 55 SEK 7-Jan-11 Nordea Markets 65 SEK 15-Jan-11 SEB Enskilda 68 SEK
Appendix 22
NCC 2006 2007 2008 2009 2010 (MSEK, except per share data)
Net Income 1708
2252
1820
1656
1527 Capital Expenditure 514.00
306.00
134.00
481.00
489.00
Depreciation 496.00
462.00
497.00
506.00
500.00 Change in WC 200.00
175.00
197.00
-56.00
152.00
Change in interest bearing liabilities -
340.00
-85.00
493.00
-102.00
-484.00
Change
Change
Change
Change Free cash-flow to equity 1150 998 2148 331 2479 -844 1635 -733 902
2006 2007 2008 2009 2010
Dividends per share (DPS) 8 11 4 6 10 Earnings per share (EPS) 15.74 20.73 16.69 11.63 14.05 Payout ratio 0.51 0.53 0.24 0.52 0.71 Average
0.50 Total FCFE 8314
Total growth -248
Average growth -0.030
ROE 2010 0.20 Retention ratio 2010 0.29 Expected growth in FCFE 2010-
2011 0.058
Risk-free rate 0.030 Market risk premium 0.045 Beta 1.04 1.00
Cost of equity 0.077 0.075
Year EPS
Growth rate
2006 15.74 2007 20.73 0.317
2008 16.69 -0.195 2009 11.63 -0.303 2010 14.05 0.208 Geometric average
-0.028
Arithmetic average
0.007
Appendix 23
Two-stage DDM Initial 5-year High Growth 6%
Perpetual Stable Growth 2.50%
DPS 2010 10 Cost of equity high growth 0.077
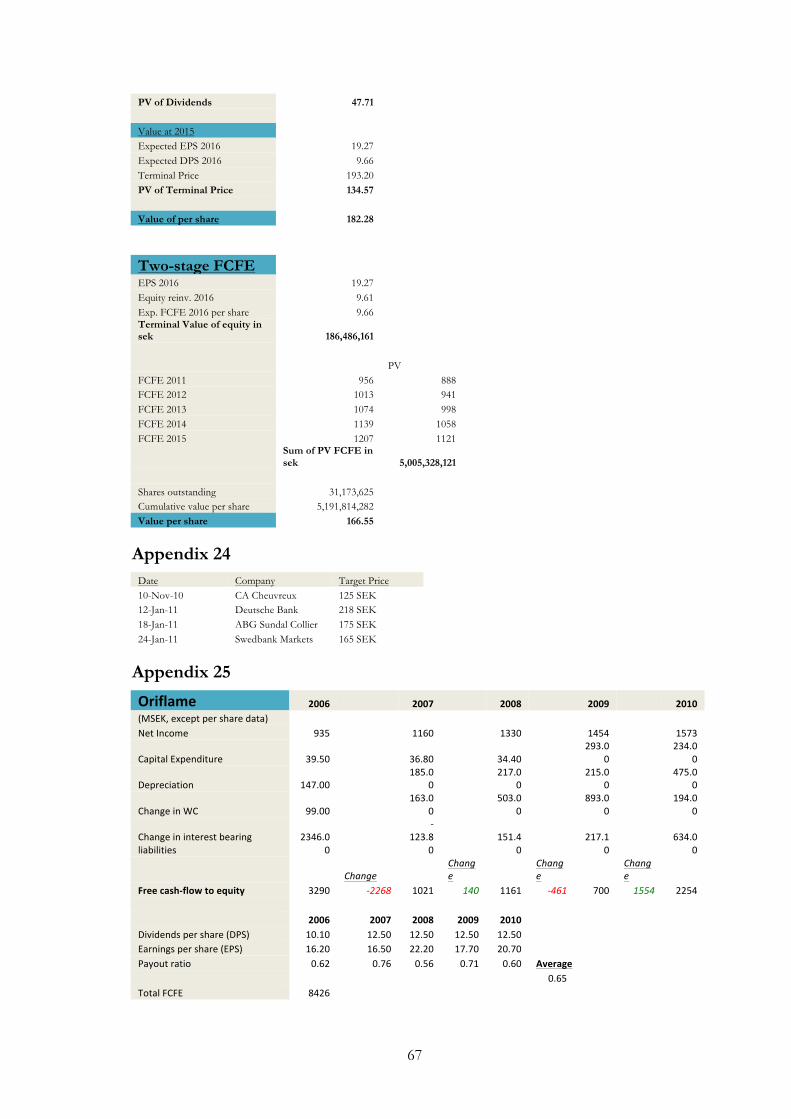
67
PV of Dividends 47.71
Value at 2015 Expected EPS 2016 19.27
Expected DPS 2016 9.66 Terminal Price 193.20 PV of Terminal Price 134.57
Value of per share 182.28
Two-stage FCFE
EPS 2016 19.27 Equity reinv. 2016 9.61 Exp. FCFE 2016 per share 9.66 Terminal Value of equity in
sek 186,486,161
PV FCFE 2011 956 888 FCFE 2012 1013 941 FCFE 2013 1074 998 FCFE 2014 1139 1058 FCFE 2015 1207 1121
Sum of PV FCFE in sek 5,005,328,121
Shares outstanding 31,173,625
Cumulative value per share 5,191,814,282 Value per share 166.55
Appendix 24 Date Company Target Price 10-Nov-10 CA Cheuvreux 125 SEK 12-Jan-11 Deutsche Bank 218 SEK 18-Jan-11 ABG Sundal Collier 175 SEK 24-Jan-11 Swedbank Markets 165 SEK
Appendix 25
Oriflame 2006 2007 2008 2009 2010 (MSEK, except per share data)
Net Income 935
1160
1330
1454
1573
Capital Expenditure 39.50
36.80
34.40
293.00
234.00
Depreciation 147.00
185.00
217.00
215.00
475.00
Change in WC 99.00
163.00
503.00
893.00
194.00
Change in interest bearing liabilities
2346.00
-‐123.8
0
151.40
217.10
634.00
Change
Change
Change
Change
Free cash-‐flow to equity 3290 -‐2268 1021 140 1161 -‐461 700 1554 2254
2006 2007 2008 2009 2010 Dividends per share (DPS) 10.10 12.50 12.50 12.50 12.50 Earnings per share (EPS) 16.20 16.50 22.20 17.70 20.70 Payout ratio 0.62 0.76 0.56 0.71 0.60 Average
0.65 Total FCFE 8426
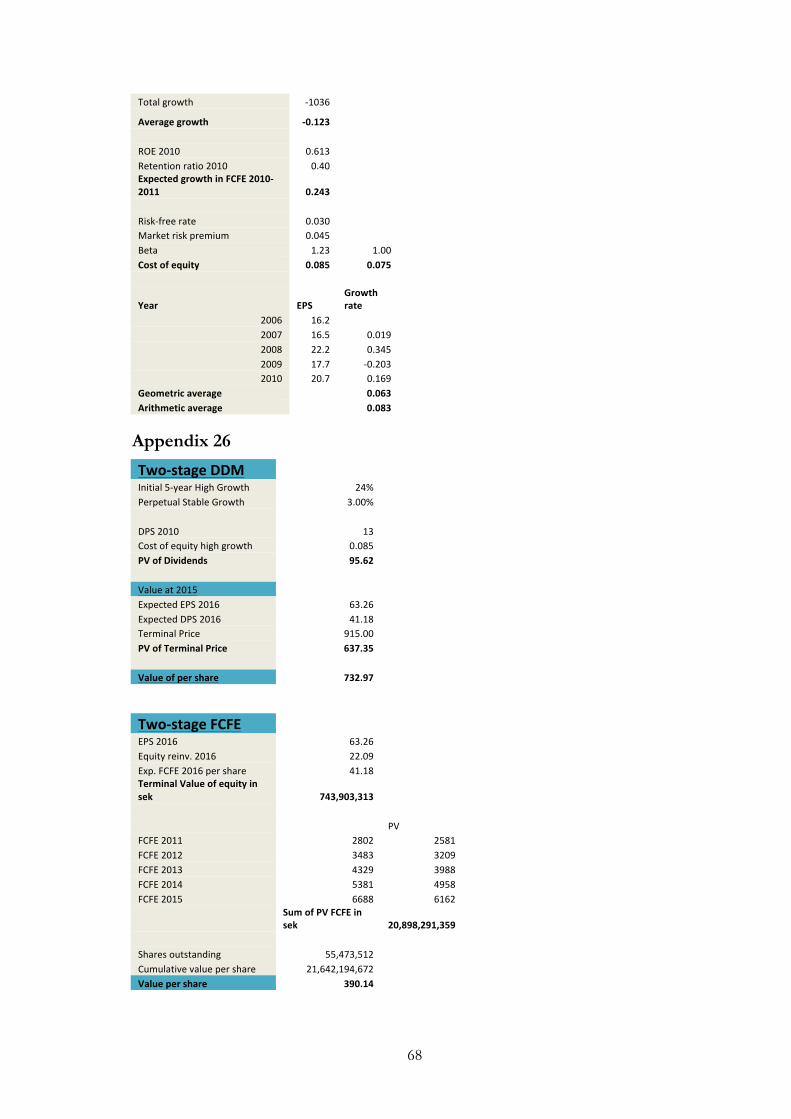
68
Total growth -‐1036
Average growth -‐0.123
ROE 2010 0.613 Retention ratio 2010 0.40 Expected growth in FCFE 2010-‐
2011 0.243
Risk-‐free rate 0.030 Market risk premium 0.045 Beta 1.23 1.00
Cost of equity 0.085 0.075
Year EPS
Growth rate
2006 16.2 2007 16.5 0.019
2008 22.2 0.345 2009 17.7 -‐0.203 2010 20.7 0.169 Geometric average
0.063
Arithmetic average
0.083
Appendix 26
Two-‐stage DDM Initial 5-‐year High Growth 24%
Perpetual Stable Growth 3.00%
DPS 2010 13 Cost of equity high growth 0.085 PV of Dividends 95.62
Value at 2015 Expected EPS 2016 63.26
Expected DPS 2016 41.18 Terminal Price 915.00 PV of Terminal Price 637.35
Value of per share 732.97
Two-‐stage FCFE
EPS 2016 63.26 Equity reinv. 2016 22.09 Exp. FCFE 2016 per share 41.18 Terminal Value of equity in
sek 743,903,313
PV FCFE 2011 2802 2581 FCFE 2012 3483 3209 FCFE 2013 4329 3988 FCFE 2014 5381 4958 FCFE 2015 6688 6162
Sum of PV FCFE in sek 20,898,291,359
Shares outstanding 55,473,512
Cumulative value per share 21,642,194,672 Value per share 390.14

69
Appendix 27 Date Company Target Price
6-‐Dec-‐10 Öhman Fondkommission 330 SEK
4-‐Jan-‐11 Deutsche Bank 420 SEK 12-‐Jan-‐11 Nordea Markets 360 SEK 14-‐Jan-‐11 SHB Capital Markets 380 SEK
Appendix 28
Swedish Match 2006 2007 2008 2009 2010 (MSEK, except per share data)
Net Income 2335
2056
2261
3146
2958 Capital Expenditure 304.00
541.00
331.00
471.00
334.00
Depreciation 435.00
435.00
449.00
468.00
402.00
Change in WC 1029.00
-‐1479.00
513.00
-‐452.00
-‐634.00
Change in interest bearing liabilities 7367.00
1906.00
1797.00
1566.00
2564.00
Change
Change
Change
Change Free cash-‐flow to equity 8804 -‐3469 5335 -‐1672 3663 1498 5161 1063 6224
2006 2007 2008 2009 2010
Dividends per share (DPS) 2.50 3.50 4.10 4.75 5.50 Earnings per share (EPS) 7.47 7.22 8.30 9.67 13.12 Payout ratio 0.33 0.48 0.49 0.49 0.42 Average
0.44 Total FCFE 29187
Total growth -‐2580
Average growth -‐0.088
ROE 2010 2.61 Retention ratio 2010 0.58 Expected growth in FCFE 2010-‐
2011 1.516
Risk-‐free rate 0.030 Market risk premium 0.045 Beta 0.33 1.00
Cost of equity 0.045 0.075
Year EPS
Growth rate
2006 7.47 2007 7.22 -‐0.033
2008 8.3 0.150 2009 9.67 0.165 2010 13.12 0.357 Geometric average
0.151
Arithmetic average
0.159
Appendix 29
Two-‐stage DDM Initial 5-‐year High Growth 17%
Perpetual Stable Growth 3.00%
DPS 2010 6 Cost of equity high growth 0.045 PV of Dividends 39.11

70
Value at 2015 Expected EPS 2016 29.63
Expected DPS 2016 13.18 Terminal Price 292.83 PV of Terminal Price 203.98
Value of per share 243.08
Two-‐stage FCFE
EPS 2016 29.63 Equity reinv. 2016 16.45 Exp. FCFE 2016 per share 13.18 Terminal Value of equity in
sek 887,371,424
PV FCFE 2011 7282 6969 FCFE 2012 8520 8154 FCFE 2013 9968 9541 FCFE 2014 11663 11162 FCFE 2015 13646 13060
Sum of PV FCFE in sek 48,886,848,333
Shares outstanding 231,000,000
Cumulative value per share 49,774,219,758 Value per share 215.47
Appendix 30
Date Company Target Price
19-‐Nov-‐10 UBS 215 SEK 6-‐Jan-‐11 Goldman, Sachs & Co 222 SEK 13-‐Jan-‐11 Bank of America Merrill Lynch 230 SEK 13-‐Jan-‐11 ABG Sundal Collier 235 SEK