Master APP 2007-08-Maria - National Treasury budget/2007/Annual... · provide pre and post...
94
1 Foreword The Departmental Strategic Plan assesses the achievements and challenges faced in 2006/07 and outlines strategies and quantifiable objectives for 2007/08 targeted at realizing the Provincial Growth and Development Strategy (PGDS). In line with the theme “from farming to agricultural industrial development”, the year 2006/07 witnessed the implementation of programmes to support scale farmers in their quest to become competitive and thus making Agriculture a pillar of economic growth in the Province. To this effect, the department has adopted a turnkey approach to the Revitalization of Smallholder Irrigation Schemes (RESIS) whereby a component of in-field irrigation infrastructure has been included. The aim is to improve water use efficiencies and increasing the competitiveness and profitability of small-holder farmers by installing preferred and proven efficient irrigation technologies. Land and agrarian reform have become even more of a challenge not just in terms of the speed of delivery but the sustainability of the restored properties and participation by blacks in the entire value chain of the agricultural sector. Given that about 80% of the Limpopo provincial commercial land is under restitution claims, land reform sustainability should justifiably occupy a centre stage towards realizing the 6% economic growth with jobs. The flagship program of research has been the Community Based Seed Production, which started in 2000, in trying to address problems of smallholder farmers when it comes to acquisition of good quality seeds. The project was piloted in GTZ-Based pilot areas of Vhembe and Capricorn district since 2001.This research activity has since benefited both farming community and people living with HIV/AIDS. The project has won the Department of Public Service Center for Innovation Silver Award for 2006. Once again our research unit is taking the lead in developing local solutions for our local problems the “Local is Lekker” touch is working for us. To this we say well done Research Team and more resources will be made available for more projects every year. In his 2007 State of the Nation Address, the State President highlighted that farmers need to be assisted with working tools and means of production to arrest the poverty and unemployment in the rural areas. The Premier of Limpopo in his 2007 State of the Province Address also alluded to the need and focussed attention to increase and improve skills capacity and operational capacity of the agricultural sector. In this regard, an Agribusiness Academy is being established at both Tompi Seleka and Madzivhandila Farmer Training Centres to address this human skills need. The AgriBEE Charter has been accepted by the Minister and discussions will ensue in 2007/2008 to finalize the targets with all stakeholders and see the implementation of AgriBEE Charter in full.
Transcript of Master APP 2007-08-Maria - National Treasury budget/2007/Annual... · provide pre and post...
1
Foreword
The Departmental Strategic Plan assesses the achievements and challenges faced in 2006/07 and outlines
strategies and quantifiable objectives for 2007/08 targeted at realizing the Provincial Growth and Development
Strategy (PGDS).
In line with the theme “from farming to agricultural industrial development”, the year 2006/07 witnessed the
implementation of programmes to support scale farmers in their quest to become competitive and thus making
Agriculture a pillar of economic growth in the Province.
To this effect, the department has adopted a turnkey approach to the Revitalization of Smallholder Irrigation
Schemes (RESIS) whereby a component of in-field irrigation infrastructure has been included. The aim is to
improve water use efficiencies and increasing the competitiveness and profitability of small-holder farmers by
installing preferred and proven efficient irrigation technologies.
Land and agrarian reform have become even more of a challenge not just in terms of the speed of delivery but
the sustainability of the restored properties and participation by blacks in the entire value chain of the agricultural
sector. Given that about 80% of the Limpopo provincial commercial land is under restitution claims, land reform
sustainability should justifiably occupy a centre stage towards realizing the 6% economic growth with jobs.
The flagship program of research has been the Community Based Seed Production, which started in 2000, in
trying to address problems of smallholder farmers when it comes to acquisition of good quality seeds. The
project was piloted in GTZ-Based pilot areas of Vhembe and Capricorn district since 2001.This research activity
has since benefited both farming community and people living with HIV/AIDS. The project has won the
Department of Public Service Center for Innovation Silver Award for 2006.
Once again our research unit is taking the lead in developing local solutions for our local problems the “Local is
Lekker” touch is working for us. To this we say well done Research Team and more resources will be made
available for more projects every year.
In his 2007 State of the Nation Address, the State President highlighted that farmers need to be assisted with
working tools and means of production to arrest the poverty and unemployment in the rural areas.
The Premier of Limpopo in his 2007 State of the Province Address also alluded to the need and focussed
attention to increase and improve skills capacity and operational capacity of the agricultural sector. In this
regard, an Agribusiness Academy is being established at both Tompi Seleka and Madzivhandila Farmer Training
Centres to address this human skills need.
The AgriBEE Charter has been accepted by the Minister and discussions will ensue in 2007/2008 to finalize the
targets with all stakeholders and see the implementation of AgriBEE Charter in full.

2
In implementing all the above programmes, it is evident and clear that the successful implementation of the
departmental strategic plan requires strategic partnerships and the involvement of all stakeholders. This affirms
the philosophy adopted by the Department of “Nothing about us, without us”. This philosophy underpins
communication and consultation within the Department and among the Department’s clients. It will go a long way
in ensuring that we realise a vision of a united and prosperous agricultural sector where people, livelihoods and
natural resources are in perfect balance.
The Department hereby calls on all farmers to realize that “Lehumo le tšwa tšhemong” and “Alle boere moet a plan maak vir dié jaar”. We have realized a dry year and this may mirror low and even negative returns by
farmers. These conditions suggest astute water management and careful planning for livestock-herds and
overall resources management strategies by farmers. “Hu duba buse!” The province has become accustomed
to longer dry spells and I challenge farmers to assist the Government in developing disaster mitigation strategies
and plans for all resources and at the same time focus on economic activities that earn them better returns.
We urge the farming community to take more responsibilities in ensuring improved productivity and increased
contribution by this sector to the broader economic growth of the province in the 2007/08 financial year. “Xandla famba Xandla vuya!”
_________________________________________
Mrs D P MAGADZI
MEMBER OF EXECUTIVE COUNCIL
LIMPOPO DEPARTMENT OF AGRICULTURE

3
Part A: Overview and strategic plan updates
1 Overview
For the next five year MTEF period the Department of Agriculture will be focussing on the following identified seven
key strategic programmes and key performance areas to contribute to the Economic Growth and Development ,
ASGISA and ensuring better life for all our clients in the Province.
The identified key strategic areas are: -
1. Restructuring of State Agricultural Assets and promotion of sustainable natural resources management and
utilization (REISIS)
2. Promote Agri-business through appropriate market access strategies, value-adding and commodity associations
to maximize farmer participation in the broader economic development opportunities
3. Promotion and development of appropriate training/research based production and value adding technologies
for successful agri-businesses;
4. Promote access to commercial agricultural land and agri-business for Agribusiness Entrepreneurs as well as to
provide pre and post settlement support for land reform projects to ensure sustainable agricultural enterprises
5. Provision of appropriate advisory support and Sustainable Poverty alleviation and household food security and
nutrition strategies;
6. Promotion and establishment of reliable information and communication strategy through information technology
for knowledge and information sharing;
7. Animal production and health to improve livestock and also control animal diseases;
As with the previous year, the Department is determined to increase the capacity, competency, professionalism and
effectiveness of the operational systems in our administration to improve the quality of service intended for our
targeted clients. The Department is proceeding with the implementation of an integrated development planning
approach at local municipalities to improve local agricultural planning, technical and administrative capacity at these
levels for effective service delivery.
As always, the Department will only be able to achieve all these programmes through joint and focused efforts by all
stakeholders.
_______________________
Mamogaudi Bigman J MALOA
ACCOUNTING OFFICER LIMPOPO PROVINCE DEPARTMENT OF AGRICULTURE

4
2 Strategic Plan Update Analysis
The Department has sought it fit to encompass further development and vertical integration of Black tea in Limpopo. The Vhembe’s Tshivhase tea estates are being revamped and value added. Over 1000Ha of prime land is planted with seedlings and clonal varieties. The tea estates will be managed as an Outgrower system phased in over a few years. The project will be handed over to the Tshivhase Territorial Trust by March 2008. The thrust is to vale-add the tea at the estates to ensure market penetration and brand establishment
Macadamia development also represents a unique opportunity for most land restitution farmers. The Department is committed to the macadamia development and establishment in the province. The nursery development that will be managed by a large component of Youth will be the first activity in the 2007/2008. The Macadamia Association in Vhembe is being targeted for assistance in land development to ensure planned development of the commodity. The project will target value-addition to ensure good market returns.
The establishment of the Fresh Produce Pack-House Facilities is also well on track and this will ensure market access for the revitalized irrigation schemes. Processing technology that will cater for 150-tons an hour will be installed at Seshego Industrial area to provide for potato, carrots, beet-rot, onion and other tubers. The other facilities in Tubatse, Thohoyandou, Elias Motswaledi and Thulamela municipalities will be facilitated during the course of the year.
Bio-fuels production has taken South Africa and the world to another level of research. The world needs cleaner oils for combusting engines and the population requires and demand clean air surroundings. The Department has thus invested in bio-diesel incubator facility at Tompi Seleka with the aim of researching the final product and other by-products of the bio-diesel value chain. Limpopo will witness some of the research findings in this value chain in the ensuing year. Oil seed producing commodity groups have been lobbied and sensitized about the project and they will also own a share in the value chain.
The need and realization of the acute shortage of skills in the province has propelled the Department to find partners in addressing this issue. The Flemish Government is supporting the Department for the next five years to establish and equip the Agribusiness Academy housed at both Tompi Seleka and Madzivhandila Farmers’ Training Centres. The objective is to produce profit-oriented commercial farming and agribusiness entrepreneurs aimed at improving rural economies and agribusiness capacity. Key programmes are agribusiness administration, mechanization management, irrigation technology and agro-tourism. Both young and existing farmers and entrepreneurs will benefit immensely from this programme
The viticulture industry is also taking shape among Limpopo farmers. Two projects one each in Sekhukhune and Waterberg on table grape production development will be started from April 2007. Over 120Ha is earmarked for development at the end of the project.
5
Part B: Programme and sub-programme performance targets
3 PROGRAMME 1: ADMINISTRATION
3 3.1 Office of the MEC and HOD
The office of the MEC is responsible for the provision of a well co-ordinated executive service that is aimed at
achieving the vision and mission of the Department. The political head oversees the operations of the
Department through the appointment of an administrative head, namely, the Head of Department. It is
responsible to provide policy and strategic leadership to the Department on above issues so as to enable the
department to enhance it ability to deliver on government priorities and objectives.
3.2 CORPORATE SERVICES
Corporate Services is part and parcel of programme one which is administration. It deals specifically with legal services, logistics, communication and liaison services, security services and Government Information Technology Office.
It is responsible to provide policy and strategic leadership to the Department on above issues so as to enable the department to enhance its ability to deliver on government priorities and objectives.
Logistic Services
3.2.1.1 Description of planned quality improvement measures
Logistic Services strives to provide transport, office accommodation and registry services which
enable the Department to operate effectively and efficiently. Workshops on policies and
management of transport and records are conducted in all the districts.
3.2.1.2 Specified policies, priorities and strategic objectives
Transport, Cellular phones and Telephone policies will be revised.
3.2.1.3 Progress analysis
The Sub- branch continues to strive for excellence through:
• Enforcement of compliance to transport policies that reduced audit queries
• Transferring of cellular phones from the Department to individual users that eventually reduced misuse and cost.
• Provision of mobile offices to minimise shortage of office accommodation

6
• Restructuring of records management at Head Office, Districts Offices, municipalities, colleges and research stations
3.2.1.4 Analysis of constraints and measures planned to overcome them
Constraints StrategiesFleet management To conduct training and implementation of internal
controls.Shortage of office accommodation Provision of mobile offices to municipalities.Cellular phone and telephonemanagement
Transfer of cellular phones to individuals to minimisemisuse and reduction of costs.
Restructuring of records management Provision of bulk filing units to records offices
Measurable Objective
Outputs (MTEF)
Performance Indicator
Year1 05/06
Year 2 06/07
Year3 07/08
Year 4 08/09
Year 5 09/10
108 Number of sedans, 26 7 25 25 25131 Number of LDV’s 0 56 25 25 2512 Number of trucks 6 0 2 2 22 Number of busses 0 1 1 0 0
245
Number of steel cabinets provided to all municipalities, colleges and research station
245 0 0 0 0
29
Number of municipalities, research stations and farming training centres to be provided with Bulk filing cabinets
0 0 10 10 9
13Number of new office accommodation provided 3 1 4 3 5
24Number of mobile offices provided 0 14 10 0 0
9Number of Offices renovated 4 1 3 1 0
Provision of office accommodation
Purchase of government owned vehicles
Installation of filling system.
3.2.2 Legal Services
3.2.2.1 Description of planned quality improvement measures
Guidelines for Legal Services will be developed as directives to interact with the sub-branch: legal services. These measures will deal with requirements for obtaining legal opinions, legal advice and giving instructions to the sub-branch.

7
3.2.2.2 Description of planned quality improvement measures
The need for the development of a policy for co-ordination and management of litigation has been identified.
3.2.2.3 Progress Analysis
In the process of rendering legal services:
• Workshops were held and SAMDI training was conducted on the Promotion of Administrative Justice Act. No 3 of 2000 for purposes of developing guidelines on the implementation of the Act.
• All claims against the Department in litigation matters brought before court successfully defended.
• 39 Contracts drafted
• 31 Legal opinions provided
3.2.2.4 Analysis of constraints and measures planned to overcome them
Constraints Strategies
Poor participation in matters related to development of regulatory frameworks
Provincial rationalisation of legislation process will assist to identify areas that requires development or repeal of legislation
3.2.2.5 Specification of measurable objectives and performance indicators
Measurable Objective Outputs (MTEF) Performance Indicator Year1 05/06 Year 2 06/07 Year3 07/08 Year 4 08/09 Year 5 09/10
1 Litigation Management and co-ordination policy 0 0 1 0 0
20Quarterly report on litigation 4 4 4 4 4
1 Report on rationalisation of legislation 0 0 1 0 0
1 Bill 0 0 1 0 01 PAJA guideline 0 1 0 0 0
Provision of Legal advisory support 20
Quarterly report on legal opinion and advise 4 4 4 4 4
Development of contracts20
Quarterly report on contracts 4 4 4 4 4
Co-ordination and management of litigation
Development of regulatory framework
8
3.2.3 Government Information Technology Office (GITO)
3.2.3.1 Description of planned quality improvement measures
The GITO Business Unit will continue to implement its initiatives of:
• Business processes re-engineering and transforming of paper based systems into electronic work flow application systems on the LDAnet and Portal.
• Consolidated telephone and data network lines to the 5 districts and ensure the
connectivity of municipal offices, colleges and veterinary offices and laboratories that will be form part of the LDA campus network.
• Planning & structuring the LDA Domain, by rename of our domain for 2 domain
controllers and 5 sites with member servers from agricho.norprov.gov.za to lda.gov.za.
• Implementing web mail access on our LDAnet (Ensure e-mail connectivity from anywhere in the world)
3.2.3.2 Specified policies, priorities and strategic objectives
Revision of the 3G Card Policy.
3.2.3.3 Progress analysis
• The GITO Business Unit has implemented VOIP, upgrading of data lines, ensure connectivity and launch of the first phase of the Agri-Portal and LDAnet.
• Intrusion detection and prevention security plan has been 100 % implemented by Dimension Data. Video conferencing facilities together with corporate boardrooms & audio visual (MEC, HOD & Main Boardroom) equipment has been installed.
• Disaster Recovery Planning (DRP) blueprint was done by TATA consulting. In case of emergencies like power failures, fire etc the downtime of the systems will be minimal before recovering the systems to its original state.
• Track IT Helpdesk system was 100 % upgraded to enterprise edition and deployed to
the newly district network administrators who will ensure that the response time for computer failures will be address faster.
• Revising of 2 systems, port from desktop applications to web-based applications: Legal
& Labour Relations Databases 70 % completed.
3.2.3.4 Analysis of constraints and measures planned to overcome them:

9
Constraints StrategiesData lines connectivity to Municipality SITA is in process of establishing wireless connectivity to
municipal offices as TELKOM cannot provide the data lines.
Restrictions by Provincial Treasury to install data circuits Treasury to transfer ownership of departmental data lines torespective departments together with budget. TELKOM to expeditethe installation of data lines.
Restrictions by SITA to connect wireless networks to government network SITA to allow departments to use wireless connectivity in areaswhere TELKOM cannot provide connectivity
2.3.5 Specification of measurable objectives and performance indicators
Measurable Objective Outputs (MTEF) Performance Indicator Year1 05/06 Year 2 06/07 Year3 07/08 Year 4 08/09 Year 5 09/10
10 Number of systems developed. 4 3 3 0 0
44Number of offices installed with unified messaging 1 5 30 9 0
44Number of Offices implemented with EDMS Electronic Document Management System (EDMS)
1 5 38 0 0
IT Equipment1000
Number of computers (laptops included) supplied 300 300 200 100 100
23Number of offices Installed with TELKOM data circuits 11 12 0 0 0
25Number of upgrades of data circuits at Municipal Offices 0 0 25 0 0
Agri Portal and Agri Net
0 0 0Communication infrastructure
44 Number of Offices implemented with VoIP 0
2 Number of Network s installed and upgrades
2 0
3 5 36 0
Communication and Liaison Services
3.2.4.1 Description of planned quality improvement measures
The Sub-branch will continue using radio, both community and the public broadcaster to disseminate agricultural information. Profiling of agricultural issues in the media will be expanded to marketing departmental services through Billboards. The branding of Departmental offices with the new corporate image will be extended to the Districts and Municipalities.
3.2.4.2 Specified policies, priorities and strategic objectives
The priority of the sub branch is to develop a Communications Strategy which serves as a guiding document for all communication activities, i.e. Media relations management, Radio programmes, management of events, campaigns and exhibitions, production of the departmental newsletter, profiling of agricultural issues in the media and promotion of the new corporate image and branding.
10
3.2.4.3 Progress analysis
Good progress was made in implementing the current communication strategy through:
• Broadcasting agricultural issues on a weekly basis on community radio stations and a monthly basis on the three SABC stations based in the province.
• Participating at the Polokwane Show and the Rand Show
• Management of campaigns and events such as the Young Aspirant Farmer of the Year Awards, Female Farmer of the Year Awards, World Food day, Batho Pele events, 16 Days of Activism
• Production of monthly external newsletters and profiling agriculture in the media.
3.2.4.4 Analysis of constraints and measures planned to overcome them
Constraints Strategies
Production of newsletter on time Contract to be entered into with an appointed service provider
Lack of writing skills Training to be arranged for communicators
Publication and policy documents available in English
Selected publications and policy documents to be translated into Sepedi, Xitsonga and Tshivhenda.

11
3.2.4.5 Specification of measurable objectives and performance indicators
Measurable Objective Outputs (MTEF) Performance Indicator Year1 05/06 Year 2 06/07 Year3 07/08 Year 4 08/09 Year 5 09/10
Development of Communication Strategy 5
Number of Communication Strategies developed
1 1 1 1 1
Media Relations Management 14Number of Media Open Days 1 2 3 4 4
Implementation of Radio Programmes 2379
Number of agric programes broadcasted 315 516 516 516 516
Participation in Shows and Exhibitions 27
Number of Shows and Exhibitions 3 6 6 6 6
Management of campaigns and events 54
Number of Events organized and managed 6 12 12 12 12
Production of Departmental Newsletter
67 Number of Editions 3 16 16 16 16
Promote and maintain the new corporate image and branding
21Number of Offices branded 0 1 5 10 5
56Number of Articles written for provincial newspapers
8 12 12 12 12
36Number of Billboards placed all over the province
0 0 12 12 12
Profiling agricultural issues in the media
3.2.5 Security and Risk Management
3.2.5.1 Description of planned quality improvement measures
Information with regard to education, awareness and workshops on Security and Risk Management will also be distributed through pamphlets. The security measures which are at Head office will be extended to district office and colleges
3.2.5.2 Specific policies, priorities and strategic objective
A specific priority of Security and Risk Management services within the Department will be to develop information security procedures which are not in place.
3.2.5.3 Progress analysis
• 70% of reported cases were investigated and completed.
• Education and awareness campaign were conducted within the Department.
• Investigation of security staff trends and behaviour was conducted within the department.
• 50% of risk management monitoring process has been conducted
3.2.5.3 Analysis of constraints and measures planned to overcome them

12
Constraints Strategies
Some reported cases could not be investigated and completed within prescribed timeframes due to staff shortage
Restructuring of the sub-unit
Non compliance with policies by officers Induction of new employees in collaboration with HRD
3.2.5.4 Specification of measurable objective and performance
Measurable Objective Output Performance Indicator Year1 05/06 Year2
06/07 Year3 07/08
Year4 08/09
Year5 09/10
Coordination and implementation of physical security
12 Number policies developed
1 2 2 3 4
93 Number of contracts, Service level agreements signed by the service provider and the department
17 19 19 19 19
Coordination and implementation of MISS and PISP
55 Number of education and awareness workshops conducted
3 7 10 15 20
Implementation of communication security 3 Number of crypto equipment installed
0 0 1 0 0
20 Quarterly reports on fraud and corruption cases
4 4 4 4 4
Coordination and implementation of Integrity Management
1 Number of policies developed
0 0 1 0 0
13
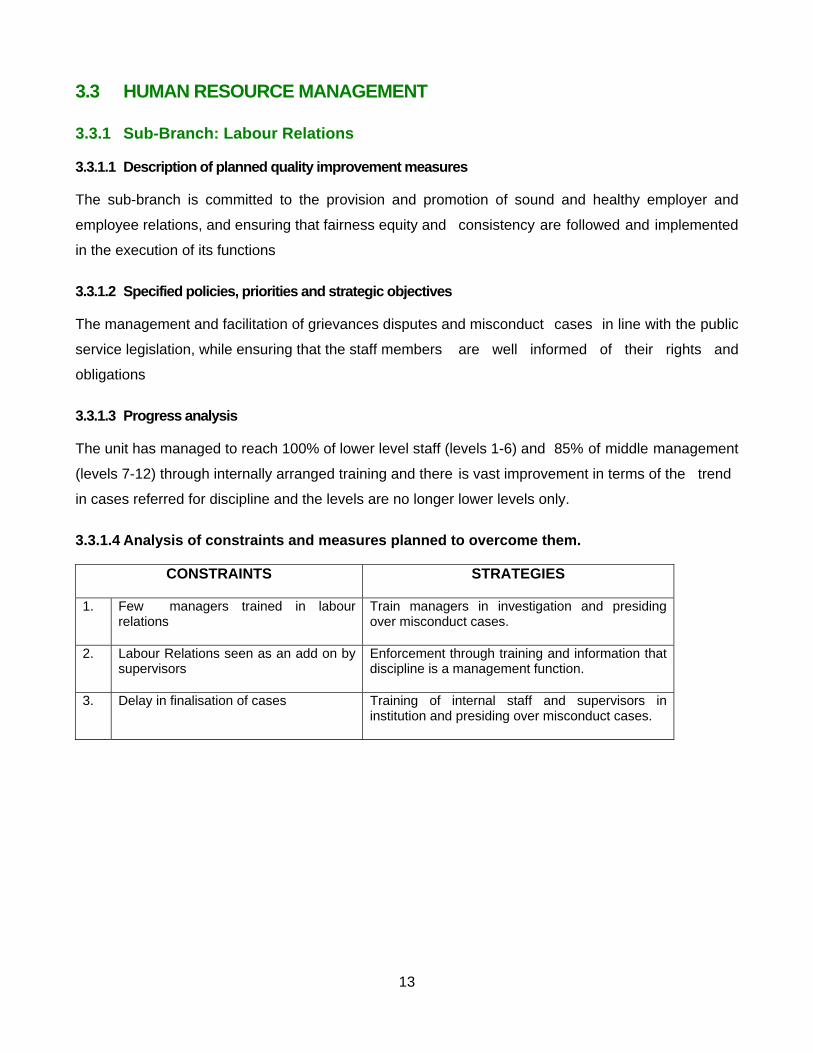
3.3 HUMAN RESOURCE MANAGEMENT
3.3.1 Sub-Branch: Labour Relations
3.3.1.1 Description of planned quality improvement measures
The sub-branch is committed to the provision and promotion of sound and healthy employer and
employee relations, and ensuring that fairness equity and consistency are followed and implemented
in the execution of its functions
3.3.1.2 Specified policies, priorities and strategic objectives
The management and facilitation of grievances disputes and misconduct cases in line with the public
service legislation, while ensuring that the staff members are well informed of their rights and
obligations
3.3.1.3 Progress analysis
The unit has managed to reach 100% of lower level staff (levels 1-6) and 85% of middle management
(levels 7-12) through internally arranged training and there is vast improvement in terms of the trend
in cases referred for discipline and the levels are no longer lower levels only.
3.3.1.4 Analysis of constraints and measures planned to overcome them.
CONSTRAINTS STRATEGIES
1. Few managers trained in labour relations
Train managers in investigation and presiding over misconduct cases.
2. Labour Relations seen as an add on by supervisors
Enforcement through training and information that discipline is a management function.
3. Delay in finalisation of cases Training of internal staff and supervisors in institution and presiding over misconduct cases.

14
3.3.1.5 Specification of measurable objectives and performance indicators
Measurable Objective OutputsPerformance Indicator
Year 105/06
Year 206/07
Year 307/08
Year 408/09
Year 509/10
100%Number of grievances handled 74 100% 100% 100% 100%
100%Number of disputes managed and handled 2 100% 100% 100% 100%
Represent Department collective bargaining forums
40 meetings held Number of meetings held 8 8 8 8 8
100%
Number of cases referred to the Labour Court in terms of the service standards 2 5 100% 100% 100%
100%
Number of cases referred to the CCMA, handled in terms of the service standards 0 2 100% 100% 100%
100%
Number of cases referred to the Council (GPSSBC), handled in terms of the service standards 6 4 100% 100% 100%
Manage and coordinate misconduct cases. 100%
Number of misconduct cases successfully finalised. 37 100% 100% 100% 100%Number of advice sessionsheldNumber of written adviceprovided
Provide training on labour relations to all staff members.
100% Number of officials trained 100% level1-6
100% Level 7-12
100%SMS 100% 100%
Number of policies developed
Number of policiesimplemented and monitored.
100%
Develop and monitor the implementation of labour relations policies.
2 1 1 0 0 0
100% 100% 100% 100%
Manage and handle grievances and disputes.
Represent Department in dispute resolution
forums in consultation with Legal Services
Provide labour relations related advice to the department
100%

15
3.3.2 Sub – Branch : Human Resource Development
3.3.2.1 Description of planned quality improvement measures
Provide skills to address the existing constraints of skills shortage and the decline in extension services. Work skill plan (WSP) for the department will be developed and training organised as per gaps identified on the WSP and priorities given to those skills that address the strategic objectives of the department. Deceiving Employees of the department will be given bursaries to further their studies which are also in line with the strategic objective of the department. HRD policies shall be made available to department website for ease access by all employees this will include popularization of such policies to all districts and municipalities
3.3.2.2. Specific policies, priorities and strategic objective
In line with the Skills Development Act; Skills Development Levies Act; National Human Resource Development Strategy; Provincial Human Resource Development Strategy; Departmental Skills Development Policy; Departmental External and Internal bursary policies and departmental Internship and Experiential policy we aim to: produce a knowledgeable population for the agricultural sector and also give opportunities to unemployed graduates to gain practical experience. This will all be achieved through the equipping of departmental staff with relevant skills for meaningful participation in the agricultural sector and through the learner ship; internship and experiential programmes
3.3.2.3 Progress analysis
Popularization of HRD policies was done to 3 districts and 5 municipalities
Induction of new staff was done to all municipality managers and 25 newly appointed staff in one district.
1420 officials were trained on different skills programmes;150 officials were given bursaries to further their studies; 222 unemployed graduates were appointed through the internship programme and 70 external students were offered bursaries to pursue identified scarce careers in agriculture.
26 students were given opportunity to do their experiential training
23 SMS members and 30 managers including municipality managers were trained on KHAEDU

16
3.3.2.4 Analysis of constraints and measures planned to overcome them
Constraints Strategies
Low interest in choosing agriculture as a career choice
Career exhibition; adoption of agricultural high school; offering bursaries to students who want to study agriculture at tertiary; provide space for experiential training for students who want to complete their studies and provide on job experience to unemployed graduates through internship programme
Lack of specialised skills e.g veterinary, agric engineering etc
Offer bursaries to student interested in the fields
Poorly motivated staff Send them to organised training and conferences
Inadequate management and technical capacity (e.g decline in extension services due to changes in the sector)
The alignment of IDP with training required by staff
Sending them to organised training aligned to changes in the sector and retraining of extension staff
Conducting mini workshop within branches and division and encouraging managers to monitor the training requirement of their branches and inform their staff accordingly
3.3.2.4 Specification of measurable objectives and performance indicators.
70 External 50 External 30 External 30 External 30 External
100 Internal 170 Internal 120 Internal 120 Internal 120 Internal
IMPROVE THE HUMAN CAPITAL OF THE DEPARTMENT FOR BETTER SERVICE DELIVERY
375
Skilled departmentalstaff for better servicedelivery 100 100 125 55 60
EQUIP THE DEPARTMENTAL STAFF FRO BETTER SERVICE DELIVERY
4700
Skilled departmentalstaff for better servicedelivery 1500 1500 800 800 800
PROMOTE EMPLOYABILITY OF UNEMPLOYED GRADUATES
1170
Unemployed graduateappointed
202 234 251 251 251
AWARD AND MANAGEBURSARIES (INTERNALAND EXTERNAL)
820NUMBER OF Externaland Internal Bursariesawarded
Year 206/07
Year 307/08
Year 408/09
Year 509/10
Measurable Objective Outputs Performance Indicator Year 105/06
17
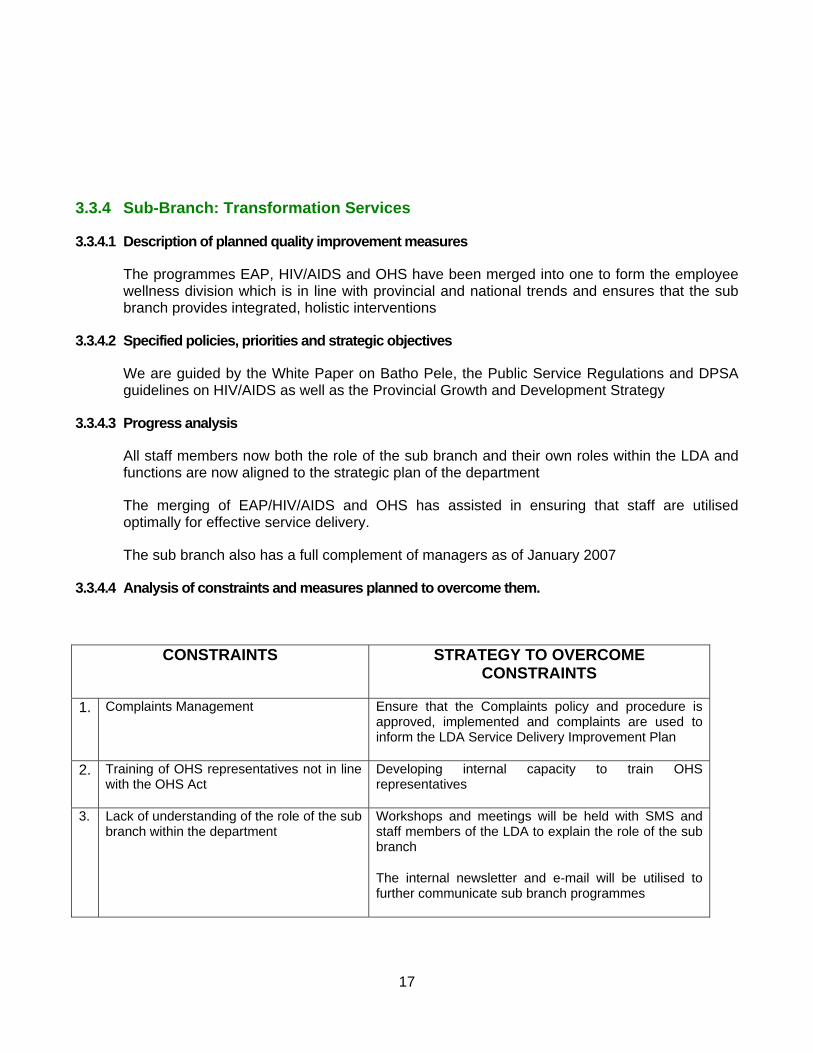
3.3.4 Sub-Branch: Transformation Services
3.3.4.1 Description of planned quality improvement measures
The programmes EAP, HIV/AIDS and OHS have been merged into one to form the employee wellness division which is in line with provincial and national trends and ensures that the sub branch provides integrated, holistic interventions
3.3.4.2 Specified policies, priorities and strategic objectives
We are guided by the White Paper on Batho Pele, the Public Service Regulations and DPSA guidelines on HIV/AIDS as well as the Provincial Growth and Development Strategy
3.3.4.3 Progress analysis
All staff members now both the role of the sub branch and their own roles within the LDA and functions are now aligned to the strategic plan of the department
The merging of EAP/HIV/AIDS and OHS has assisted in ensuring that staff are utilised optimally for effective service delivery.
The sub branch also has a full complement of managers as of January 2007
3.3.4.4 Analysis of constraints and measures planned to overcome them.
CONSTRAINTS STRATEGY TO OVERCOME CONSTRAINTS
1. Complaints Management Ensure that the Complaints policy and procedure is approved, implemented and complaints are used to inform the LDA Service Delivery Improvement Plan
2. Training of OHS representatives not in line with the OHS Act
Developing internal capacity to train OHS representatives
3. Lack of understanding of the role of the sub branch within the department
Workshops and meetings will be held with SMS and staff members of the LDA to explain the role of the sub branch
The internal newsletter and e-mail will be utilised to further communicate sub branch programmes

18
3.3.4.5 Specification of measurable objectives and performance indicators.
Measurable Objective
Outputs Performance Indicator
Year 1 05/06
Year 2 06/07
Year 3 07/08
Year 4 08/09
Year 5 09/10
Increase utilization of EWP services by 55%
Increased utilization of EWP services Assist all
referrals. 100% 100% 100% 100%
02 EWP evaluation research done
EWP evaluation research completed
EWP research currently in
process 1 0 1 0
50% of supervisors and senior management trained on basic EWP
Training of supervisors and senior management on basic EWP
150 supervisors
trained
40% [60 supervisors
trained] 45% 50% 50%
100% increased monitoring of workplaces for OHS compliance
Increased monitoring of workplaces (173) for OHS compliance
50 workplaces monitored 100% 100% 100% 100%
Promote a safe and healthy
work environment
01 OHS Risk Assessment completed
OHS Risk Assessment completed
No risk assessment
done 0 1 0 0
WARD and Youth Forums established and functional
0 2 0 0 0 Ensure full participation of Previously Disadvantaged Individuals (PDI)
Forums for PDIs established and PDIs participating in agriculture
Children, Youth and Women involved in the sector
0 0
5 5 5
3.3.4 Sub-Branch: Human Resource Services
3.3.4.1 Description of planned quality improvement measures
The Human Resource sub branch is committed to improve service delivery by making sure that
481 out of 481 vacant posts are filled, 4578 employees sign performance instruments which are
aligned to Departmental strategic objectives and quality assurance conducted. Reducing excess
employees from 1109 to 909 and also encouraging employees to join GEMS.
19
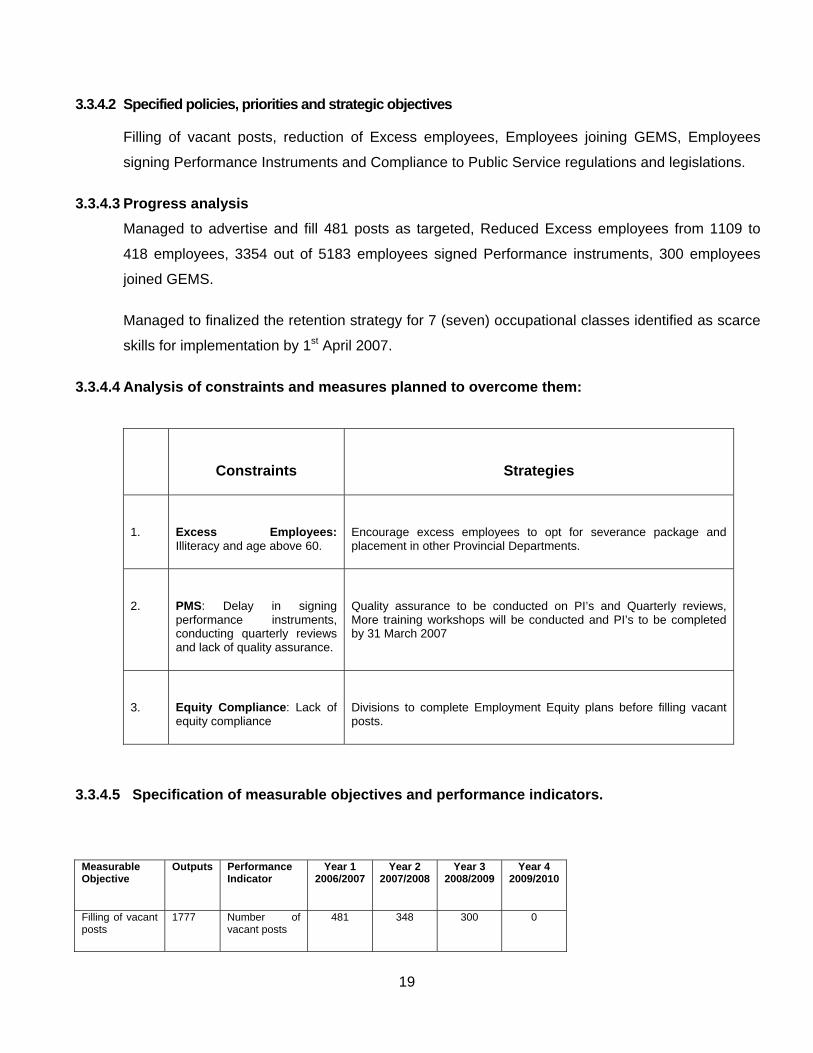
3.3.4.2 Specified policies, priorities and strategic objectives
Filling of vacant posts, reduction of Excess employees, Employees joining GEMS, Employees
signing Performance Instruments and Compliance to Public Service regulations and legislations.
3.3.4.3 Progress analysis Managed to advertise and fill 481 posts as targeted, Reduced Excess employees from 1109 to
418 employees, 3354 out of 5183 employees signed Performance instruments, 300 employees
joined GEMS.
Managed to finalized the retention strategy for 7 (seven) occupational classes identified as scarce
skills for implementation by 1st April 2007.
3.3.4.4 Analysis of constraints and measures planned to overcome them:
Constraints
Strategies
1.
Excess Employees: Illiteracy and age above 60.
Encourage excess employees to opt for severance package and placement in other Provincial Departments.
2.
PMS: Delay in signing performance instruments, conducting quarterly reviews and lack of quality assurance.
Quality assurance to be conducted on PI’s and Quarterly reviews, More training workshops will be conducted and PI’s to be completed by 31 March 2007
3.
Equity Compliance: Lack of equity compliance
Divisions to complete Employment Equity plans before filling vacant posts.
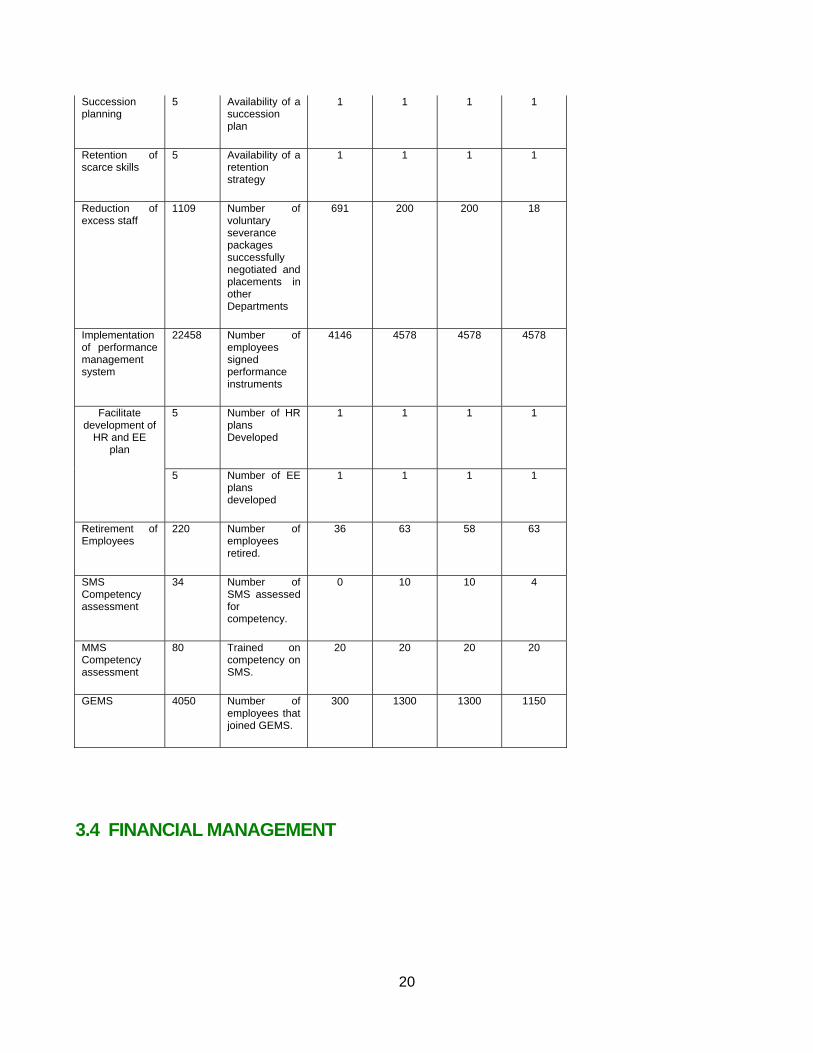
3.3.4.5 Specification of measurable objectives and performance indicators.
Measurable Objective
Outputs Performance Indicator
Year 1 2006/2007
Year 2 2007/2008
Year 3 2008/2009
Year 4 2009/2010
Filling of vacant posts
1777 Number of vacant posts
481 348 300 0
20
Succession planning
5 Availability of a succession plan
1 1 1 1
Retention of scarce skills
5 Availability of a retention strategy
1 1 1 1
Reduction of excess staff
1109 Number of voluntary severance packages successfully negotiated and placements in other Departments
691 200 200 18
Implementation of performance management system
22458 Number of employees signed performance instruments
4146 4578 4578 4578
5 Number of HR plans Developed
1 1 1 1 Facilitate development of
HR and EE plan
5 Number of EE plans developed
1 1 1 1
Retirement of Employees
220 Number of employees retired.
36 63 58 63
SMS Competency assessment
34 Number of SMS assessed for competency.
0 10 10 4
MMS Competency assessment
80 Trained on competency on SMS.
20 20 20 20
GEMS 4050 Number of employees that joined GEMS.
300 1300 1300 1150
3.4 FINANCIAL MANAGEMENT

21
3.41 Description of planned quality improvement measures
The Department will continue to strengthen its initiative to update and maintain a reliable asset register. In this direction the Department has commenced with the verification of all movable and immovable assets and it is anticipated that this project will be completed in the forthcoming financial year. This program is also responsible for the internal controls and compliance to legislation governing financial management and corporate governance. Further the component involving Risk and Security will be moved under the custodian of the Office of the Chief Financial Officer.
3.4.2 Specified policies, priorities and strategic objectives
A significant portion of financial management is guided by the Supply Chain Management Framework. To this end, the Department has implemented the BBBEE and PPPFA legislative mandates in order for the imbalances of the past to be addressed. In this way, all previously marginalized groups will be able to participate in the procurement system funded by Government.
3.4.3 Progress analysis
The branch continues to strive for excellence in corporate governance. The Department has implemented its Financial Management Improvement Program and the result has been:
• Unqualified audit report
• Minimal matters of emphasis
• Improved efficiency in the use of financial resources
3.4.4 Analysis of constraints and measures planned to overcome them
Constraints Strategy
1 Risk Management Risk and fraud plans have been developed and policies are in place. Continuous assessment of the environment is taking place
2 Asset Management LDA has commenced its verification of its assets. Financial systems are not in place to capture all assets as required by the PFMA. The LDA will develop manual asset register and value all assets.
3 Debt Management The Department is continuously coming up with ways to tighten internal controls to curb the creation of new staff debts and to collect outstanding once including farm rental debts.

22
4 Internal Controls-Fleet management Greater awareness and training has commenced and improved systems are being investigated
5 Internal-Controls-Document management
Training and checking on audit trails are placed high on our priority. Also, improved systems in this field are being assessed

23
3.4.5 Specification of measurable objectives and performance indicators
Year1 Year 2 Year3 Year 4 Year 5 Measurable Objective
Outputs Performance Indicator
2005/06 2006/07 2007/08 2008/09 2009/10
Acquisition of contracts
1060 1.Number of contract concluded
100 240 240 240 240
80 Percentage value of bids awarded to blacks
75% 70% 75% 80% 80%
Promotion of BEE
2050
Number of SMMEs promoted through procurement
200 300 450 500 600
Acquisition of goods/services
35980 Number of orders processed per annum
7980 7000 7000 7000 7000
Supporting local products
30 Percentage value of contracts awarded to local suppliers
20% 30% 50% 50% 50%
10 Number of verifications per annum
2 2 2 2 2
10 Number of stock inspection
2 2 2 2 2
27000 Number of asset valued 0 27000 0 0 0
Asset management
2788 Number of assets disposed off per year
988 500 500 400 400
100 .Ensure that accounts are settled within 30 days (%)
100% 100% 100% 100% 100%
5 Number of payroll audit conducted
1 1 1 1 1
Expenditure management and compliance
30 Number audit inspections 6 6 6 6 6
Budget planning and control
10 Consolidated annual budget and adjustment estimates reports
2 2 2 2 2
20 Reports on budget implementation monitoring meetings
4 4 4 4 4
100 Cleared outstanding R5,1m worth of debts(%)
20% 40% 40% 0% 0%
Implementation of revenue collection strategy
59047 Collection of all revenue budgeted(Rm)
R 14,838 R 10,257 R 10,770 R 11,308 R 11,874 System Management
100% Controlled user access to all financial
100% 100% 100% 100% 100%

24
4. Reconciliation of budget with plan
Programme Actual 2004/05 Actual 2005/06(Base)
2006/07 Estimate
Average Annual change
(%)2
2007/08 Budget
2008/09 Target
2009/10 Target
Average annual change
(%)3
1. Administration 124,055 139,516 197,599 41.57 258,229 285,541 301,246 5.50 2. Sustainable Resource Management
30,147 127,082 158,058 24.37 178,282 239,967 289,783 20.76
3. Farmer Support 501,449 547,236 570,108 4.17 515,196 533,192 569,270 6.67 4. Veterinary Services 12,309 15,570 15,529 ( 0.23) 25,088 26,093 27,528 5.50
5. Research & Technology
19,129 98,109 40,789 (58.42) 62,641 52,850 55,757 (5.50)
6. Agri-Business 10,608 18,138 14,333 (20.98) 18,554 28,901 30,491 5.50 7. Education & Training 35,293 35,134 32,742 (6.80) 36,449 36,285 38,281 5.50
TOTAL 732,990 980,785 1,029,158 4.93 1,094,439 1,202,829 1,312,356 9.10
systems
2008 Number of hours of systems availability to users per day
8 8 8 8 8

25
Implementation of the capital investment
New projects ‘000
Actual 2002/03
Actual 2003/04
2004/05 Estimate
2005/06 Budget
2006/07 Target
2007/08 Target
REISIS - 20 290 22 239 113 482 138 351 141 158
CASP projects - - 33 428 52 217 50 143 62 921PIG projects - - 35 600 51 995 43 767 57 080Upgrading Tompi Seleka College - - - - - 15 000
Madzivhandela College - - - - - 10 000
Asset Management
The need for the Department to have an updated asset register cannot be over emphasized. The
Department has been struggling to produce an authentic asset register for several years due to the
fact the current financial system used by the Province, namely, FINEST does not meet the
requirements of an asset register as determined by National Treasury. It has been recommended by
the Auditor General and Audit Committee that the Department keep a manual asset register. It is for
this reason that the Department has issued a tender for the compilation of a manual asset register.
Medium-term revenues 5.1 Summary of revenue
R 0 Actual 2004/05 Actual 2005/06
2006/07 Estimate
2007/08 Budget
2008/09 Target
2009/10 Target
Voted by legislature 659,918 871,543 927,298 966,495 1,059,603 1,154,549 Conditional grants 73,072 109,242 101,860 127,944 143,226 157,807 Other (specify) - - - - - - Total revenue 732,990 980,785 1,029,158 1,094,439 1,202,829 1,312,356 5.2 Departmental revenue collection
R 0 Actual 2004/05 Actual 2005/06
2006/07 Estimate
2007/08 Budget
2008/09 Target
2009/10 Target
Tax receipts - - - - - - Sale of goods and services other than capital assets
4,414 9,375 7,002 7,352 7,720 8,106
Transfers received - - - - - -

26
Fines, penalties and forfeits
- - - - - - Interest, dividends and rent on land
1,096 1,876 791 831 872 916 Sale of capital assets 517 1,231 999 1,049 1,101 1,156 Financial transactions in assets and liabilities
6,207 2,353 1,465 1,538 1,615 1,696
Total revenue 12,234 14,835 10,257 10,770 11,308 11,874
Conditional grants
Monetary contributions (R 000) Project name
2003/04 (actual)
2004/05 (estimate)
2005/06 (budget)
2006/07 MTEF
projection
2007/08 MTEF
projection
Project outcomes
Departmental reporting
responsibility
CASP N/A 33 428 52 217 50 143 62 921 Support to
farmers Pr 3
PIG
35 600 51 995 43 767 57 080 Infrastructure Development Pr 3
Landcare 2 000 5 308 7 950 7 943 Water and
land access Pr 2
Disaster 2 044 - - -
Alleviation of farmers in plight
Pr 2/3
5.4 Donor funding Project name External
donors Monetary contributions by donors (R 000)
2002/03 (actual)
2004/05 (estimate)
2005/06 (budget)
2006/07 MTEF
projection
2007/08 MTEF
projection
Project outcomes
Departmental reporting
responsibility
Agribusiness Academy
Flemish Government
R 7.1m R 17.0m Capacity building on
Agribusiness and Farm
Management
GM Agribusiness
27
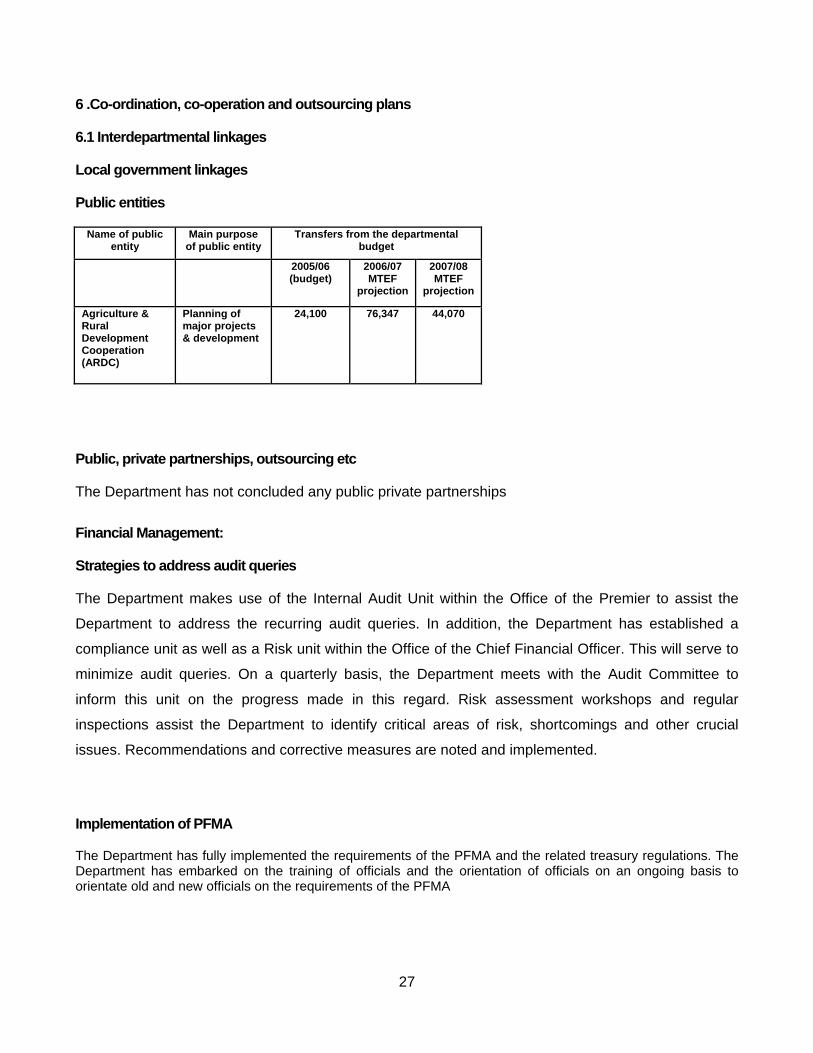
6 .Co-ordination, co-operation and outsourcing plans
6.1 Interdepartmental linkages
Local government linkages
Public entities
Name of public entity
Main purpose of public entity
Transfers from the departmental budget
2005/06 (budget)
2006/07 MTEF
projection
2007/08 MTEF
projection
Agriculture & Rural Development Cooperation (ARDC)
Planning of major projects & development
24,100 76,347 44,070
Public, private partnerships, outsourcing etc
The Department has not concluded any public private partnerships
Financial Management:
Strategies to address audit queries
The Department makes use of the Internal Audit Unit within the Office of the Premier to assist the
Department to address the recurring audit queries. In addition, the Department has established a
compliance unit as well as a Risk unit within the Office of the Chief Financial Officer. This will serve to
minimize audit queries. On a quarterly basis, the Department meets with the Audit Committee to
inform this unit on the progress made in this regard. Risk assessment workshops and regular
inspections assist the Department to identify critical areas of risk, shortcomings and other crucial
issues. Recommendations and corrective measures are noted and implemented.
Implementation of PFMA
The Department has fully implemented the requirements of the PFMA and the related treasury regulations. The Department has embarked on the training of officials and the orientation of officials on an ongoing basis to orientate old and new officials on the requirements of the PFMA
28
4. PROGRAM 2: SUSTAINABLE RESOURCE MANAGEMENT
4.1 Engineering Services
4.1.1 Description of planned quality improvement measures
The Department has committed itself to revitalising the many smallscale irrigation schemes under previously disadvantaged communities and individuals. It is estimated that 131 000 ha of the province’s area is suitable for irrigation. Of this, approximately 121 irrigation schemes totalling 19 000 ha is the hands of the previously disadvantaged communities from the former homelands.
4.1.2 Specified policies, priorities and strategic objectives
The main focus of the approach is to install efficient infield systems based on the scientific determination of suitable irrigable soils, registered water rights, adequate electrical connectivity to meet the new pumping requirements for the new systems. Beneficiaries are also expected to engage in commercial production methods which involves contracts with strategic investors, choice of niche crops, market contracts and the revamping and registration of legal entities.
The priority is also to assist other programmes with engineering skills and capacity to enable them to discharge their mandates. To this effect internal and external service providers are being utilised on an ongoing basis.
4.1.3 Progress analysis
Much progress has been achieved over the last two years. More than 2000 ha have been equipped with efficient infield irrigation systems, and more bulk infrastructure like dams, pipelines, pump stations and electricity power-lines are being installed to support the infield system.
29
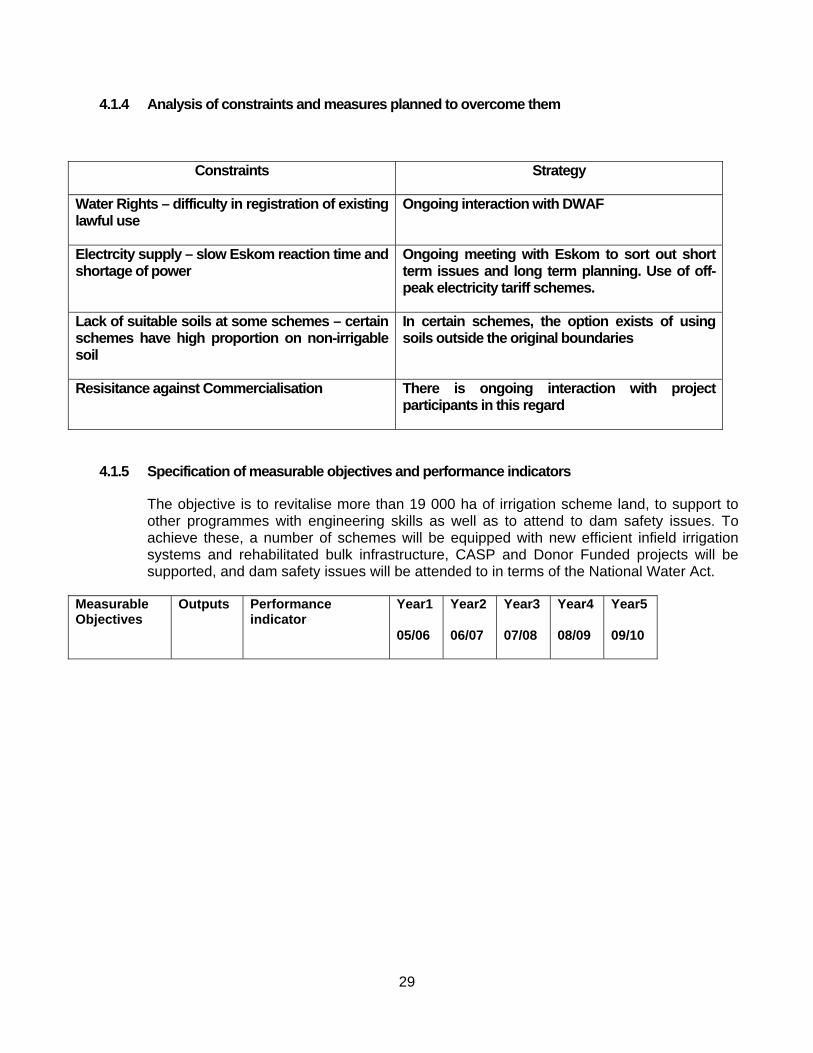
4.1.4 Analysis of constraints and measures planned to overcome them
Constraints Strategy
Water Rights – difficulty in registration of existing lawful use
Ongoing interaction with DWAF
Electrcity supply – slow Eskom reaction time and shortage of power
Ongoing meeting with Eskom to sort out short term issues and long term planning. Use of off-peak electricity tariff schemes.
Lack of suitable soils at some schemes – certain schemes have high proportion on non-irrigable soil
In certain schemes, the option exists of using soils outside the original boundaries
Resisitance against Commercialisation There is ongoing interaction with project participants in this regard
4.1.5 Specification of measurable objectives and performance indicators
The objective is to revitalise more than 19 000 ha of irrigation scheme land, to support to other programmes with engineering skills as well as to attend to dam safety issues. To achieve these, a number of schemes will be equipped with new efficient infield irrigation systems and rehabilitated bulk infrastructure, CASP and Donor Funded projects will be supported, and dam safety issues will be attended to in terms of the National Water Act.
Measurable Objectives
Outputs Performance indicator
Year1
05/06
Year2
06/07
Year3
07/08
Year4
08/09
Year5
09/10
30
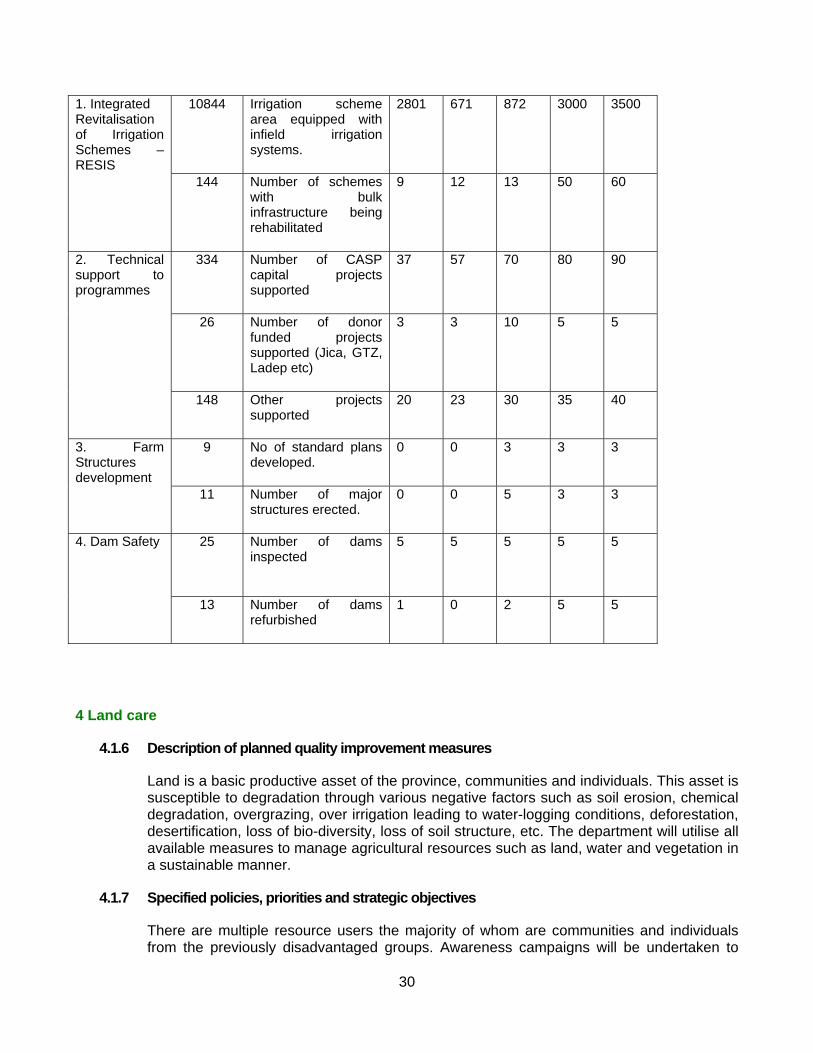
10844 Irrigation scheme area equipped with infield irrigation systems.
2801 671 872 3000 3500
1. Integrated Revitalisation of Irrigation Schemes – RESIS
144 Number of schemes
with bulk infrastructure being rehabilitated
9 12 13 50 60
334 Number of CASP capital projects supported
37 57 70 80 90
26 Number of donor funded projects supported (Jica, GTZ, Ladep etc)
3 3 10 5 5
2. Technical support to programmes
148 Other projects supported
20 23 30 35 40
9 No of standard plans developed.
0 0 3 3 3 3. Farm Structures development
11 Number of major structures erected.
0 0 5 3 3
25 Number of dams inspected
5
5 5 5 5 4. Dam Safety
13 Number of dams refurbished
1 0 2 5 5
4 Land care
4.1.6 Description of planned quality improvement measures
Land is a basic productive asset of the province, communities and individuals. This asset is susceptible to degradation through various negative factors such as soil erosion, chemical degradation, overgrazing, over irrigation leading to water-logging conditions, deforestation, desertification, loss of bio-diversity, loss of soil structure, etc. The department will utilise all available measures to manage agricultural resources such as land, water and vegetation in a sustainable manner.
4.1.7 Specified policies, priorities and strategic objectives
There are multiple resource users the majority of whom are communities and individuals from the previously disadvantaged groups. Awareness campaigns will be undertaken to

31
create awareness to land-users about sustainable utilization methods. Specific intervention to pre-empt or to reclaim degraded areas through judicious management, soil conservation structures will be undertaken.
Landuse planning will form the central strategy to combat, prevent and regulate activities that may have adverse effect on the land, soil and water resources. Landcare forums will be established, and area-wide planning undertaken.
Specific policies developed will be on Landcare, internal mechanization.
4.1.8 Progress analysis
Several awareness campaigns have been undertaken to educators all stakeholders. Three area-wide plans are being finalised out of which six projects are being implemented. Soil conservation intervention measures are ongoing.
4.1.9 Analysis of constraints and measures planned to overcome them
Constraints Strategy
Lack of budget – Landcare budget traditionally was supplied from National sources.
It is planned to ramp up internal funding for Landcare projects in future budget cycles
Lack of maintenance of existing conservation and capacity to build smaller conservation work.
A decision has been made to acquire mechanisation units to undertake soil conservation works
Lack of policy on development of landcare communities
Policy formulation ongoing

32
4.1.10 Specification of measurable objectives and performance indicators
Measurable Objective
Outputs Performance Indicator Year1
05/06
Year 2
06/07
Year3
07/08
Year 4
08/09
Year 5
09/10
39 No. of land-use plans developed
0 3 6 12 18
39 Number of land use reports completed
0 3 6 12 18
42 Number of business plans processed
0 3 9 12 18
1. Land use planning
290 Number of applications for subdivision and change of agricultural land use processed
30 50 60 70 80
1369 Number of hectares cleared of alien and invader plants
37 267 315 350 400
180000 Area protected by conservation measures
0 30000 40000 50000 60000
74 Number of Mechanical Units Purchased (Dept use)
0 0 34 25 15
2. Provision of Resource Conservation Services
2 Number of Mechanical Units Maintained (Dept use)
1 1 1 2 2
1258 Number of campaigns undertaken
18 270 300 320 350
Number of project beneficiaries and officials trained
1620 Beneficiaries 200 300 350 370 400
570 Officials 50 100 120 140 160
3. Land care awareness
86 Number of land care institutional structures established
3 6 12 25 40

33
4.1.11 Project Management Support & GIS
4.1.12 Description of planned quality improvement measures
The department has identified the need for good planning of projects to achieve efficient utilization of resources. The component will be utilised to plan and monitoring of implementation of infrastructure projects.
4.1.13 Specified policies, priorities and strategic objectives
The component would provide industry norms to project implementation methodology, activity scheduling and material costs as well as quality assurance. Geographical information system is critical to the planning, implementation and ex-post monitoring of projects
4.1.14 Progress analysis
The department has adopted and installed the PS-Next project management system. Most programme managers have undergone training on this system. The Project planning Manager has been appointed and other staff members are been appointed on an ongoing basis. The post of Senior Manager has been advertised and appointment is scheduled for March/April 2007.
4.1.15 Analysis of constraints and measures planned to overcome them
Constraints Strategy
Lack of progress in establishing a GIS unit due to Dept of Premier moratorium
Harware and software for GIS system is being put in place.
4.1.16 Specification of measurable objectives and performance indicators
Measurable Objective
Outputs Performance Indicator
Year1
05/06
Year 2
06/07
Year3
07/08
Year 4
08/09
Year 5
09/10

34
Measurable Objective
Outputs Performance Indicator
Year1
05/06
Year 2
06/07
Year3
07/08
Year 4
08/09
Year 5
09/10
Project planning 102 Number of projects planned
0 0 40 31 31
Project Monitoring
102 Number of projects monitored
0 0 40 31 31
Project Reporting
102 Number of projects reported on
0 0 40 31 31
100% Development of the database
0 0 50% 100% 100% GIS
220 Number of maps produced
0 0 20 80 120
5. PROGRAM 3: FARMER SUPPORT AND DEVELOPMENT
5.1 Land and Agrarian Reform
5.1.1 Description of planned quality improvement measures
5.1.1.1 Development of a strategy and framework to facilitate and fast-track proactive land acquisition strategy (PLAS)
5.1.1.2 Revise the farmer selection criteria to avoid continued settlement of non farmers, which compromise sustainable agricultural development
5.1.1.3 Develop a vigorous strategy in dealing with state land management e.g. eviction of defaulters and invaders
5.1.1.4 Practical training of land reform beneficiaries in the technical agriculture and farm management (including financial management)
5.1.1.5 Upscale monitoring and evaluation of the equity partnership projects to ensure preparedness for exit as well as protection of the communities interests.

35
5.1.1.6 Intensify the strategy for tenure security facilitation on RESIS and former ARDC projects
5.1.1.7 Continue to perfect the strategic partnership models
5.1.2 Specified policies, priorities and strategic objectives
5.1.2.1 The department derives a mandate to do farmer settlement and post-transfer support from section 25 of the Constitution of the Republic of South Africa, the White Paper on South African Land Reform, the Strategic Plan for South Agriculture in South Africa and all policies that flow herefrom. The specific policies and programs are State Land Administration Act, Land Redistribution for Agricultural Development, Proactive Land Acquisition Strategy, Comprehensive Agricultural support Program, as well as Departmental policies like the Funding Strategy for land reform projects and Strategic Partnership Models.
5.1.2.2 The priorities and strategic objectives are:
• To contribute to the redistribution of 30% of commercial agricultural land in an effort to bring equity in land ownership by 2014. This will be done through the facilitation of access to high value commercial agricultural land for black people in the form of outright ownership, leases and equity shares;
• Support land restitution and redistribution through pre and post settlement support mechanisms;
• Commercialisation of small-scale farmers through creation of 700 commercial farmers by 2014
• Facilitation of tenure security for small scale farmers in order to promote sustainability and improved investment in agricultural development;
• Facilitate and develop sustainable commercial enterprises;
• Efficient management of stante lad in order to avoid land invasions so as to create an environment conjunctive for sustainable agricultural development;
• Contribute to job creation and growing the economy through optimal utilization of redistributed land;
• Promote succession in the agricultural sector through development of young agricultural entrepreneurs.
5.1.3 Progress analysis

36
To date, 308 009 hectares of land have been redistributed through restitution (with the support of LDA seconded staff) and LRAD (in which LDA plays a major role through development of feasibility studies and business plans to motivate for projects approval). The approach for Proactive Land Acquisition Strategy in Limpopo and Caretakership Agreement pro-forma have been documented and adopted by the Provincial Land Reform Office (regional office of the Department of Land Affairs.
In terms of post settlement support, the following policy guidelines have been developed:
• Funding strategy for land reform projects
• Strategic partnership models and guidelines
• Approval criteria for funding under CASP
More than 40 land reform projects have received CASP funding and support. Twelve of these projects have developed 40 000 (each) capacity poultry houses under a secured market.
5.1.4 Analysis of constraints and measures planned to overcome them
ANALYSIS OF CONSTRAINTS MECHANISMS TO OVERCOME CONSTRAINTS AND IMPROVEMENT PLANS
Competing land uses with prime agricultural land being lost to other developments like mining, housing and game farming;
Risk of food insecurity due to continued alienation of communal agricultural land;
Land-use mapping to be developed and shared with all stakeholders, including Municipalities for consideration in the LED. Ensuring that the Land Reform provincial, district and municipal committees/forums function optimally.
Growing impatience and demands for a fast-tracked land redistribution from certain pressure groups with unreasonable demands;
Fastrack the implementation of the Proactive Land Acquisition Strategy.
Invasion of state agricultural land and unwillingness by leasees to honour the lease contracts A vigorous approach to evict the defaulters and invaders.
De-linking land ownership from the business entity.
Re-engineering overpopulated projects and development of business models which de-link the business from land ownership.
Development of effective post settlement support programmes through grant funding, capacity building
Inadequate utilization of redistributed commercial land and unsustainable operations
Investing in infrastructural development on distributed farms.
Ensure that a monitoring and evaluation system for the program exists and is implemented;
Strategic partnership models secures both advanced management skills and financial resources to cover the operational expenses The demand for assistance, management and extension
services on high value commercial enterprises is increasing;
Following the commodity approach for extension services
Limited water resources. Promotion of water saving enterprises and development water efficient irrigation systems
Repossession of farms due to inability by farmers to service the bonds-reversal of the gains of land reform
Intervention strategy drawn to avert repossessions and where this cannot be avoided, government to be given the first right of refusal to buy back the land

37
5.1.5 Specification of measurable objectives and performance indicators
Measurable Objectives Outputs Performance Indicator Year 1 05/06
Year 2 06/07
Year 3 07/08
Year 4 08/09
Year 5 09/10
15,000 Number of hectares of state land released from other governement departments
2,605 775 5,423 3,099 3,099
125 Number of land claims projects finalized by seconded officials 35 25 35 30 0
1. Facilitate access of commercial agricultural land by black farmers
495,000 Number of hectares of commercial land redistributed to PDFs 35,000 45,000 75,000 195,000 145,000
22,479 Number of hectares of state land cleared of invasion 9,479 6,500 3,900 2,600 0
2. Providing effective state land management.
25 Number of municipalities having reliable state land registers 0 13 12 0 0
25 Number of local municipalities supporting land reform through incorporation of projects in the LED
0 0 6 10 9
25 Number of municipalities having agricultural zones mapped/land use mappping
0 0 13 12 0
315 Number of projects funded through CASP, PIG and other sources of funding
15 30 50 95 125
300 Number of new commercial farmers developed from the PDFs 20 35 45 80 120
26 Number of Agri-BEE/equity projects established 2 3 5 8 8
3. Provision of pre & post settlement support to land reform projects (Restitution and Redistribution).
13 Number of municipalities having youth projects 1 0 5 3 4
40 Number of RESIS and former ARDC projects under secure tenure
4 0 16 10 10
35 Number of fomer ARDC and SISAL projects restructured 5 0 17 13 0
4. Facilitate tenure reform; provide administration services for ARDC projects; and the implementation of viable operating arrangements, in order to ensure the sustainability of SLAG, ARDC and Sisal projects
37 Number of SLAG projects turned into viable enterprises 0 2 13 11 11

38
5.2 District Development Services
5.2.1 Description of planned quality improvement measures
District Development Plans will be effectively developed with the support of the Agricultural Development Strategy. Improved youth, women and disabled farmers mobilization shall be done to increase participation of designated groups in the agricultural sector. Infrastructural support and coordination shall be improved to increase expenditure on CASP and other donor supported projects.
4.1.17 Specified policies, priorities and strategic objectives
5.2.1.1 The Food and Agricultural Organization of the United Nations made a commitment to cut by half
the 800m starving people by the year 2015. Unfortunately, in sub-Saharan Africa the number of
starving people has increased alarmingly from 168million in 1990/1991 to 202million in 1999/2000.
This means that at the current rate of development, the 2015 challenge will only be realized by the
year 2050. There is a need to accelerate economic growth efforts.
5.2.1.2 The Mellor Poverty and Prosperity Report argue that Rural and Agricultural Growth brings a sharp
decline in poverty through increased farm production, more employment, and lower food prices.
Thus investment in rural and agricultural development presents the best option for poverty
reduction. The 2004 Growth and Development Strategy (LPGDS) states that the issue of food
security in agriculture should be addressed within the value chain.
5.2.1.3 The 2003 National Spatial Development Perspective (NSDP) puts forward mechanisms aimed at
ensuring better alignment between infrastructure investment and development programmes and
should inform the respective development plans of local and provincial government, namely;
Integrated Development Plans (IDP) and Provincial Growth and Development Strategies (PGDS).
NSDP is designed to act as an indicative planning tool and should be used as an instrument for
policy co-ordination. The normative principles contained in the document to guide infrastructure
investment and development spending is articulated as follows:
• Economic growth is prerequisite;
• Spending on fixed investment should focus on areas with economic development potential;
• Areas with low development potential should focus on basic services, social transfers, HRD and
labour market intelligence;

39
• Channel future settlement and economic development opportunities into activity corridors adjacent
to main growth centres.
5.2.1.4 5.2.2.4In terms of specific agricultural policy pronouncements the 2003 National Agricultural
Sector Plan as well as the 1995 Draft White Paper on Agriculture states that:
• The department will maintain formal liaison with organized agriculture, civil society, national and
provincial departments and other structures;
• Farming systems and the incentives by which they are driven should be based on sound principles
and practices that are sustainable and environmentally, economically, socially, scientifically, and
politically appropriate;
• Government agricultural programmes will be scientifically and practically planned and executed in
consultation with farmers and other stake-holders;
• Specialized agricultural support services will be rendered to farmers participating in land-reform
programmes. Special attention will be given to upgrade the agricultural skills of these farmers;
• Priority will be given to policies and strategies to identify and protect the high potential agricultural
natural resources (especially soil, grazing and water) of the Province;
• The image of agriculture as a career and business opportunity will be promoted, particularly in
education institutions;
• Integrated rural development will be encouraged in the design in implementation of agricultural
development strategies and systems;
• The needs of farmers, specifically new entrants and small-scale farmers, will be met through the
reorientation and training of trainers, extension and research workers;
• Agricultural practices will be continually developed, adapted and applied in their local context,
taking account of the highly variable climate and limited agricultural land;
• CASP and MAFISA will provide an enabling mechanism to accelerate agricultural development
PRIORITIES:
• To develop, communicate and implement District Development Plans with all major stakeholders
(municipalities, farmers, communities, traditional leaders, etc);
• To facilitate development and management of agricultural support systems for all categories of
farmers;
• To develop broad-based succession plans for extension and advisory service management
capacity at all levels;

40
• To facilitate implementation of CASP, LAND CARE, RESIS and related support services for
targeted commodity groupings;
• To judiciously manage all resources in the District;
• To do all this within the ambit of Batho Pele.
• To develop appropriate, demand led extension services system;
• To facilitate farmer development systems;
• To promote innovation towards solving development issues.
STRATEGIC OBJECTIVES:
1.1. To development and communicate District Development Plans;
1.2. To provide in a participatory manner, relevant, up-to-date, and properly aligned services to all
categories of clients using the value chain analysis and commodity based approach;
1.3. To ensure the Human Resource capacity is adequate and capable to provide requisite services.
4.1.18 Progress analysis
5.2.1.5 District Service made significant progress in the appointment of technical staff, mainly value chain,
Human resources, Finance and technical specialists at District level. Municipal service delivery
was enhanced by the appointment of Agricultural Municipal Managers coupled with technical staff
scientist in animal, crop production and value chain economists to support the farmers. Emphasis
was placed on improving the service delivery through the CASP, its expenditure and compliance
with policy. Linkages with Municipalities were improved through interaction at LED offices jointly
improving the participation of youth, women and disabled in agriculture through summits,
competitions and Imbizos.
4.1.19 Analysis of constraints and measures planned to overcome them
ANALYSIS OF CONSTRAINTS MECHANISMS TO OVERCOME CONSTRAINTS AND
IMPROVEMENT PLANS

41
Farmers are not organized according to
specific commodity groups for better
coordination of services and economies of
scale;
Establishment and alignment of physical and financial
services within the value-chain and commodity
approach framework;
Inadequate management and technical
skill competency;
Development, communication, and implementation of
district development plans;
Historical infrastructure backlogs require
more re-planning of the areas;
Strengthening of the farmer formations to articulate their
demand;
Land tenure arrangements make credit
access difficult and alternative financing
mechanisms are needed;
Development and implementation of a broad-based
succession plan.
Low literacy, numeric levels and lack of
farming skills affect yields;
Extension strategies and approaches appropriate to
small holder farming;
Competency and confidence of officers
adapt to rapid changes in service delivery.
Human Resource Capacity building among extension
staff;
Inadequate technical capacity of the
Extension staff to provide appropriate
information to farmers;
Change Management program to improve the response
system of the officers to the needs of the farmers;
Appropriateness of the methodologies
and management systems to enable
officers to work with the farmers;
Finding innovative solutions to service delivery issues;
Management capacity for Donor funded
projects and the institutionalization
thereof;
Develop a communication strategy for technology
transfer and adoption;
Uncoordinated development support by
agencies;
Strengthen linkages between research and extension
and the farming community;

42
Subprogram: District Agricultural Development Services
SUBPROGRAM: DISTRICT AGRICULTURAL DEVELOPMENT SERVICES Measurable Objectives Output
Performance Indicator Year 1 Year 2 Year 3 Year 4 Year 5
2005/ 2006 2006/2007 2007/2008 2008/2009 2009/2010 5 Number district
agricultural plans developed evaluated and monitored per annum.
5 5 5 5 5
Develop District Agricultural Development(DDP) Plans and communicate to stakeholders
26 Five District Development Plan Imbizos conducted per year
6 5 5 5 5
Alignment of District Agricultural Development Plans with IDP
150 Number of agriculture infrastructure projects included in the IDP
30 30 30 30 30
Develop Municipal Profiles
25 Twenty Five municipal profiles developed updated and evaluated per year
0 25 25 25 25
Facilitate capacity building of all tech staff extension and managers in Participatory, commodity and other extension approaches
250 Numbers of officers trained and managers oriented in PEA commodity and other extension approaches
600 90 85 85 50
135 Number of youth projects
20 25 25 30 35
320 Number of Women Projects
50 65 65 70 70 To promote that there is participation of youth, disabled and women in agriculture 37 Number of projects
for people with disability
5 7 7 9 9
Facilitate integrated planning and Management of CASP DONOR FUNDED PROJECTS
150 Number of CASP and Donor Funded projects
30 30 30 30 30
5.3 TECHNICAL PRODUCTION SERVICES

43
4.1.20 Food Security and Vulnerability Reduction
4.1.21 Description of planned quality improvement measures
• Food security and poverty reduction interventions to be developed should be appropriately targeting, massified and sustainable.
• Involvement of experienced local partnerships will bring in the facilitation capacity required at that level.
• Mitigation strategies that reduces effects of poverty and natural disasters.
4.1.22 Specified policies, priorities and strategic objectives
The following policies are applicable :
• Poverty alleviation strategy .
• Integrated Food Security and Nutrition Program .
• Disaster management.
4.1.23 Priorities and Strategic Objectives
• This program target vulnerable households in the nodal area and poverty pockets
• To create awareness and education on food insecurity issue
• To develop strategies, technologies and capacity to enable food insecure households to access food.
5.3.1.1 Progress analysis
Households have received production support packs for vegetables, eggs, dairy production in the
homesteads. Infrastructure for micro enterprises and food production has been developed and some
have started producing. Projects requiring infrastructure have been identified.
Analysis of constraints and measures planned to overcome them
CONSTRAINTS CORRECTIVE MEASURES
1. Lack of an appropriate strategy that targets the vulnerable with visible impact
1. Implement a strategy that target the vulnerable and show visible impact.
2. Small units / projects putting too much strain on the efficiency of the limited human resources
2. Services to be outsourced to local CSO’s with the Units massified for visible and efficient delivery.
3.Lack of institutional mechanisms to manage food insecurity at municipal level
Development of institutional mechanisms to facilitate implementation at local level
4. Inadequate measures of preparedness for disaster Implement Early warning system and proactive mitigation
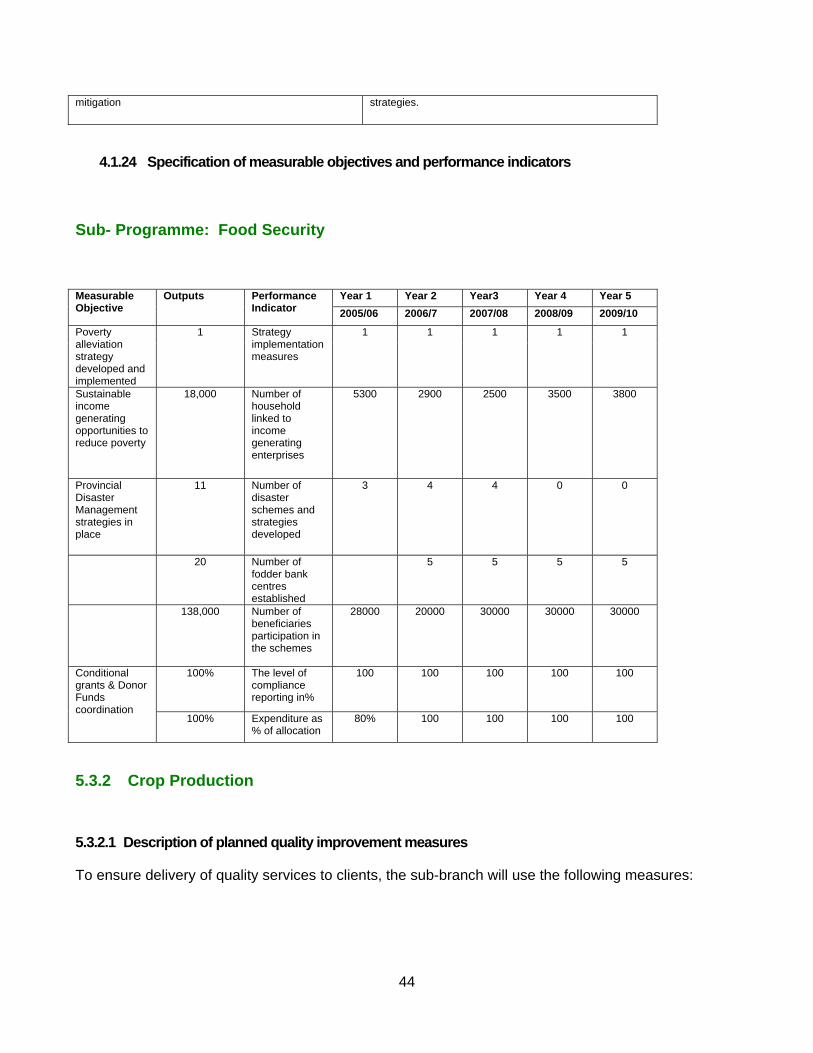
44
mitigation strategies.
4.1.24 Specification of measurable objectives and performance indicators
Sub- Programme: Food Security
Year 1 Year 2 Year3 Year 4 Year 5 Measurable Objective
Outputs Performance Indicator 2005/06 2006/7 2007/08 2008/09 2009/10
Poverty alleviation strategy developed and implemented
1 Strategy implementation measures
1 1 1 1 1
Sustainable income generating opportunities to reduce poverty
18,000 Number of household linked to income generating enterprises
5300 2900 2500 3500 3800
Provincial Disaster Management strategies in place
11 Number of disaster schemes and strategies developed
3 4 4 0 0
20 Number of fodder bank centres established
5 5 5 5
138,000 Number of beneficiaries participation in the schemes
28000 20000 30000 30000 30000
100% The level of compliance reporting in%
100 100 100 100 100 Conditional grants & Donor Funds coordination
100% Expenditure as % of allocation
80% 100 100 100 100
5.3.2 Crop Production
5.3.2.1 Description of planned quality improvement measures
To ensure delivery of quality services to clients, the sub-branch will use the following measures:
45
(a) Project based planning and delivery:
In line with the Project based service delivery approach adopted by the Department, the sub-branch
has identified projects which are to be executed in the MTEF period. Each project is allocated to a
project team with a project manager. This will improve the focus of the sub-branch in its service
delivery and its responsiveness to the needs of the clients. Teams both vertical and horizontal will
undertake planning and delivery of projects.
(b) Improved information system and guidelines:
Guidelines and information manuals on specific commodities will be acquired to support frontline staff.
Information packs suitable for farmers will be identified and provided in the language they can
understand.
(c) Improved frontline delivery support.
Capacity development and support of the extension staff in the districts and local municipalities will
progressively be enhanced.
5.3.2.2 Specified policies, priorities and strategic objectives
(a) The policies that will guide the sub-programme in its service delivery will includes all Crop Production, LDA commercialization and irrigation policies. Policies such as mechanization, input support and commodity specific policies and strategies developed will guide the implementation of projects.
(b) The strategic objectives of the sub-program shall include the development of policies /
strategies, provision of technical information, and planning and supporting identified viable
projects.
5.3.2.3 Progress analysis
The sub-program has made some efforts to achieve the strategic objectives, and such efforts include:
(a) Development of policies / strategies, viz. Mechanization policy, Crop production strategy, Input supply policy, and fruit production policy has been done to guide access and support.
(b) Provision of technical information, through acquired crop manuals. 28 Automatic Weather Stations (AWS) were installed to provide climatic information, soil data throughout the province. Crop menus were developed for major irrigation schemes.
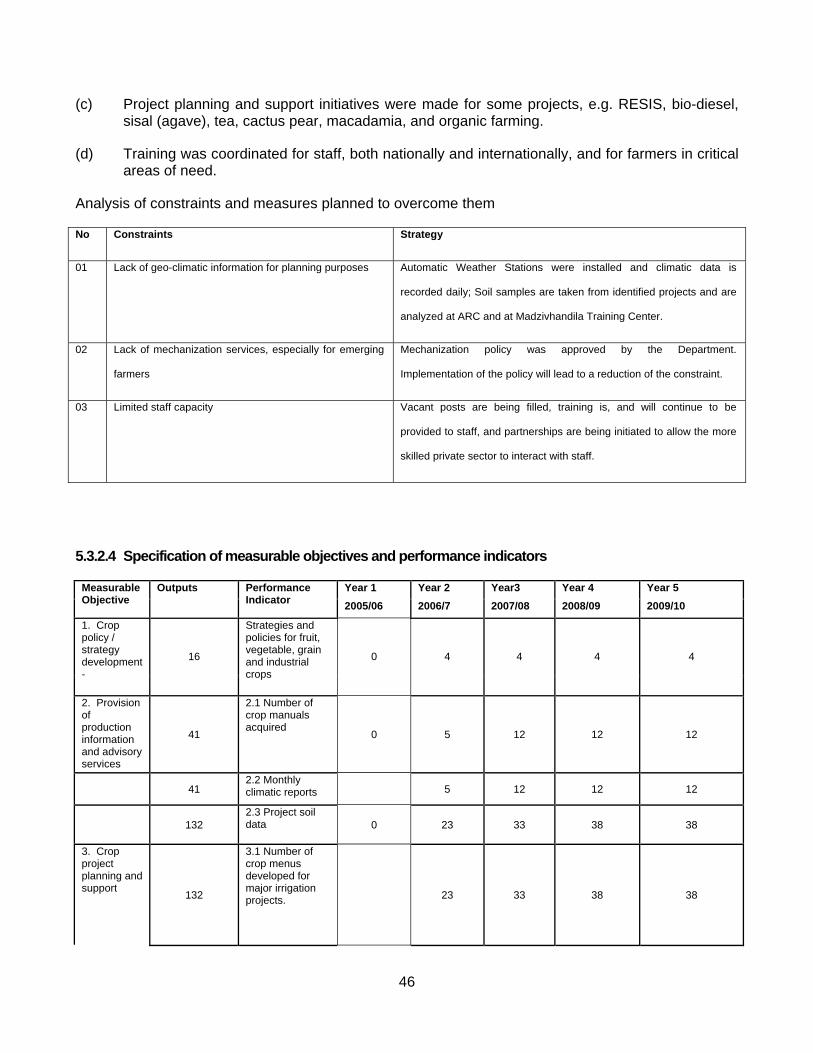
46
(c) Project planning and support initiatives were made for some projects, e.g. RESIS, bio-diesel, sisal (agave), tea, cactus pear, macadamia, and organic farming.
(d) Training was coordinated for staff, both nationally and internationally, and for farmers in critical areas of need.
Analysis of constraints and measures planned to overcome them
No Constraints Strategy
01 Lack of geo-climatic information for planning purposes Automatic Weather Stations were installed and climatic data is
recorded daily; Soil samples are taken from identified projects and are
analyzed at ARC and at Madzivhandila Training Center.
02 Lack of mechanization services, especially for emerging
farmers
Mechanization policy was approved by the Department.
Implementation of the policy will lead to a reduction of the constraint.
03 Limited staff capacity Vacant posts are being filled, training is, and will continue to be
provided to staff, and partnerships are being initiated to allow the more
skilled private sector to interact with staff.
5.3.2.4 Specification of measurable objectives and performance indicators
Year 1 Year 2 Year3 Year 4 Year 5 Measurable Objective
Outputs Performance Indicator 2005/06 2006/7 2007/08 2008/09 2009/10
1. Crop policy / strategy development -
16
Strategies and policies for fruit, vegetable, grain and industrial crops
0 4 4 4 4
2. Provision of production information and advisory services
41
2.1 Number of crop manuals acquired
0 5 12 12 12
41
2.2 Monthly climatic reports 5 12 12 12
132
2.3 Project soil data 0 23 33 38 38
3. Crop project planning and support 132
3.1 Number of crop menus developed for major irrigation projects. 23 33 38 38
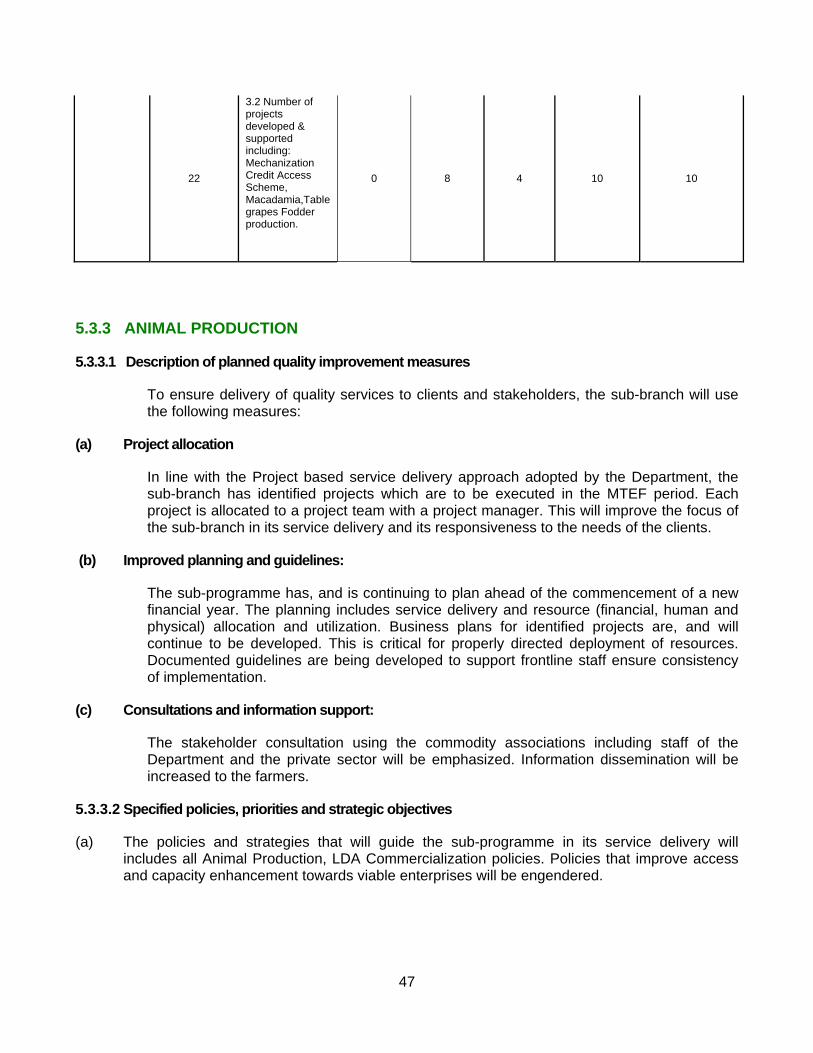
47
22
3.2 Number of projects developed & supported including: Mechanization Credit Access Scheme, Macadamia,Table grapes Fodder production.
0 8 4 10 10
5.3.3 ANIMAL PRODUCTION
5.3.3.1 Description of planned quality improvement measures
To ensure delivery of quality services to clients and stakeholders, the sub-branch will use the following measures:
(a) Project allocation
In line with the Project based service delivery approach adopted by the Department, the sub-branch has identified projects which are to be executed in the MTEF period. Each project is allocated to a project team with a project manager. This will improve the focus of the sub-branch in its service delivery and its responsiveness to the needs of the clients.
(b) Improved planning and guidelines:
The sub-programme has, and is continuing to plan ahead of the commencement of a new financial year. The planning includes service delivery and resource (financial, human and physical) allocation and utilization. Business plans for identified projects are, and will continue to be developed. This is critical for properly directed deployment of resources. Documented guidelines are being developed to support frontline staff ensure consistency of implementation.
(c) Consultations and information support:
The stakeholder consultation using the commodity associations including staff of the Department and the private sector will be emphasized. Information dissemination will be increased to the farmers.
5.3.3.2 Specified policies, priorities and strategic objectives
(a) The policies and strategies that will guide the sub-programme in its service delivery will includes all Animal Production, LDA Commercialization policies. Policies that improve access and capacity enhancement towards viable enterprises will be engendered.
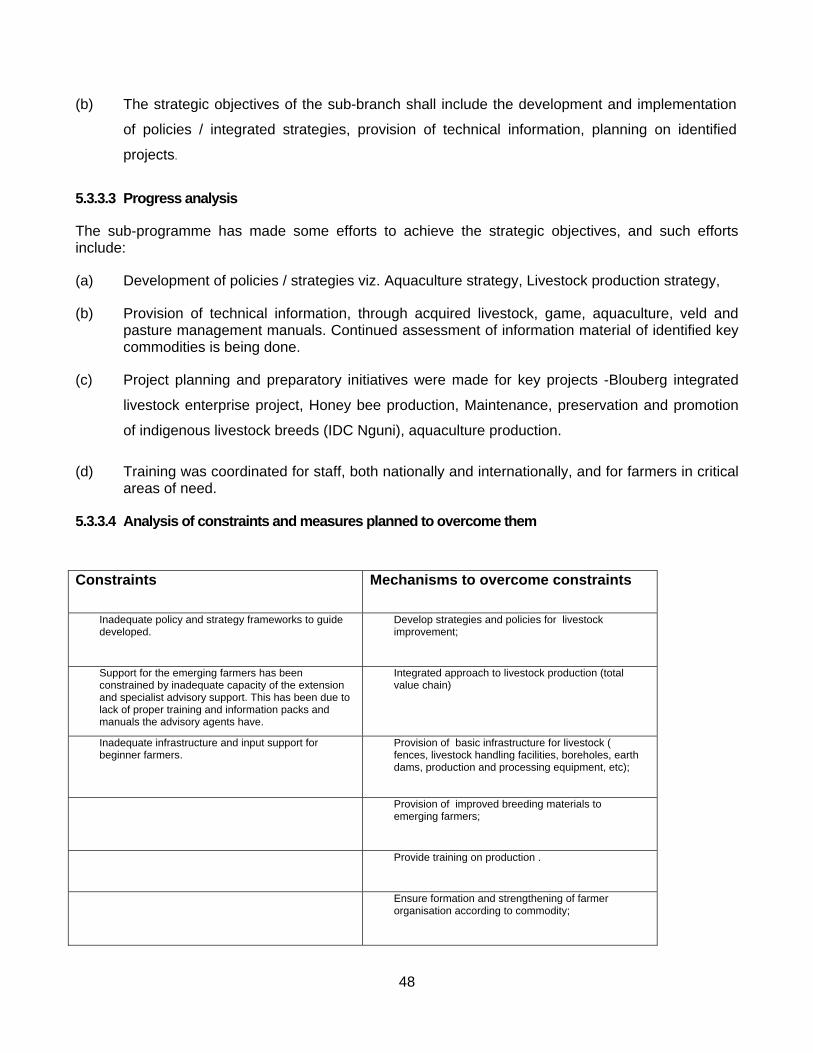
48
(b) The strategic objectives of the sub-branch shall include the development and implementation
of policies / integrated strategies, provision of technical information, planning on identified
projects.
5.3.3.3 Progress analysis
The sub-programme has made some efforts to achieve the strategic objectives, and such efforts include:
(a) Development of policies / strategies viz. Aquaculture strategy, Livestock production strategy,
(b) Provision of technical information, through acquired livestock, game, aquaculture, veld and pasture management manuals. Continued assessment of information material of identified key commodities is being done.
(c) Project planning and preparatory initiatives were made for key projects -Blouberg integrated
livestock enterprise project, Honey bee production, Maintenance, preservation and promotion
of indigenous livestock breeds (IDC Nguni), aquaculture production.
(d) Training was coordinated for staff, both nationally and internationally, and for farmers in critical areas of need.
5.3.3.4 Analysis of constraints and measures planned to overcome them
Constraints Mechanisms to overcome constraints
Inadequate policy and strategy frameworks to guide developed.
Develop strategies and policies for livestock improvement;
Support for the emerging farmers has been constrained by inadequate capacity of the extension and specialist advisory support. This has been due to lack of proper training and information packs and manuals the advisory agents have.
Integrated approach to livestock production (total value chain)
Inadequate infrastructure and input support for beginner farmers.
Provision of basic infrastructure for livestock ( fences, livestock handling facilities, boreholes, earth dams, production and processing equipment, etc);
Provision of improved breeding materials to emerging farmers;
Provide training on production .
Ensure formation and strengthening of farmer organisation according to commodity;
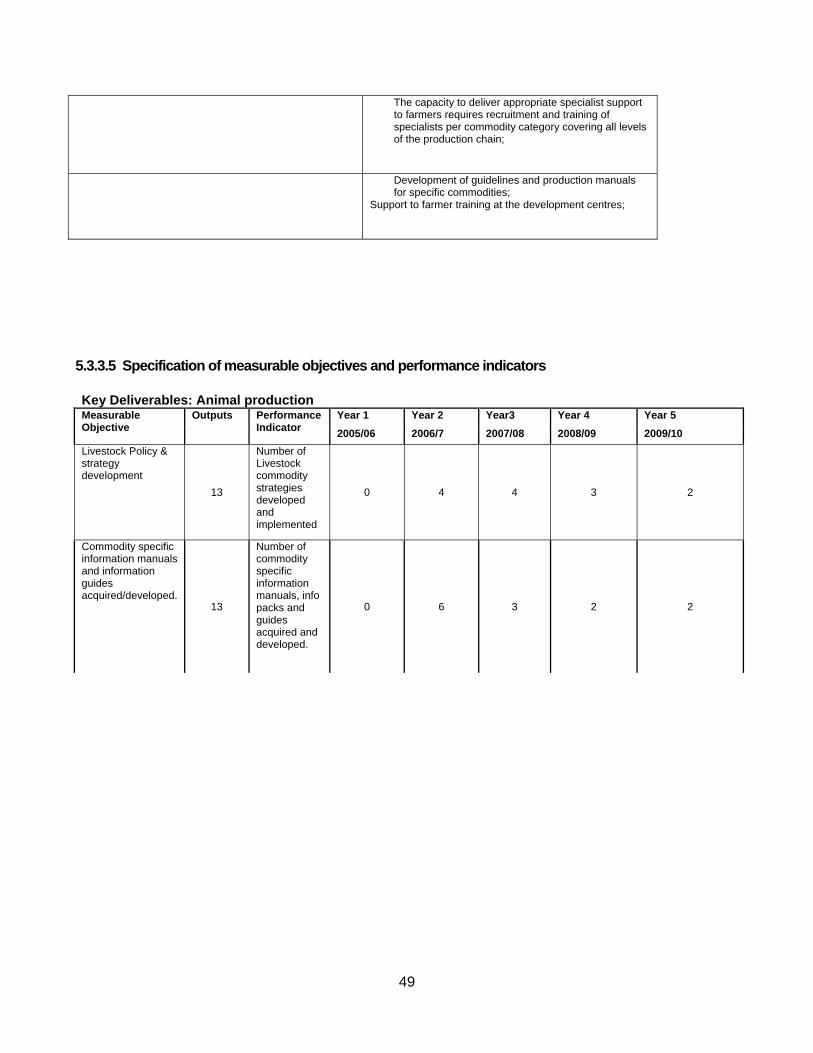
49
The capacity to deliver appropriate specialist support to farmers requires recruitment and training of specialists per commodity category covering all levels of the production chain;
Development of guidelines and production manuals for specific commodities;
Support to farmer training at the development centres;
5.3.3.5 Specification of measurable objectives and performance indicators
Key Deliverables: Animal production Year 1 Year 2 Year3 Year 4 Year 5 Measurable
Objective Outputs Performance
Indicator 2005/06 2006/7 2007/08 2008/09 2009/10 Livestock Policy & strategy development
13
Number of Livestock commodity strategies developed and implemented
0 4 4 3 2
Commodity specific information manuals and information guides acquired/developed.
13
Number of commodity specific information manuals, info packs and guides acquired and developed.
0 6 3 2 2

50
Livestock Project Planning & support.
17
6 Livestock projects plans: 1. Integrated Honey Bee production, 2.Integrated aquaculture production, 3. Integrated livestock Projects (Blouberg integrated livestock project) 4.IDC Nguni Project, 5.Integrated Pig production, 6. Integrated Goat production. 7. Pet food project for FMD areas.
1 7 2 3 2
380
Number of bull distributed to emerging farmers
60 80 80 80 80
Number of females distributed to emerging farmers
40 60 60 60
Preservation, maintenance and promotion of indigenous breeds
25
Type and number of genotypes with records up to date
4 4 5 5 5
Livestock Identification. 2900
Number of Livestock owners registered
500 1000 1000 200 200

51
6. PROGRAM 4: VETERINARY SERVICES
6.1 Animal Health
6.1.1 Description of planned quality improvement measures
• Capturing of all animal handling facilities in the database linked to livestock census and improvement of analysis systems to predict possible disease risks areas.
• Road shows to propagate implementation of the new meat safety regulations
• Advance the recruitment of Veterinary laboratory staff, development of disease control infrastructure and disease protocols.
6.1.2 Specified policies, priorities and strategic objectives
• Ensuring functional handling and movement control facilities to attain 80% coverage with any disease control activity.
• Sampling protocols for emerging diseases like Avian Flu, BSE, Classical Swine Fever will be applied.
6.1.3 Progress analysis
• Most of the facilities are captured, with the main exercise now being to record their geographic coordinates (geo-referencing) .
• Disease control fences are maintained.
• There is adequate compliance with regulatory disease control measures.
• Agreements on improvements made with individual abattoir operators and time lines fixed
• Laboratory Information Management System being rolled out
6.1.4 Analysis of constraints and measures planned to overcome them
.
Constraints Measures
Game reserve fences remain the main impediment in Cross-Sectoral and intergovernmental collaboration on

52
ensuring freedom from FMD maintenance of fences.
Inadequate awareness of abbatoir owners on compliance issues.
Awareness campaigns and training.
Shortage of veterinary personnel. Trainees are sponsored with service obligation contracts.
6.1.5 Specification of measurable objectives and performance indicators-Strategic plan
Year 1 Year 2 Year3 Year 4 Year 5 Measurable Objective
Outputs
Performance Indicator 2005/06 2006/7 2007/08 2008/09 2009/10
2,604,439
80% of 600 000 Communal cattle vaccinated for Anthrax & Black Quarter once per year
344,439 500,000 550,000 600,000 610,000
Vaccinations Services
2,604,439
35% of 130 000 dogs and cats vaccinated for Rabies once per year
344,439 500,000 550,000 600,000 610,000
351,613
Heifers (25% 600000) vaccinated for Brucellosis per year
39613 70,000 77,000 80,000 85,000
524,198
70 000 cattle vaccinated for Foot and Mouth in the FMD buffer area twice a year
19,198 100,000 130,000 135,000 140,000
840,266
The number of dips per annum on communal cattle
265,266 140,000 145,000 145,000 145,000

53
Dipping Services 11,159,883
Animals treated on demand based on current trends
959,883 1,500,000 2,000,000 3,200,000 3,500,000
Number of treatments 14,100
Permits & certification on demand based on current trends
2 067 3,000 3,500 3,600 4,000
Veterinary Public Health: Permits/Cert Issued
44,000
The number inspections done on 146 Abattoirs’ required monthly inspections
11, 359 13,000 14,00 15,000 16,000
Facilities Inspected 3,386
Abattoir Appraisals done on demand based projections on current demand
411 425 850 850 850
150 Number of diagnostic tests
15 20 30 40 45
Laboratory Services: diagnostic tests
321,404 Number of km of fence constructed
29,404 65,000 70,000 77,000 80,000
Biosecurity & Disease control Fence
457 km of FMD control fence constructed
30 30 157 180 60
Biosecurity Strategies 7
Disease protocols and frameworks
1 3 3 0 0
7 PROGRAMME 5: TECHNOLOGY RESEARCH AND DEVELOPMENT SERVICES
7.1 Research

54
7.1.1 Description of planned quality improvement measures
Research will focus on development of technology along the value chain of major commodities to LDA clients, transfer of research trial results to farmers and establishment of innovation around research projects planned in the current year. Capacity in research shall be developed by aligning post-graduate studies with projects within the sub-branch in agronomy, livestock, indigenous knowledge and risk mitigation.
7.1.2 Specified policies, priorities and strategic objectives
1. To facilitate the quality and quantity of food production;
2. The introduction and evaluation of high value crops with local and export market potential;
3. Provision and adoption of appropriate technology responding to the broad socio-economic
and environmental challenges;
4. Strengthening research and training capacity of agricultural beneficiaries.
7.1.3 Progress analysis
Major progress will be achieved by ensuring the development of Indigenous Knowledge System Strategy and development of technologies tested through the Biodiesel project value chain. Drought mitigation in livestock will take front-line stage to support integrated livestock production in Blouberg through feedlot trials. Novel commodities such as prickly pear shall be subjected to technology testing for the purposes of processing for human consumption. Seed multiplication shall be enhanced by more trials in dry beans coupled with a processing unit together with farmers.
7.1.4 Analysis of constraints and measures planned to overcome them
ANALYSIS OF CONSTRAINTS MECHANISMS TO OVERCOME CONSTRAINTS AND
IMPROVEMENT PLANS
Lack of an integrated agricultural research
policy framework
Develop and implement agricultural research framework
(research policy and strategy)
The decline in the number of
researchers in the agriculture
and related fields
Ensure training of researchers in Participatory & Action
Oriented Research methodologies and other
quantitative & qualitative research methods
Poor coordination and linkages between Develop research human capacity building
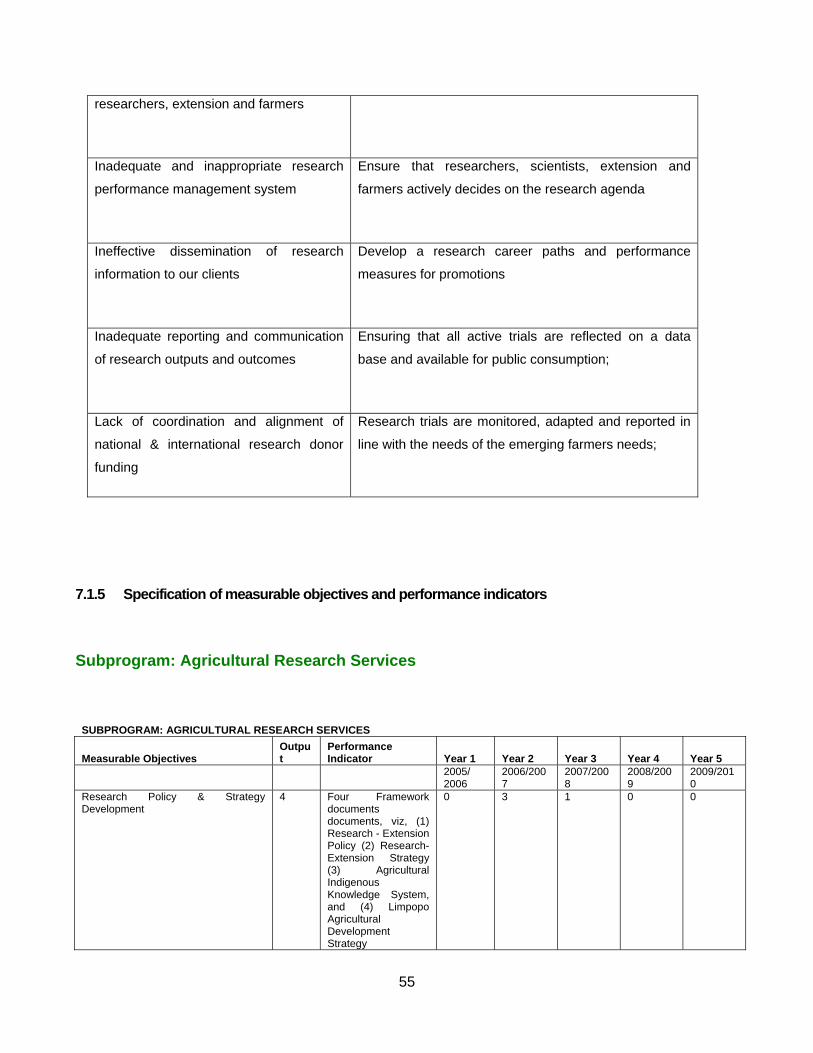
55
researchers, extension and farmers
Inadequate and inappropriate research
performance management system
Ensure that researchers, scientists, extension and
farmers actively decides on the research agenda
Ineffective dissemination of research
information to our clients
Develop a research career paths and performance
measures for promotions
Inadequate reporting and communication
of research outputs and outcomes
Ensuring that all active trials are reflected on a data
base and available for public consumption;
Lack of coordination and alignment of
national & international research donor
funding
Research trials are monitored, adapted and reported in
line with the needs of the emerging farmers needs;
7.1.5 Specification of measurable objectives and performance indicators
Subprogram: Agricultural Research Services
SUBPROGRAM: AGRICULTURAL RESEARCH SERVICES
Measurable Objectives Output
Performance Indicator Year 1 Year 2 Year 3 Year 4 Year 5
2005/ 2006
2006/2007
2007/2008
2008/2009
2009/2010
Research Policy & Strategy Development
4 Four Framework documents documents, viz, (1) Research - Extension Policy (2) Research-Extension Strategy (3) Agricultural Indigenous Knowledge System, and (4) Limpopo Agricultural Development Strategy
0 3 1 0 0

56
158 Number of researchers on formal studies based on research needs of 21 commodity
26 30 33 34
35 Develop Research Human Capacity
230 Number of researchers on basic / advanced research methods
50 45 45 45 45
12 Number of commodity value chain technologies tested / developed together with extension and farmers
8 1 1 1 1
5 Develop Biodiesel Technologies & Innovation from Oil Crops
0 1 1 1 1
Research & Technology Development for improved Sector Performance
8 Number of Risk mitigation Technplogies developed with farmers for Risk Management Strategies based on Perceived risk
4 1 1 1 1
95 Number of commodity based research & demonstration trials
15 20 20 20 20
71 Number of formal & informal publication
5 9 12 20 25
250 Number of New Technologies made available to Farmers
40 46 50 57 57
Distribution and Dissemination of appropriate Technology Information
50 Number of Farmers days / information days
10 10 10 10 10
8 PROGRAMME 6: AGRICULTURAL ECONOMICS
8.1. Marketing services
8.1.1. Description of planned quality improvement measures

57
The Branch has adopted a value chain approach strategy to assist farmers with marketing of agricultural products. Through this strategy, market research at a consumer level will be completed to indicate consumer preferences of agricultural products (dried fruits, biltong, diced vegetables and juicing). The establishment of fresh produce packaging and processing facilities in the province by the Department will assist farmers, especially the small-scale ones, to gain market access and increase revenues post the farm gate level. The component will be co-ordinating the Agribusiness Academy which is aimed at training farmers on business (bookkeeping and basic financial management) and marketing (supply contract and price negotiations) skills.
8.1.2. Specified policies, priorities and strategic objectives
The branch is closely working with other government department and/or parastatals in aligning marketing of agricultural produce and promoting agricultural products produced in the province. Branding of packaged and processed fresh produce from the Limpopo is necessity which the Department believes will assist the farmers to establish themselves within specific markets.
8.1.3. Progress analysis
A packaging and processing facility is in its implementation phase with design layout (architectural drawings) already completed and processing line being constructed. Another packaging facility is in the developmental phase with lease arrangements and draft layout designs completed. It is anticipated that the two packaging facilities will be completed in the forthcoming financial year. The facilities will ensure that farmers, especially small-scale ones, can access markets and add value to their produce.
8.1.4. Analysis of constraints and measures planned to overcome them
Constraints Strategy
1. Inconsistent agricultural supply due to economies of scale and drought
Commercialisation of projects rather than operating on small individual plots and provision of water infrastructure.
2. Market access Farmers are assisted to negotiate and enter into off-take agreements with retailers and wholesalers. The pack-house facilities established by Department will ensure that a significant amount of agricultural produce is absorbed into markets within and outside of the province.

58
3. Agricultural Risk The Department assist farmers in accessing and signing for crop insurance.
4. Lack of effective understanding of AgriBEE
Facilitate AgriBEE training sessions to grassroots
8.2. Macroeconomics and Statistics
8.2.1. Description of planned quality improvement measures
The Branch strives to promote agri-business through appropriate market access strategies, value-adding and commodity associations to maximise farmer participation in the broader economic development opportunities. To this end, market access by all farmers, particularly small-scale farmers, will be ensured as farmers are assisted to access even export markets. To achieve that, farmers will be trained and encouraged to add value to their produce to meet consumer requirements. Furthermore, farmers will be encouraged to belong to commodity associations to reap the benefits of collectiveness.
8.2.2. Specified policies, priorities and strategic objectives
Policy framework is adequate but strategy interventions need to be enhanced. Farmers will be exposed to agricultural value chain analysis. Facilitation and provision of marketing support to agribusiness across the value chain will be done. Facilitate the transformation of projects into sustainable agribusinesses will be a priority as well as improve the availability and credibility of agricultural information and statistics.
8.2.3. Progress analysis
In the past year, the Branch commissioned a Farming and Agri-business Survey that covered all six districts, including Bohlabela, and the 508 Wards of the Province. The broad objective of this survey was to gather baseline data on the numbers of different scales and types of farmers, different types of agribusinesses, hectares, production focus, and financial position of the players and asset ownership profile of the players. The study has since been completed and the report has been directed to municipalities for updating.

59
8.2.4. Analysis of constraints and measures planned to overcome them
Constraints Strategy
1. Capacity of staff to investigate and interrogate farmers’ constraints and design relevant intervention measures
1. Capacity building of officials and farmers in value chain analysis
2. Inconsistent agricultural statistical information for local agricultural planning and ascertaining the value of agriculture
2. Provide credible agricultural statistical information in the province
3. Integrated planning at local municipality a challenge due to inconsistent objectives and planning
3. Creation of database of agricultural activities on a local municipality basis
4. Lack of understanding by prospective agricultural entrepreneurs on the costs of setting up a viable farming venture
4. Through the COMBUD programme assist prospective agricultural entrepreneurs to draw up bankable business plans before they venture into any agribusiness
8.2.5. Specification of measurable objectives and performance indicators (Market Services, and Macroeconomics and Statistics)
Measurable Outputs Performance Year 1 Year 2 Year 3 Year 4 Year 5

60
objective Indicators 2005/06 2006/07 2007/08 2008/09 2009/10
7
Number of commodity groups linked to domestic markets
1 1 3 1 1
1.Market access
6
Number of commodity groups linked to international markets
1 1 2 1 1
2 Value chain competitive analysis 10
Number of value chain analysis studies completed
0 3 2 2 3
360 Number of business plans drawn 40 40 200 40 40 3. Develop and
evaluate agribusiness plans
360 Number of business plans evaluated 40 40 200 40 40
4. Provide value chain economic extension services
18 000 Number of farmers assisted with value chain economics
2 000 2 000 10 000 2 000 2 000
5. Facilitate and establish Agribee deals
10 Number of AgriBEE deals concluded 0 3 3 2 2
Cascading AgriBEE to grassroots
4500 Number of stakeholders trained on AgriBEE
2 500 500 500 500 500
6. Undertake feasibility studies 10 Number of studies
conducted 2 2 2 2 2
7. Develop and update Computiriesed Budgets (COMBUD)
15
Number of computerised enterprise budgets updated
2 2 4 3 4
8. Create awareness about MAFISA and facilitate access thereof
8000
Number of farmers receiving awareness on MAFISA
1000 1000 1000 2000 3000
9. Facilitate the establishment and revitilisation of agricultural co-operatives
8
Number of cooperatives established 1 1 2 2 2
10. Establish agro- 10 Number of agro-processing facilities
0 2 4 2 2
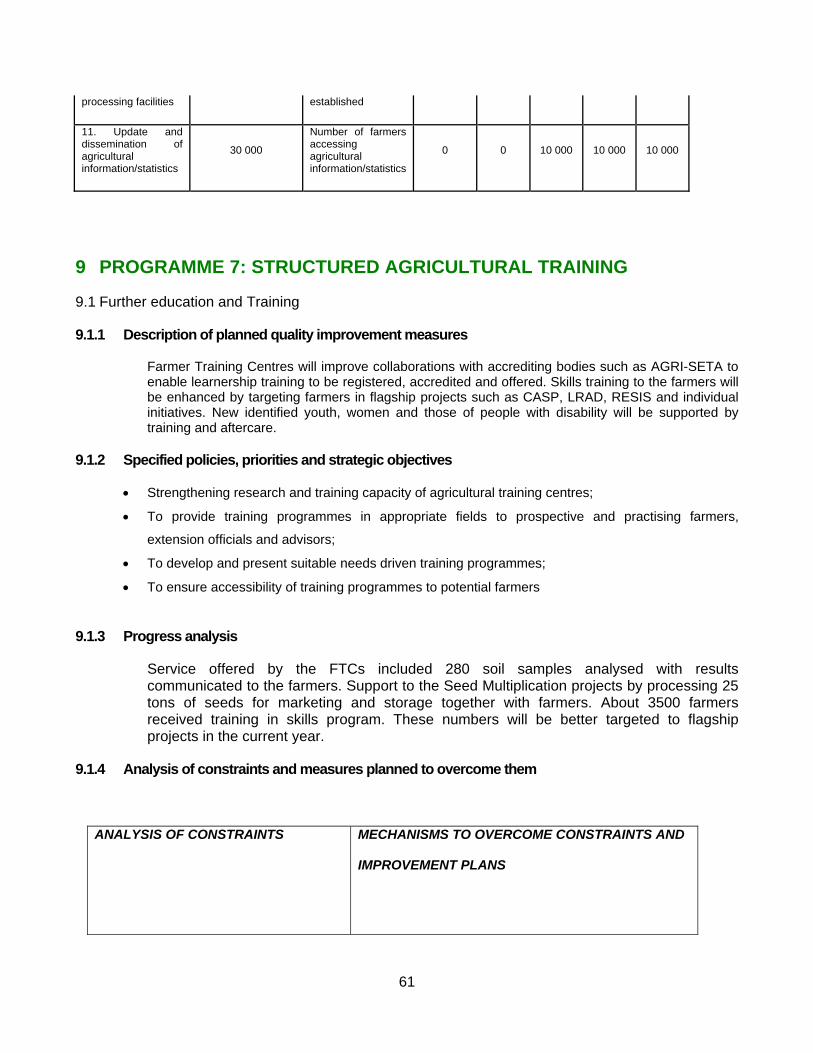
61
processing facilities established
11. Update and dissemination of agricultural information/statistics
30 000
Number of farmers accessing agricultural information/statistics
0 0 10 000 10 000 10 000
9 PROGRAMME 7: STRUCTURED AGRICULTURAL TRAINING
9.1 Further education and Training
9.1.1 Description of planned quality improvement measures
Farmer Training Centres will improve collaborations with accrediting bodies such as AGRI-SETA to enable learnership training to be registered, accredited and offered. Skills training to the farmers will be enhanced by targeting farmers in flagship projects such as CASP, LRAD, RESIS and individual initiatives. New identified youth, women and those of people with disability will be supported by training and aftercare.
9.1.2 Specified policies, priorities and strategic objectives
• Strengthening research and training capacity of agricultural training centres;
• To provide training programmes in appropriate fields to prospective and practising farmers,
extension officials and advisors;
• To develop and present suitable needs driven training programmes;
• To ensure accessibility of training programmes to potential farmers
9.1.3 Progress analysis
Service offered by the FTCs included 280 soil samples analysed with results communicated to the farmers. Support to the Seed Multiplication projects by processing 25 tons of seeds for marketing and storage together with farmers. About 3500 farmers received training in skills program. These numbers will be better targeted to flagship projects in the current year.
9.1.4 Analysis of constraints and measures planned to overcome them
ANALYSIS OF CONSTRAINTS MECHANISMS TO OVERCOME CONSTRAINTS AND
IMPROVEMENT PLANS

62
Changing of the role and place of
agricultural colleges with the education
system;
All training programmes to be registered with SAQA;
Changing customer needs and
circumstances;
Develop short courses that meet NQF standards;
Offering suitable and researched training
programmes to satisfy sectoral needs;
Work closely with AgriSETA to ensure quality assurance
of training programmes;
Providing an adequate physical
infrastructure to facilitate learning.
Continuous improvements on existing training
programmes through feedback from stakeholders.
Selection of farmers who are unlikely to
benefit from the training programmes.
Development of selection criteria in close collaboration
with the Districts.
Poor co-ordination of the training
programmes.
Establishment of a training committee made up of the
Centres and Districts concerned.
Insufficient resources (transport, staff,
accommodation, mechanization).
Provision of identified additional resources.
9.1.5 Specification of measurable objectives and performance indicators
Year 1 Year 2 Year 3 Year 4 Year 5 Measurable Objective
Output Performance Indicator
2005/2006
2006/2007
2007/2008
2008/2009
2009/2010
7.1 Learnerships Training
Number of Unit Standards offered.
20
Unit standards submitted for registration and accreditation through appropriate authorities
20 20 20 20 20
Number of learners attending the learnership programme.
195
Competent learners trained on SETA accredited programme
60 15 40 40 40
7.2 Skills Training

63
Number of short courses offered.
35
Short courses Learning materials developed and aligned to Unit Standard format.
10 10 15 - -
Number of farmers attending the skills programmes.
7991
Farmers in Flagship projects trained to be able to run their various farming businesses.
3000 3500 478 500 513
1. To conduct short courses aimed at Extension staff
600
1. Number of Extension officers trained on the various skills programme in line with the various commodities and needs.
200 100 100 100 100
2. To conduct Outreach programme to projects/ farmers on needs analysis and aftercare support.
10 000 1. Number of projects reached for training needs identification.
200 200 200 200 200
1730 4. Number of samples analysed and results communicated to the farmers.
250 280 350 400 450
7.3. Analystical and Processing
115 Amount of seeds treated, processed and packaged (tons).
25 20 25 20 25
5 One Laboratory Accreditation certificate
1 1 1 1 1
. 15 Food Preservation
pilots (tons) 0 0 5 5 5

64
Part C: Annual Performance Plan of Year- One
PROGRAM 1-ADMINISTRATION
1.1 CORPORATE SERVICES
1.1.1 Logistic Services
Strategic Goal: Provide Logistic Services
Strategic Objective
Measurable Objective
Performance Indicator
Year1 05/06
Actual
Year 2 06/07
Estimate
Year3 07/08
Budget Quarter
1 Quarter
2 Quarter
3 Quarter
4
Number of sedans, 26 7 28 0 28 0 0
Number of LDV’s 0 56 25 0 25 0 0
Number of trucks 6 0 2 0 2 0 0
Purchase of governemnt owned vehicles
Number of busses 0 1 1 0 1 0 0 Number of steel cabinets provided to all municipalities, colleges and research station
245 0 0 0 0 0 0
Installation of filing system Number of
municipalities, research stations and farming training centres to be provided with Bulk filing cabinets
0 0 10 0 10 0 0
Number of new office accommodation provided
3 1 4 0 0 0 4
Number of mobile offices provided 0 14 10 0 10 0 0
Purchase of government owned vehicles
Provision of accommodation
Number of Offices renovated 4 1 3 0 0 0 3

65
1.1.2 Legal Services
Strategic Goal: Provide Legal Services
Measurable Objective
Measurable Objective
Performance Indicator
Actual 05/06
2006/07 Estimate
2007/08 Target
Quarter 1
Quarter 2
Quarter 3
Quarter 4
Improved management and coordination of litigation
Litigation Management and co-ordination policy
0 0 1 0 1 0 0 Co-ordination and management of litigation
Quarterly report on litigation 4 4 4 1 1 1 1
Identification of legislation for rationalisation
Report on rationalisation of legislation
0 0 1 1 0 0 0
Drafting the Legislation Bill 0 0 1 0 0 0 1
Development of regulatory framework
Implementation Guidelines on the PAJA
PAJA guideline 0 1 0 0 0 0 0
Provision of Legal advisory support
Reduction of potential litigation
Quarterly report on legal opinion and advise
4 4 4 1 1 1 1
Development of contracts
Sound contractual obligations
Quarterly report on contracts 4 4 4 1 1 1 1
1.1.3 Security Management
Sub Programme Strategic Goal: Manage the total security function effectively
Strategic Objective
Measurable Objective
Performance Measure Indicator
Actual 2005/06
2006/07 Estimate
2007/08 Target
Quarter 1
Quarter 2
Quarter 3
Quarter 4
2 policies 1 2 2 0 0 1 1
19 contracts 17 30 19 2 5 5 7
To provide a safe and secure environment for the departments information, assets and integrity
Coordination and implementation of physical security
Installation of technical access control systems at Head office, college and research station
5 access control systems in place 1 0 0 0 0 0
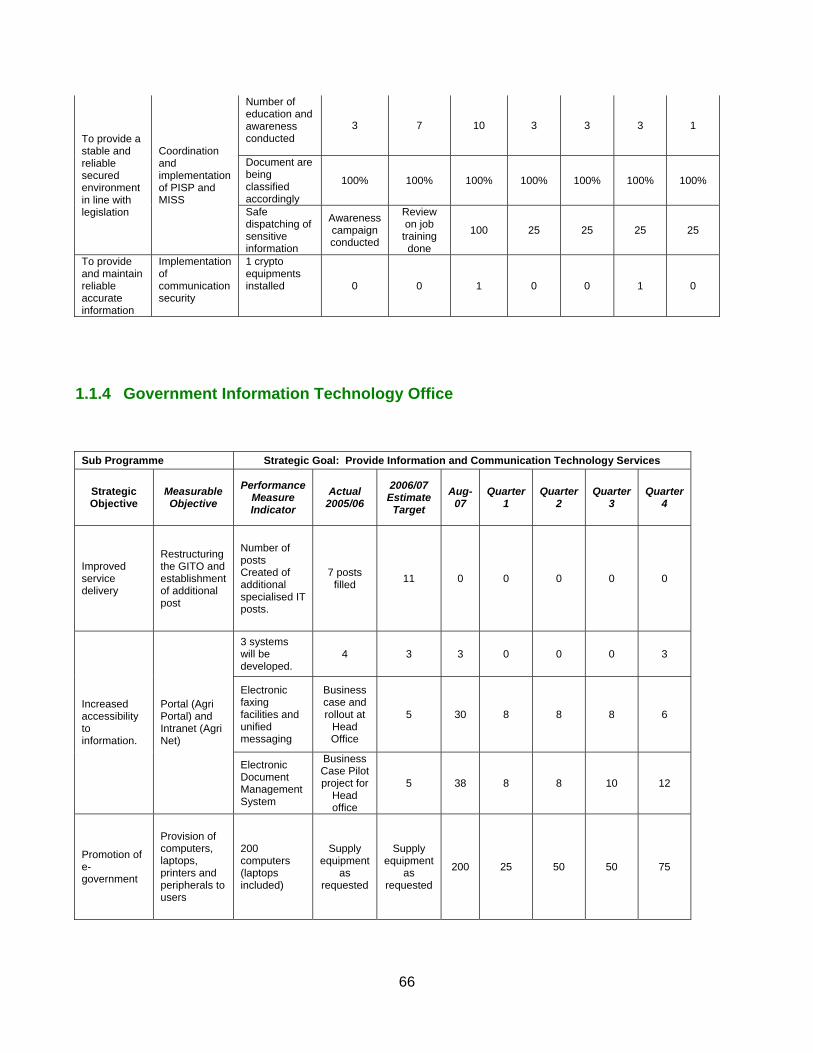
66
Number of education and awareness conducted
3 7 10 3 3 3 1
Document are being classified accordingly
100% 100% 100% 100% 100% 100% 100%
To provide a stable and reliable secured environment in line with legislation
Coordination and implementation of PISP and MISS
Safe dispatching of sensitive information
Awareness campaign conducted
Review on job
training done
100 25 25 25 25
To provide and maintain reliable accurate information
Implementation of communication security
1 crypto equipments installed 0 0 1 0 0 1 0
1.1.4 Government Information Technology Office
Sub Programme Strategic Goal: Provide Information and Communication Technology Services
Strategic Objective
Measurable Objective
Performance Measure Indicator
Actual 2005/06
2006/07 Estimate
Target
Aug-07
Quarter 1
Quarter 2
Quarter 3
Quarter 4
Improved service delivery
Restructuring the GITO and establishment of additional post
Number of posts Created of additional specialised IT posts.
7 posts filled 11 0 0 0 0 0
3 systems will be developed.
4 3 3 0 0 0 3
Electronic faxing facilities and unified messaging
Business case and rollout at
Head Office
5 30 8 8 8 6 Increased accessibility to information.
Portal (Agri Portal) and Intranet (Agri Net)
Electronic Document Management System
Business Case Pilot project for
Head office
5 38 8 8 10 12
Promotion of e-government
Provision of computers, laptops, printers and peripherals to users
200 computers (laptops included)
Supply equipment
as requested
Supply equipment
as requested
200 25 50 50 75

67
Reduction of telephone costs
Voice, video, data cabling and Wide Area Network (WAN) infrastructure
Consolidated, robust Voice over Internet Protocol 5 Offices implemented with VoIP
1 2 5 2 1 1 1
Network installation and upgrades to district offices, agricultural colleges and research stations
2 0 0 0 0 0 0
Ensure connectivity
Installation of TELKOM data circuits to Municipal offices
11 12 0 0 0 0 0
Service enhancement Upgrade of
data circuits 0 0 25 6 7 7 5
1.1.6 Communication and Liaison Services
Sub Programme Strategic Goal: Manage Communication and Liaison Services
Strategic Objective
Measurable Objective
Performance Measure Indicator
Actual 2005/06 Output
2006/07 Estimate
2007/08 Budget
Quarter 1
Quarter 2
Quarter 3
Quarter 4
Communication strategy
Development of Communication Strategy
1 Communication strategy
1 1 1 1 0 0 0
Media Relations
Media Relations Management
3 media open days 1 2 3 0 1 1 1
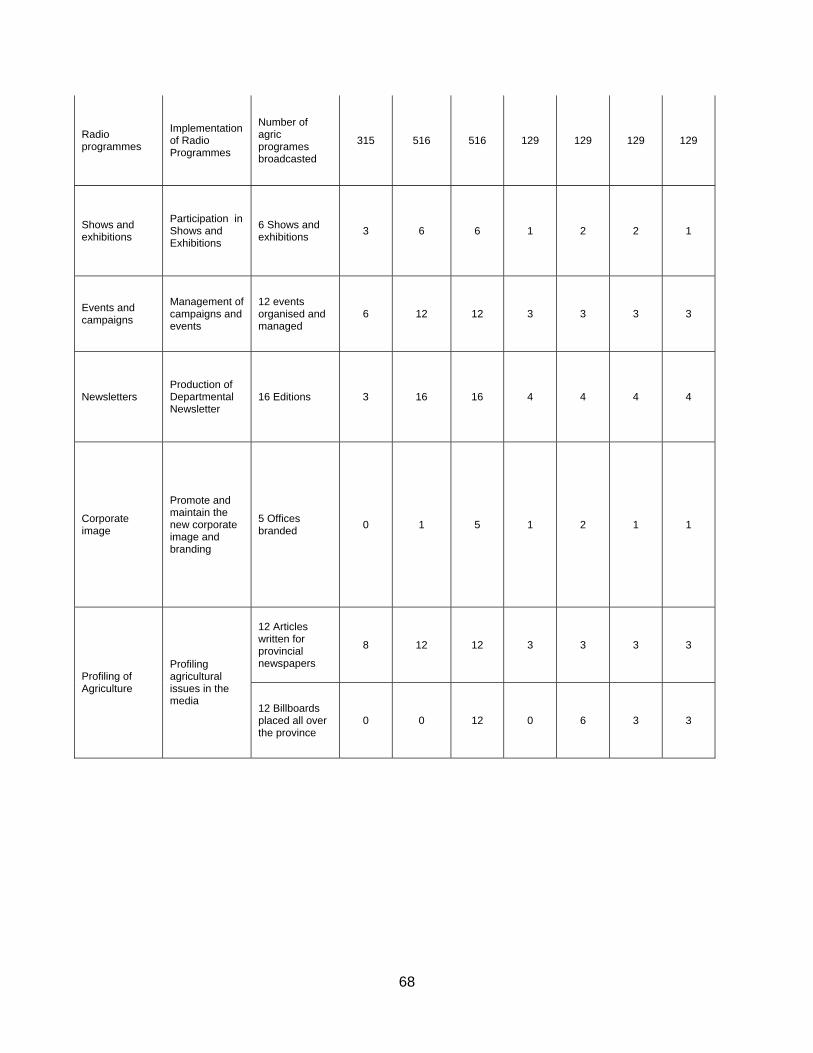
68
Radio programmes
Implementation of Radio Programmes
Number of agric programes broadcasted
315 516 516 129 129 129 129
Shows and exhibitions
Participation in Shows and Exhibitions
6 Shows and exhibitions 3 6 6 1 2 2 1
Events and campaigns
Management of campaigns and events
12 events organised and managed
6 12 12 3 3 3 3
Newsletters Production of Departmental Newsletter
16 Editions 3 16 16 4 4 4 4
Corporate image
Promote and maintain the new corporate image and branding
5 Offices branded 0 1 5 1 2 1 1
12 Articles written for provincial newspapers
8 12 12 3 3 3 3
Profiling of Agriculture
Profiling agricultural issues in the media
12 Billboards placed all over the province
0 0 12 0 6 3 3
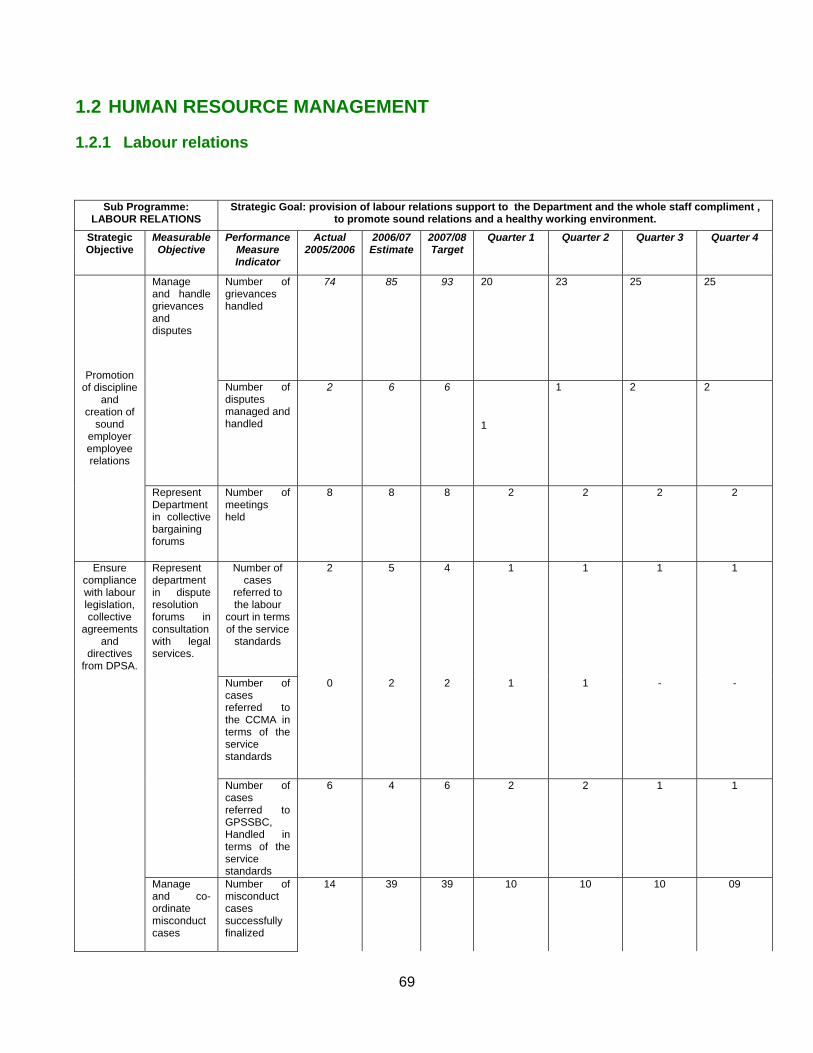
69
1.2 HUMAN RESOURCE MANAGEMENT
1.2.1 Labour relations
Sub Programme: LABOUR RELATIONS
Strategic Goal: provision of labour relations support to the Department and the whole staff compliment , to promote sound relations and a healthy working environment.
Strategic Objective
Measurable Objective
Performance Measure Indicator
Actual 2005/2006
2006/07 Estimate
2007/08 Target
Quarter 1 Quarter 2 Quarter 3 Quarter 4
Number of grievances handled
74 85 93 20
23 25 25 Manage and handle grievances and disputes
Number of disputes managed and handled
2 6 6
1
1 2 2 Promotion
of discipline and
creation of sound
employer employee relations
Represent Department in collective bargaining forums
Number of meetings held
8 8 8 2 2 2 2
Number of cases
referred to the labour
court in terms of the service
standards
2 5 4 1 1 1 1
Number of cases referred to the CCMA in terms of the service standards
0 2 2 1 1 - -
Represent department in dispute resolution forums in consultation with legal services.
Number of cases referred to GPSSBC, Handled in terms of the service standards
6 4 6 2
2 1 1
Ensure compliance with labour legislation, collective
agreements and
directives from DPSA.
Manage and co-ordinate misconduct cases
Number of misconduct cases successfully finalized
14 39 39 10
10 10 09

70
Provide Labour Relations related advice to the department
Number of written andn verbal advice provided
75 75 75 20 20 20 15
Privide training on labour relations matters to all staff members
Number of officials trained
3104
Level 1-6
578
Level 7-12
35
Level 13-16
3104 Level 1-6 200
Level 7-12
Preparations for the training and sourcing service Providers for SMS Training 200 Level 7-12
Training 15 SMS members Training 1552 Level 1-6
Training 20 SMS members Training 1552 Level 1-6
Evaluation of Training And Compilation of Statistical report.
Develop implement and monitor labour relations policies
Number of policies developed Number of policies implemented and monitored
1 1 0 0 0 0 0
1.2.2 Human Resource Development
Sub Programme: HUMAN RESOURCE
DEVELOPMENT
Strategic Goal: Capacity building for employees to improve service Delivery
Strategic Objective
Measurable
Objective
Performance
Measure Indicator
Actual 2005/0
6
2006/07 Estimat
e
2007/08
target
Quarter 1 Quarter 2
Quarter 3 Quarter 4
70 extern
al
50 external
30 extern
al
Payment of
bursaries 220 new and 420
old bursries
Monitor progress
of 640 bursars monitori
ed
Awarding of 150 bursaries.
100 interna
l
170 internal
100 interna
l
1 visit to learning
institution
5 career exhibitio
n
Update of 640 old bursaries
Manage the provision of bursaries
Number of bursaries awarded
820 bursaries awarded
150 new bursaries
opportunities advertised
130 new bursaries contract signed
Manage Number 375 100 100 100 30 30 20 20
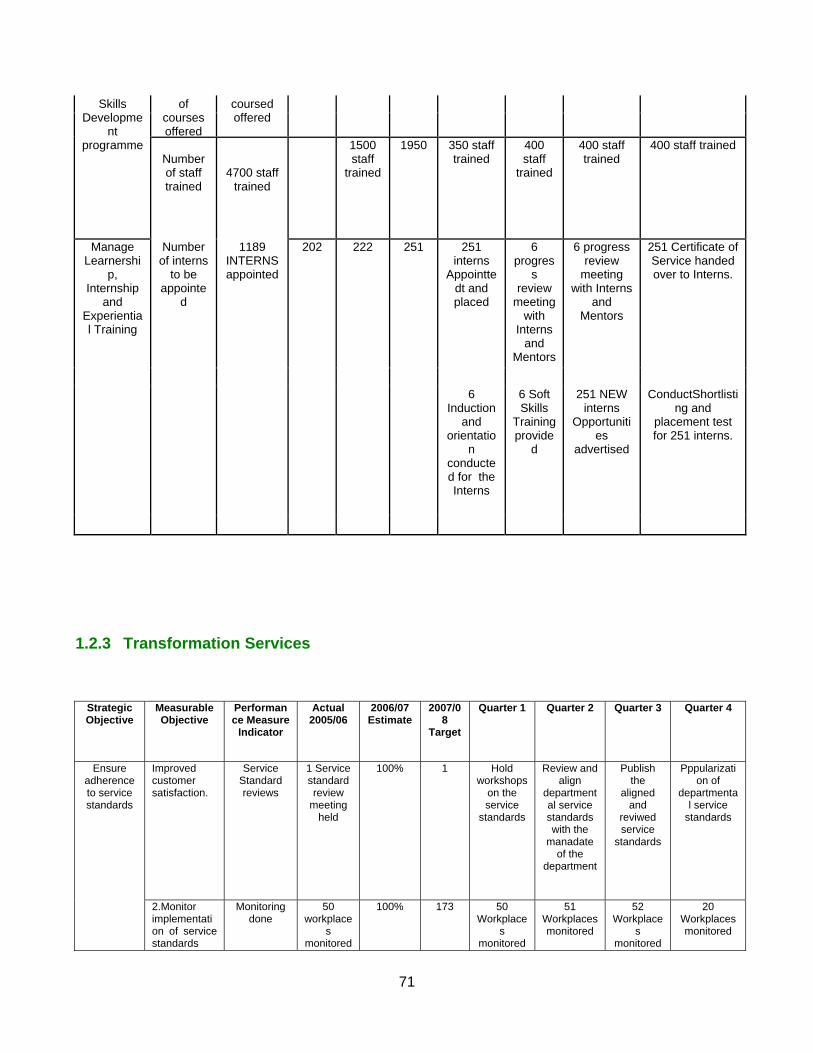
71
of courses offered
coursed offered
Skills Developme
nt programme
Number of staff trained
4700 staff trained
1500 staff
trained
1950 350 staff trained
400 staff
trained
400 staff trained
400 staff trained
251 interns
Appointtedt and placed
6 progres
s review
meeting with
Interns and
Mentors
6 progress review
meeting with Interns
and Mentors
251 Certificate of Service handed over to Interns.
6
Induction and
orientation
conducted for the Interns
6 Soft Skills
Training provide
d
251 NEW interns
Opportunities
advertised
ConductShortlisting and
placement test for 251 interns.
Manage Learnershi
p, Internship
and Experiential Training
Number of interns
to be appointe
d
1189 INTERNS appointed
202 222 251
1.2.3 Transformation Services
Strategic Objective
Measurable Objective
Performance Measure
Indicator
Actual 2005/06
2006/07 Estimate
2007/08
Target
Quarter 1 Quarter 2 Quarter 3 Quarter 4
Improved customer satisfaction.
Service Standard reviews
1 Service standard review
meeting held
100% 1 Hold workshops
on the service
standards
Review and align
departmental service standards with the
manadate of the
department
Publish the
aligned and
reviwed service
standards
Pppularization of
departmental service
standards
Ensure adherence to service standards
2.Monitor implementation of service standards
Monitoring done
50 workplace
s monitored
100% 173 50 Workplace
s monitored
51 Workplaces monitored
52 Workplace
s monitored
20 Workplaces monitored
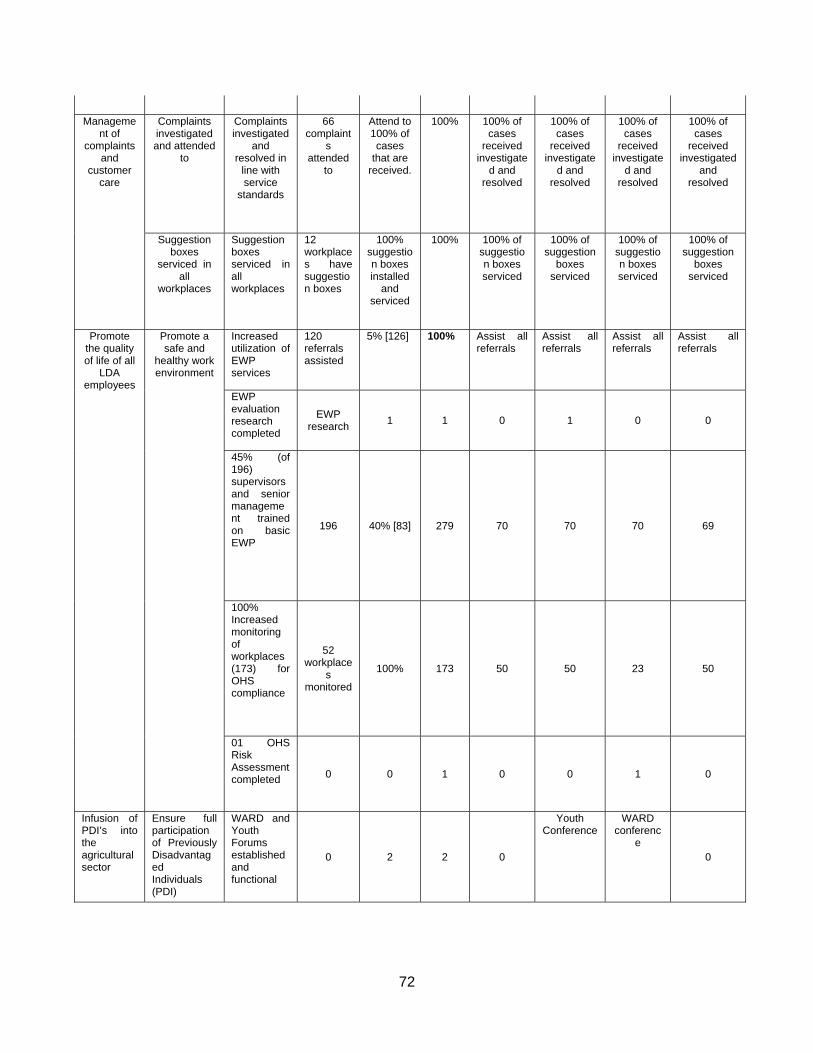
72
Complaints investigated and attended
to
Complaints investigated
and resolved in
line with service
standards
66 complaint
s attended
to
Attend to 100% of cases
that are received.
100% 100% of cases
received investigate
d and resolved
100% of cases
received investigate
d and resolved
100% of cases
received investigate
d and resolved
100% of cases
received investigated
and resolved
Management of
complaints and
customer care
Suggestion boxes
serviced in all
workplaces
Suggestion boxes serviced in all workplaces
12 workplaces have suggestion boxes
100% suggestion boxes installed
and serviced
100% 100% of suggestion boxes serviced
100% of suggestion
boxes serviced
100% of suggestion boxes serviced
100% of suggestion
boxes serviced
Increased utilization of EWP services
120 referrals assisted
5% [126] 100% Assist all referrals
Assist all referrals
Assist all referrals
Assist all referrals
EWP evaluation research completed
EWP research 1 1 0 1 0 0
45% (of 196) supervisors and senior management trained on basic EWP
196 40% [83] 279 70 70 70 69
100% Increased monitoring of workplaces (173) for OHS compliance
52 workplace
s monitored
100% 173 50 50 23 50
Promote the quality of life of all
LDA employees
Promote a safe and
healthy work environment
01 OHS Risk Assessment completed 0 0 1 0 0 1 0
Infusion of PDI’s into the agricultural sector
Ensure full participation of Previously Disadvantaged Individuals (PDI)
WARD and Youth Forums established and functional
0 2 2 0
Youth Conference
WARD conferenc
e 0

73
Children, Youth and Women involved in the sector
0 0 15
Identify Schools
Establish relationship
s
Develop food
gardens
Competition
1.2.4 Human Resource Services
Sub Programme: Human Resource Services.
Strategic Goal: To provide and manage human resources for efficient service delivery.
Strategic Objective
Measurable Objective
Performance Measure Indicator
Actualoutput 2005/06
2006/07 Estimate
2007/08 Target
Quart1 Quart 2
Quart3 Quarter 4
Manage recruitment
Filling of vacant posts
Number of vacant posts.
628 481 348 87 87 87 87
Manage succession planning
Succession Planning
Availability of a succession plan
1 1 1 0 0 0 1
Develop retention strategy
Retention of Scare Skills
Availability of a retention strategy
1 1 1 0 0 0 1
Manage excess employees
Reduction of Excess Staff
Number of voluntary severance package successfully negotiated and placements in other Departments
1109 200 200 40 60 60 40
Number of employees signed performance instruments
4578 4578 18312 4578 4578 4578 4578
Quarterly Reviews
4578 4578 4578 4578 4578 4578 4578
Manage performance management system
Implementation of PMS
Annual Evaluation
4146 4146 4578 0 0 0
Develop HR and EE plans
Facilitate development of HR and EE Plan
Number of HR plans Developed
1 1 1 0 1 0 0
Number of EE plans developed
1 1 1 0 1 0 0
Manage Retirement of Number of 36 36 63 24 12 13 14
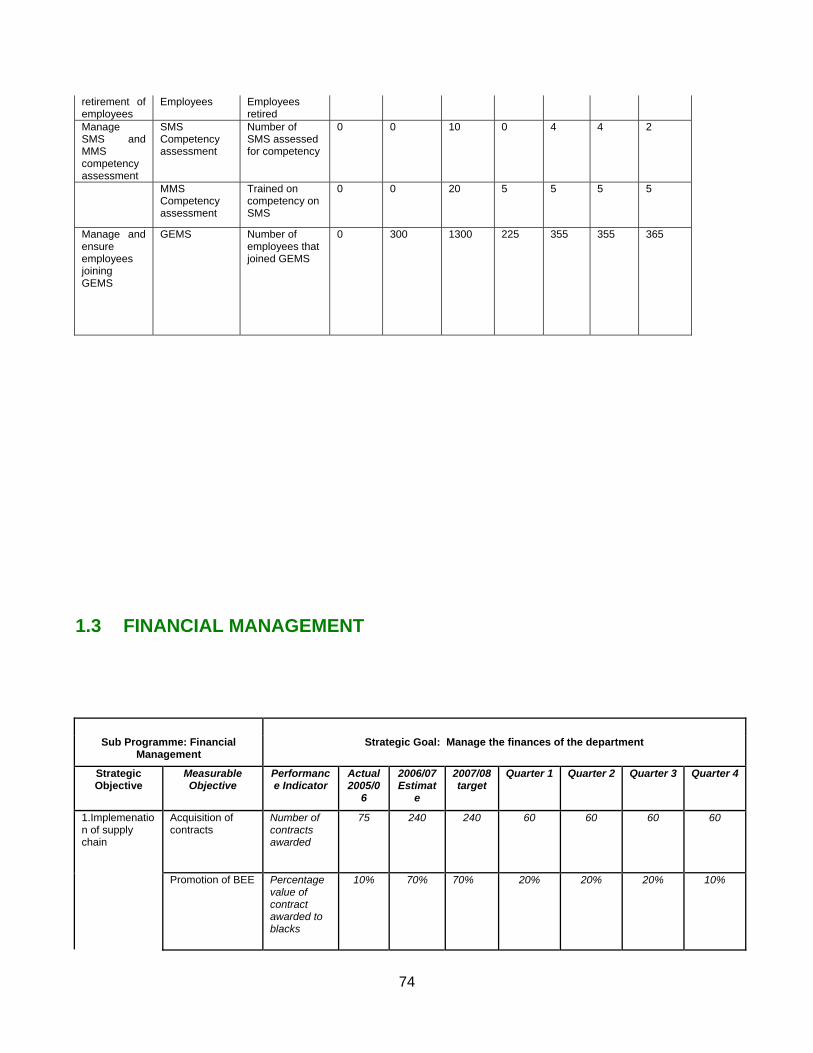
74
retirement of employees
Employees Employees retired
Manage SMS and MMS competency assessment
SMS Competency assessment
Number of SMS assessed for competency
0 0 10 0 4 4 2
MMS Competency assessment
Trained on competency on SMS
0 0 20 5 5 5 5
Manage and ensure employees joining GEMS
GEMS Number of employees that joined GEMS
0 300 1300 225 355 355 365
1.3 FINANCIAL MANAGEMENT
Sub Programme: Financial
Management Strategic Goal: Manage the finances of the department
Strategic Objective
Measurable Objective
Performance Indicator
Actual 2005/0
6
2006/07 Estimat
e
2007/08 target
Quarter 1 Quarter 2 Quarter 3 Quarter 4
1.Implemenation of supply chain
Acquisition of contracts
Number of contracts awarded
75 240 240 60 60 60 60
Promotion of BEE Percentage value of contract awarded to blacks
10% 70% 70% 20% 20% 20% 10%

75
Acquisition of goods/services
Number of orders produces per annum
7980 7000 7000 2000 2500 2000 500
Promotion of local content
Percentage value of contract
10% 20% 30% 5% 10% 20% 5%
1.Managed asset register
Registering of acquired asset within fife days
100% 100% 100% 100% 100% 100% 100%
2.Disposal of redundant/obsolete assets
Number of asset disposed
1488 988 500 250 250 0 0
3.Valuation of excisting fixed assets
Number of assets valued
27000 27000
2.Asset management
4.Verified assets Number of inspection conducted
28 26 26 0 12 6 8
Budget planning and control
Consolidated annual budget and adjustment estimates reports
Successful completion of budget and adjustment estimates
2 2 2 1 1
Reports on budget implementation monitoring meetings
Conducted budget monitoring meetings and reports
1 2 4 1 1 1 1
Implementation of revenue collection strategy
Cleared outstanding R5,1m worth of debts
Reduction of debt account balance
19.46% 20% 40% 10% 10% 10% 10%
Collection of all revenue budgeted
Attainment of targeted revenue collection
14,838 10,257m 10,770m
2,692.50m
2,692.50m
2,692.50m
2,692.50m
System Management
Controlled user access to all financial systems
Properly managed systems users access rights
50% 100% 100% 100% 100% 100% 100%

76
Timely availability of financial systems per day
Number of hours available to users per day
8 8 8 8 8 8 8
PROGRAM 2- SUSTAINABLE RESOURCE MANAGEMENT
2.1 Agricultural Engineering
Agricultural Engineering
Strategic Goal: To provide engineering services in support of agricultural development and restructuring of state assets

77
Strategic Objective
Measurable Objective
Performance Measure Indicator
Actual 2005/06 Output
2006/07 Estimate Output
2007/08 Target
Quarter 1
Quarter 2
Quarter 3
Quarter 4
Rehabilitation of bulk services at schemes (no)
0 17 13 6 4 3 3 Phased rehabilitation of smallholder irrigation schemes
Installation of efficient infield irrigation systems to schemes (ha)
2801 671 872 350 300 250 200
CASP projects suported (no)
37 57 70 20 20 15 15
Donor projects supported (no)
3 3 10 5 3 1 1 Engineering support to projects
Other projects supported (no)
20 23 30 10 8 6 6
Development of Standard plans
0 0 3 0 2 1 0 Farm Structure Development
Strcutures erected 0 0 5 1 2 2 0
Number of dams inspected
5
5 5 3 2 0 0
Consultancy and technical services
Dam Safety
Number of dams refurbished
1 0 2 1 1 0 0
2.2 Landcare
Landcare
Strategic Goal: To achieve community ownership for responsibility towards environmental protection
and sustainable resource utilisation
Strategic Objective
Measurable Objective
Performance Measure Indicator
Actual 2005/06 Output
2006/07 Estimate Output
2007/08 Target
Quarter 1
Target
Quarter 2
Target
Quarter 3
Target
Quarter 4
Target

78
Landcare
Strategic Goal: To achieve community ownership for responsibility towards environmental protection
and sustainable resource utilisation
Strategic Objective
Measurable Objective
Performance Measure Indicator
Actual 2005/06 Output
2006/07 Estimate Output
2007/08 Target
Quarter 1
Target
Quarter 2
Target
Quarter 3
Target
Quarter 4
Target Capacity
building for communities to understand
key processes of landcare and agricultural resources
conservation Community landcare awareness campaigns
Number of campaigns undertaken to foster community understanding of processes of natural resource protection and utilisation (individuals)
18 270 300 70 90 80 60
Establishment of community forums with financial capacity to manage land-care projects.
Community institutional forums established
3 6 12 0 6 5 2
Training and capacity building of roleplayers
Community and staff members trained
250 400 470 120 180 120 50
Provision of Resource
Conservation Services
Area-wide conservation planning
No. of conservation plans
0 3 5 2 1 1 1
Soil conservation measures
Area protected by conservation works
0
0
30000 40000 15000 15000 10000
Provision of mechanical services
Number of mechanical units and implements purchased
0 0 0 34 0 0 0
Number of mechanical units maintained
1
1
1 1 1 1 1 1
Landuse Planning
Sustainable resource planning
No. of land-use plans developed
0
3 6 1 2 2 1
Sustainable resource management
No. of applications for subdivision and land-use changes processed
30
50 60 23 12 12 13

79
2.3 GIS
Project Management Support
& GIS
Strategic Goal: To provide the necessary information to assist in the proper planning and management of
implemented projects
Strategic Objective
Measurable Objective
Performance Measure Indicator
Actual 2005/06 Output
2006/07 Estimate Output
2007/08 Target
Quarter 1
Quarter 2
Quarter 3
Quarter 4
Project planning,
monitiring and reporting
Feasibility studies and packaging of projects for funding
Well researched and properly planned projects
0
0
40 10 12 10 8
Tracking of project progress
Projects progress tracked and necessary adjustments timeously made
0
0
40 10 12 10 8
Reporting on the project as per the required intervals and format
Projects reported on at agreed intervals and format and to specified stakeholders
0
0
40 10 12 10 8
PROGRAM 3- FARMER SUPPORT AND DEVELOPMENT
3.1 Land and Agrarian Reform
Manage and facilitate access to commercial agricultural land by the black farmers, provide pre and post settlement support as well as ensuring proper management and administration of state agricultural land.
Strategic Objectives
Measurable Objectives
Performance Indicator
Year 1 05/06
Year 2 06/07
Year 3 07/08
Quarter 1
Quarter 2
Quarter 3 Quarter 4

80
State land released for access to PDFs
Number of hectares of state land released from other governement departments
2,605 775 5,423 800
1,000
1,000 299
Fast-track settlement of restitution claims
Number of land claims projects finalized by seconded officials
35 25 35 6 9 11 4
1. Facilitate access of commercial agricultural land by black farmers
Facilitate Redistribution of commercial agricultural land
Number of hectares of commercial land redistributed to PDFs
35,000 45,000 75,000 15,000 30,000 20,000 10,000
State land cleared of land invasions
Number of hectares of state land cleared of invasion
9,479 6,500 3,900 900 1,000 1,000 1,000
2. Providing effective state land management.
Develop reliable state land database
Number of municipalities having reliable state land registers
0 13 12 8 4 0 0
Mobilize Local Municipalities to support land reform projects
Number of local municipalities supporting land reform through incorporation of projects in the LED
0 0 6 2 2 1 1
Facilitate land use zoning in order to protect prime agricultural land
Number of municipalities having agricultural zones mapped/land use mappping
0 0 13 2 4 4 3
Ensure project sustainability through financial support
Number of projects funded through CASP, PIG and other sources of funding
15 30 50 10 15 13 12
3. Provision of pre & post settlement support to land reform projects (Restitution and Redistribution).
Deracialize the commercial agricultural sector through development of new commercial farmers from the PDFs
Number of new commercial farmers developed from the PDFs 20 35 45 10 10 10 15

81
Facilitate establishment of equity projects along the AgriBEE principles
Number of Agri-BEE/equity projects established 2 3 5 1 2 1 1
Develop young agricultural entrepreneurs
Number of municipalities having youth projects
1 0 5 2 1 1 1
Facilitate security of tenure for RESIS and former ARDC projects
Number of RESIS and former ARDC projects under secure tenure
4 0 16 4 4 5 3
Restructuring of former ARDC and Sisal projects
Number of fomer ARDC and SISAL projects restructured
5 0 17 2 5 5 5
4. Facilitate tenure reform; provide administration services for ARDC projects; and the implementation of viable operating arrangements, in order to ensure the sustainability of SLAG, ARDC and Sisal projects.
Re-engineering of SLAG projects
Number of SLAG projects turned into viable enterprises
0 2 13 2 3 4 4
3.1 District Services
Sub Programme: District Agricultural Development
Services
Strategic Goal: Provision of appropriate advisory support and Sustainable Poverty alleviation and household food security and nutrition strategies
Strategic Objective
Measurable Objective
Performance Measure Indicator
Actual 2005/06
2006/07 Estimate
2007/08 Target
Quarter 1
Quarter 2
Quarter 3
Quarter 4
Poverty eradication
Render agricultural development services to LDA clients.
District Agricultural Plans developed evaluated and monitored per annum 5 5 5 2 2 1 0
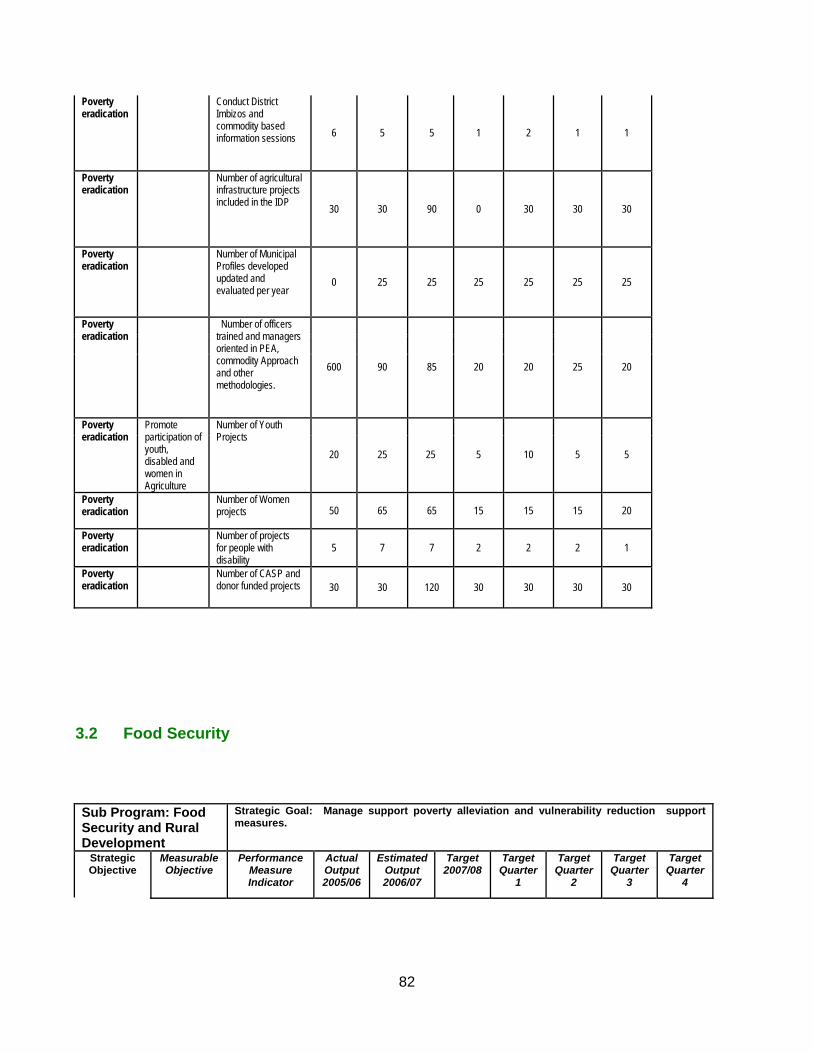
82
Poverty eradication
Conduct District Imbizos and commodity based information sessions 6 5 5 1 2 1 1
Poverty eradication
Number of agricultural infrastructure projects included in the IDP 30 30 90 0 30 30 30
Poverty eradication
Number of Municipal Profiles developed updated and evaluated per year
0 25 25 25 25 25 25
Poverty eradication
Number of officers trained and managers oriented in PEA, commodity Approach and other methodologies.
600 90 85 20 20 25 20
Poverty eradication
Promote participation of youth, disabled and women in Agriculture
Number of Youth Projects
20 25 25 5 10 5 5
Poverty eradication
Number of Women projects 50 65 65 15 15 15 20
Poverty eradication
Number of projects for people with disability
5 7 7 2 2 2 1
Poverty eradication
Number of CASP and donor funded projects 30 30 120 30 30 30 30
3.2 Food Security
Sub Program: Food Security and Rural Development
Strategic Goal: Manage support poverty alleviation and vulnerability reduction support measures.
Strategic Objective
Measurable Objective
Performance Measure Indicator
Actual Output 2005/06
Estimated Output 2006/07
Target 2007/08
Target Quarter
1
Target Quarter
2
Target Quarter
3
Target Quarter
4

83
Poverty alleviation strategy developed and implemented
Strategy implementation measures
1 1 1 1 0 0 0
Poverty alleviation Sustainable
income generating opportunities to reduce poverty
Number of household linked to income generating enterprises
5300 2900 2500 0 1000 1500 0
Disaster Management strategies in place
Number of disaster schemes and strategies developed
3 4 4 1 2 2 1
Fodder banks established
Number of fodder bank centres established 5 5 0 1 3 1 Agro Risk
Management
Participating beneficiaries
Number of beneficiaries participating in the schemes 28,000 20,000 30,000 30,000 30,000 30,000 30,000
Conditional Grants
Conditional grants & Donor Funds coordination
The level of compliance reporting in%
100 100 100 100 100 100 100
3.3 Crop Production
Sub Program – Crop Production
Strategic Goal: To manage technical production services effectively and efficiently across all agricultural commodity groups / clusters

84
Strategic Objective
Measurable Objective
Performance Measure Indicator
Actual Output 2005/06
Estimated Output 2006/07
Target 2007/08
Target Quarter
1
Target Quarter
2
Target Quarter
3
Target Quarter
4
1) Crop policy / strategy development
Strategies and policies for fruit, vegetable, grain and industrial crops
0 4 4 0 0 4 0
a) Number of crop manuals acquired 0 5 12 3 3 3 3
b) Monthly climatic reports
0 5 12 3 3 3 3
2) Provision of production information & advisory services c) Soil data
(information) for identified projects 0 23 33 0 11 11 11
a) Number of crop menus developed 0 23 33 0 11 11 11
b) Number of projects developed & supported
0 8 4 0 1 2 1
Crop Production
3) Crop project planning & support
3.4 Animal Production
Sub Program Strategic Goal: Manage Animal production advisory services.

85
Animal Production
Strategic Objective
Measurable Objective
Performance Measure Indicator
Actual 2005/06
Estimated 2006/07
Annual Target
2007/08
Quarter 1
Quarter 2
Quarter 3
Quarter 4
Livestock Policy & strategy development – Goat, Pig, Poultry,Pasture & Veld management.
Number of Livestock commodity strategies developed and implemented 1 4 4 1 0 1 2
Commodity specific guidelines. – Cattle, Goat, aquaculture, Honeybee
Number of commodity specific information manuals, info packs and guides acquired and developed.
0 6 3 1 2 0 3
Six Livestock projects plans: 1. Integrated Honey Bee production, 2.Integrated aquaculture production, 3. Integrated livestock Projects (Blouberg, ) 4.Nguni Projects (6)
5. Integrated pig production
6. Integrated Goat production
Animal production
Livestock Project Planning & support.
7. Pet food project for FMD areas
1 4 7 2 2 2 1

86
Type and number of genotypes with records up to date
4 4 4 1 1 1 1
Preservation, maintenance and promotion of indigenous breeds
Number of bulls distributed to emerging farmers
60 80 80 10 30 30 10
Promotion of livestock identification.
Number of Livestock owners registered
500 1000 1000 1000 200 300 300
PROGRAM 4: VETERINARY SERVICES
Sub Program: Veterinary Services
Strategic Goal: Manage Veterinary and animal health services.
Strategic Objective
Measurable Objective
Performance Measure Indicator
Actual 2005/06
Jul-06 Aug-07 Quarter 1 Quarter 2 Quarter 3 Quarter 4
Veterinary Services
Vaccinations Services
80% of 600 000 Communal cattle vaccinated for Anthrax & Black Quarter once per year
500,000 500,000 550,000 137500 137500 137500 137500
35% of 130 000 dogs and cats vaccinated for Rabies once per year
70,000 70,000 77,000 19250 19250 19250 19250
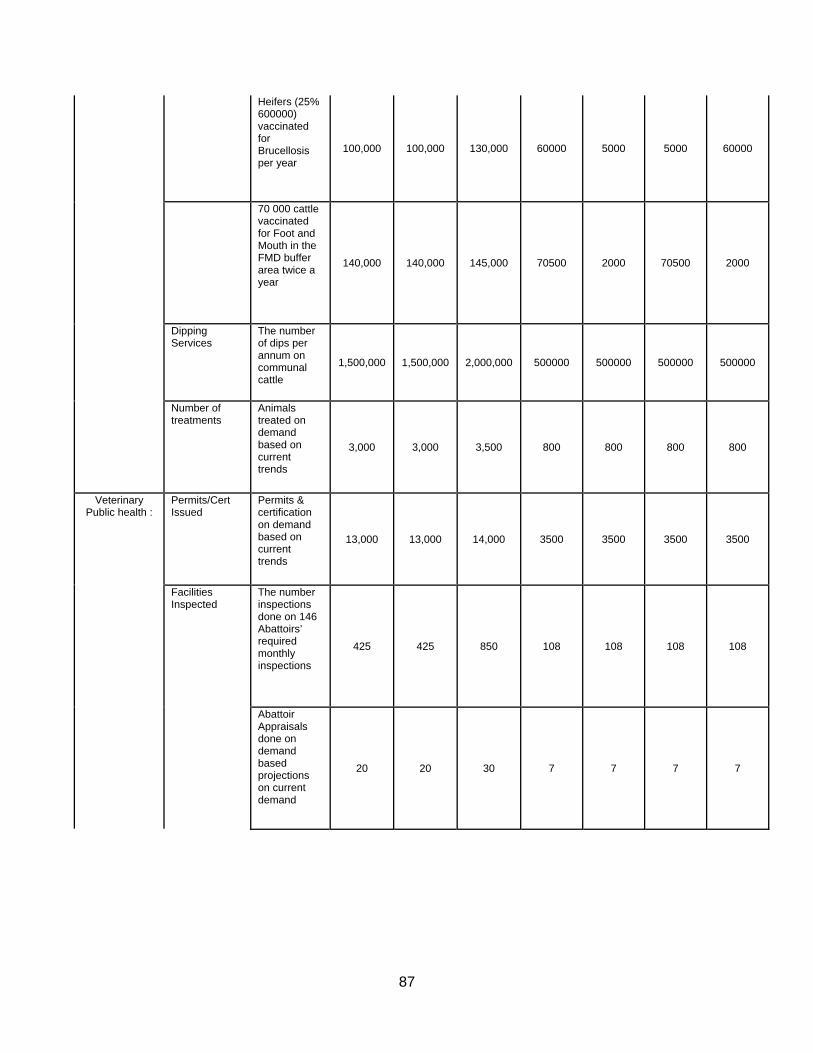
87
Heifers (25% 600000) vaccinated for Brucellosis per year
100,000 100,000 130,000 60000 5000 5000 60000
70 000 cattle vaccinated for Foot and Mouth in the FMD buffer area twice a year
140,000 140,000 145,000 70500 2000 70500 2000
Dipping Services
The number of dips per annum on communal cattle
1,500,000 1,500,000 2,000,000 500000 500000 500000 500000
Number of treatments
Animals treated on demand based on current trends
3,000 3,000 3,500 800 800 800 800
Veterinary Public health :
Permits/Cert Issued
Permits & certification on demand based on current trends
13,000 13,000 14,000 3500 3500 3500 3500
Facilities Inspected
The number inspections done on 146 Abattoirs’ required monthly inspections
425 425 850 108 108 108 108
Abattoir Appraisals done on demand based projections on current demand
20 20 30 7 7 7 7

88
The number of tests done for meat quality on a required sample of 550 representing selected abbatoirs.
550 550 600 150 150 150 150
Laboratory Services
Diagnostic tests
Number of diagnostic tests
65000 65000 70000 17500 17500 17500 17500
Veterinary Services
Bio security & Disease control Fence
Number of km of fence constructed
30 30 157 30 60 67
Bio security Strategies
Disease protocols and frameworks 1 3 3 1 1 1

89
PROGRAM 5: AGRICULTURAL RESEARCH SERVICES
Sub Programme: Agricultural Research Services
Strategic Goal: Promotion and development of appropriate training/research based production and value adding technologies for successful agri-businesses
Strategic Objective
Measurable Objective
Performance Measure Indicator
Actual 2005/06
2006/07 Estimate
2007/08 Target
Quarter 1 Quarter 2 Quarter 3 Quarter 4
Poverty eradication
Render Agricultural Research Services to LDA internal and External Clients
One Indigenous Knowledge Strategy developed and implemented
3 1 4 1 1 1 1
Economic Empowerment
33 researchers, scientists and technicians on formal research studies based on research agenda of LDA
26 33 33 33 33 33 33
Economic Empowerment
45 researchers, scientists and technicians trained in research methods and tools
50 45 45 10 10 15 10
Growth of the Economy
Four technology developed together with farmers per year
8 4 4 1 1 1 1
Growth of the Economy
Four Biodiesel Technology and or innovation developed from Oil Crops throughout the value chain
0 4 4 1 1 1 1
Growth of the Economy
One Risk Mitigation Technology developed with farmers for risk management strategies
4 4 4 1 1 1 1
Growth of the Economy
20 commodity based research and demonstration trials
15 20 20 5 5 5 5
Economic Empowerment
12 formal and informal publications per year
5 9 16 4 4 4 4
Growth of the Economy
50 number of animals and appropriate plant materials transferred to farmers
40 46 50 15 15 15 5
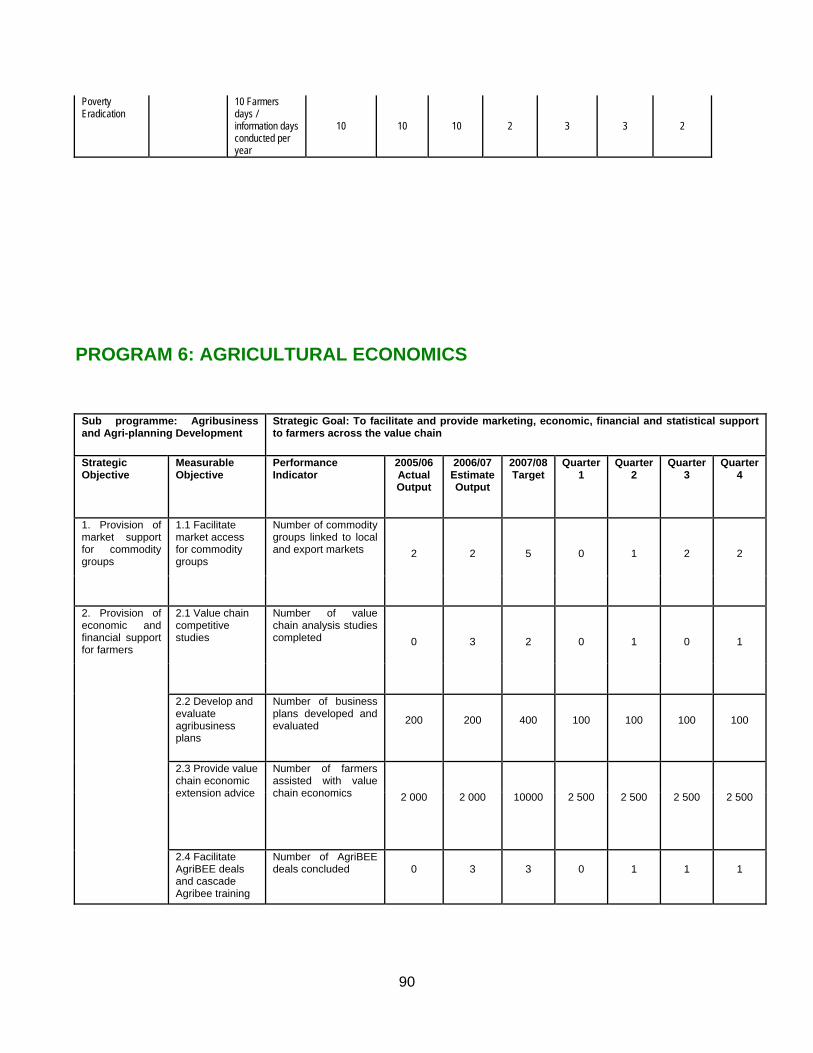
90
Poverty Eradication
10 Farmers days / information days conducted per year
10 10 10 2 3 3 2
PROGRAM 6: AGRICULTURAL ECONOMICS
Sub programme: Agribusiness and Agri-planning Development
Strategic Goal: To facilitate and provide marketing, economic, financial and statistical support to farmers across the value chain
Strategic Objective
Measurable Objective
Performance Indicator
2005/06 Actual Output
2006/07 Estimate Output
2007/08 Target
Quarter 1
Quarter 2
Quarter 3
Quarter 4
1. Provision of market support for commodity groups
1.1 Facilitate market access for commodity groups
Number of commodity groups linked to local and export markets 2 2 5 0 1 2 2
2.1 Value chain competitive studies
Number of value chain analysis studies completed 0 3 2 0 1 0 1
2.2 Develop and evaluate agribusiness plans
Number of business plans developed and evaluated 200 200 400 100 100 100 100
2.3 Provide value chain economic extension advice
Number of farmers assisted with value chain economics 2 000 2 000 10000 2 500 2 500 2 500 2 500
2. Provision of economic and financial support for farmers
2.4 Facilitate AgriBEE deals and cascade Agribee training
Number of AgriBEE deals concluded 0 3 3 0 1 1 1

91
to farmers Number of stakeholders trained on AgriBEE 1360 2165 500 0 0 500 0
2.5 Facilitate the establishment and revitalisation of agricultural co-operatives
Number of agricultural co-operatives established/revitalised 1 1 2 0 1 0 1
2.6 Create awareness about MAFISA and facilitate access thereof or any credit from other financial institutions
Number of farmers receiving awareness on MAFISA
1 000 1 000 1000 250 250 250 250
2.7 Establish agro-processing facilities
Number of agro-processing plants established 0 3 4 0 1 2 1
3.1 Develop and update Computerised Enterprise Budget (COMBUD)
Number of new enterprises added to the COMBUD 2 2 4 1 1 1 1
3. Provision of statistical support
3.2 Update and dissemination of agricultural statistical information
Number of farmers accessing agricultural statistical information
0 0 10000 2 500 2 500 2 500 2 500
Sub programme: Agribusiness and Agri-planning Development
Strategic Goal: To facilitate and provide marketing, economic, financial and statistical support to farmers across the value chain
Strategic Objective
Measurable Objective
Performance Indicator
2005/06 Actual Output
2006/07 Estimate Output
2007/08 Target
Quarter 1
Quarter 2
Quarter 3
Quarter 4
1. Provision of market support for commodity groups
1.1 Facilitate market access for commodity groups
Number of commodity groups linked to local and export markets 2 2 5 0 1 2 2

92
2.1 Value chain competitive studies
Number of value chain analysis studies completed 0 3 2 0 1 0 1
2.2 Develop and evaluate agribusiness plans
Number of business plans developed and evaluated 200 200 400 100 100 100 100
2.3 Provide value chain economic extension advice
Number of farmers assisted with value chain economics 2 000 2 000 10000 2 500 2 500 2 500 2 500
Number of AgriBEE deals concluded 0 3 3 0 1 1 1
2.4 Facilitate AgriBEE deals and cascade Agribee training to farmers Number of
stakeholders trained on AgriBEE 1360 2165 500 0 0 500 0
2.5 Facilitate the establishment and revitalisation of agricultural co-operatives
Number of agricultural co-operatives established/revitalised 1 1 2 0 1 0 1
2.6 Create awareness about MAFISA and facilitate access thereof or any credit from other financial institutions
Number of farmers receiving awareness on MAFISA
1 000 1 000 1000 250 250 250 250
2. Provision of economic and financial support for farmers
2.7 Establish agro-processing facilities
Number of agro-processing plants established 0 3 4 0 1 2 1
3.1 Develop and update Computerised Enterprise Budget (COMBUD)
Number of new enterprises added to the COMBUD 2 2 4 1 1 1 1
3. Provision of statistical support
3.2 Update and dissemination of agricultural statistical information
Number of farmers accessing agricultural statistical information
0 0 10000 2 500 2 500 2 500 2 500

93
PROGRAM 7: STRUCTURED AGRICULTURAL SERVICES
Sub Programme: Structured Agricultural Training
Strategic Goal: Promotion and development of appropriate training/research based production and value adding technologies for successful agri-businesses
Strategic Objective
Measurable Objective Performance
Measure Indicator
Actual 2005/06
2006/07 Estimate
2007/08 Target
Quarter 1 Quarter 2 Quarter 3 Quarter 4
Job Creation Render Agricultural Training (Skills & Learnership) services to farmers and Extension Officers
20 Unit standards submitted for registration & accredited through SETAs 20 20 20 5 5 5 5
Job Creation 40 learners trained in various learnership programs
60 15 40 0 15 15 10
Job Creation 15 short courses developed and aligned to Unit Standards
10 10 15 0 5 5 5
Job Creation 478 farmers in Flagship Projects trained in skills programs
3000 3500 480 0 180 180 120
Job Creation 100 Extension Officers trained in various skills programmes to support commodity approach
200 100 80 10 30 20 20
Job Creation 200 projects reached for training needs identification and analysis
200 200 200 50 50 50 50
Growing the Economy
Render Analytical and
processing services at
AFTC
360 samples analysed and results communicated to farmers
250 280 360 90 90 90 90
Growing the Economy
25 tons of seeds packaged and processed
25 20 25 0 10 15 0
Growing the Economy
One Laboratory Accredited Certificate
1 1 4 1 1 1 1
Growing the Economy
5 tons of food processed and preserved
0 0 5 0 1 2 2
Growing the Economy
30 specimen diagnosed and analysed
20 25 30 0 10 10 10

94
Growing the Economy
5 tons of Cactus Pear processed and or packed 2 3 5 0 0 1 4