MassMutual Barings Dynamic Allocation Fund · PDF fileMassMutual Barings Dynamic Allocation...
44
MassMutual Barings Dynamic Allocation Fund Annual Report September 30, 2013
Transcript of MassMutual Barings Dynamic Allocation Fund · PDF fileMassMutual Barings Dynamic Allocation...

MassMutual Barings Dynamic Allocation Fund Annual Report
September 30, 2013

Table of ContentsPresident’s Letter to Shareholders (Unaudited) ........................................................ 1
Economic and Market Overview (Unaudited) ........................................................... 3
Portfolio Manager Report (Unaudited) .................................................................... 6
Consolidated Portfolio of Investments ..................................................................... 9
Consolidated Statement of Assets and Liabilities....................................................... 12
Consolidated Statement of Operations ..................................................................... 14
Consolidated Statements of Changes in Net Assets .................................................... 15
Consolidated Financial Highlights ........................................................................... 16
Notes to Consolidated Financial Statements ............................................................. 17
Report of Independent Registered Public Accounting Firm ........................................ 30
Trustees and Officers (Unaudited) .......................................................................... 31
Federal Tax Information (Unaudited)...................................................................... 35
Other Information (Unaudited)Proxy Voting ................................................................................................................................................. 36Quarterly Reporting ........................................................................................................................................ 36Trustees’ Approval of Investment Advisory Contracts ........................................................................................... 36Fund Expenses............................................................................................................................................... 38
This material must be preceded or accompanied by a current prospectus (or summary prospectus, if available) for theMassMutual Barings Dynamic Allocation Fund. Investors should consider the Fund’s investment objective, risks, and chargesand expenses carefully before investing. This and other information about the investment company is available in theprospectus (or summary prospectus, if available). Read it carefully before investing.

[THIS PAGE INTENTIONALLY LEFT BLANK]

MassMutual Barings Dynamic Allocation Fund – President’s Letter to Shareholders (Unaudited)
To OurShareholders
Eric Wietsma“In our view, one of themost effective ways you canprepare for retirement is byestablishing a long-terminvestment plan that issuited to how comfortableyou are with the market’sups and downs, how longyou have to save and investbefore retirement, andwhat your specificretirement goals are.”
September 30, 2013
I am pleased to present you with the MassMutual Barings Dynamic Allocation Fund Annual Report,covering the year ended September 30, 2013. Equities in the U.S. and abroad mostly advanced for theyear, with many widely followed indexes posting double-digit returns. Political wrangling inWashington, the near-term future of the Federal Reserve’s Quantitative Easing program (“QE”), andnews-making events from across the globe drove periods of volatility in both the stock and bondmarkets and kept the attention of investors throughout the period. Foreign stock markets were alsopositive for the year, and investor confidence mainly increased throughout the period. A depreciatingU.S. dollar also helped boost the returns of foreign stocks for U.S. investors. Conversely, domesticfixed-income investments lost traction in the U.S. for the period.
The generally strong performance of equity markets during the year was encouraging, but investorsare wise to avoid basing investment decisions on short-term trends, whether positive or negative.Adhering to certain investment guidelines, such as the ones below, can also help you along the way.
Investment guidelines to keep in mind
You are likely in it for the long run
Investing for retirement is not something that happens overnight. Many people save and invest forretirement throughout their working years. It may help you to keep in mind that, although thefinancial markets will go up and down over time, taking a long-term approach to investing gives youmore time to ride out the downturns as you work toward your long-term investment goals.
Make informed choices and seek professional guidance
You want to be confident you are giving yourself the best opportunity for success in your retirementinvesting, so it is important to select an appropriate combination of investments that aligns with thatgoal. If you work with a financial professional, this may be an excellent time to consider contactinghim or her to help you monitor and evaluate your personal retirement investment strategy, make anyappropriate adjustments, and help ensure that your plan remains compatible with your retirementincome objectives.
Contribute as much as you can
When it comes to retirement planning, there are a lot of things you cannot control, such as theperformance of the financial markets. But you can control how often and how much you save.Contributing as much as you can to your retirement account, and increasing those contributions whenyou are able, will help you to keep your investment goals on track.
1

MassMutual Barings Dynamic Allocation Fund – President’s Letter to Shareholders (Unaudited) (Continued)
Who Matters Most
MassMutual believes “Who Matters Most to You Says the Most About You.” Our customers matter most to us, and our primaryfocus is to help you take the necessary steps to prepare for your future – one you can prepare to enjoy on your terms. In our view,one of the most effective ways you can prepare for retirement is by establishing a long-term investment plan that is suited to howcomfortable you are with the market’s ups and downs, how long you have to save and invest before retirement, and what yourspecific retirement goals are. Thank you for your ongoing confidence in MassMutual.
Sincerely,
Eric WietsmaPresident
The information provided is the opinion of MassMutual Retirement Services Investments Marketing as of 10/1/13 and is subject to changewithout notice. It is not to be construed as tax, legal or investment advice. Of course, past performance does not guarantee future results.
2
MassMutual Barings Dynamic Allocation Fund – Economic and Market Overview (Unaudited)
September 30, 2013
Stock markets continue upward march despite ongoing challenges
For the year ended September 30, 2013, investors drove stocks higher in an environment that included the U.S. presidential election,multiple political standoffs over the federal budget, the acceleration of the Federal Reserve’s (the “Fed”) Quantitative Easing program(“QE”), mixed trends in economic indicators in the U.S., and varying degrees of economic recovery in Europe and the Far East.
The Fed continued its ongoing effort to foster an environment accommodative to economic growth. The central bank helped keepshort-term interest rates at historically low levels by maintaining the federal funds rate at 0.0% to 0.25% – the level the rate hasoccupied since December 2008. The federal funds rate is the interest rate that banks and financial institutions charge each otherfor borrowing funds overnight. In September 2012, the Fed increased the bond purchases that constitute QE to $85 billion, adding$45 billion in mortgage-backed securities to a monthly shopping list that already included $40 billion in longer-dated Treasuries.The Fed’s actions helped support the prices of bonds by keeping demand high and contributed to the positive environment forstocks. The Fed kept QE in full force for the entire yearlong period and spurred considerable disruption in both the stock andbond markets when Fed Chairman Bernanke appeared before Congress on May 22 and indicated that the central bank wasconsidering some near-term “tapering” or reduction of its bond purchases. The Fed’s policy announcement on September 18offered a positive surprise to markets by indicating there would be no imminent changes to QE, as most observers had anticipatedthe implementation of at least a token decrease in the Fed’s monthly purchases.
The price of oil traded up and down, but followed an overall trend of advancement throughout much of the year. The commoditystarted the period on October 1, 2012 at more than $92 per barrel, dipped to $85 in November, crested above $110 in earlySeptember, and closed the year at about $102. Gas prices declined throughout the fourth quarter of 2012, giving consumers somerelief at the pumps at the beginning of the period, but rose substantially in the first quarter of 2013. The average price moved in arange between approximately $3.50 and 3.70 per gallon for much of the second and third quarter before dropping to around $3.40by the end of the yearlong period. Gold lost some of its luster with investors who sought the higher returns generated by equitiesand other investments in the positive market environment. The precious metal led off the year at around $1,771 per ounce andmainly drifted downward before closing at approximately $1,328 at the end of September 2013.
Market performance
Equity markets rewarded investors once again during the year ended September 30, 2013. The Russell 2000® Index, representingsmall-capitalization stocks, was the leader among broad-market indexes in the U.S., rising an impressive 30.06%. TheMorgan Stanley Capital International (“MSCI®”) Europe, Australasia, Far East (EAFE®) Index, a barometer for foreign stocks indeveloped markets, also did well and gained 23.77%. The major technology stock benchmark in the U.S., the NASDAQComposite® Index, returned 21.03% for the year. The S&P 500® Index of large-capitalization U.S. stocks posted a 19.34%advance, while the blue-chip Dow Jones Industrial AverageSM rose 15.59%. Stocks from developing economies did not fare aswell as most other categories, but still landed in positive territory, with the MSCI Emerging Markets Index, a measure of theperformance of emerging stock markets throughout the world, managing a 0.98% return for the year.
Bonds underperformed equities by a substantial margin during the 12 months, with the Barclays U.S. Aggregate Bond Index, abroad measure of the U.S. investment-grade bond markets, declining 1.68%. Unrelenting low interest rates continued to take theirtoll, with shorter-term debt investments barely managing to stay in positive territory. In this environment, the Barclays U.S. 1-3Year Government Bond Index, which measures the performance of short-term U.S. government bonds, returned just 0.37%; andTreasury bills, as measured by the Citigroup 3-Month Treasury Bill Index, gained only 0.07%. Investors sought the higher returnsoffered by high-yield bonds, which helped the Barclays U.S. Corporate High-Yield Index, a measure of the performance of fixed-rate, non-investment-grade debt from corporate sectors, advance 7.14% for the year.*
Fourth quarter 2012: Many U.S. stocks down for the quarter
During the fourth quarter of 2012, investors first focused primarily on the U.S. national elections and then turned their attention tothe “fiscal cliff.” (The fiscal cliff was a large reduction of the federal budget deficit through significant tax increases and spending
* Indexes are unmanaged, do not incur fees or expenses and cannot be purchased directly for investment.
3

MassMutualBaringsDynamicAllocationFund–EconomicandMarketOverview(Unaudited)(Continued)
cuts, which were scheduled to become effective on January 1, 2013, unless Congress could strike an alternate plan.) The electionsand fiscal cliff created two major sources of uncertainty for the financial markets. Despite the uncertainty, U.S. stocks fell onlymodestly in the fourth quarter, but the slight change from beginning to end masked considerable volatility during the period.Signs of continued economic recovery in the United States gave investors some reason for optimism, despite the challengesbrought about by the fiscal cliff. In October 2012, the Department of Labor reported an unexpected drop in the unemploymentrate – from 8.1% to 7.8%. That same month, momentum in the housing market continued, as it was reported that the year-over-year median sales price rose the most since 2005 on strong demand, and housing starts surged by 15% to the highest level in fouryears.
Superstorm Sandy battered the East Coast as October drew to a close, bringing widespread damage and flooding and forcing U.S.financial markets to suspend operations for two days. In November, equity investors seemed relieved that the U.S. presidentialelection was over, but fiscal cliff concerns accelerated along with worries about the long-term economic impact of SuperstormSandy. Aside from the fiscal cliff drama, the month of December was generally good for economic data, as job growth, increasedconstruction spending, and an unexpected increase in vehicle sales were bright spots early in the month. In addition, reportsreleased later in the month indicated an upward revision of more than 3% to the third-quarter gross domestic product (“GDP”)final reading, continued strength in housing data, and increases in consumer spending and incomes.
In news from around the world, the European Union (“EU”) won the Nobel Peace Prize in October 2012, signaling the NobelCommittee’s approval of the EU’s and the European Central Bank’s support of Greece, Portugal, and Spain. In November,Greece’s parliament hesitated to vote for another round of austerity, which caused European equities and the euro currency to selloff. In December, Japan’s announcement of stimulus to expand the country’s asset purchase program by more than 10%contributed to weakness in the Japanese yen. After slowing for much of 2012, China’s economy stabilized somewhat, along withother emerging markets in fourth-quarter 2012. China’s trade surplus ended 2012 at a four-year high, but the nation’s total tradegrowth rate was below the government’s target.
First quarter 2013: stocks outperform bonds to start the year
Congressional votes to secure passage of a deal to avert the fiscal cliff were confirmed late on January 1, 2013. In February,equity investors focused on the specter of sequestration – the automatic, across-the-board series of spending cuts to governmentagencies set to go into effect March 1, 2013. Ultimately, in March, Congress passed a stopgap spending bill to keep the federalgovernment running through September 2013. Also in March, the Department of Labor reported that the U.S. unemployment ratefell to its lowest level since December 2008, and the Fed continued its commitment to keep the federal funds rate between 0%and 0.25% – announcing at the same time that it would maintain QE.
U.S. and foreign stocks rose in the first quarter of 2013, outperforming their fixed-income counterparts. Treasury yields traded ina relatively narrow range until mid-March, when they spiked higher on growing optimism about the U.S. economy. (Bond pricesmove in the opposite direction to interest rates [or yields]; when yields rise, the prices of existing bonds fall – and vice versa.)
Overseas, the Japanese Cabinet approved a ¥20 trillion (yen) ($224 billion) stimulus package in January 2013, which wasexpected to create 600,000 jobs and help repair tsunami-ravaged coastland. In February, uncertainty over Italian elections led to ahung parliament, which struck fresh fears into the euro zone. Evidence of a possible slowdown in China caused concern over theworld’s second-largest economy, but Chinese lending reached a two-year high and aggregate financing increased substantially,which indicated improving conditions. In March, banks in Cyprus, experiencing hard times because of their investments in Greeksovereign debt, took a $10 billion bailout from the European Union and the International Monetary Fund to resolve the country’sbanking crisis – although the deal restricted Cyprus’s financial industry and limited its status as an offshore tax haven.
Second quarter 2013: prospect of Fed tapering gives investors pause
While stock prices advanced during April and much of May, they gave up a significant portion of those gains following BenBernanke’s May 22 remarks to Congress about tapering QE. The Fed chairman stated that the central bank might begin taperingbond purchases in its QE program later in 2013 if warranted by U.S. economic data. Despite the jitters this announcement sentthrough the markets, U.S. stocks ultimately managed to move higher during the second quarter.
4
MassMutualBaringsDynamicAllocationFund–EconomicandMarketOverview(Unaudited)(Continued)
Interest rates rose in the wake of Bernanke’s QE comments when investors sold bonds on the belief that demand would decline ifthe Fed were to stop its bond purchases, and ensuing price declines drove interest rates higher. Interestingly, concern about theend of QE gave new life to investors’ “bad news is good news” response to economic data. For example, the CommerceDepartment’s third and final estimate of first-quarter economic growth, released on June 26, came in at 1.8%, well below theprevious estimate of 2.4%. Under normal circumstances, weaker-than-expected economic growth would tend to drive down stockprices. However, the news helped shares advance, as investors were hopeful that the disappointing data might convince the Fed tocontinue with QE for a while longer.
Also weighing on U.S. stocks late in the period was a swoon in Japanese equity prices. Japan’s stock market had been on a tearsince mid-November 2012, and when the Bank of Japan announced a massive QE program of its own in April, the rally in thatnation’s stocks accelerated, only to reverse sharply along with U.S. shares following Bernanke’s congressional testimony.Emerging markets, including Brazil and China, struggled with lackluster economic growth.
Third quarter 2013: stocks on top; Fed comes to the rescue
U.S. stocks posted strong returns in the third quarter of 2013. Share prices moved higher in July, but backed off in August, asinvestors remained uncertain of the Fed’s tapering timetable. Disappointing quarterly news from companies regarded asbellwethers for the broader economy, including Wal-Mart Stores and Cisco Systems, weighed on the market in August, as did thegrowing likelihood of U.S. military strikes in Syria in retaliation for the Assad regime’s alleged use of chemical weapons there.
Stocks rebounded again in September in the midst of talk of a possible diplomatic solution to the crisis in Syria. The market alsogot a lift from news that former U.S. Treasury Secretary Larry Summers was withdrawing from consideration as a possiblereplacement for current Fed Chairman Bernanke, who is expected to step down in January 2014. Summers’ decision seemed toclear the field for Fed Vice Chairwoman Janet Yellen, a stronger proponent of QE. President Obama ultimately nominated Yellenfor the post in early October.
On the heels of the big boost stocks and bonds got from the Fed’s September 18 announcement that QE would continue, the finalweek of the quarter brought stock-price declines attributable to investor concerns about two looming issues. The first was afederal government shutdown that ultimately came to pass on October 1 due to Congress’s inability to reach a funding agreementprior to the September 30 deadline, and the second was a political stalemate over the U.S. debt ceiling, which needed resolutionby mid-October to prevent a default. Sixteen days into the shutdown, legislators worked out a deal to fix both issues for the shortterm, President Obama signed the bill into law in the early hours of October 17, and federal workers were expected to return towork that same day.
In the waning days and aftermath of the year ended September 2013, investors got some insight into the kinds of challenges thatmay create market disruptions in the coming year, including the inevitable end of QE and new rounds of political wrangling inWashington over the federal budget and U.S. debt ceiling, which are likely to occur in January and February 2014, respectively.Investors will also keep an eye out for improving economic growth here and abroad to create a favorable environment for stocksand bonds once QE ends. We believe these important issues and numerous others will come into play as investors navigate theworld’s financial markets in the year ahead.
The information provided is the opinion of MassMutual Retirement Services Investment Services as of 10/1/13 and is subject tochange without notice. It is not to be construed as tax, legal or investment advice. Of course, past performance does notguarantee future results.
5

MassMutual Barings Dynamic Allocation Fund – Portfolio Manager Report (Unaudited)
What is the investment approach of MassMutual Barings Dynamic Allocation Fund, and who is the Fund’s subadviser?
The Fund seeks positive total real return by investing across different asset classes. The Fund invests primarily in individualsecurities, exchange-traded funds (“ETFs”), and derivatives. The Fund’s subadviser is Baring International Investment Limited(Baring).
How did the Fund perform during the 12 months ended September 30, 2013?
The Fund’s Class S shares returned 7.70%, substantially underperforming the 20.21% return of the Morgan Stanley CapitalInternational (“MSCI”) World IndexSM (the “benchmark”), an unmanaged index of issuers listed on the stock exchanges of 20foreign countries and the U.S. The Fund’s 7.70% return outperformed the 1.20% return of the Consumer Price Index for AllUrban Consumers (CPI-U), a measure of the average change over time in the prices paid by urban consumers for a market basketof consumer goods and services.
For a discussion on the economic and market environment during the 12-month period ended September 30, 2013, please see theEconomic and Market Review, beginning on page 3.
Subadviser discussion of factors that contributed to the Fund’s performance
The Fund’s gold holdings contributed to the Fund’s underperformance, as the price of the precious metal dropped substantiallyover the course of the year. Likewise, the Fund’s position in 30-year U.S. Treasury bonds, meant to provide diversification andprotection against a weakening equity market, suffered when bonds sold off after comments by Federal Reserve (the “Fed”)Chairman Bernanke regarding the possibility the central bank would begin “tapering” the bond purchases that constitute itsQuantitative Easing program (QE). Among equity holdings, the Fund’s positions in European equities hindered performance.
Tactical shifts in portfolio risk and allocation changes across asset classes primarily drove the Fund’s performance for the year.The Fund entered the fourth quarter of 2012 with a rather cautious stance and a tilt towards U.S. equities and fixed income, inparticular U.S. corporate bonds.
U.S. equity holdings proved to be the most significant contributors to performance for the year. Overall, sector allocations to U.S.equities proved beneficial, in particular positions in U.S. financials and consumer discretionary stocks. Likewise, a tactical moveinto yen-hedged Japanese equities in February proved timely. Our positive view on Japan centered on the Bank of Japan’saggressive policies to weaken the yen and spur inflation. Lastly, among fixed-income holdings, U.S. high-yield credit was by farthe largest positive contributor, followed by Hungarian government bonds.
The portfolio’s only exposure to derivatives came from a long position in a EuroStoxx 50 index-traded future contract to gainexposure to European equities. (Derivatives are securities that derive their value from the performance of one or more otherinvestments and take the form of a contract between two or more parties. Most derivatives are used for hedging, speculation, orboth.) The Fund held the position in the index-traded future contract for roughly 30 days before swapping into an ETF, whichoffered the access to the same component of the market. The index-traded future contract had no impact on performance versusholding the ETF.
6

MassMutual Barings Dynamic Allocation Fund – Portfolio Manager Report (Unaudited) (Continued)
Subadviser outlook
At the end of the yearlong period, the Fund’s portfolio positioning reflected our positive outlook for stocks and other “risk assets”over the next 12- to 18-month period. In particular, we think that U.S. economic growth is likely to accelerate, which could havespillover effects into other markets, such as Europe. We believe that equities may have the potential to be the best-performingasset class over the near term, led by accelerating earnings growth, while bonds could struggle to post gains, and cash may yieldzero. Our positive outlook for equities assumes the markets will likely continue to be influenced by unorthodox and hard-to-predict monetary and fiscal policy decisions.
MassMutual BaringsDynamic Allocation FundPortfolio Characteristics
(% of Net Assets) on 9/30/13
Mutual Funds* 84.8%Bonds & Notes 7.8%Total Long-Term Investments 92.6%Short-Term Investments and Other
Assets and Liabilities 7.4%Net Assets 100.0%
*Category includes ETFs.
7

MassMutual Barings Dynamic Allocation Fund – Portfolio Manager Report (Unaudited) (Continued)
Growth of a $10,000 InvestmentHypothetical Investments in MassMutual Barings DynamicAllocation Fund Class Z, Class S, Class A, Class A (salesload deducted), Class Y, Class L, the MSCI World Index,and the CPI-U.
TOTAL RETURN
One Year10/1/12 -9/30/13
SinceInceptionAverageAnnual
11/28/11 -9/30/13
Class Z 7.90% 7.84%Class S 7.70% 7.72%Class A 7.24% 7.22%Class A (sales load deducted)* 1.07% 3.84%Class Y 7.50% 7.56%Class L 7.43% 7.45%
MSCI World Index# 20.21% 23.08%CPI-U 1.20% 1.89%+
GROWTH OF A $10,000 INVESTMENT SINCE INCEPTION
11/28/11 3/31/13 9/30/133/31/12 9/30/129,000
10,000
11,000
12,000
13,000
14,000
15,000
16,000
$17,000
Class Z $11,492Class S $11,470Class Y $11,437
MSCI World Index# $14,656
Class L $11,417Class A $11,372
CPI-U+ $10,351Class A (sales load deducted) $10,719
* Class A (sales load deducted) returns include the 5.75% maximum sales charge.+ From 12/1/11.# Benchmark.Performance data quoted represents past performance; past performance is not predictive of future results. The investment return andprincipal value of shares of the Fund will fluctuate with market conditions so that shares of the Fund, when redeemed, may be worth moreor less than their original cost. Current performance of the Fund may be lower or higher than the performance quoted. Performance datacurrent to the most recent month-end may be obtained by calling 1-888-309-3539.Investors should note that the Fund is a professionally managed mutual fund, while the MSCI World Index and the CPI-U are unmanaged, donot incur expenses, and cannot be purchased directly by investors. Investors should read the Fund's prospectus with regard to the Fund’sinvestment objective, risks, and charges and expenses in conjunction with these financial statements. Employee retirement benefit plans thatinvest plan assets in the Separate Investment Accounts (SIAs) may be subject to certain charges as set forth in their respective Plan Documents.Total return figures would be lower for the periods presented if they reflected these charges. The performance tables and charts do not reflectthe deduction of taxes that a shareholder would pay on the Fund distributions or the redemption of the Fund shares.
8

MassMutual Barings Dynamic Allocation Fund – Consolidated Portfolio of Investments
September 30, 2013
PrincipalAmount Value
BONDS & NOTES — 7.8%
SOVEREIGN DEBT OBLIGATIONS — 4.8%Australia Government Bond
AUD (a) (b)3.250% 4/21/29 ............................. 644,000 $ 528,248
Hungary Government Bond HUF (b)6.750% 2/24/17 ............................. 87,460,000 422,374
Poland Government Bond PLN (b)5.000% 4/25/16 ............................. 1,000 333
United Mexican States MXN (b)10.000% 12/05/24 .......................... 1,170,000 117,561
1,068,516
TOTAL SOVEREIGNDEBT OBLIGATIONS(Cost $1,042,496) ............................. 1,068,516
U.S. TREASURY OBLIGATIONS — 3.0%U.S. Treasury Bonds & Notes — 3.0%U.S. Treasury Bond
2.875% 5/15/43 ............................. $ 344,500 292,411U.S. Treasury Inflation Index
3.375% 4/15/32 ............................. 140,551 196,771U.S. Treasury Note
2.125% 8/15/21 ............................. 182,400 180,906
670,088
TOTAL U.S. TREASURYOBLIGATIONS(Cost $710,511) ................................ 670,088
TOTAL BONDS & NOTES(Cost $1,753,007) ............................. 1,738,604
Number ofShares
MUTUAL FUNDS — 84.8%Commodity Fund — 1.0%PowerShares DB Agriculture Fund (c) .. 8,411 212,714
Diversified Financial — 83.8%iShares Gold Trust............................. 29,059 374,570iShares iBoxx $ High Yield Corporate
Bond Fund.................................... 13,742 1,258,218iShares MSCI Japan Index Fund .......... 270,031 3,216,069iShares MSCI United Kingdom Index
Fund............................................ 150,352 2,949,906iShares S&P Global Industrials Sector
Index Fund (d) .............................. 17,293 1,135,804SPDR Gold Trust (c).......................... 221 28,326
Numberof Shares Value
SPDR S&P 500 ETF Trust .................. 17,831 $ 2,997,391State Street Navigator Securities
Lending Prime Portfolio (e) ............. 678,309 678,309Vanguard Consumer Discretionary
ETF............................................. 14,908 1,473,209Vanguard Financials ETF (d)............... 35,790 1,460,590Vanguard FTSE Europe ETF ............... 37,188 2,027,118Vanguard Information Technology
ETF (d) ........................................ 6,962 562,042Vanguard MSCI Emerging Markets
ETF............................................. 14,254 571,728
18,733,280
TOTAL MUTUAL FUNDS(Cost $17,914,708)............................ 18,945,994
TOTAL LONG-TERMINVESTMENTS(Cost $19,667,715)............................ 20,684,598
PrincipalAmount
SHORT-TERM INVESTMENTS — 11.5%Repurchase Agreement — 8.1%State Street Bank & Trust Co.
Repurchase Agreement, dated9/30/13, 0.010%, due 10/01/13 (f) ..... $1,808,708 1,808,708
Time Deposits — 0.0%Euro Time Deposit
0.010% 10/01/13 ........................... 10,056 10,056
U.S. Treasury Bills — 3.4%U.S. Treasury Bill
0.000% 11/14/13 ........................... 762,800 762,759
TOTAL SHORT-TERMINVESTMENTS(Cost $2,581,523) ............................. 2,581,523
TOTAL INVESTMENTS — 104.1%(Cost $22,249,238) (g) ....................... 23,266,121
Other Assets/(Liabilities) — (4.1)% ... (911,380)
NET ASSETS — 100.0% .................. $22,354,741
Notes to Consolidated Portfolio of InvestmentsAUD Australian DollarETF Exchange-Traded FundHUF Hungarian ForintMXN Mexican PesoPLN Polish Zloty
The accompanying notes are an integral part of the consolidated financial statements.
9

MassMutual Barings Dynamic Allocation Fund – Consolidated Portfolio of Investments (Continued)
Notes to Consolidated Portfolio of Investments (Continued)(a) Security exempt from registration under Regulation S of the
Securities Act of 1933, which exempts from registrationsecurities offered and sold outside the United States. Securitymay not be offered or sold in the United States exceptpursuant to an exemption from, or in a transaction not subjectto, the registration requirements of the Securities Act of 1933.At September 30, 2013, these securities amounted to a valueof $528,248 or 2.36% of net assets.
(b) The principal amount of the security is in foreign currency.The market value is in U.S. dollars.
(c) Non-income producing security.(d) Denotes all or a portion of security on loan. The total value of
securities on loan as of September 30, 2013, was $664,857.Total securities on loan may not correspond with the amountsidentified in the Portfolio of Investments because pendingsales may be in the process of recall from the brokers.(Note 2).
(e) Represents investment of security lending collateral. (Note 2).(f) Maturity value of $1,808,709. Collateralized by U.S.
Government Agency obligations with a rate of 2.750%,maturity date of 11/15/28, and an aggregate market value,including accrued interest, of $1,846,441.
(g) See Note 6 for aggregate cost for federal tax purposes.
The accompanying notes are an integral part of the consolidated financial statements.
10

THIS PAGE INTENTIONALLY LEFT BLANK

MassMutual Barings Dynamic Allocation Fund – Consolidated Financial Statements
Consolidated Statement of Assets and LiabilitiesSeptember 30, 2013
Assets:Investments, at value (Note 2) (a).......................................................................................................................... $20,684,598Short-term investments, at value (Note 2) (b) .......................................................................................................... 2,581,523
Total investments (c) .......................................................................................................................................... 23,266,121
Receivables from:Open forward foreign currency contracts (Note 2)................................................................................................. 5,943Investment adviser (Note 3) .............................................................................................................................. 10,857Interest and dividends ..................................................................................................................................... 50,149
Total assets ................................................................................................................................................ 23,333,070
Liabilities:Payables for:
Open forward foreign currency contracts (Note 2)................................................................................................. 215,116Securities on loan (Note 2) ............................................................................................................................... 678,309Trustees’ fees and expenses (Note 3) .................................................................................................................. 890Affiliates (Note 3):
Investment management fees......................................................................................................................... 15,430Administration fees ..................................................................................................................................... 7,236Service fees ............................................................................................................................................... 730
Accrued expense and other liabilities ..................................................................................................................... 60,618
Total liabilities ........................................................................................................................................... 978,329
Net assets ........................................................................................................................................................ $22,354,741
Net assets consist of:Paid-in capital ................................................................................................................................................... $20,367,768Undistributed (accumulated) net investment income (loss) ......................................................................................... 369,230Accumulated net realized gain (loss) on investments and foreign currency transactions ................................................... 809,478Net unrealized appreciation (depreciation) on investments and foreign currency translations ............................................ 808,265
Net assets ........................................................................................................................................................ $22,354,741
(a) Cost of investments: ........................................................................................................................................... $19,667,715(b) Cost of short-term investments: ............................................................................................................................ $ 2,581,523(c) Securities on loan with market value of: ................................................................................................................. $ 664,857
The accompanying notes are an integral part of the consolidated financial statements.12

MassMutual Barings Dynamic Allocation Fund – Consolidated Financial Statements (Continued)
Consolidated Statement of Assets and LiabilitiesSeptember 30, 2013
Class Z shares:Net assets ......................................................................................................................................................... $11,420,156
Shares outstanding (a) ........................................................................................................................................ 1,016,446
Net asset value, offering price and redemption price per share .................................................................................... $ 11.24
Class S shares:Net assets ......................................................................................................................................................... $ 4,012,953
Shares outstanding (a) ........................................................................................................................................ 357,479
Net asset value, offering price and redemption price per share .................................................................................... $ 11.23
Class Y shares:Net assets ......................................................................................................................................................... $ 4,148,967
Shares outstanding (a) ........................................................................................................................................ 370,318
Net asset value, offering price and redemption price per share .................................................................................... $ 11.20
Class L shares:Net assets ......................................................................................................................................................... $ 1,635,769
Shares outstanding (a) ........................................................................................................................................ 146,084
Net asset value, offering price and redemption price per share .................................................................................... $ 11.20
Class A shares:Net assets ......................................................................................................................................................... $ 1,136,896
Shares outstanding (a) ........................................................................................................................................ 101,641
Net asset value and redemption price per share ........................................................................................................ $ 11.19
Offering price per share (100/[100-maximum sales charge] of net asset value) .............................................................. $ 11.87
(a) Authorized unlimited number of shares with no par value.
The accompanying notes are an integral part of the consolidated financial statements.13

MassMutual Barings Dynamic Allocation Fund – Consolidated Financial Statements (Continued)
Consolidated Statement of OperationsFor the Year Ended September 30, 2013
Investment income (Note 2):Dividends ................................................................................................................................................... $ 388,971Interest ....................................................................................................................................................... 71,076Securities lending net income ......................................................................................................................... 22,628
Total investment income............................................................................................................................. 482,675
Expenses (Note 3):Investment management fees .......................................................................................................................... 164,582Custody fees ................................................................................................................................................ 6,763Audit fees ................................................................................................................................................... 44,925Legal fees ................................................................................................................................................... 49,404Proxy fees ................................................................................................................................................... 1,028Shareholder reporting fees.............................................................................................................................. 18,607Trustees’ fees .............................................................................................................................................. 1,483Subsidiary administration fees ........................................................................................................................ 29,871
316,663Administration fees:
Class Z.................................................................................................................................................... 2,777Class S .................................................................................................................................................... 4,646Class Y ................................................................................................................................................... 8,547Class L.................................................................................................................................................... 5,676Class A ................................................................................................................................................... 3,897
Service fees:Class A ................................................................................................................................................... 2,783
Total expenses ...................................................................................................................................... 344,989Expenses waived (Note 3):
Class Z fees reimbursed by adviser ............................................................................................................... (13,475)Class S fees reimbursed by adviser ............................................................................................................... (5,636)Class Y fees reimbursed by adviser............................................................................................................... (5,656)Class L fees reimbursed by adviser ............................................................................................................... (2,361)Class A fees reimbursed by adviser............................................................................................................... (1,959)Class Z administrative fees waived ............................................................................................................... (16)Class S administrative fees waived ............................................................................................................... (7)Class Y administrative fees waived............................................................................................................... (6)Class L administrative fees waived ............................................................................................................... (2)Class A administrative fees waived............................................................................................................... (2)Class Z management fees waived ................................................................................................................. (3,089)Class S management fees waived ................................................................................................................. (1,292)Class Y management fees waived................................................................................................................. (1,297)Class L management fees waived ................................................................................................................. (541)Class A management fees waived................................................................................................................. (372)Subsidiary expenses waived (Note 3) ............................................................................................................ (85,775)
Net expenses......................................................................................................................................... 223,503
Net investment income (loss) .................................................................................................................. 259,172Realized and unrealized gain (loss):
Net realized gain (loss) on:Investment transactions .............................................................................................................................. 1,019,972Futures contracts ....................................................................................................................................... 23,062Foreign currency transactions ...................................................................................................................... 43,925
Net realized gain (loss) .......................................................................................................................... 1,086,959Net change in unrealized appreciation (depreciation) on:
Investment transactions .............................................................................................................................. 206,527Translation of assets and liabilities in foreign currencies ................................................................................... (170,108)
Net change in unrealized appreciation (depreciation) ............................................................................... 36,419Net realized gain (loss) and change in unrealized appreciation (depreciation) .............................................. 1,123,378
Net increase (decrease) in net assets resulting from operations ......................................................................... $1,382,550
The accompanying notes are an integral part of the consolidated financial statements.14

MassMutual Barings Dynamic Allocation Fund – Consolidated Financial Statements (Continued)
Consolidated Statements of Changes in Net AssetsYear
EndedSeptember 30, 2013
PeriodEnded
September 30, 2012*
Increase (Decrease) in Net Assets:Operations:
Net investment income (loss) .............................................................................. $ 259,172 $ 105,678Net realized gain (loss) on investment transactions .................................................. 1,086,959 (177,150)Net change in unrealized appreciation (depreciation) on investments .......................... 36,419 771,846
Net increase (decrease) in net assets resulting from operations ....................... 1,382,550 700,374
Distributions to shareholders (Note 2):From net investment income:
Class Z ........................................................................................................ (93,058) (13,411)Class S ........................................................................................................ (38,621) (13,115)Class Y ....................................................................................................... (35,546) (3,653)Class L ........................................................................................................ (13,658) (3,531)Class A ....................................................................................................... (6,501) (3,295)
Total distributions from net investment income ........................................... (187,384) (37,005)
From net realized gains:Class Z ........................................................................................................ (56,983) -Class S ........................................................................................................ (25,960) -Class Y ....................................................................................................... (24,088) -Class L ........................................................................................................ (11,023) -Class A ....................................................................................................... (7,750) -
Total distributions from net realized gains................................................... (125,804) -
Net fund share transactions (Note 5):Class Z ........................................................................................................... 7,233,661 3,500,100Class S ........................................................................................................... 64,581 3,513,215Class Y ........................................................................................................... 531,175 3,293,753Class L ........................................................................................................... (34,929) 1,503,931Class A ........................................................................................................... (28,321) 1,044,844
Increase (decrease) in net assets from fund share transactions ....................... 7,766,167 12,855,843
Total increase (decrease) in net assets ................................................................ 8,835,529 13,519,212Net assets
Beginning of year ............................................................................................. 13,519,212 -
End of year ..................................................................................................... $22,354,741 $13,519,212
Undistributed (accumulated) net investment income (loss) included in net assets atend of year ................................................................................................... $ 369,230 $ 69,608
* Fund commenced operations on November 28, 2011.
The accompanying notes are an integral part of the consolidated financial statements.15

MassMutual Barings Dynamic Allocation Fund – Consolidated Financial Statements (Continued)
Consolidated Financial Highlights (For a share outstanding throughout each period)
Income (loss) from investmentoperations: Less distributions to shareholders: Ratios / Supplemental Data:
Net assetvalue,
beginningof period
Netinvestment
income(loss) c,j
Netrealized
andunrealizedgain (loss)
oninvestments
Totalincome
(loss) frominvestmentoperations
From netinvestment
income
From netrealized
gainsTotal
distributions
Netasset value,
end ofperiod
TotalReturn 1,m
Netassets,end ofperiod(000’s)
Ratio ofexpenses
to averagedaily net
assetsbefore
expensewaivers
Ratio ofexpenses
to averagedaily net
assetsafter
expensewaivers j
Netinvestment
income(loss) toaveragedaily net
assets
Class Z09/30/13 $10.62 $0.16 $0.65 $0.81 $(0.12) $(0.07) $(0.19) $11.24 7.90% $11,420 1.63% 1.02% 1.42%09/30/12g 10.00 0.11 0.55 0.66 (0.04) - (0.04) 10.62 6.51%b 3,716 3.16%a 1.02%a 1.31%a
Class S09/30/13 $10.61 $0.15 $0.65 $0.80 $(0.11) $(0.07) $(0.18) $11.23 7.70% $ 4,013 1.72% 1.11% 1.35%09/30/12g 10.00 0.11 0.54 0.65 (0.04) - (0.04) 10.61 6.50%b 3,727 3.25%a 1.11%a 1.22%a
Class Y09/30/13 $10.60 $0.13 $0.65 $0.78 $(0.11) $(0.07) $(0.18) $11.20 7.50% $ 4,149 1.82% 1.21% 1.21%09/30/12g 10.00 0.09 0.55 0.64 (0.04) - (0.04) 10.60 6.39%b 3,395 3.35%a 1.21%a 1.00%a
Class L09/30/13 $10.59 $0.12 $0.65 $0.77 $(0.09) $(0.07) $(0.16) $11.20 7.43% $ 1,636 1.95% 1.34% 1.11%09/30/12g 10.00 0.08 0.55 0.63 (0.04) - (0.04) 10.59 6.28%b 1,579 3.48%a 1.34%a 0.96%a
Class A09/30/13 $10.57 $0.10 $0.65 $0.75 $(0.06) $(0.07) $(0.13) $11.19 7.24% $ 1,137 2.20% 1.56% 0.91%09/30/12g 10.00 0.06 0.54 0.60 (0.03) - (0.03) 10.57 6.05%b 1,102 3.73%a 1.59%a 0.74%a
Year endedSeptember 30, 2013
Period endedSeptember 30, 2012b,g
Portfolio turnover rate for all share classes 123% 91%
a Annualized.b Percentage represents the results for the period and is not annualized.c Per share amount calculated on the average shares method.g For the period November 28, 2011 (commencement of operations) through September 30, 2012.j Computed after giving effect to an agreement by MassMutual to waive certain fees and expenses of the Fund.l Employee retirement benefit plans that invest plan assets in the Separate Investment Accounts (SIAs) may be subject to certain charges as set
forth in their respective Plan Documents. Total return figures would be lower for the periods presented if they reflected these charges.m Total return excludes sales charges, if any, and would be lower for the period presented if it reflected these charges.
The accompanying notes are an integral part of the consolidated financial statements.16
Notes to Consolidated Financial Statements
1. The Fund
MassMutual Premier Funds (the “Trust”) is registered under the Investment Company Act of 1940, as amended (the “1940 Act”),as an open-end, management investment company. The Trust is organized under the laws of the Commonwealth of Massachusettsas a Massachusetts business trust pursuant to an Agreement and Declaration of Trust dated August 1, 1994, as amended andrestated as of November 21, 2011, as it may be further amended from time to time. The MassMutual Barings Dynamic AllocationFund (the “Fund”) is a series of the Trust.
Each share class of the Fund represents an interest in the same portfolio of assets. The principal difference among the classes is thelevel of service and administration fees, and shareholder and distribution service expenses borne by the classes. Because each classwill have different fees and expenses, performance and share prices will vary between the classes. The classes of shares are offeredto different types of investors, as outlined in the Fund’s Prospectus.
2. Significant Accounting Policies
The following is a summary of significant accounting policies followed consistently by the Fund in the preparation of theconsolidated financial statements in conformity with accounting principles generally accepted in the United States of America(“generally accepted accounting principles”). The preparation of the consolidated financial statements in accordance with generallyaccepted accounting principles requires management to make estimates and assumptions that affect the reported amounts anddisclosures in the financial statements. Actual results could differ from those estimates.
Basis of Consolidation
The accompanying consolidated financial statements for the Fund include the accounts of MassMutual Barings Cayman DynamicAllocation Fund I, Ltd. (the “Subsidiary”), a wholly owned subsidiary of the Fund, which primarily invests in commodity-relatedinvestments consistent with the Fund’s investment objectives and policies as stated in its Prospectus and Statement of AdditionalInformation. The Subsidiary allows the Fund to hold these commodity-related investments and still satisfy regulated investmentcompany tax requirements. The Fund may invest up to 25% of its total assets in the Subsidiary. Intercompany accounts andtransactions have been eliminated. As of September 30, 2013, the Fund’s net assets were $22,354,741, of which $600,697 or 2.7%,represented the Fund’s ownership of the shares of the Subsidiary.
Investment Valuation
The net asset value of the Fund’s shares is determined once daily as of the close of regular trading on the New York StockExchange, on each day the New York Stock Exchange is open for trading (a “business day”). The New York Stock Exchangenormally closes at 4:00 p.m. Eastern Time, but may close earlier on some days.
Equity securities and derivative contracts that are actively traded on a national securities exchange or contract market are valued onthe basis of information furnished by a pricing service, which provides the last reported sale price for securities or derivatives listedon the exchange or contract market or the official closing price on the NASDAQ National Market System, or in the case of over-the-counter (“OTC”) securities for which an official closing price is unavailable or not reported on the NASDAQ System, the lastreported bid price. Portfolio securities traded on more than one national securities exchange are valued at the last price at the closeof the exchange representing the principal market for such securities. Debt securities (other than short-term obligations) are valuedon the basis of valuations furnished by a pricing service, which generally determines valuations taking into account factors such asinstitutional-size trading in similar securities, yield, quality, coupon rate, maturity, type of issue, trading characteristics, and othermarket data. Short-term debt securities are valued at either amortized cost or at original cost plus accrued interest, whichever theFund’s investment adviser determines more closely approximates current market value. Shares of other open-end mutual funds arevalued at their closing net asset values as reported on each business day.
Investments for which market quotations are readily available are marked to market daily based on those quotations. Marketquotations may be provided by third-party vendors or market makers, and may be determined on the basis of a variety of factors,such as broker quotations, financial modeling, and other market data, such as market indexes and yield curves, counterpartyinformation, and foreign exchange rates. U.S. Government and agency securities may be valued on the basis of market quotations
17

Notes to Consolidated Financial Statements (Continued)
or using a model that may incorporate market observable data such as reported sales of similar securities, broker quotes, yields,bids, offers, quoted market prices, and reference data. The fair values of OTC derivative contracts, including forward, swap, andoption contracts related to interest rates, foreign currencies, credit standing of reference entities, equity prices, or commodityprices, may be based on market quotations or may be modeled using a series of techniques, including simulation models,depending on the contract and the terms of the transaction. The fair values of asset-backed securities and mortgage-backedsecurities are estimated based on models that consider the estimated cash flows of each debt tranche of the issuer, establish abenchmark yield, and develop an estimated tranche-specific spread to the benchmark yield based on the unique attributes of thetranche including, but not limited to, prepayment speed assumptions and attributes of the collateral. Many pricing models do notentail material subjectivity because the methodologies employed do not necessitate significant judgments and the pricing inputs areobserved from actively quoted markets, as is the case of interest rate swap and option contracts. Restricted securities are generallyvalued at a discount to similar publicly traded securities.
Investments for which market quotations are not available or for which a pricing service or vendor does not provide a value, or forwhich such market quotations or values are considered by the investment adviser or subadviser to be unreliable (including, forexample, certain foreign securities, thinly-traded securities, certain restricted securities, certain initial public offerings, or securitieswhose values may have been affected by a significant event) are stated at fair valuations determined in good faith by the Fund’sValuation Committee1 in accordance with procedures approved annually by the Board of Trustees (“Trustees”), and under thegeneral oversight of the Trustees. The Fund’s Valuation Committee employs various methods to determine fair valuationsincluding a regular review of key inputs and assumptions and review of any related market activity. The Fund’s ValuationCommittee reports to the Trustees at their regularly scheduled meetings. It is possible that fair value prices will be used by theFund to a significant extent. The value determined for an investment using the Fund’s fair value procedures may differ from recentmarket prices for the investment and may be significantly different from the value realized upon the sale of such investment.
The Fund may invest in securities that are traded principally in foreign markets and that trade on weekends and other days whenthe Fund does not price its shares. As a result, the values of the Fund’s portfolio securities may change on days when the prices ofthe Fund’s shares are not calculated. The prices of the Fund’s shares will reflect any such changes when the prices of the Fund’sshares are next calculated, which is the next business day. The Fund may use fair value pricing more frequently for securitiesprimarily traded in foreign markets because, among other things, most foreign markets close well before the Fund values itssecurities. The earlier close of these foreign markets gives rise to the possibility that significant events, including broad marketmoves, may have occurred in the interim. The Fund’s investments may be priced based on fair values provided by a third-party fairvaluation vendor, based on certain factors and methodologies applied by such vendor, in the event that there is movement in theU.S. market, between the close of the foreign market and the time the Fund calculates its net asset values. All assets and liabilitiesexpressed in foreign currencies are converted into U.S. dollars at the mean between the buying and selling rates of such currenciesagainst the U.S. dollar at the end of each business day.
Fair value is defined as the price that would be received to sell an asset or paid to transfer a liability in an orderly transactionbetween market participants at the measurement date. A three-tier hierarchy is utilized to maximize the use of observable marketdata inputs and minimize the use of unobservable inputs and to establish classification of fair value measurements for disclosurepurposes. Inputs refer broadly to the assumptions that market participants would use in pricing the asset or liability, includingassumptions about risk, for example, the risk inherent in a particular valuation technique used to measure fair value (such as apricing model) and/or the risk inherent in the inputs to the valuation technique. Inputs may be observable or unobservable.Observable inputs are inputs that reflect the assumptions market participants would use in pricing the asset or liability and aredeveloped based on market data obtained from sources independent of the reporting entity. Unobservable inputs are inputs thatreflect the reporting entity’s own assumptions about the assumptions market participants would use in pricing the asset or liabilityand are developed based on the best information available in the circumstances. The three-tier hierarchy of inputs is summarized inthe three broad Levels listed below. The inputs or methodology used for valuing investments are not necessarily an indication ofthe risk associated with investing in those investments and the determination of the significance of a particular input to the fairvalue measurement in its entirety requires judgment and consideration of factors specific to each security.
1 The Valuation Committee consists of the President, Treasurer, Assistant Treasurers, Vice Presidents (except for the CCO),Secretary, and Assistant Secretaries of the Trust, as well as such alternate members as the Trustees may from time to timedesignate. The Valuation Committee reviews and makes recommendations concerning the fair valuation of portfolio securitiesand the Fund’s pricing procedures in general.
18

Notes to Consolidated Financial Statements (Continued)
Level 1 – quoted prices (unadjusted) in active markets for identical investments that the Fund can access at the measurement date
The types of assets and liabilities categorized in Level 1 generally include actively traded domestic and certain foreign equitysecurities, derivatives actively traded on a national securities exchange (such as some warrants, rights, futures, and options), andshares of open-end mutual funds.
Level 2 – other significant observable inputs (including quoted prices for similar investments, interest rates, prepayment speeds,credit risk, etc.)
The types of assets and liabilities categorized in Level 2 generally include debt securities such as U.S. government and agencysecurities, mortgage-backed securities, asset-backed securities, municipal obligations, sovereign debt obligations, bank loans,corporate bonds, and those securities valued at amortized cost; OTC derivatives such as swaps, options, swaptions, and forwardforeign currency exchange contracts; certain restricted securities; and non-exchange traded equity securities and certain foreignequity securities traded on particular foreign exchanges that close before the Fund determines its net asset values.
Level 3 – significant unobservable inputs (including the Fund’s own assumptions in determining the fair value of investments)
The types of assets and liabilities categorized in Level 3 generally include securities for which prices, spreads, or any of the otheraforementioned key inputs are unobservable. Generally, securities whose trading has been suspended or that have been de-listedfrom their current primary trading exchange; securities in default or bankruptcy proceedings for which there is no current marketquotation; securities and certain derivatives valued by broker quotes which may include brokers’ assumptions; and any illiquidRule 144A securities or restricted securities issued by non-public entities are categorized in Level 3.
The availability of observable inputs can vary from security to security and is affected by a wide variety of factors, including, forexample, the type of security, whether the security is new and not yet established in the marketplace, the liquidity of markets, andother characteristics particular to the security. To the extent that valuation is based on models or inputs that are less observable orunobservable in the market, the determination of fair value requires more judgment. Accordingly, the degree of judgment exercisedin determining fair value is greatest for instruments categorized in Level 3.
Changes in valuation techniques may result in transfers in or out of an investment’s assigned Level within the hierarchy. In addition,in periods of market dislocation, the observability of prices and inputs may be reduced for many instruments. This condition, as wellas changes related to liquidity of investments, could cause a security to be reclassified between Level 1, Level 2, or Level 3.
In certain cases, the inputs used to measure fair value may fall into different levels of the fair value hierarchy. In such cases, fordisclosure purposes the level in the fair value hierarchy within which the fair value measurement falls is determined based on thelowest level input that is significant to the overall fair value measurement.
The following is the aggregate value by input level, as of September 30, 2013, for the Fund’s investments:
Asset Investments Level 1 Level 2 Level 3 Total
Sovereign Debt Obligations $ - $1,068,516 $ - $ 1,068,516U.S. Treasury Obligations - 670,088 - 670,088Mutual Funds 18,945,994 - - 18,945,994Short-Term Investments - 2,581,523 - 2,581,523
Total Investments $18,945,994 $4,320,127 $ - $23,266,121
Asset DerivativesForward Contracts $ - $ 5,943 $ - $ 5,943
Liability DerivativesForward Contracts $ - $ (215,116) $ - $ (215,116)
The liability shown in the Consolidated Statement of Assets and Liabilities related to securities on loan approximates fair value,which would be categorized at Level 2, as of September 30, 2013.
19

Notes to Consolidated Financial Statements (Continued)
The Fund had no transfers between Level 1, Level 2, and Level 3 of the fair value hierarchy during the year ended September 30,2013. The Fund recognizes transfers between the Levels as of the beginning of the year.
Derivative Instruments
Derivatives are financial instruments whose values are based on the values of one or more indicators, such as a security, asset,currency, interest rate, or index. Derivative transactions can create investment leverage and may be highly volatile. It is possiblethat a derivative transaction will result in a loss greater than the principal amount invested. The Fund may not be able to close out aderivative transaction at a favorable time or price. The Fund held derivatives during the year ended September 30, 2013. Thefollowing table shows how the Fund used these derivatives during the period (marked with an “A”), as well as additional uses, ifany, it may have for them in the future (marked with an “M”).
Type of Derivative and Objective for Use
Foreign Currency Exchange Transactions*Hedging/Risk Management A
Directional Exposures to Currencies M
Futures Contracts**Hedging/Risk Management M
Duration/Credit Quality Management M
Substitution for Direct Investment A
* Includes any options purchased or written, futures contracts, forward contracts, and swap agreements, if applicable.** Includes any options purchased or written on futures contracts, if applicable.
At September 30, 2013, and during the year then ended, the Fund had the following derivatives and transactions in derivatives,grouped into the indicated risk categories:
EquityRisk
ForeignExchange
Risk Total
Asset DerivativesForward Contracts* $ - $ 5,943 $ 5,943
Liability DerivativesForward Contracts^ $ - $ (215,116) $ (215,116)
Realized Gain (Loss)#Forward Contracts $ - $ 4,053 $ 4,053Futures Contracts 23,062 - 23,062
Total Realized Gain (Loss) $23,062 $ 4,053 $ 27,115
Change in Appreciation (Depreciation)##Forward Contracts $ - $ (169,955) $ (169,955)
Number of Contracts, Notional Amounts or Shares/Units†Forward Contracts $ - $4,588,679 $4,588,679Futures Contracts 16 - 16
* Consolidated Statement of Assets and Liabilities location: Receivables from: open forward foreign currency contracts.^ Consolidated Statement of Assets and Liabilities location: Payables for: open forward foreign currency contracts.# Consolidated Statement of Operations location: Amounts are included in net realized gain (loss) on: futures contracts or
foreign currency transactions, as applicable.## Consolidated Statement of Operations location: Amounts are included in net change in unrealized appreciation (depreciation)
on: translation of assets and liabilities in foreign currencies.
20
Notes to Consolidated Financial Statements (Continued)
† Amount(s) disclosed represent average number of contracts for futures contracts and notional amounts for forward contracts,which is indicative of volume of this derivative type, for the months that the Fund held such derivatives during the year endedSeptember 30, 2013.
Further details regarding the derivatives and other investments held by the Fund during the year ended September 30, 2013, arediscussed below.
Foreign Currency Exchange Transactions
The Fund may engage in foreign currency exchange transactions for hedging purposes in order to protect against uncertainty in thelevel of future foreign currency exchange rates, or for other, non-hedging purposes.
The Fund may enter into foreign currency exchange transactions, including foreign currency forward contracts. These contractscall for the Fund to deliver in the future an amount of one currency in return for an amount of another currency, at an exchange ratedetermined at the time the contract is entered into. Forward contracts are private contractual arrangements and the Fund is subjectto the risk that its counterparty will not, or will not be able to, perform its obligations. This type of arrangement may require theFund to post margin. The Fund may enter into foreign currency exchange transactions in order to hedge against changes in thevalues of the assets or liabilities denominated in one or more foreign currencies, or otherwise to increase or reduce the Fund’sexposure to various foreign currencies. The use of foreign currency exchange transactions may create investment leverage.
Whenever the Fund enters into a foreign currency exchange transaction, it is subject to the risk that the value of the transaction willmove in a direction unfavorable to it. When the Fund uses the transactions for hedging purposes, it is likely that the Fund will havean asset or liability that will offset any loss (or gain) on the transactions, at least in part. If the Fund enters into foreign currencyexchange transactions other than for hedging purposes (for example, seeking to profit from an anticipated change in the values ofcurrencies by creating directional exposures in the portfolio with respect to one or more currencies), it will generally be subject tothe same risks, but is less likely to have assets or liabilities that will offset any losses on the transactions. There can be no assurancethat the Fund will be able to terminate any foreign currency exchange transaction prior to its maturity in order to limit its loss onthe transaction.
Forward foreign currency contracts are marked to market daily and the change in their value is recorded by the Fund as anunrealized gain or loss. Forward foreign currency contracts are valued at the settlement price established through dealers or othermarket sources on the day which they are traded. When a forward foreign currency contract is extinguished, through delivery oroffset by entering into another forward foreign currency contract, the Fund records a realized gain or loss equal to the differencebetween the value of the contract at the time it was opened and the value of the contract at the time it was extinguished or offset.The notional or contractual amounts of these instruments do not necessarily represent the amounts potentially subject to risk. Themeasurement of the risk associated with these instruments is meaningful only when all related and offsetting transactions andcounterparty risks are considered.
21

Notes to Consolidated Financial Statements (Continued)
The Fund had the following open forward foreign currency contracts at September 30, 2013. The Fund’s current exposure to acounterparty is typically the unrealized appreciation on the contract.
CounterpartySettlement
Date
InExchange
for
UnrealizedAppreciation/(Depreciation)
Contracts to BuyJPY 106,500,000 UBS AG 10/16/13 $1,096,993 $ (13,435)
Contracts to DeliverAUD 56,000 Goldman Sachs International 12/17/13 $ 52,624 $ 638
AUD 453,000 The Northern Trust Company 12/17/13 425,713 5,187EUR 632,000 The Northern Trust Company 12/17/13 855,289 118GBP 1,738,000 The Northern Trust Company 11/05/13 2,671,290 (141,609)
3,952,292 (136,304)
JPY 301,085,000 JP Morgan Chase Bank 10/16/13 3,003,243 (60,072)
$7,008,159 $(195,738)
AUD Australian DollarEUR EuroGBP British PoundJPY Japanese Yen
Futures Contracts
The Fund may seek to manage a variety of different risks, such as interest rate risk, equity price risk, and currency risk, through theuse of futures contracts. The Fund may use interest rate futures contracts to adjust the interest rate sensitivity (duration) of its portfolioor the credit exposure of the portfolio. Interest rate futures contracts obligate the long or short holder to take or make delivery of aspecified quantity of a financial instrument, such as a specific fixed-income security, during a specified future period at a specifiedprice. The Fund may use index futures to hedge against broad market risks to its portfolio or to gain broad market exposure when itholds uninvested cash or as an inexpensive substitute for cash investments directly in securities or other assets. Securities index futurescontracts are contracts to buy or sell units of a securities index at a specified future date at a price agreed upon when the contract ismade and are settled in cash. Positions in futures may be closed out only on an exchange or board of trade which provides a secondarymarket for such futures. Because futures contracts are exchange-traded, they typically have minimal exposure to counterparty risk.
Parties to a futures contract are not required to post the entire notional amount of the contract, but rather a small percentage of thatamount (by way of margin), both at the time they enter into futures transactions, and then on a daily basis if their positions decline invalue; as a result, futures contracts are highly leveraged. Such payments are known as variation margin and are recorded by the Fund asunrealized gains or losses. Because futures markets are highly leveraged, they can be extremely volatile, and there can be no assurancethat the pricing of a futures contract will correlate precisely with the pricing of the asset or index underlying it or the asset or liability ofthe Fund that is the subject of the hedge. It may not always be possible for the Fund to enter into a closing transaction with respect to afutures contract it has entered into, at a favorable time or price. When the Fund enters into a futures transaction, it is subject to the riskthat the value of the futures contract will move in a direction unfavorable to it. When the Fund uses futures contracts for hedgingpurposes, it is likely that the Fund will have an asset or liability that will offset any loss (or gain) on the transactions, at least in part.
When a futures contract is closed, the Fund records a realized gain or loss equal to the difference between the value of the contractat the time it was opened and the value at the time it was closed. Futures contracts are valued at the settlement price establishedeach day by the board of trade or exchange on which they are traded.
Inflation-Indexed Bonds
The Fund may invest in inflation-indexed bonds, which are fixed income securities whose principal value or coupon is periodicallyadjusted according to the rate of inflation, as measured by the Consumer Price Index for All Urban Consumers (“CPI-U”) (for U.S.
22

Notes to Consolidated Financial Statements (Continued)
Treasury inflation-indexed bonds) or, generally, by a comparable inflation index calculated by the foreign government issuing theinflation-indexed bonds.
If the periodic adjustment rate measuring inflation falls, the principal value of inflation-indexed bonds will be adjusted downward,and consequently the interest payable on these securities (calculated with respect to a smaller principal amount) will be reduced.Repayment of the original bond principal upon maturity (as adjusted for inflation) is guaranteed in the case of U.S. Treasuryinflation-indexed bonds, even during a period of deflation. However, the current market value of the bonds is not guaranteed, andwill fluctuate. The Fund may also invest in other inflation related bonds which may or may not provide a similar guarantee. If aguarantee of principal is not provided, the adjusted principal value of the bond repaid at maturity may be less than the originalprincipal. Any adjustments to the principal amount of an inflation-indexed bond due to inflation will be reflected as increases ordecreases to interest income. Such adjustments may have a significant impact on the Fund’s distributions.
The value of inflation-indexed bonds is generally based on changes in real interest rates, which in turn are tied to the relationshipbetween nominal interest rates and the rate of inflation. Therefore, if nominal interest rates increased at a faster rate than inflation, realinterest rates might rise, leading to a decrease in value of inflation-indexed bonds. While the values of these securities are expected to beprotected from long-term inflationary trends, short-term increases in inflation may lead to a decline in value. There can be no assurancethat the CPI-U or any foreign inflation index will accurately measure the real rate of inflation, or that the rate of inflation in a foreigncountry will correlate to the rate of inflation in the United States. Additionally, if interest rates rise due to reasons other than inflation,investors in these securities may not be protected to the extent that the increase is not reflected in the bond’s inflation measure.
Repurchase Agreements
The Fund may enter into repurchase agreements with certain banks and broker-dealers whereby the Fund acquires a security forcash and obtains a simultaneous commitment from the seller to repurchase the security at an agreed upon price and date. The Fund,through its custodian, takes possession of the securities collateralizing the repurchase agreement in a segregated account.Repurchase agreements must be fully collateralized at all times, but involve some risk to the Fund if the other party should defaulton its obligation and the Fund is delayed or prevented from recovering the collateral, or if the Fund is required to return collateralto a borrower at a time when it may realize a loss on the investment of that collateral.
Securities Lending
The Fund may lend its securities to qualified brokers, under the terms of a master netting agreement. Securities lending cannotexceed 33% of the total assets of the Fund taken at current value.
The loans are collateralized at all times with cash or securities with a market value at least equal to 100% of the market value of thesecurities on loan. The market value of the loaned securities is determined at the close of business of the Fund and any additionalcollateral is delivered to the Fund the next business day. As with other extensions of credit, the Fund may bear the risk of delay inrecovery or even loss of rights in the collateral should the borrower of the securities fail financially. The Fund receivescompensation for lending its securities in the form of a securities loan fee paid by the borrower, as well as a share of the incomeearned on investment of the cash collateral received for the loan of securities.
The Fund employs an agent to implement its securities lending program and the agent receives a fee from the Fund for its services.In addition, the Fund may be required to pay a rebate to the borrower. Accordingly, the Fund’s compensation for lending itssecurities is reduced by any such fees or rebate paid to the securities lending agent or borrower, respectively. For the year endedSeptember 30, 2013, the Fund earned securities lending net income as follows:
SecuritiesLending Gross
Income
SecuritiesLending Feesand Expenses
SecuritiesLending Net
Income
$28,283 $5,655 $22,628
23

Notes to Consolidated Financial Statements (Continued)
Accounting for Investment Transactions
Investment transactions are accounted for on the trade date. Realized gains and losses on sales of investments and unrealizedappreciation and depreciation of investments are computed by the specific identification cost method. Proceeds received fromlitigation, if any, are included in realized gains on investment transactions for any investments that are no longer held in theportfolio and as a reduction in cost for investments that continue to be held in the portfolio. Interest income, adjusted foramortization of discounts and premiums on debt securities, is earned from the settlement date and is recorded on the accrual basis.Dividend income and distributions are recorded on the ex-dividend date. Withholding taxes on foreign interest, dividends, andcapital gains have been provided for in accordance with the applicable country’s tax rules and rates. Foreign dividend income isrecorded on the ex-dividend date or as soon as practicable after the Fund determines the existence of a dividend declaration afterexercising reasonable due diligence. Distributions received on securities that represent a return of capital or capital gain arerecorded as a reduction of cost of investments and/or as a realized gain. The Fund estimates the components of distributionsreceived that may be considered return of capital distributions or capital gain distributions.
Foreign Currency Translation
The books and records of the Fund are maintained in U.S. dollars. The market values of foreign currencies, foreign securities, andother assets and liabilities denominated in foreign currencies are translated into U.S. dollars at the mean of the buying and selling ratesof such currencies against the U.S. dollar at the end of each business day. Purchases and sales of foreign securities and income andexpense items are translated at the rates of exchange prevailing on the respective dates of such transactions. The Fund does not isolatethat portion of the results of operations arising from changes in the exchange rates from that portion arising from changes in themarket prices of securities. Net realized foreign currency gains and losses resulting from changes in exchange rates include foreigncurrency gains and losses between trade date and settlement date on investment securities transactions, foreign currency transactions,and the difference between the amounts of dividends or interest recorded on the books of the Fund and the amount actually received.
Allocation of Operating Activity
In maintaining the records of the Fund, the income and expense accounts are allocated to each class of shares. Investment incomeand loss, and unrealized and realized gains or losses are prorated among the classes of shares based on the relative net assets ofeach. Expenses are allocated to each class of shares depending on the nature of the expenditures. Administration and service fees, ifany, which are directly attributable to a class of shares, are charged to that class’s operations. Expenses of the Fund not directlyattributable to the operations of any one share class of the Fund are prorated among the Fund’s classes based on the relative netassets of each.
Foreign Securities
The Fund may invest in foreign securities. Foreign securities, including ADRs, are subject to additional risks compared tosecurities of U.S. issuers, including international trade, currency, political, regulatory, and diplomatic risks. In addition,fluctuations in currency exchange rates may adversely affect the values of foreign securities and the price of a Fund’s shares.Emerging markets securities are subject to greater risks than securities issued in developed foreign markets, including lessliquidity, greater price volatility, higher relative rates of inflation, greater political, economic, and social instability, greater custodyand operational risks, and greater volatility in currency exchange rates.
Federal Income Tax
It is the Fund’s intent to continue to comply with the provisions of subchapter M of the Internal Revenue Code of 1986, asamended (the “Code”), applicable to a regulated investment company. Under such provisions, the Fund would not be subject tofederal income taxes on its ordinary income and net realized capital gains to the extent they are distributed or deemed to have beendistributed to its shareholders. Therefore, the Fund has not made any provision for federal income tax.
The Subsidiary is classified as a controlled foreign corporation under the Code. Therefore, the Fund is required to increase itstaxable income by its share of the Subsidiary’s income. Net losses of the Subsidiary cannot be deducted by the Fund in the currentperiod nor carried forward to offset taxable income in future periods.
24

Notes to Consolidated Financial Statements (Continued)
Dividends and Distributions to Shareholders
Dividends from net investment income and distributions of any net realized capital gains of the Fund are declared and paidannually and at other times as may be required to satisfy tax or regulatory requirements. Distributions to shareholders are recordedon the ex-dividend date. Income and capital gain distributions are determined in accordance with income tax regulations, whichmay differ from generally accepted accounting principles. As a result, net investment income and net realized capital gains oninvestment transactions for a reporting period may differ significantly from distributions during such period.
3. Management Fee and Other Transactions
Investment Management Fee
Under an agreement between Massachusetts Mutual Life Insurance Company (“MassMutual”) and the Trust on behalf of the Fund,MassMutual is responsible for providing investment management services for the Fund. In return for these services, MassMutualreceives an advisory fee, based upon the Fund’s average daily net assets, at the annual rate of 0.80%.
MassMutual has also entered into an investment subadvisory agreement with Baring International Investment Ltd. (“Baring”), anindirect wholly-owned subsidiary of MassMutual Holdings (Bermuda) Ltd., itself an indirect wholly-owned subsidiary ofMassMutual Holding LLC. This agreement provides that Baring manage the investment and reinvestment of the assets of the Fund.Baring receives a subadvisory fee from MassMutual, based upon the Fund’s average daily net assets, at the annual rate of 0.60%.
The Fund’s subadvisory fee is paid by MassMutual out of the management fee previously disclosed above.
Baring provides investment management services to the Subsidiary pursuant to an investment advisory agreement. The Subsidiarypays an advisory fee to Baring based upon the Subsidiary’s average daily net assets. The rate of this fee is equal to the subadvisoryfee rate that MassMutual pays Baring in respect of the Fund. The amount of the fee payable by MassMutual to Baring in respect ofthe Fund for any period is reduced by the amount of the advisory fee payable by the Subsidiary to Baring for that period. Under theFund’s investment management agreement, the amount of the advisory fee payable by the Fund to MassMutual in respect of anyperiod is also reduced by the amount of the advisory fee payable by the Subsidiary to Baring in respect of that period. The amountof the reduction to the Fund’s advisory fee is reflected as a reduction of expenses on the Consolidated Statement of Operations.
Administration Fees
Under a separate administrative and shareholder services agreement between the Fund and MassMutual, MassMutual providescertain administrative and shareholder services and bears some class specific administrative expenses. In return for these services,MassMutual receives an administrative services fee, based upon the average daily net assets of the applicable class of shares of theFund, at the following annual rates:
Class Z Class S Class Y Class L Class A
0.0300% 0.1200% 0.2200% 0.3500% 0.3500%
The Subsidiary also pays certain other expenses, including administrative, custodian, and transfer agent fees. In respect of certain(but not all) of these fees, the Fund has entered into offsetting arrangements with its service providers which result in a reduction ofcertain of the Fund’s expenses with respect to those assets held by the Subsidiary. Certain of these reductions are reflected as areduction of expenses on the Consolidated Statement of Operations.
Distribution and Service Fees
MML Distributors, LLC (the “Distributor”) acts as distributor to the Fund. Pursuant to a 12b-1 Plan adopted by the Fund, Class Ashares of the Fund pay an annual fee of 0.25% of the average daily net asset value of Class A shares to: (i) the Distributor forservices provided and expenses incurred by it in connection with the distribution of Class A shares of the Fund; and/or
25
Notes to Consolidated Financial Statements (Continued)
(ii) MassMutual for services provided and expenses incurred by it for purposes of maintaining or providing personal services toClass A shareholders. The Servicing Fee may be spent by MassMutual on personal services rendered to Class A shareholders of theFund and/or maintenance of Class A shareholder accounts. The Distributor is a majority-owned subsidiary of MassMutual. Inaddition, OppenheimerFunds Distributor, Inc. (the “Sub-Distributor”) acts as a sub-distributor to the Fund. The Sub-Distributor isan affiliate of the Distributor and an indirect majority-owned subsidiary of MassMutual.
Expense Caps and Waivers
MassMutual agreed to cap the fees and expenses of the Fund (other than extraordinary litigation and legal expenses, short saledividend and loan expense, interest expense, Acquired Fund fees and expenses#, or other non-recurring or unusual expenses suchas, for example, organizational expenses and shareholder meeting expenses) based upon the average daily net assets of theapplicable class of shares of the Fund, as follows:
Class Z* Class S* Class Y* Class L* Class A**
1.02% 1.11% 1.21% 1.34% 1.50%
# Acquired Fund fees and expenses are expenses borne indirectly by the Fund through investments in other pooled investmentvehicles.
* Expense caps in effect through May 31, 2014.** Expense cap in effect from June 1, 2013 through May 31, 2014. Prior to June 1, 2013, the expense cap was 1.59%.
Expense caps and waiver amounts are reflected as a reduction of expenses on the Consolidated Statement of Operations.
Deferred Compensation
Trustees of the Fund who are not employees of MassMutual or its subsidiaries may elect to defer receipt of their annual fees inaccordance with terms of a Non-Qualified Deferred Compensation Plan. Amounts deferred shall accrue interest or earnings andshall be recorded on the Fund’s books as other liabilities. Deferred compensation is included within Trustees’ fees and expenses inthe Consolidated Statement of Assets and Liabilities.
Other
Certain officers and trustees of the Fund are also employees of MassMutual. The compensation of each trustee who is not anemployee of MassMutual is borne by the Fund.
The beneficial ownership of Fund’s shares by affiliated parties at September 30, 2013 was 66.5%.
4. Purchases and Sales of Investments
Cost of purchases and proceeds from sales of investment securities (excluding short-term investments) for the year endedSeptember 30, 2013, were as follows:
Purchases SalesLong-Term U.S.
GovernmentSecurities
OtherLong-TermSecurities
Long-Term U.S.Government
Securities
OtherLong-TermSecurities
$1,211,334 $27,324,737 $915,264 $20,536,965
26

Notes to Consolidated Financial Statements (Continued)
5. Capital Share Transactions
Changes in shares outstanding for the Fund were as follows:
Year EndedSeptember 30, 2013
Period EndedSeptember 30, 2012*
Shares Amount Shares Amount
Class ZSold 691,261 $7,504,200 350,010 $3,500,100Issued as reinvestment of dividends 7,473 78,461 - -Redeemed (32,298) (349,000) - -
Net increase (decrease) 666,436 $7,233,661 350,010 $3,500,100
Class SSold - $ - 350,010 $3,500,100Issued as reinvestment of dividends 6,151 64,581 1,318 13,115Redeemed - - - -
Net increase (decrease) 6,151 $ 64,581 351,328 $3,513,215
Class YSold 52,319 $ 560,000 319,991 $3,290,100Issued as reinvestment of dividends 5,690 59,634 367 3,653Redeemed (8,049) (88,459) - -
Net increase (decrease) 49,960 $ 531,175 320,358 $3,293,753
Class LSold 2,039 $ 22,000 148,821 $1,500,400Issued as reinvestment of dividends 2,352 24,681 355 3,531Redeemed (7,483) (81,610) - -
Net increase (decrease) (3,092) $ (34,929) 149,176 $1,503,931
Class ASold 625 $ 6,645 103,939 $1,041,549Issued as reinvestment of dividends 1,358 14,251 331 3,295Redeemed (4,612) (49,217) - -
Net increase (decrease) (2,629) $ (28,321) 104,270 $1,044,844
* For the period November 28, 2011 (commencement of operations) through September 30, 2012.
Purchases of Class A shares are subject to a front-end sales charge of up to 5.75% of the amount purchased. A portion of the front-end sales charge may be retained by the Distributor. For the year ended September 30, 2013, no material amounts have beenretained by the Distributor.
Redemptions or exchanges of Class A shares made within eighteen months of purchase from initial investments of $1 million ormore are subject to a contingent deferred sales charge of 1% of the amount redeemed. The Distributor receives all contingentdeferred sales charges. There were no contingent deferred sales charges imposed during the year ended September 30, 2013.
27
Notes to Consolidated Financial Statements (Continued)
6. Federal Income Tax Information
At September 30, 2013, the cost of securities and the unrealized appreciation (depreciation) in the value of investments owned bythe Fund, as computed on a federal income tax basis, were as follows:
Federal IncomeTax Cost
Tax BasisUnrealized
Appreciation
Tax BasisUnrealized
(Depreciation)
Net UnrealizedAppreciation
(Depreciation)
$22,277,308 $1,319,476 $(330,663) $988,813
Net capital loss carryforwards may be applied against any net realized taxable gains in succeeding years, subject to thecarryforward period limitations, where applicable. On December 22, 2010, the Regulated Investment Company Modernization Actof 2010 (the “Modernization Act”) was signed by the President. The Modernization Act changed the capital loss carryforward rulesas they relate to regulated investment companies. Capital losses generated in tax years beginning after the date of enactment maynow be carried forward indefinitely, and retain the character of the original loss. Under pre-enactment law, capital losses could becarried forward for up to eight tax years as short-term capital losses. The provisions affecting the utilization of capital losscarryforwards under the Modernization Act also require the utilization of post-enactment losses prior to the utilization of pre-enactment losses.
Accounting principles generally accepted in the United States of America require that only distributions in excess of tax basisearnings and profits be reported in the consolidated financial statements as a return of capital.
The tax character of distributions (including capital gain dividends, if any, designated pursuant to Section 852 of the Code) paid duringthe year ended September 30, 2013, was as follows:
OrdinaryIncome
Long TermCapital Gain
Return ofCapital
$313,188 $ - $ -
The tax character of distributions (including capital gain dividends, if any, designated pursuant to Section 852 of the Code) paid duringthe period ended September 30, 2012, was as follows:
OrdinaryIncome
Long TermCapital Gain
Return ofCapital
$37,005 $ - $ -
Capital accounts within consolidated financial statements are periodically adjusted for permanent differences between book and taxaccounting. These adjustments have no impact on net assets or the results of operations. Temporary book and tax accountingdifferences will reverse in subsequent periods. At September 30, 2013, temporary book and tax accounting differences wereprimarily attributable to investments in forward contracts, premium amortization accruals, the deferral of wash sale losses, anddeferred Trustee compensation.
At September 30, 2013, the components of distributable earnings on a tax basis were as follows:
UndistributedOrdinaryIncome
UndistributedLong Term
Capital Gain(Capital LossCarryover)
OtherTemporaryDifferences
UnrealizedAppreciation
(Depreciation)
$687,768 $310,574 $(737) $989,368
28

Notes to Consolidated Financial Statements (Continued)
During the year ended September 30, 2013, the following amounts were reclassified due to permanent differences between bookand tax accounting:
Paid-in Capital
AccumulatedNet Realized
Gain (Loss) onInvestments
UndistributedNet InvestmentIncome (Loss)
$(162,657) $(65,177) $227,834
The Fund did not have any unrecognized tax benefits at September 30, 2013, nor were there any increases or decreases inunrecognized tax benefits for the year then ended. The Fund recognizes interest and penalties, if any, related to unrecognized taxbenefits as an income tax expense in the Consolidated Statement of Operations. During the year ended September 30, 2013, theFund did not incur any such interest or penalties. The Fund is subject to examination by U.S. federal and state tax authorities for itsreturns filed to date. Foreign taxes are provided for based on the Fund’s understanding of the tax rules and rates that exist in theforeign markets in which it invests.
7. Indemnifications
Under the Fund’s organizational documents, current and former Trustees and Officers are provided with specified rights toindemnification against liabilities arising in connection with the performance of their duties to the Fund, and shareholders areindemnified against personal liability for obligations of the Fund. In the normal course of business, the Fund may also enter intocontracts that provide general indemnifications. The Fund’s maximum exposure under these arrangements is unknown as this wouldbe dependent on future claims that may be made against the Fund. The risk of material loss from such claims is considered remote.
8. New Accounting Pronouncements
On December 16, 2011, the Financial Accounting Standards Board (“FASB”) issued Accounting Standards Update No. 2011-11,“Disclosures about Offsetting Assets and Liabilities” (“ASU 2011-11”), as clarified with ASU 2013-01 “Clarifying the Scope ofDisclosures about Offsetting Assets and Liabilities” issued in January 2013. ASU 2011-11 amends FASB Accounting StandardsCodification Topic 210, specifically requiring an entity to disclose information about offsetting and related arrangements and theeffect those arrangements have on the financial position. ASU 2011-11 is effective in annual reporting periods beginning on orafter January 1, 2013, and for interim periods within those annual reporting periods. Management is currently evaluating theimplications of these changes and their impact on the financial statements.
On June 7, 2013, The Financial Accounting Standards Board (“FASB”) issued Accounting Standards Update No. 2013-08,Financial Services — Investment Companies (Topic 946): “Amendments to the Scope, Measurement, and DisclosureRequirements” (“ASU 2013-08”). ASU 2013-08 sets forth a new approach for determining whether a public or private company isan investment company and sets certain measurement and disclosure requirements for an investment company. ASU 2013-08 iseffective in annual reporting periods beginning on or after December 15, 2013, and for interim periods within those annualreporting periods. Management is currently evaluating the implications of these changes and their impact on the financialstatements.
9. Subsequent Events
In preparation of these consolidated financial statements management has evaluated the events and transactions subsequent toSeptember 30, 2013, through the date when the consolidated financial statements were issued, and determined that there are nomaterial events or transactions that would require adjustments to or disclosures in the Fund’s consolidated financial statements.
29
Report of Independent Registered Public Accounting Firm
To the Board of Trustees of MassMutual Premier Funds and Shareholders of the MassMutualBarings Dynamic Allocation Fund:
We have audited the accompanying consolidated statement of assets and liabilities, including the consolidated portfolio ofinvestments, of MassMutual Barings Dynamic Allocation Fund and subsidiary (the “Fund”) as of September 30, 2013, and therelated consolidated statement of operations for the year then ended, the consolidated statements of changes in net assets for theyear then ended and for the period November 28, 2011 (commencement of operations) through September 30, 2012, and theconsolidated financial highlights for each of the periods presented. These financial statements and financial highlights are theresponsibility of the Fund’s management. Our responsibility is to express an opinion on these financial statements and financialhighlights based on our audits.
We conducted our audits in accordance with the standards of the Public Company Accounting Oversight Board (United States).Those standards require that we plan and perform the audit to obtain reasonable assurance about whether the financial statementsand financial highlights are free of material misstatement. The Fund is not required to have, nor were we engaged to perform, anaudit of its internal control over financial reporting. Our audits included consideration of internal control over financial reporting asa basis for designing audit procedures that are appropriate in the circumstances, but not for the purpose of expressing an opinion onthe effectiveness of the Fund’s internal control over financial reporting. Accordingly, we express no such opinion. An audit alsoincludes examining, on a test basis, evidence supporting the amounts and disclosures in the financial statements, assessing theaccounting principles used and significant estimates made by management, as well as evaluating the overall financial statementpresentation. Our procedures included confirmation of securities owned as of September 30, 2013, by correspondence with thecustodian and brokers; where replies were not received from brokers, we performed other auditing procedures. We believe that ouraudits provide a reasonable basis for our opinion.
In our opinion, the consolidated financial statements and consolidated financial highlights referred to above present fairly, in allmaterial respects, the financial position of the MassMutual Barings Dynamic Allocation Fund and subsidiary as of September 30,2013, the results of their operations for the year then ended, the changes in their net assets for the year then ended and for theperiod November 28, 2011 (commencement of operations) through September 30, 2012, and the financial highlights for each of theperiods presented, in conformity with accounting principles generally accepted in the United States of America.
Deloitte & Touche LLPBoston, MassachusettsNovember 25, 2013
30
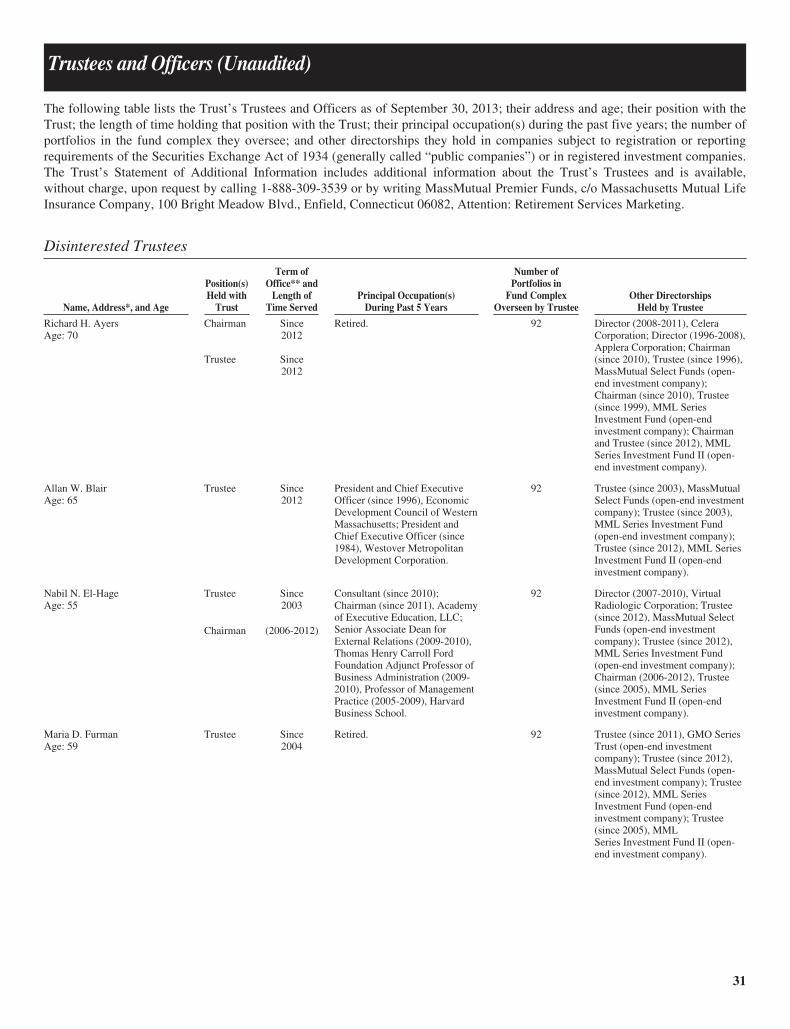
Trustees and Officers (Unaudited)
The following table lists the Trust’s Trustees and Officers as of September 30, 2013; their address and age; their position with theTrust; the length of time holding that position with the Trust; their principal occupation(s) during the past five years; the number ofportfolios in the fund complex they oversee; and other directorships they hold in companies subject to registration or reportingrequirements of the Securities Exchange Act of 1934 (generally called “public companies”) or in registered investment companies.The Trust’s Statement of Additional Information includes additional information about the Trust’s Trustees and is available,without charge, upon request by calling 1-888-309-3539 or by writing MassMutual Premier Funds, c/o Massachusetts Mutual LifeInsurance Company, 100 Bright Meadow Blvd., Enfield, Connecticut 06082, Attention: Retirement Services Marketing.
Disinterested Trustees
Name, Address*, and Age
Position(s)Held with
Trust
Term ofOffice** and
Length ofTime Served
Principal Occupation(s)During Past 5 Years
Number ofPortfolios in
Fund ComplexOverseen by Trustee
Other DirectorshipsHeld by Trustee
Richard H. AyersAge: 70
Chairman
Trustee
Since2012
Since2012
Retired. 92 Director (2008-2011), CeleraCorporation; Director (1996-2008),Applera Corporation; Chairman(since 2010), Trustee (since 1996),MassMutual Select Funds (open-end investment company);Chairman (since 2010), Trustee(since 1999), MML SeriesInvestment Fund (open-endinvestment company); Chairmanand Trustee (since 2012), MMLSeries Investment Fund II (open-end investment company).
Allan W. BlairAge: 65
Trustee Since2012
President and Chief ExecutiveOfficer (since 1996), EconomicDevelopment Council of WesternMassachusetts; President andChief Executive Officer (since1984), Westover MetropolitanDevelopment Corporation.
92 Trustee (since 2003), MassMutualSelect Funds (open-end investmentcompany); Trustee (since 2003),MML Series Investment Fund(open-end investment company);Trustee (since 2012), MML SeriesInvestment Fund II (open-endinvestment company).
Nabil N. El-HageAge: 55
Trustee
Chairman
Since2003
(2006-2012)
Consultant (since 2010);Chairman (since 2011), Academyof Executive Education, LLC;Senior Associate Dean forExternal Relations (2009-2010),Thomas Henry Carroll FordFoundation Adjunct Professor ofBusiness Administration (2009-2010), Professor of ManagementPractice (2005-2009), HarvardBusiness School.
92 Director (2007-2010), VirtualRadiologic Corporation; Trustee(since 2012), MassMutual SelectFunds (open-end investmentcompany); Trustee (since 2012),MML Series Investment Fund(open-end investment company);Chairman (2006-2012), Trustee(since 2005), MML SeriesInvestment Fund II (open-endinvestment company).
Maria D. FurmanAge: 59
Trustee Since2004
Retired. 92 Trustee (since 2011), GMO SeriesTrust (open-end investmentcompany); Trustee (since 2012),MassMutual Select Funds (open-end investment company); Trustee(since 2012), MML SeriesInvestment Fund (open-endinvestment company); Trustee(since 2005), MMLSeries Investment Fund II (open-end investment company).
31
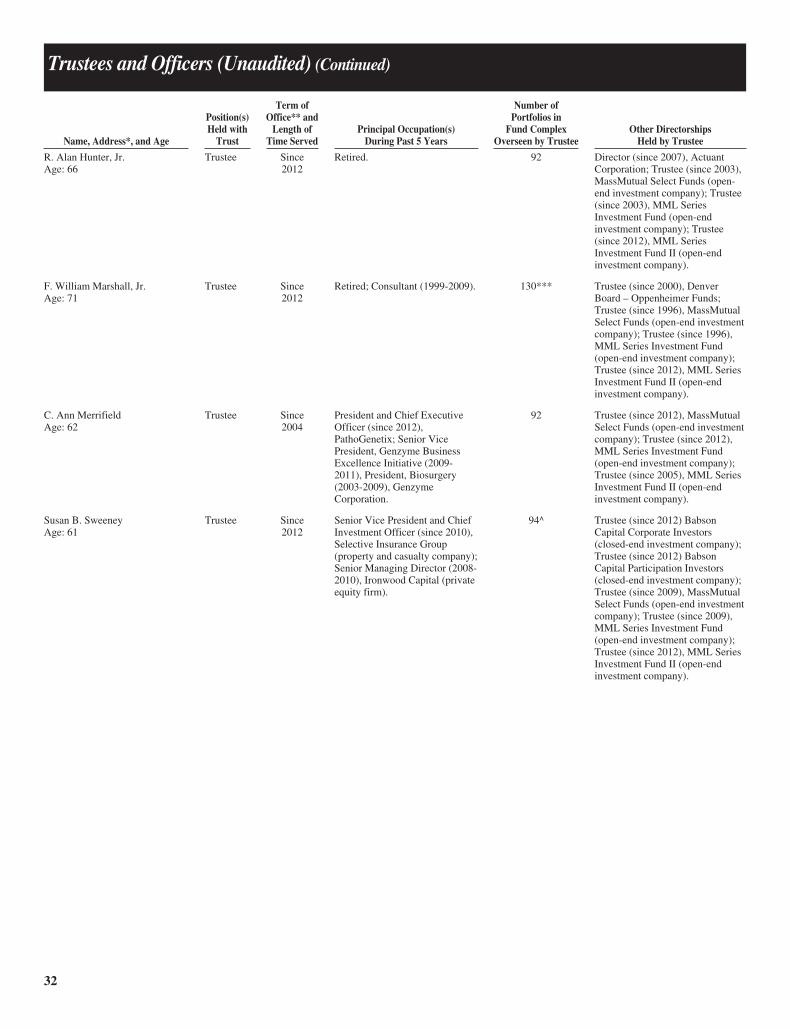
Trustees and Officers (Unaudited) (Continued)
Name, Address*, and Age
Position(s)Held with
Trust
Term ofOffice** and
Length ofTime Served
Principal Occupation(s)During Past 5 Years
Number ofPortfolios in
Fund ComplexOverseen by Trustee
Other DirectorshipsHeld by Trustee
R. Alan Hunter, Jr.Age: 66
Trustee Since2012
Retired. 92 Director (since 2007), ActuantCorporation; Trustee (since 2003),MassMutual Select Funds (open-end investment company); Trustee(since 2003), MML SeriesInvestment Fund (open-endinvestment company); Trustee(since 2012), MML SeriesInvestment Fund II (open-endinvestment company).
F. William Marshall, Jr.Age: 71
Trustee Since2012
Retired; Consultant (1999-2009). 130*** Trustee (since 2000), DenverBoard – Oppenheimer Funds;Trustee (since 1996), MassMutualSelect Funds (open-end investmentcompany); Trustee (since 1996),MML Series Investment Fund(open-end investment company);Trustee (since 2012), MML SeriesInvestment Fund II (open-endinvestment company).
C. Ann MerrifieldAge: 62
Trustee Since2004
President and Chief ExecutiveOfficer (since 2012),PathoGenetix; Senior VicePresident, Genzyme BusinessExcellence Initiative (2009-2011), President, Biosurgery(2003-2009), GenzymeCorporation.
92 Trustee (since 2012), MassMutualSelect Funds (open-end investmentcompany); Trustee (since 2012),MML Series Investment Fund(open-end investment company);Trustee (since 2005), MML SeriesInvestment Fund II (open-endinvestment company).
Susan B. SweeneyAge: 61
Trustee Since2012
Senior Vice President and ChiefInvestment Officer (since 2010),Selective Insurance Group(property and casualty company);Senior Managing Director (2008-2010), Ironwood Capital (privateequity firm).
94^ Trustee (since 2012) BabsonCapital Corporate Investors(closed-end investment company);Trustee (since 2012) BabsonCapital Participation Investors(closed-end investment company);Trustee (since 2009), MassMutualSelect Funds (open-end investmentcompany); Trustee (since 2009),MML Series Investment Fund(open-end investment company);Trustee (since 2012), MML SeriesInvestment Fund II (open-endinvestment company).
32

Trustees and Officers (Unaudited) (Continued)
Interested Trustees
Name, Address*, and Age
Position(s)Held with
Trust
Term ofOffice** and
Length ofTime Served
Principal Occupation(s)During Past 5 Years
Number ofPortfolios in
Fund ComplexOverseen by Trustee
Other DirectorshipsHeld by Trustee
Robert E. Joyal^^Age: 68
Trustee Since2012
Retired 94^ Director (since 2013), LeucadiaNational Corporation (holdingcompany); Director (since 2012),Ormat Technologies, Inc.; Director(since 2006), Jefferies Group, Inc.(investment bank); Director (2007-2011), Scottish Re Group Ltd.;Director (2003-2010), AlabamaAircraft Industries, Inc.; Trustee(since 2003), Babson CapitalCorporate Investors (closed-endinvestment company); Trustee(since 2003), Babson CapitalParticipation Investors (closed-endinvestment company); Trustee(since 2003), MassMutual SelectFunds (open-end investmentcompany); Trustee (since 2003),MML Series Investment Fund(open-end investment company);Trustee (since 2012), MML SeriesInvestment Fund II (open-endinvestment company).
Elaine A. Sarsynski^^^Age: 58
Trustee
ViceChairperson
Since2011
(2011-2012)
Executive Vice President (since2008), MassMutual RetirementServices Division, MassMutual;Chairman, President and CEO(since 2012), MassMutualInternational, LLC.
92 Director (since 2012), HorizonTechnology Finance ManagementLLC; Trustee (since 2008),MassMutual Select Funds(open-end investment company);Trustee (since 2008), MML SeriesInvestment Fund (open-endinvestment company); ViceChairperson (2011-2012), Trustee(since 2011), MML SeriesInvestment Fund II (open-endinvestment company).
Principal Officers who are Not Trustees
Name, Address*, and AgePosition(s) Held
with Trust
Term ofOffice# andLength of
Time Served Principal Occupation(s) During Past 5 Years
Number ofPortfolios in
Fund ComplexOverseen by Officer
Michael C. EldredgeAge: 49
Vice President Since2009
Vice President (since 2008), MassMutual; Vice President (2005-2008),ING; Vice President (since 2009), MassMutual Select Funds (open-end investment company); Vice President (since 2009), MML SeriesInvestment Fund (open-end investment company); Vice President(since 2009), MML Series Investment Fund II (open-end investmentcompany).
92
Andrew M. GoldbergAge: 47
Vice President,Secretary, andChief LegalOfficer
Assistant Clerk
Since2008
(2004-2008)
Assistant Vice President and Counsel (since 2004), MassMutual; VicePresident, Secretary, and Chief Legal Officer (since 2008), AssistantSecretary (2001-2008), MassMutual Select Funds (open-endinvestment company); Vice President, Secretary, and Chief LegalOfficer (since 2008), Assistant Secretary (2001-2008), MML SeriesInvestment Fund (open-end investment company); Vice President,Secretary, (formerly known as “Clerk”), and Chief Legal Officer(since 2008), Assistant Clerk (2005-2008), MML Series InvestmentFund II (open-end investment company).
92
33

Trustees and Officers (Unaudited) (Continued)
Name, Address*, and AgePosition(s) Held
with Trust
Term ofOffice# andLength of
Time Served Principal Occupation(s) During Past 5 Years
Number ofPortfolios in
Fund ComplexOverseen by Officer
Nicholas H. PalmerinoAge: 48
Chief FinancialOfficer andTreasurer
Since2006
Assistant Vice President (since 2006), MassMutual; Chief FinancialOfficer and Treasurer (since 2006), MassMutual Select Funds (open-end investment company); Chief Financial Officer and Treasurer(since 2006), MML Series Investment Fund (open-end investmentcompany); Chief Financial Officer and Treasurer (since 2006), MMLSeries Investment Fund II (open-end investment company).
92
Philip S. WellmanAge: 49
Vice Presidentand ChiefComplianceOfficer
Since2007
Vice President, Associate General Counsel, and Chief ComplianceOfficer (Mutual Funds and Investment Advisory) (since 2008), VicePresident, Associate General Counsel, and Chief Compliance Officer(Mutual Funds) (2007-2008), MassMutual; Vice President and ChiefCompliance Officer (since 2007), MassMutual Select Funds (open-endinvestment company); Vice President and Chief Compliance Officer(since 2007), MML Series Investment Fund (open-end investmentcompany); Vice President and Chief Compliance Officer (since 2007),MML Series Investment Fund II (open-end investment company).
92
Eric H. WietsmaAge: 47
President
Vice President
Since2008
(2006-2008)
Senior Vice President (since 2010), Corporate Vice President (2007-2010), MassMutual; President (since 2008), Vice President (2006-2008), MassMutual Select Funds (open-end investment company);Vice President (since 2006), MML Series Investment Fund (open-endinvestment company); Vice President (since 2006), MMLSeries Investment Fund II (open-end investment company).
92
* The address of each Trustee and Principal Officer is the same as that for the Trust; 100 Bright Meadow Blvd., Enfield, Connecticut 06082.
** Each Trustee of the Trust serves until the next meeting of shareholders called for the purpose of electing Trustees and until the election and qualification of hisor her successor or until he or she dies, resigns, or is removed. Notwithstanding the foregoing, a Trustee shall retire and cease to serve as a Trustee upon theconclusion of the calendar year in which such Trustee attains the age of seventy-two years.
The Chairperson is elected to hold such office for a term of three years or until their successor is elected and qualified to carry out the duties and responsibilitiesof their office, or until he or she retires, dies, resigns, is removed, or becomes disqualified.
*** Denver Board – Oppenheimer Funds is deemed to be part of the Fund Complex because it is managed by OppenheimerFunds, Inc., an indirect subsidiary ofMassMutual.
^ Babson Capital Participation Investors and Babson Capital Corporate Investors are deemed to be a part of the Fund Complex because they are managed byBabson Capital Management LLC, an indirect subsidiary of MassMutual.
^^ Mr. Joyal is an “Interested Person,” as that term is defined in the 1940 Act, through his position as a director of Jefferies Group, Inc., a broker-dealer that mayexecute portfolio transactions and/or engage in principal transactions with the Funds, other investment companies advised by MassMutual or holdingthemselves out to investors as related companies for purposes of investment or investor services, or any other advisory accounts over which MassMutual hasbrokerage placement discretion.
^^^ Ms. Sarsynski is an Interested Person through her employment with MassMutual.
# The President, Treasurer, and Secretary are elected to hold such office until their successor is elected and qualified to carry out the duties and responsibilities oftheir office, or until he or she dies, resigns, is removed, or becomes disqualified. Each other officer shall hold office at the pleasure of the Trustees.
34

Federal Tax Information (Unaudited)
Under Section 854(b)(2) of the Code, the Fund hereby designates $240,959 as qualified dividends for purposes of the maximumrate under Section 1(h)(11) of the Code for the year ended September 30, 2013.
35

Other Information (Unaudited)
Proxy Voting
A description of the policies and procedures that the Fund’s investment adviser and subadviser use to vote proxies relating to theFund’s portfolio securities is available, without charge, upon request, by calling 1-888-309-3539, and on the Securities andExchange Commission’s (“SEC”) website at http://www.sec.gov.
Information regarding how the Fund voted proxies relating to portfolio securities during the most recent 12-month period endedJune 30 is available, without charge, upon request, on the MassMutual website at http://www.massmutual.com/funds and on theSEC’s website at http://www.sec.gov.
Quarterly Reporting
The Fund files its complete schedule of portfolio holdings with the SEC for the first and third quarters of each fiscal year on FormN-Q. The Fund’s Forms N-Q are available on the SEC’s website at http://www.sec.gov and may be reviewed and copied at theSEC’s Public Reference Room in Washington D.C. Information on the operation of the SEC’s Public Reference Room may beobtained by calling 1-800-SEC-0330.
Trustees’ Approval of Investment Advisory Contracts
At their meetings in April and May 2013, the Contract Committee (the “Committee”) and the Trustees, including the Trustees whoare not “interested persons” (as such term is defined in the 1940 Act) of the Trust, MassMutual, or the subadviser (the“Independent Trustees”), re-approved the existing advisory and subadvisory agreement (collectively, the “Contracts”) for the Fund.In preparation for the meetings, the Trustees requested, and MassMutual and the subadviser provided in advance, certain materialsrelevant to the consideration of the Contracts (the “Meeting Materials”). In all of their deliberations, the Trustees were advised byindependent counsel.
The Committee received in advance of the meetings (i) a memorandum from MassMutual discussing the nature and quality of theservices it provides as investment manager to the Fund; (ii) a profitability analysis prepared by MassMutual; and (iii) a fee andperformance study report (the “Third-Party Report”) with respect to the Fund prepared by an independent third-party vendor (the“Third-Party”). The Third Party Report provided detailed comparative management fee, total expense, and performanceinformation for the Fund to assist the Committee in its evaluation of the Contracts. The Committee also considered informationpresented to it throughout the year regarding MassMutual and the subadviser.
The Committee considered the nature, scope, and quality of services MassMutual provides to the Fund, including: (i) the financialcondition, stability, and business strategy of MassMutual; (ii) the capabilities of MassMutual with respect to regulatory complianceand its ability to monitor compliance with the investment policies of the Fund; (iii) MassMutual’s ability to provide investmentoversight and administrative and shareholder services to the Fund; and (iv) the experience and qualifications of the personnel ofMassMutual that perform, or oversee the performance of, the services provided to the Fund and the needs of the Fund foradministrative and shareholder services.
The Committee then reviewed and considered the detailed information presented in the Third-Party Report regarding: (i) Fundexpenses, including, among other things, both the Fund’s advisory fee and total net expense ratio against peer funds; and (ii) theFund’s relative performance (over the one-year period against peer funds and a benchmark index). In connection with theCommittee’s review, MassMutual provided commentary and analysis regarding the Fund’s performance and expenses. TheCommittee also noted that it had received in the Meeting Materials or during the course of the past year: (i) detailed informationregarding MassMutual’s ability to provide investment oversight and administrative and shareholder services to the Fund; and (ii) awide range of information about the subadviser and its personnel with responsibility for providing services to the Fund and the feepayable to the subadviser by MassMutual. MassMutual reviewed with the Committee in detail the work MassMutual does in itsoversight, administrative, and shareholder servicing roles, the expertise it brings to these roles, the size of its teams, and thefinancial commitment it has made to providing those services. Throughout the discussion, MassMutual responded to Committeemembers’ questions and provided additional information concerning the Fund.
36
The Committee reviewed the expense and performance information for the Fund. (References to the one-year period below are tothe period ended December 31, 2012. The comparative expense information is that of the Fund’s “peer group” and the comparativeperformance information is that of the Fund’s “performance category.”)
The Committee considered that the Fund is only recently organized and has not achieved a size that might be conducive to a lowertotal net expense ratio. In the ensuing discussion, the Committee asked MassMutual to consider a reduction in the expenselimitation currently in place with respect to the total net expense ratio of Class A shares of the Fund in light of the Fund’s recentunderperformance (fourth quartile for the one-year period). MassMutual considered this request and agreed to reduce the expenselimitation with respect to the total next expense ratio of Class A shares of the Fund. With respect to the Fund’s investmentperformance, the Committee considered that the Fund was formed in November 2011, and so has a relatively short performancehistory. It considered MassMutual’s statement that funds in the Fund’s comparative universe have quite diverse allocations toequities versus bonds, and that the Fund has generally maintained a relatively conservative allocation to equities, which has hurtrelative performance in the recent strong equity markets, but which MassMutual considers to be consistent with the subadviser’sgeneral approach to management of this strategy. The Committee also considered MassMutual’s statements that, although the Fundinvests largely in exchange-traded funds, the management fees paid by the Fund are for the strategic and asset-allocation decisionsmade by the subadviser and are not redundant of fees paid by the ETFs in which the Fund invests.
In conjunction with its review of the Third-Party Report, the Committee also reviewed and considered information included in theMeeting Materials, or discussed at the meeting, concerning economies of scale and the profitability of MassMutual’s advisoryrelationship with the Fund, including: (i) a description of the revenue (including management fee and administrative andshareholder services fees, as applicable) and expense allocation methodology employed by MassMutual; and (ii) profitabilityinformation for the Fund. The discussions included consideration of the intangible benefits derived by MassMutual and itsaffiliates resulting from their relationships with the Fund and the so-called “fallout benefits” to MassMutual, such as anyreputational value derived from serving as investment adviser to the Fund, and benefits accruing to the subadviser due to so-called“soft-dollar arrangements.”
Prior to the votes being taken to approve the Contracts, the Committee met separately in executive session to discuss theappropriateness of such contracts. The Committee weighed the foregoing matters in light of the advice given to them by theirindependent legal counsel as to the law applicable to the review of investment advisory contracts. In arriving at a decision, theCommittee did not identify any single matter as all-important or controlling. The foregoing summary does not detail all of thematters considered.
The Committee concluded that: (i) overall, it was satisfied with the nature, extent, and quality of services provided, and expected tobe provided in the future, under the Contracts, including the level of MassMutual’s oversight of the Fund and the subadvisoryprocess; (ii) MassMutual’s level of profitability from its relationship with the Fund was not excessive and the advisory fee payableunder the Contract and the Fund’s total net expenses are fair and reasonable; (iii) the investment processes, research capabilities,and philosophies of the subadviser generally appear well suited to the Fund, given its investment objective and policies; (iv) therelative performance of the Fund (taking into account the applicable investment strategy and risk profile of the Fund) is sufficientto warrant continuation of the Contracts for the Fund; and (v) the terms of the Contracts were fair and reasonable with respect tothe Fund and were in the best interests of the Fund’s shareholders.
The Committee also considered the information presented and discussed regarding the existing advisory agreement forthe Subsidiary.
37
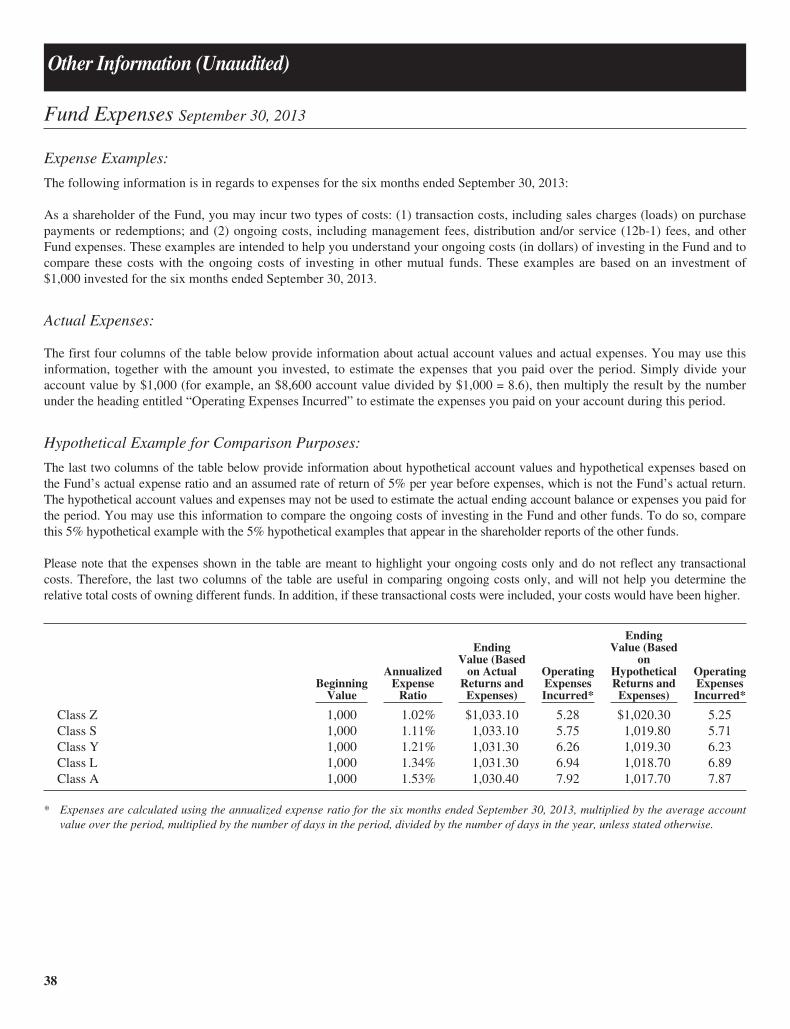
Other Information (Unaudited)
Fund Expenses September 30, 2013
Expense Examples:
The following information is in regards to expenses for the six months ended September 30, 2013:
As a shareholder of the Fund, you may incur two types of costs: (1) transaction costs, including sales charges (loads) on purchasepayments or redemptions; and (2) ongoing costs, including management fees, distribution and/or service (12b-1) fees, and otherFund expenses. These examples are intended to help you understand your ongoing costs (in dollars) of investing in the Fund and tocompare these costs with the ongoing costs of investing in other mutual funds. These examples are based on an investment of$1,000 invested for the six months ended September 30, 2013.
Actual Expenses:
The first four columns of the table below provide information about actual account values and actual expenses. You may use thisinformation, together with the amount you invested, to estimate the expenses that you paid over the period. Simply divide youraccount value by $1,000 (for example, an $8,600 account value divided by $1,000 = 8.6), then multiply the result by the numberunder the heading entitled “Operating Expenses Incurred” to estimate the expenses you paid on your account during this period.
Hypothetical Example for Comparison Purposes:
The last two columns of the table below provide information about hypothetical account values and hypothetical expenses based onthe Fund’s actual expense ratio and an assumed rate of return of 5% per year before expenses, which is not the Fund’s actual return.The hypothetical account values and expenses may not be used to estimate the actual ending account balance or expenses you paid forthe period. You may use this information to compare the ongoing costs of investing in the Fund and other funds. To do so, comparethis 5% hypothetical example with the 5% hypothetical examples that appear in the shareholder reports of the other funds.
Please note that the expenses shown in the table are meant to highlight your ongoing costs only and do not reflect any transactionalcosts. Therefore, the last two columns of the table are useful in comparing ongoing costs only, and will not help you determine therelative total costs of owning different funds. In addition, if these transactional costs were included, your costs would have been higher.
BeginningValue
AnnualizedExpense
Ratio
EndingValue (Based
on ActualReturns and
Expenses)
OperatingExpensesIncurred*
EndingValue (Based
onHypotheticalReturns and
Expenses)
OperatingExpensesIncurred*
Class Z 1,000 1.02% $1,033.10 5.28 $1,020.30 5.25Class S 1,000 1.11% 1,033.10 5.75 1,019.80 5.71Class Y 1,000 1.21% 1,031.30 6.26 1,019.30 6.23Class L 1,000 1.34% 1,031.30 6.94 1,018.70 6.89Class A 1,000 1.53% 1,030.40 7.92 1,017.70 7.87
* Expenses are calculated using the annualized expense ratio for the six months ended September 30, 2013, multiplied by the average accountvalue over the period, multiplied by the number of days in the period, divided by the number of days in the year, unless stated otherwise.
38


Distributor:MML Distributors, LLC1295 State StreetSpringfield, MA 01111-0001
November 29, 2013
©2013 Massachusetts Mutual Life Insurance Company, Springfield, MA. All rights reserved. www.massmutual.com. MassMutualFinancial Group is a marketing name for Massachusetts Mutual Life Insurance Company (MassMutual) [of which Retirement Services is adivision] and its affiliated companies and sales representatives.
L4544BAM 1113C:31114-00