Massive Mitochondrial Degeneration in Motor Neurons ... · Massive Mitochondrial Degeneration in...
10
Massive Mitochondrial Degeneration in Motor Neurons Triggers the Onset of Amyotrophic Lateral Sclerosis in Mice Expressing a Mutant SOD1 Jiming Kong 1 and Zuoshang Xu 2 Departments of 1 Pharmacology and Molecular Toxicology and 2 Cell Biology, University of Massachusetts Medical School, Worcester Foundation Campus, Shrewsbury, Massachusetts 01545 Amyotrophic lateral sclerosis (ALS) involves motor neuron de- generation, skeletal muscle atrophy, paralysis, and death. Mu- tations in Cu,Zn superoxide dismutase (SOD1) are one cause of the disease. Mice transgenic for mutated SOD1 develop symp- toms and pathology similar to those in human ALS. To under- stand the disease mechanism, we developed a simple behav- ioral assay for disease progression in mice. Using this assay, we defined four stages of the disease in mice expressing G93A mutant SOD1. By studying mice with defined disease stages, we tied several pathological features into a coherent sequence of events leading to motor neuron death. We show that onset of the disease involves a sharp decline of muscle strength and a transient explosive increase in vacuoles derived from degener- ating mitochondria, but little motor neuron death. Most motor neurons do not die until the terminal stage, ;9 weeks after disease onset. These results indicate that mutant SOD1 toxicity is mediated by damage to mitochondria in motor neurons, and this damage triggers the functional decline of motor neurons and the clinical onset of ALS. The absence of massive motor neuron death at the early stages of the disease indicates that the majority of motor neurons could be rescued after clinical diagnosis. Key words: ALS; mitochondria; SOD1; paralysis; motor neu- ron; degeneration; spinal cord Amyotrophic lateral sclerosis (ALS) involves motor neuron loss leading to progressive skeletal muscle atrophy and death (Mulder et al., 1986; Munsat, 1989). Despite a long history of clinical and pathological studies, the pathological progression for AL S has not been clearly defined. This is largely attributable to difficulties in correlating clinical symptoms and motor neuron loss in human patients. At least two possible models could explain the progres- sive nature of clinical symptoms. The first is that at the onset of muscle weakness the patient has already gone through an ex- tended period of gradual motor neuron death. The emergence of symptoms reflects an exhausted functional compensation by the remaining motor neurons. Therefore, a large fraction of motor neurons have already been lost, and the clinical course reflects the loss of the remaining motor neurons. The second possibility is that at the onset of muscle weakness (or clinical disease) there is little or no motor neuron death, but there is a decline of motor neuron function. As the degenerative process proceeds, motor neurons gradually die, eventually leading to paralysis and death of the patient. The distinction between these two models has important implications for prognosis and therapy. New animal models developed recently for ALS have made it possible to distinguish between these two models. ALS occurs in sporadic (SALS) and familial (FALS) forms (Mulder et al., 1986; Munsat, 1989). Mutations in the SOD1 gene are one genetic cause for FAL S (Rosen et al., 1993; Brown, 1995). Several mouse models that express the mutated genes develop motor neuron degeneration similar to that in humans (Gurney et al., 1994; Ripps et al., 1995; Wong et al., 1995; Bruijn et al., 1997). The initial characterization of these mouse lines has proven that a dominant gain of an “adverse property” by the mutated en- zymes causes motor neuron degeneration (for review, see Bruijn and Cleveland, 1996; Tu et al., 1997). In addition, these analyses confirmed numerous pathological features that have been ob- served in humans (Hirano, 1991; Chou, 1992), including axonal spheroids (Tu et al., 1996), increase of ubiquitin (Wong et al., 1995; Bruijn et al., 1997), Lewy body-like inclusions (Wong et al., 1995; Bruijn et al., 1997), fragmentation of Golgi apparatus (Mourelatos et al., 1996), and selective loss of motor neurons (Gurney et al., 1994; Ripps et al., 1995; Wong et al., 1995; Bruijn et al., 1997). The most prominent new feature is the large number of membrane-bound vacuoles in G93A and G37R lines (Dal Canto and Gurney, 1995; Wong et al., 1995). These vacuoles emerge before the end stage of the disease and appear to be derived from dilated mitochondria (Dal C anto and Gurney, 1995; Wong et al., 1995) and endoplasmic reticulum (Dal Canto and Gurney, 1995). In these early studies, pathological changes were correlated with the age of animals but not with disease stage. Because of the highly heterogeneous onset and duration of the disease in indi- vidual animals (see below), the subjects of study at any age were a mixture of individuals at different disease stages. Consequently, pathological changes seen in animals of the same age were not necessarily the ones that develop at the same disease stage. Similarly, pathological features that appear in younger animals do not necessarily precede those seen in older animals in disease progression. Transient changes, which correspond to specific dis- ease stages, are particularly difficult to recognize. In short, patho- logical studies without definition of the disease stage cannot Received Nov. 7, 1997; revised Feb. 12, 1998; accepted Feb. 18, 1998. This work is supported by grants from National Institutes of Health (RO1NS35750-01), the ALS Association, and the Markey Charitable Trust. We thank Vivian Tung for technical assistance and Alonzo Ross and Diane Casey for critically reading this manuscript. Correspondence should be addressed to Zuoshang Xu, Worcester Foundation, 222 Maple Avenue, Shrewsbury, MA 01545. Copyright © 1998 Society for Neuroscience 0270-6474/98/183241-10$05.00/0 The Journal of Neuroscience, May 1, 1998, 18(9):3241–3250
-
Upload
duongthien -
Category
Documents
-
view
215 -
download
0
Transcript of Massive Mitochondrial Degeneration in Motor Neurons ... · Massive Mitochondrial Degeneration in...

Massive Mitochondrial Degeneration in Motor Neurons Triggers theOnset of Amyotrophic Lateral Sclerosis in Mice Expressing aMutant SOD1
Jiming Kong1 and Zuoshang Xu2
Departments of 1Pharmacology and Molecular Toxicology and 2Cell Biology, University of Massachusetts Medical School,Worcester Foundation Campus, Shrewsbury, Massachusetts 01545
Amyotrophic lateral sclerosis (ALS) involves motor neuron de-generation, skeletal muscle atrophy, paralysis, and death. Mu-tations in Cu,Zn superoxide dismutase (SOD1) are one cause ofthe disease. Mice transgenic for mutated SOD1 develop symp-toms and pathology similar to those in human ALS. To under-stand the disease mechanism, we developed a simple behav-ioral assay for disease progression in mice. Using this assay, wedefined four stages of the disease in mice expressing G93Amutant SOD1. By studying mice with defined disease stages,we tied several pathological features into a coherent sequenceof events leading to motor neuron death. We show that onset ofthe disease involves a sharp decline of muscle strength and a
transient explosive increase in vacuoles derived from degener-ating mitochondria, but little motor neuron death. Most motorneurons do not die until the terminal stage, ;9 weeks afterdisease onset. These results indicate that mutant SOD1 toxicityis mediated by damage to mitochondria in motor neurons, andthis damage triggers the functional decline of motor neuronsand the clinical onset of ALS. The absence of massive motorneuron death at the early stages of the disease indicates thatthe majority of motor neurons could be rescued after clinicaldiagnosis.
Key words: ALS; mitochondria; SOD1; paralysis; motor neu-ron; degeneration; spinal cord
Amyotrophic lateral sclerosis (ALS) involves motor neuron lossleading to progressive skeletal muscle atrophy and death (Mulderet al., 1986; Munsat, 1989). Despite a long history of clinical andpathological studies, the pathological progression for ALS hasnot been clearly defined. This is largely attributable to difficultiesin correlating clinical symptoms and motor neuron loss in humanpatients. At least two possible models could explain the progres-sive nature of clinical symptoms. The first is that at the onset ofmuscle weakness the patient has already gone through an ex-tended period of gradual motor neuron death. The emergence ofsymptoms reflects an exhausted functional compensation by theremaining motor neurons. Therefore, a large fraction of motorneurons have already been lost, and the clinical course reflects theloss of the remaining motor neurons. The second possibility isthat at the onset of muscle weakness (or clinical disease) there islittle or no motor neuron death, but there is a decline of motorneuron function. As the degenerative process proceeds, motorneurons gradually die, eventually leading to paralysis and deathof the patient. The distinction between these two models hasimportant implications for prognosis and therapy. New animalmodels developed recently for ALS have made it possible todistinguish between these two models.
ALS occurs in sporadic (SALS) and familial (FALS) forms(Mulder et al., 1986; Munsat, 1989). Mutations in the SOD1 geneare one genetic cause for FALS (Rosen et al., 1993; Brown, 1995).
Several mouse models that express the mutated genes developmotor neuron degeneration similar to that in humans (Gurney etal., 1994; Ripps et al., 1995; Wong et al., 1995; Bruijn et al., 1997).The initial characterization of these mouse lines has proven thata dominant gain of an “adverse property” by the mutated en-zymes causes motor neuron degeneration (for review, see Bruijnand Cleveland, 1996; Tu et al., 1997). In addition, these analysesconfirmed numerous pathological features that have been ob-served in humans (Hirano, 1991; Chou, 1992), including axonalspheroids (Tu et al., 1996), increase of ubiquitin (Wong et al.,1995; Bruijn et al., 1997), Lewy body-like inclusions (Wong et al.,1995; Bruijn et al., 1997), fragmentation of Golgi apparatus(Mourelatos et al., 1996), and selective loss of motor neurons(Gurney et al., 1994; Ripps et al., 1995; Wong et al., 1995; Bruijnet al., 1997). The most prominent new feature is the large numberof membrane-bound vacuoles in G93A and G37R lines (DalCanto and Gurney, 1995; Wong et al., 1995). These vacuolesemerge before the end stage of the disease and appear to bederived from dilated mitochondria (Dal Canto and Gurney, 1995;Wong et al., 1995) and endoplasmic reticulum (Dal Canto andGurney, 1995).
In these early studies, pathological changes were correlatedwith the age of animals but not with disease stage. Because of thehighly heterogeneous onset and duration of the disease in indi-vidual animals (see below), the subjects of study at any age werea mixture of individuals at different disease stages. Consequently,pathological changes seen in animals of the same age were notnecessarily the ones that develop at the same disease stage.Similarly, pathological features that appear in younger animals donot necessarily precede those seen in older animals in diseaseprogression. Transient changes, which correspond to specific dis-ease stages, are particularly difficult to recognize. In short, patho-logical studies without definition of the disease stage cannot
Received Nov. 7, 1997; revised Feb. 12, 1998; accepted Feb. 18, 1998.This work is supported by grants from National Institutes of Health
(RO1NS35750-01), the ALS Association, and the Markey Charitable Trust. Wethank Vivian Tung for technical assistance and Alonzo Ross and Diane Casey forcritically reading this manuscript.
Correspondence should be addressed to Zuoshang Xu, Worcester Foundation,222 Maple Avenue, Shrewsbury, MA 01545.Copyright © 1998 Society for Neuroscience 0270-6474/98/183241-10$05.00/0
The Journal of Neuroscience, May 1, 1998, 18(9):3241–3250

delineate the sequence of events leading to motor neuron deathand thus do not use the full potential of these transgenic animalmodels.
To effectively study these models, we have conducted the firstexperiments to analyze pathological changes in the context ofclinical progression. We first developed a simple, objective assayto measure muscle strength in mice and used this assay to followthe clinical progression in a transgenic line that expresses theG93A SOD1 mutation (Gurney et al., 1994). We then quantita-tively measured several pathological features in the mice withdefined disease stages. We show that the disease progression goesthrough four stages, each with specific and time-dependent fea-tures. Of particular interest are the early stages in which mito-chondrial abnormalities are the most prominent feature and neu-ronal function declines sharply, whereas neuronal death isminimal. Thus, mitochondrial degeneration is an important earlyevent in triggering the decline of motor neuron function and,consequently, clinical disease. The minor motor neuron loss for asubstantial period after the onset of clinical disease offers aperiod of time after diagnosis to rescue the majority of motorneurons.
MATERIALS AND METHODSHuman SOD1 transgenic mice. Mice transgenic for the mutated humanSOD1 G93A (TgN[SOD1-G93A]1Gur) and wild-type human SOD1(TgN[SOD1]2Gur) were purchased from The Jackson Laboratory (BarHarbor, ME) and bred in the University of Massachusetts MedicalSchool animal facility. Both lines were originally made and characterizedby Gurney et al. (1994). The survival of the purchased lines was pro-longed in comparison with the original line because of a reduced numberof transgene copies (http:// lena.jax.org/resources/documents/imr/SODletter.html). The transgenic mice were identified using the PCRmethod described by Gurney et al. (1994).
Muscle strength test. The test was conducted using a device designed inthis laboratory. Mice were allowed to grab onto a vertical wire (2 mm indiameter) with a small loop at the lower end. A vertical wire allows miceto use both fore- and hindlimbs to grab onto the wire. Although in thefirst few tests some mice used forelimbs predominantly, they usuallylearned to use all four limbs after a few trials. This results in a significantimprovement during the first three trials, after which the performancesstabilize. Thus, both the fore- and hindlimbs contribute to the measuredmuscle strength in this assay.
The wire was maintained in a vertically oriented circular motion (thecircle radius was 10 cm) at 24 rpm. Early tests indicated that maintainingthe wire in motion gave much more consistent measurements than astationary wire. The time that the mouse was able to hang onto the wirewas recorded with a timer. Because most mice fell within 5 min, we cutoff testing at 300 sec to test more animals in a limited time period. Micewere usually tested once a week starting when they were 90 d old, andtesting continued until they could no longer hang onto the wire.
Morphological analysis. Animal fixation, tissue dissection, and micro-scopic analysis were performed as described previously (Xu et al., 1993).In brief, mice were anesthetized and perfused with a solution of 4%paraformaldehyde and 2.5% glutaraldehyde in 0.1 M phosphate buffer,pH 7.6. Tissues were kept in the same solution for further fixation. TheL4 and L5 spinal nerve roots and lumbar spinal cords (a 2 mm segmentcentered at the L5 root entry level) were dissected out and post-fixed with2% osmium tetroxide in 100 mM cacodylate buffer, pH 7.6. After dehy-dration in graded alcohol, the tissue blocks were embedded in Epon.Sections (1 mm) were stained with toluidine blue and examined with lightmicroscopy.
For quantification of ventral roots, complete microscopic pictures of L4and L5 ventral roots were taken from 1 mm transverse sections anddigitized using a Nikon LS-1000 scanner. The area and equivalent radiusof all axons in a ventral root larger than 1.5 mm in diameter weremeasured using MetaMorph software (Universal Imaging Corporation,West Chester, PA). Degenerating axons were counted directly underlight microscope.
To quantify motor neurons in spinal cord, serial transverse sections 8mm thick were cut from Epon-embedded L5 lumbar spinal cord. Every
fifth section (five sections total from each animal) was collected andstained with toluidine blue. All neurons with nuclei and located in thelateral motor column (as defined in Fig. 1) were drawn using a Nikondrawing tube. The drawings were scanned into computer using an HPflat-bed scanner. Several parameters, including the number and size ofmotor neurons and their nuclear size, were measured from these draw-ings using MetaMorph software.
To measure vacuoles, two ventral horns were photographed from a 1mm transverse section of the spinal cord. The picture frame contained anarea 280 3 433 mm in size and covered about three-quarters of theventral horn. These images were digitized using a Nikon LS-1000 scan-ner. Measurements were performed using MetaMorph image analysissoftware. Vacuoles were quantified using the threshold function. Non-vacuolar structures such as nuclei and large blood vessels were manuallyeliminated from the measurement. Capillary vessels were usually indis-tinguishable from the vacuoles under the light microscope and thereforewere included in the measurement. However, this background was esti-mated by making the same measurements in wild-type animals.
For electron microscopy, thin sections of ventral horn were cut fromthe Epon tissue blocks, stained with uranyl acetate and lead citrate, andvisualized using a Philips EM-400 transmission electron microscope.
RESULTSMouse ALS undergoes four functional declining stagesTo follow disease progression in G93A mice, we developed asimple and objective assay to measure muscle strength. In thisassay, the time that a mouse was able to hang onto a wire wasmeasured as an indication of muscle strength (see Materials andMethods). We first tested mice in different age groups, whichrevealed an age-dependent decline of hanging time for G93Amice, but not for wild-type mice (WT) and wild type humanSOD1 (WS) transgenic mice (Fig. 2A).
To determine how muscle weakness develops in individual
Figure 1. The definition of L5 lateral ventral horn where neuronal num-bers were quantified was derived as follows. Perpendicular to the midlineM, line N passing the central canal was drawn. Parallel to line N and acrosspoint B was line L. Point B was the first point on the contour of the ventralgray matter (tracing from the midline) at which the contour made a .180°turn. Connecting point C (the cross-point of line N and the contour of graymatter) and point D (at one-third the distance from point B to A), line Pwas drawn. All neurons within the area encompassed by line P and thecontour of ventral horn (hatched area) were drawn and measured.
3242 J. Neurosci., May 1, 1998, 18(9):3241–3250 Kong and Xu • Mitochondrial Degeneration Triggers Onset of ALS
animals, we tested G93A and wild-type animals once a weekbeginning at 90 d of age and continued the tests until the G93Amice could no longer hold onto the wire. The results revealedseveral interesting aspects of muscle strength change. First, boththe onset and the duration of muscle strength decline were highlyvariable among different individuals, ranging from age 113 to188 d for the former and 35 to 94 d for the latter (Fig. 2B, Table1). Second, the time course of muscle strength change apparentlywent through four different stages (Fig. 2C,D): a pre-muscleweakness stage (PMW), during which muscle strength was main-tained at the normal level; a rapid declining stage (RD), duringwhich the hanging time declined sharply (usually by .50% withina period of 2 weeks); a slow declining stage (SD), which followedthe RD stage and lasted for 4–11 weeks; and a paralysis stage(Para), during which paralysis of limbs began and the mousecould no longer hold onto the wire (Fig. 2C,D). The sharp declinein muscle strength during the RD stage suggests that there may bea synchronized pathological change at the onset of the disease.
Pathological progression in motor axons atdifferent stagesTo elucidate the sequence of events leading to motor neurondeath, and in particular to see whether there is a synchronizedloss of motor neurons at the onset of the disease, we examined themotor axons in ventral roots (Fig. 3). We found few pathological
Figure 2. Four stages of muscle strength change in G93A mice. The time that mice were capable of hanging onto a wire was measured as an indication ofmuscle strength. A, Age-dependent decline of muscle strength in G93A mice. Groups of mice at different ages were tested. The number of mice in each agegroup ranged from 3 to 20. G93A, Mutant SOD1 mice; WT, nontransgenic (wild-type) mice; WS, wild-type SOD1 transgenic mice. Error bars indicate SEM.B, Highly variable onset of muscle weakness among different G93A mice. Each trace represents measurements from one animal. For clarity, only measurementsaround the RD stage in 20 animals are shown. C, Synchronized plot of muscle strength decline in individual G93A mice. Zero week represents the time pointjust before the decline begins. For clarity, only 10 traces are shown. D, Average time course of muscle strength decline in G93A mice (n 5 12). PMW, Pre-muscleweakness stage; RD, rapid declining stage; SD, slow declining stage; Para., paralysis stage. Error bars represent SEM.
Table 1. ALS onset and duration in the G93A mice
Range Average 6 SD n
RD onseta 113–188 151 6 17 72Para onsetb 183–253 211 6 18 23Durationc 35–94 65 6 19 23
a The age (days) at which a sharp decline in hanging time was first detected.b The age (days) at which the mouse could no longer hold onto the wire.c The period between the last day that the mouse displayed a normal hanging timeand the first day that the mouse could no longer hold onto the wire.
Kong and Xu • Mitochondrial Degeneration Triggers Onset of ALS J. Neurosci., May 1, 1998, 18(9):3241–3250 3243

changes in the PMW stage (Fig. 3C) compared with the WT (Fig.3A) or WS (Fig. 3B) mice. Surprisingly, the sharp muscle strengthdecline during the RD stage was not correlated with a loss of alarge number of motor axons (Fig. 3D). Instead, for a long periodduring the SD stage (up to 50 d after the onset of RD), asignificant fraction of motor axons remained (Fig. 3E–G). It wasnot until the paralysis stage that the vast majority of motor axonsbecame degenerated (Fig. 3H).
To quantify the changes in motor axons, we measured the axonsize and number in the L4 and L5 ventral roots. As the diseasedeveloped, there was a progressive loss of large motor axons afterthe onset of muscle weakness (Fig. 4). Two features of this losshave emerged from this analysis. First, two processes, atrophyand degeneration, contributed to the loss of large axons duringthe early stages. This was particularly evident when the axonswere divided into two groups, one larger and the other smallerthan 4.5 mm in diameter. Beginning from the RD stage, there wasa significant loss of large motor axons (Fig. 5). Meanwhile, thenumber of small axons was increased up to 20 d after the onset ofmuscle weakness, before it reverted back to the original number(Fig. 5). These results indicate that large motor axons undergoatrophy before degeneration.
Second, taking into account the substantial fraction of atrophiclarge axons, the actual fraction of degenerated large axons duringthe SD phase was relatively low (Table 2). As long as paralysis
had not begun, even at 50 d after the onset of muscle weakness,the fraction of degenerated large axons was ,50% (Figs. 3–5,Table 2), which implies that more than half of the large motorneurons were still alive. The largest single loss of motor axonsoccurred at the paralysis stage (Fig. 5, Table 2), when the majorityof large motor neurons were lost permanently. These data indi-cate that the vast majority of motor neurons are still alive whenmuscle weakness develops, and the initial muscle weakness re-flects motor neuron dysfunction rather than loss (see below).Thus, there is a period of time to rescue motor neurons aftermuscle weakness begins.
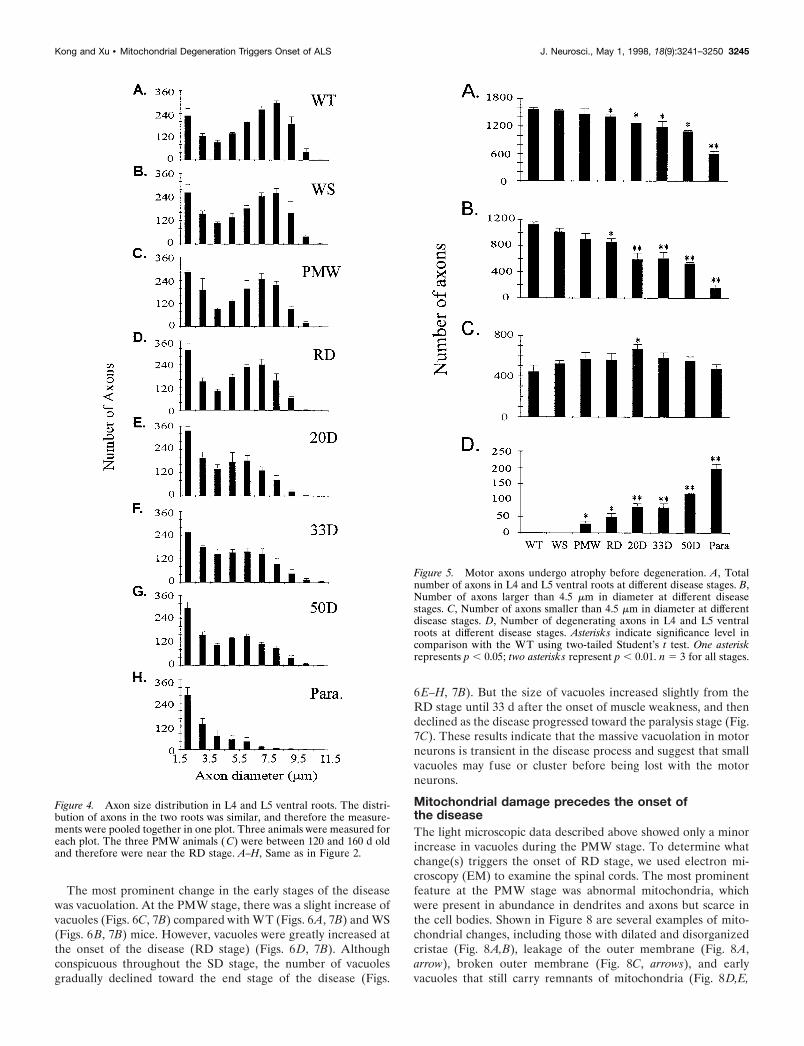
Pathological progression in ventral horn motorneurons at different stagesTo investigate the sequence of events in the vicinity of motorneuron cell bodies, we analyzed changes in the ventral horn spinalcord at different disease stages. Consistent with changes in motoraxons, there were considerable numbers of neurons remaining inthe ventral horn after muscle weakness began (Fig. 6D–G).Quantification of neuronal number and size in the lateral ventralhorn showed a selective loss of large neurons (Fig. 7A). However,this was not evident until 33 d after the onset of muscle weakness(Fig. 7A). At the paralysis stage, most of large motor neuronswere lost, whereas the number of small neurons was unaffected(Figs. 6H, 7A).
Figure 3. Axonal degeneration in L5 ventral roots at different stages of ALS in G93A mice. Plastic sections (1 mm) were stained with toluidine blue.A, WT; B, WS; (C–H), G93A at the following stages: (C) PMW, (D) RD, (E–G) 20, 33, and 50 d after the onset of RD, respectively; H, paralysis.
3244 J. Neurosci., May 1, 1998, 18(9):3241–3250 Kong and Xu • Mitochondrial Degeneration Triggers Onset of ALS
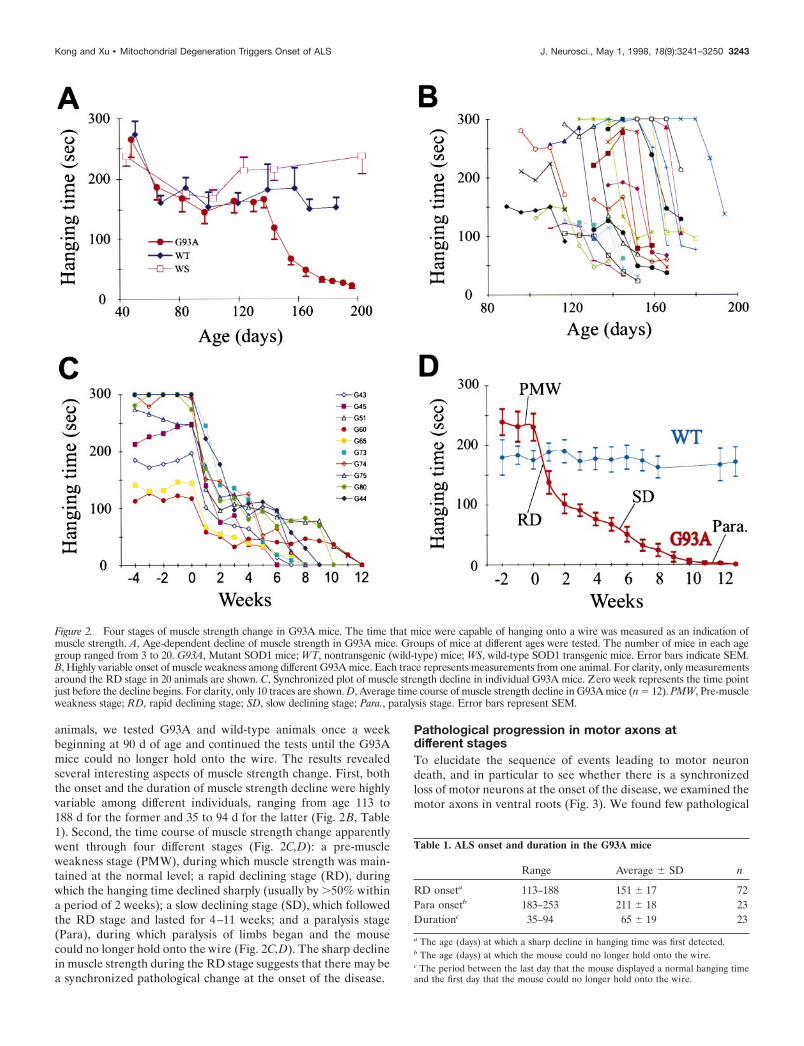
The most prominent change in the early stages of the diseasewas vacuolation. At the PMW stage, there was a slight increase ofvacuoles (Figs. 6C, 7B) compared with WT (Figs. 6A, 7B) and WS(Figs. 6B, 7B) mice. However, vacuoles were greatly increased atthe onset of the disease (RD stage) (Figs. 6D, 7B). Althoughconspicuous throughout the SD stage, the number of vacuolesgradually declined toward the end stage of the disease (Figs.
6E–H, 7B). But the size of vacuoles increased slightly from theRD stage until 33 d after the onset of muscle weakness, and thendeclined as the disease progressed toward the paralysis stage (Fig.7C). These results indicate that the massive vacuolation in motorneurons is transient in the disease process and suggest that smallvacuoles may fuse or cluster before being lost with the motorneurons.
Mitochondrial damage precedes the onset ofthe diseaseThe light microscopic data described above showed only a minorincrease in vacuoles during the PMW stage. To determine whatchange(s) triggers the onset of RD stage, we used electron mi-croscopy (EM) to examine the spinal cords. The most prominentfeature at the PMW stage was abnormal mitochondria, whichwere present in abundance in dendrites and axons but scarce inthe cell bodies. Shown in Figure 8 are several examples of mito-chondrial changes, including those with dilated and disorganizedcristae (Fig. 8A,B), leakage of the outer membrane (Fig. 8A,arrow), broken outer membrane (Fig. 8C, arrows), and earlyvacuoles that still carry remnants of mitochondria (Fig. 8D,E,
Figure 4. Axon size distribution in L4 and L5 ventral roots. The distri-bution of axons in the two roots was similar, and therefore the measure-ments were pooled together in one plot. Three animals were measured foreach plot. The three PMW animals ( C) were between 120 and 160 d oldand therefore were near the RD stage. A–H, Same as in Figure 2.
Figure 5. Motor axons undergo atrophy before degeneration. A, Totalnumber of axons in L4 and L5 ventral roots at different disease stages. B,Number of axons larger than 4.5 mm in diameter at different diseasestages. C, Number of axons smaller than 4.5 mm in diameter at differentdisease stages. D, Number of degenerating axons in L4 and L5 ventralroots at different disease stages. Asterisks indicate significance level incomparison with the WT using two-tailed Student’s t test. One asteriskrepresents p , 0.05; two asterisks represent p , 0.01. n 5 3 for all stages.
Kong and Xu • Mitochondrial Degeneration Triggers Onset of ALS J. Neurosci., May 1, 1998, 18(9):3241–3250 3245
Figure 6. Changes in ventral horn atdifferent disease stages. Plastic sections(1 mm) were stained with toluidine blue.A–H, Same as in Figure 2.
Table 2. Axon number changes (%) in L4 and L5 ventral roots
Stage PMW RD 20 d 33 d 50 d Para
Total axons 26.2 29.8 219.3 224.1 230.6 261.9Large axons 219.5 223.9 247.1 245.7 252.5 286.0Large 3 small 10.9 10.3 20.2 12.1 9.9 2.8Degenerated large axons 28.6 213.6 226.9 233.6 242.6 283.3
The percent reduction in total axon number and large axon number is calculated in reference to wild-type mice. The definition of large and small axons is described in thetext (also see Fig. 5). The fraction of large axons that become small (large3 small) is estimated by subtracting the small axon number in the wild-type mice from that of theG93A mice at different stages. The difference between the total lost large axons and the fraction of the large axons that become small (large3 small) is the fraction of largeaxons that are degenerated.
3246 J. Neurosci., May 1, 1998, 18(9):3241–3250 Kong and Xu • Mitochondrial Degeneration Triggers Onset of ALS

arrows). The abnormal mitochondria often appeared swollencompared with the normal ones in adjacent synaptic terminals(Fig. 8C, arrowheads). Densely accumulated neurofilaments canbe seen in axons in close proximity with vacuoles (Fig. 8D) andalso at many other proximal axon sites without vacuoles (data notshown), suggesting that slow axonal transport begins to fail beforethe onset of the RD stage. At the RD stage, abundant vacuoles indendrites as well as in axons were seen, some of which were nolonger carrying the remnants of mitochondria (Fig. 8F). Onlyrarely were vacuoles present in cell bodies.
DISCUSSIONPathological observations without correlation with disease stagesare largely a description of scattered phenomena and provide onlylimited information regarding the mechanism of disease progres-sion. Because of difficulties involved in studying human cases,particularly because of the near impossibility of obtaining patho-
logical specimens at the early stages of the disease, descriptions ofend-stage disease have dominated the study of ALS since theoriginal identification of the disease more than a century ago(Chou, 1992; Hirano, 1991). Transgenic mice expressing mutatedSOD1 have provided an unprecedented opportunity to study theearly stages of the disease. Indeed, several new pathologicalfeatures including mitochondrial vacuolation and early astroglio-sis were revealed (Dal Canto and Gurney, 1995; Wong et al.,1995; Morrison et al., 1996; Bruijn et al., 1997).
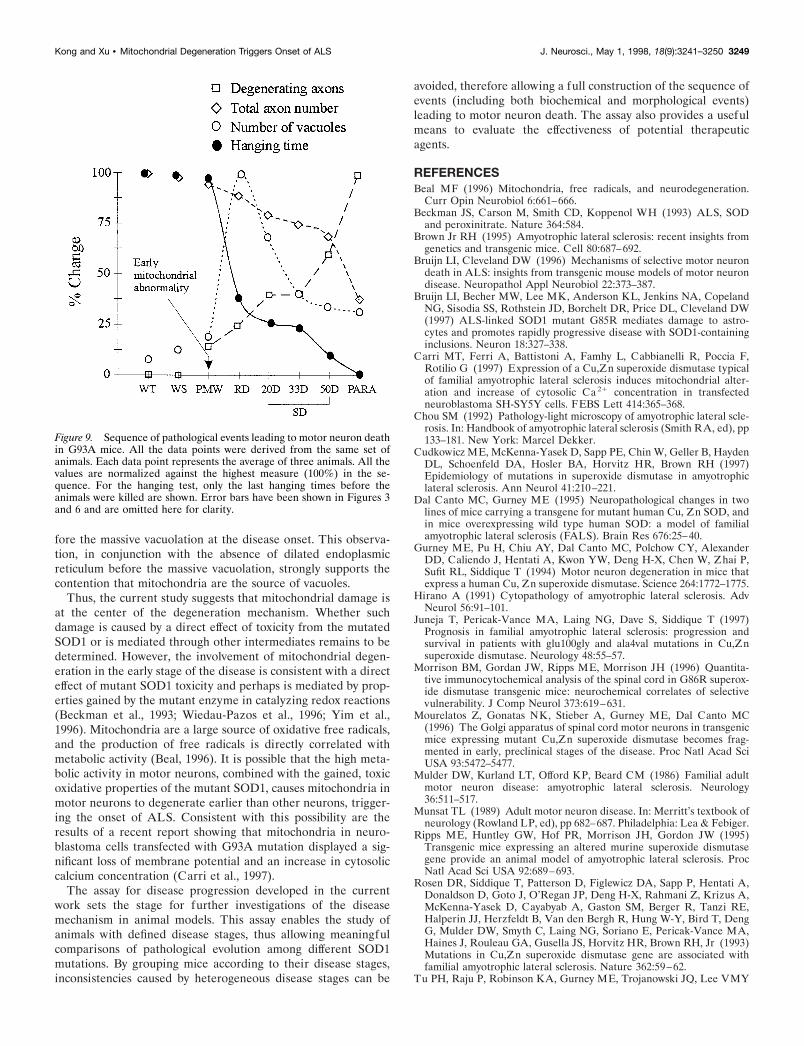
In all studies preceding the current work, pathological featureswere correlated with age of animals but not with stage of thedisease. As shown in Figure 1, the onset and duration of diseasein mice mirrors human disease (Cudkowicz et al., 1997; Juneja etal., 1997) and are highly heterogeneous. As a result, it was difficultto determine the sequence of events in the disease progressionand the significance of the pathological features that were ob-served. To solve this problem, we used a novel approach bydeveloping an assay to determine the disease stages and analyzingpathological changes in mice with defined disease stages. By thisapproach, a coherent picture of the functional and pathologicalprogression of ALS in the G93A mice begins to emerge (Fig. 9).
The progression of ALS in G93A mice can be divided into fourstages based on changes in muscle strength, and each of thesestages is correlated with specific pathological features. The PMWstage ( just before the RD stage) shows little difference from thewild type under the light microscope. However, abundant mito-chondrial abnormalities can be found by EM (Fig. 8). The onsetof muscle weakness (RD stage) correlates with a massive mito-chondrial vacuolation, signifying the beginning of a degenerativeprocess in motor neurons that compromises their function (Fig.9). The SD stage correlates with axonal atrophy and a gradual lossof motor neurons (Fig. 9). However, the majority of motor neuronsare alive until the very end stage of the disease (Fig. 9, Table 2).
Several implications can be drawn from these results. First,abundant mitochondrial abnormalities are the most prominentpathological feature before the onset of muscle strength decline.In addition, the onset of a sharp muscle strength decline iscorrelated with a massive mitochondrial vacuolation. This is thefirst demonstration that mitochondrial degeneration is associatedwith the onset of the disease and suggests that the “gainedtoxicity” of the mutant SOD1 damages mitochondria, triggeringthe decline of motor neuron function and the onset of clinicaldisease. Second, the vacuolation is a transient process. It corre-lates with the onset of muscle weakness but decreases toward theend stage of the disease. It has been pointed out that vacuoleswere not a noted feature in human ALS (Bruijn et al., 1997). Ourresults raise the possibility that vacuoles are also an integral partof human ALS, but they exist only at the very early stages of thedisease. Therefore, the lack of vacuoles in human ALS could beattributed to the fact that the pathological examination is per-formed on patients at the terminal stage of the disease.
Third, the initial muscle weakness signifies a stage in which thedegenerative process in large motor neurons begins to compro-mise their function. However, it does not represent a massive loss(or death) of these neurons. The loss of the majority of motorneurons does not occur until the paralysis stage, the end stage ofthe disease. The presence of the majority of motor axons duringthe RD and SD stages indicates that even after the muscleweakness begins, most motor neurons have not died and thuscould be rescued by effective therapeutic intervention. Fourth,axonal atrophy has been noted in human ALS patients (Chou,1992), but it was difficult to determine whether this decrease was
Figure 7. Changes in spinal cord at different disease stages. A, Changesin the number of neurons in the ventral horn. All numbers were averagesfrom two animals and were normalized to the average number of neuronsin each wild-type mouse (145 neurons). Filled bars, Total number ofneurons; open bars, number of neurons with diameters ,25 mm; shadedbars, number of neurons with diameters .25 mm. Note that the divisionof large and small neuronal groups at 25 mm diameter is arbitrary becausethere was not a clear division of large and small neuron peaks in the sizedistribution (data not shown). Changes in vacuole number (B) andvacuole size (C) at different disease stages. Two ventral horns weremeasured in each animal. The small number of vacuoles in the WT miceare capillary blood vessels that could not be distinguished from the realvacuoles under the light microscope. Asterisks indicate significance level incomparison with the WT, using two-tailed Student’s t test. One asteriskrepresents p , 0.05; two asterisks represent p , 0.01. n 5 3 for all stages.
Kong and Xu • Mitochondrial Degeneration Triggers Onset of ALS J. Neurosci., May 1, 1998, 18(9):3241–3250 3247

caused by the death of large axons or a shift of large axons tosmall ones. Our results show that large axons become atrophicbefore degeneration (Fig. 4, Table 2). This suggests that there isa failure in axonal transport at the early stage of ALS, which isconsistent with the proximal accumulation of neurofilaments ob-served during the PMW and RD stages in this study (Fig. 8), aswell as in another study at unspecified disease stages (Tu et al.,1996).
Previous studies have noted the presence of vacuoles. However,
the origin of the vacuoles has been controversial (Dal Canto andGurney, 1995; Wong et al., 1995). One study proposes that vacu-oles are derived from dilation of endoplasmic reticulum andmitochondria (Dal Canto and Gurney, 1995), whereas the otherstudy contends that vacuoles are derived from degenerating mi-tochondria (Wong et al., 1995). By determining the precise timeof the disease onset, the current study shows that abundantabnormal mitochondria, including those with dilated cristae andthe early vacuoles with mitochondrial remnants, are present be-
Figure 8. Mitochondrial abnormalities at PMW ( A–E) and RD ( F) stages. A, A swollen dendritic mitochondrion with dilated cristae (asterisk) andleaking outer membrane (arrow). B, Swollen dendritic mitochondria with dilated and disorganized cristae. A synaptic terminal on the dendrite containsnormal mitochondria (arrowhead). C, A proximal dendrite containing mitochondria with broken outer membranes (arrows). Adjacent synaptic terminalscontain normal mitochondria (arrowheads). D, Early vacuoles in a proximal axon. Arrows point to mitochondrial remnants. E, Early vacuoles in adendrite. Arrows point to mitochondrial remnants. F, Massive dendritic vacuolation at the RD stage.
3248 J. Neurosci., May 1, 1998, 18(9):3241–3250 Kong and Xu • Mitochondrial Degeneration Triggers Onset of ALS
fore the massive vacuolation at the disease onset. This observa-tion, in conjunction with the absence of dilated endoplasmicreticulum before the massive vacuolation, strongly supports thecontention that mitochondria are the source of vacuoles.
Thus, the current study suggests that mitochondrial damage isat the center of the degeneration mechanism. Whether suchdamage is caused by a direct effect of toxicity from the mutatedSOD1 or is mediated through other intermediates remains to bedetermined. However, the involvement of mitochondrial degen-eration in the early stage of the disease is consistent with a directeffect of mutant SOD1 toxicity and perhaps is mediated by prop-erties gained by the mutant enzyme in catalyzing redox reactions(Beckman et al., 1993; Wiedau-Pazos et al., 1996; Yim et al.,1996). Mitochondria are a large source of oxidative free radicals,and the production of free radicals is directly correlated withmetabolic activity (Beal, 1996). It is possible that the high meta-bolic activity in motor neurons, combined with the gained, toxicoxidative properties of the mutant SOD1, causes mitochondria inmotor neurons to degenerate earlier than other neurons, trigger-ing the onset of ALS. Consistent with this possibility are theresults of a recent report showing that mitochondria in neuro-blastoma cells transfected with G93A mutation displayed a sig-nificant loss of membrane potential and an increase in cytosoliccalcium concentration (Carri et al., 1997).
The assay for disease progression developed in the currentwork sets the stage for further investigations of the diseasemechanism in animal models. This assay enables the study ofanimals with defined disease stages, thus allowing meaningfulcomparisons of pathological evolution among different SOD1mutations. By grouping mice according to their disease stages,inconsistencies caused by heterogeneous disease stages can be
avoided, therefore allowing a full construction of the sequence ofevents (including both biochemical and morphological events)leading to motor neuron death. The assay also provides a usefulmeans to evaluate the effectiveness of potential therapeuticagents.
REFERENCESBeal MF (1996) Mitochondria, free radicals, and neurodegeneration.
Curr Opin Neurobiol 6:661–666.Beckman JS, Carson M, Smith CD, Koppenol WH (1993) ALS, SOD
and peroxinitrate. Nature 364:584.Brown Jr RH (1995) Amyotrophic lateral sclerosis: recent insights from
genetics and transgenic mice. Cell 80:687–692.Bruijn LI, Cleveland DW (1996) Mechanisms of selective motor neuron
death in ALS: insights from transgenic mouse models of motor neurondisease. Neuropathol Appl Neurobiol 22:373–387.
Bruijn LI, Becher MW, Lee MK, Anderson KL, Jenkins NA, CopelandNG, Sisodia SS, Rothstein JD, Borchelt DR, Price DL, Cleveland DW(1997) ALS-linked SOD1 mutant G85R mediates damage to astro-cytes and promotes rapidly progressive disease with SOD1-containinginclusions. Neuron 18:327–338.
Carri MT, Ferri A, Battistoni A, Famhy L, Cabbianelli R, Poccia F,Rotilio G (1997) Expression of a Cu,Zn superoxide dismutase typicalof familial amyotrophic lateral sclerosis induces mitochondrial alter-ation and increase of cytosolic Ca 21 concentration in transfectedneuroblastoma SH-SY5Y cells. FEBS Lett 414:365–368.
Chou SM (1992) Pathology-light microscopy of amyotrophic lateral scle-rosis. In: Handbook of amyotrophic lateral sclerosis (Smith RA, ed), pp133–181. New York: Marcel Dekker.
Cudkowicz ME, McKenna-Yasek D, Sapp PE, Chin W, Geller B, HaydenDL, Schoenfeld DA, Hosler BA, Horvitz HR, Brown RH (1997)Epidemiology of mutations in superoxide dismutase in amyotrophiclateral sclerosis. Ann Neurol 41:210–221.
Dal Canto MC, Gurney ME (1995) Neuropathological changes in twolines of mice carrying a transgene for mutant human Cu, Zn SOD, andin mice overexpressing wild type human SOD: a model of familialamyotrophic lateral sclerosis (FALS). Brain Res 676:25–40.
Gurney ME, Pu H, Chiu AY, Dal Canto MC, Polchow CY, AlexanderDD, Caliendo J, Hentati A, Kwon YW, Deng H-X, Chen W, Zhai P,Sufit RL, Siddique T (1994) Motor neuron degeneration in mice thatexpress a human Cu, Zn superoxide dismutase. Science 264:1772–1775.
Hirano A (1991) Cytopathology of amyotrophic lateral sclerosis. AdvNeurol 56:91–101.
Juneja T, Pericak-Vance MA, Laing NG, Dave S, Siddique T (1997)Prognosis in familial amyotrophic lateral sclerosis: progression andsurvival in patients with glu100gly and ala4val mutations in Cu,Znsuperoxide dismutase. Neurology 48:55–57.
Morrison BM, Gordan JW, Ripps ME, Morrison JH (1996) Quantita-tive immunocytochemical analysis of the spinal cord in G86R superox-ide dismutase transgenic mice: neurochemical correlates of selectivevulnerability. J Comp Neurol 373:619–631.
Mourelatos Z, Gonatas NK, Stieber A, Gurney ME, Dal Canto MC(1996) The Golgi apparatus of spinal cord motor neurons in transgenicmice expressing mutant Cu,Zn superoxide dismutase becomes frag-mented in early, preclinical stages of the disease. Proc Natl Acad SciUSA 93:5472–5477.
Mulder DW, Kurland LT, Offord KP, Beard CM (1986) Familial adultmotor neuron disease: amyotrophic lateral sclerosis. Neurology36:511–517.
Munsat TL (1989) Adult motor neuron disease. In: Merritt’s textbook ofneurology (Rowland LP, ed), pp 682–687. Philadelphia: Lea & Febiger.
Ripps ME, Huntley GW, Hof PR, Morrison JH, Gordon JW (1995)Transgenic mice expressing an altered murine superoxide dismutasegene provide an animal model of amyotrophic lateral sclerosis. ProcNatl Acad Sci USA 92:689–693.
Rosen DR, Siddique T, Patterson D, Figlewicz DA, Sapp P, Hentati A,Donaldson D, Goto J, O’Regan JP, Deng H-X, Rahmani Z, Krizus A,McKenna-Yasek D, Cayabyab A, Gaston SM, Berger R, Tanzi RE,Halperin JJ, Herzfeldt B, Van den Bergh R, Hung W-Y, Bird T, DengG, Mulder DW, Smyth C, Laing NG, Soriano E, Pericak-Vance MA,Haines J, Rouleau GA, Gusella JS, Horvitz HR, Brown RH, Jr (1993)Mutations in Cu,Zn superoxide dismutase gene are associated withfamilial amyotrophic lateral sclerosis. Nature 362:59–62.
Tu PH, Raju P, Robinson KA, Gurney ME, Trojanowski JQ, Lee VMY
Figure 9. Sequence of pathological events leading to motor neuron deathin G93A mice. All the data points were derived from the same set ofanimals. Each data point represents the average of three animals. All thevalues are normalized against the highest measure (100%) in the se-quence. For the hanging test, only the last hanging times before theanimals were killed are shown. Error bars have been shown in Figures 3and 6 and are omitted here for clarity.
Kong and Xu • Mitochondrial Degeneration Triggers Onset of ALS J. Neurosci., May 1, 1998, 18(9):3241–3250 3249

(1996) Transgenic mice carrying a human mutant superoxide dis-mutase transgene develop neuronal cytoskeletal pathology resemblinghuman amyotrophic lateral sclerosis lesions. Proc Natl Acad Sci USA93:3155–3160.
Tu PH, Gurney ME, Julien J-P, Lee VMY, Trojanowski JQ (1997)Oxidative stress, mutant SOD1, and neurofilament pathology in trans-genic mouse models of human motor neuron disease. Lab Invest76:441–456.
Wiedau-Pazos M, Goto JJ, Rabizadeh S, Gralla EB, Roe JA, Lee MK,Valentine JS, Bredesen DE (1996) Altered reactivity of superoxidedismutase in familial amyotrophic lateral sclerosis. Science271:515–518.
Wong PC, Pardo CA, Borchelt DR, Lee MK, Copeland NG, Jenkins NA,
Sisodia SS, Cleveland DW, Price DL (1995) An adverse property of afamilial ALS-linked SOD1 mutation causes motor neuron disease char-acterized by vacuolar degeneration of mitochondria. Neuron14:1105–1116.
Xu Z-S, Cork LC, Griffin JW, Cleveland DW (1993) Increased expres-sion of neurofilament subunit NF-L produces morphological alterationsthat resemble the pathology of human motor neuron disease. Cell73:23–33.
Yim MB, Kang J-H, Yim H-S, Kwak H-S, Chock PB, Stadtman ER(1996) A gain-of-function of an amyotrophic lateral sclerosis-associated Cu,Zn-superoxide dismutase mutant: an enhancement offree radical formation due to a decrease in Km for hydrogen peroxide.Proc Natl Acad Sci USA 93:5709–5714.
3250 J. Neurosci., May 1, 1998, 18(9):3241–3250 Kong and Xu • Mitochondrial Degeneration Triggers Onset of ALS