“Daddy” Bob and “Daughter” Jiyeon after lunch at a great restaurant.
Upload
margery-morganCategory
view
220download
0
MASSACHUSETTS STOVE COMPANY Presented by Group 1: Alex Yeung, Jiyeon Kim, Philip Lee, & Samuel Lee

OVERVIEW
• Introduction• The Issue• Analysis• Recommendations

INTRODUCTIONCompany Background

COMPANY BACKGROUND
Massachusetts Stove Company (MSC)
Manufacturer of Wood-burning Stoves Acquires Parts from Suppliers
(essentially an assembly operation)
Private company with 7 shareholders• Jane O’Neil, CEO, owns 51% common stock• Remaining 49% owned by CFO, VP for
manufacturing and 4 independent investors

Sales &Marketing
Sales Channels• Wholesaling – 20% of sales• Retail direct marketing – 70%• Company showroom - 10%
CustomerPayments
• Full payment : check, credit card• Layaway plan : monthly payment with
period within 1 year, ship the stove after final payment
• Installment bank loan
Business StrategiesOperations
• Rent a building for manufacturing and administrative activities
• Same building as factory showroom
Business Strategies
COMPANY BACKGROUND

Strict regulations from government,Environmental Protection Agency (EPA), incurring additional costs
RecentIndustry
Environment
Number of firms in the woodstove industry decreased from over 200 in Year 10 to 35 by Year 11
COMPANY BACKGROUND
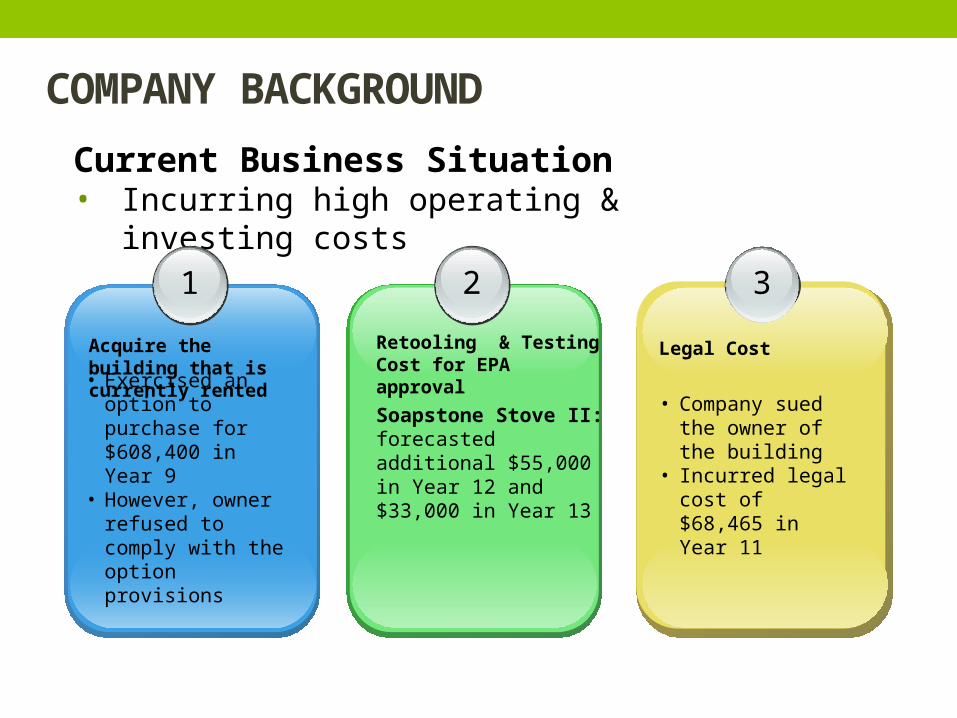
Current Business Situation• Incurring high operating & investing costs
1 3
Legal Cost
2
• Company sued the owner of the building
• Incurred legal cost of $68,465 in Year 11
Retooling & Testing Cost for EPA approval
Soapstone Stove II:forecasted additional $55,000 in Year 12 and $33,000 in Year 13
Acquire the building that is currently rented• Exercised an option
to purchase for $608,400 in Year 9
• However, owner refused to comply with the option provisions
COMPANY BACKGROUND

THE ISSUE“To Lend or Not To Lend?”

THE CASE
• Financing Plan of MSC:• Borrow additional $50,000 loan from bank in Year 12• Pay back the principle by end of Year 13
• Purpose of Loan:• Expect to have 25% annual sales growth for next 2 years• Funding additional working capitals for operations
• The Issue:• As bankers, to judge and decide whether to lend the money to
MSC, based on the MSC’s financials and projections

THE CASE
Year 8
Year 9
Year 10
Year 11
Year 12: Additional $50,000
Loan
Year 13: Pay back
the $50,000
Loan
ProjectionsActual Results

THE CASE – FORECAST ASSUMPTIONS
• Annual sales projected to increase 25% during Year 12, 13
• Reduction of Cost of Good Sold = 51%, 49% of sales for Year 12, 13 respectively
• Selling and Administrative Expenses = 41% of sales for Year 12, 13
• Legal Expenses = $45,000
• Interest Expense = 6%
• No Income Tax Expenses
• Cash: represent a plug to balance the Balance sheet
• Accounts Receivable: Days Accounts Receivable Outstanding = 11 days for Year 12, 13
• Inventories: Days Inventory Held = 155 days for Year 12, 13

THE CASE – FORECAST ASSUMPTIONS
• Property, Plant, and Equipment: excludes the cost of acquiring the building
• Accumulated Depreciation: as per past years
• Other Assets: no amortization of intangibles after Year 11
• Accounts Payable: Days Accounts Payable Outstanding = 97 days, 89 days for Year 12, 13 respectively
• Notes Payable: increase by bank loan in Year 12, pay back in Year 13
• Other Current Liabilities: Deposits to go back to normal in Year 12, 13
• Long-Term Debt: will not repay in near future
• Retained Earnings: No dividends paid

ANALYSISCrunching and Interpreting the Numbers

ANALYSIS – LOAN ASSESSMENT
Credit Risk As-sessment
Circumstances
Character of Man-agement
Contingent Liabilities
Covenants
Collateral
Credit History
Capacity for Debt
Cash Flow Projection

ANALYSIS – LOAN ASSESSMENT
Credit Risk As-sessment
Circumstances
Character of Man-agement
Contingent Liabilities
Covenants
Collateral
Credit History
Capacity for Debt
Cash Flow Projection

RETURN ON ASSETS (ROA)
• ROA is expected to be improved due to:• Better After-Tax Operating Profit Margin (ATOPM) • Increased Asset Turnover (AT)
(ROA = ATOPM x AT)
Year 9 Year 10 Year 11 Year 12 Year 13-5%
0%
5%
10%
15%
20%
25%
30%
-
0.5
1.0
1.5
2.0
2.5
3.0
ROA ATOPM AT

AFTER-TAX OPERATING PROFIT MARGIN
Year 9 Year 10 Year 11 Year 12 Year 13
Revenues 100.0% 100.0% 100.0% 100.0% 100.0%
Cost of Goods Sold-69.2% -60.5% -53.9% -51.0% -49.0%
Selling, Gen., & Admin. Expense-26.7% -37.1% -40.9% -41.0% -41.0%
Legal -4.3% -3.8% -1.0% -3.8% 0.0%
Core Operating Profit -0.2% -1.4% 4.2% 4.2% 10.0%
Interest Income 0.0% 0.0% 0.0% 0.0% 0.0%Other Income, Gains, Expenses and Losses 0.0% 0.0% 0.0% 0.0% 0.0%
Income Before Tax -0.2% -1.4% 4.2% 4.2% 10.0%
Income Tax Expense 0.0% 0.0% 0.0% 0.0% 0.0%
After-Tax Operating Profit Margin -0.2% -1.4% 4.2% 4.2% 10.0%

AFTER-TAX OPERATING PROFIT MARGIN
Increasing ATOPM is driven by:
• Better cost of goods sold due to:• Higher proportion of retail sales which has higher gross margins than
wholesale sales• More favorable pricing due to less competitors as a result of EPA regula-
tions• Switch to lower-cost suppliers• More efficient production• Expected to have lower COGS of 51% and 49% for year 12 and year 13
respectively.
• Well maintained legal expenses in Year 12 & no additional legal expenses in Year 13
• Offset by increased SGA expenses• Mainly due to a heavier emphasis on retail sales which requires more
aggressive marketing than wholesale sales.

CIRCUMSTANCES
• Loan used to finance operations, working capital
• Better ATOPM, AT, and ROA due to more expected sales and decreased in COGS
• Low competition - drop from 200 firms to 35 firms in Year 11 due to strict air emission standards
• Expansion and growth - to capitalize on the situation
• Mature, declining business – demand is uncertain
• Developing, testing, and marketing of new designs to cater to new, more stringent regulations
Risk Level: MEDIUM

ANALYSIS – LOAN ASSESSMENT
Credit Risk As-sessment
Circumstances
Character of Man-agement
Contingent Liabilities
Covenants
Collateral
Credit History
Capacity for Debt
Cash Flow Projection

Relatively large amounts of Paid In Capital (PIC) from shareholders
PAID IN CAPITAL
Year 8
Year 9
Year 10
Year 11
Year 12
Year 13
$- $200,000.00 $400,000.00 $600,000.00
Paid In CapitalTotal Assets

CHARACTER OF MANAGEMENT
• High commitment of shareholders’ personal wealth into the company, as reflected in equity (Paid In Capital)
• Another example of high commitment is that net income of firm taxed at the level of individual shareholders
• Shareholders’ property also used to secure loans
• High ability to adapt – came up with a new stove design, which was approved even in the face of new, stricter regu-lations
Risk Level: LOW

ANALYSIS – LOAN ASSESSMENT
Credit Risk As-sessment
Circumstances
Character of Man-agement
Contingent Liabilities
Covenants
Collateral
Credit History
Capacity for Debt
Cash Flow Projection

CONTINGENT LIABILITIES
• A pending lawsuit - the lower courts have ruled in favor of the company's position on all major issues concerning building option; Supreme Court is also expected to rule in company’s favour
• However, if Supreme Court rules against the company, company may incur additional legal expenses and liabilit-ies
• Firm is dependent on 8 skilled employees for assembly; may be difficult to find replacements
Risk Level: MEDIUM

ANALYSIS – LOAN ASSESSMENT
Credit Risk As-sessment
Circumstances
Character of Man-agement
Contingent Liabilities
Covenants
Collateral
Credit History
Capacity for Debt
Cash Flow Projection

COVENANTS
• No covenants were stated• Company does not have to meet certain conditions or re-
strictions on the existing loans• Company has much freedom in terms decisions, opera-
tions• Lender cannot ensure that the risk attached to the loan
does not unexpectedly deteriorate prior to maturity• Lender cannot penalize, call back the loan
Risk Level: HIGH

ANALYSIS – LOAN ASSESSMENT
Credit Risk As-sessment
Circumstances
Character of Man-agement
Contingent Liabilities
Covenants
Collateral
Credit History
Capacity for Debt
Cash Flow Projection

ASSET VALUES
Year 8
Year 9
Year 10
Year 11
Year 12
Year 13
$- $200,000.00 $400,000.00 $600,000.00
Total Long Term Assets (after Depreciation)
Total Current Assets
Low Levels of Long Term Assets
Most long term assets are already as collaterals for the notes payable.

Low levels of cash and account receivables
SHORT TERM LIQUIDITY

Acceptable Current Ratio, but Low Quick Ratio (risky if <1)
SHORT TERM LIQUIDITY

• Improvements on days receivables held, days inventory held • Fast decline in days payables held (from around 120 days to below
100 days) MSC needs to pay back suppliers earlier• Overall, cash gap is increasing, tighter working capital
WORKING CAPITAL TURNOVER
Cash Gap

INVENTORY
• Parts are purchased from suppliers• Consists mainly of the following:
• metal castings• soapstone • catalytic combusters
• Limited demand for these items• Hard to find buyers, since they are special parts/materials
use for production of stoves• Metal castings, soapstone can be scrapped, but re-sale
value will be lower• Will likely take a loss on re-sale

COLLATERAL
• Low Levels of Long Term Assets
• Low Levels of Cash, Accounts Receivables
• High Levels of Inventory, relatively unsalable
• Existing notes payable to banks are already secured by existing Long Term Assets, Shareholders’ property
• Not much collateral, low liquidation value
Risk Level: HIGH

ANALYSIS – LOAN ASSESSMENT
Credit Risk As-sessment
Circumstances
Character of Man-agement
Contingent Liabilities
Covenants
Collateral
Credit History
Capacity for Debt
Cash Flow Projection

CREDIT HISTORY
Year 8
Year 9
Year 10
Year 11
Year 12
Year 13
$- $100,000.00 $200,000.00 $300,000.00 $400,000.00
Long Term DebtNotes Payable and Short Term Debt
Decreases in Short Term Debt, Increases in Long Term Debt

CREDIT HISTORY
• No bad record on loan repayments• From Year 8 to Year 11, the short term debt is decreasing,
meaning the company is paying them off • However, Long Term Liabilities are not being paid off, as
seen from previous years and from projections
Risk Level: MEDIUM

ANALYSIS – LOAN ASSESSMENT
Credit Risk As-sessment
Circumstances
Character of Man-agement
Contingent Liabilities
Covenants
Collateral
Credit History
Capacity for Debt
Cash Flow Projection

High debt ratio (total assets cannot cover total liabilities)
– negative shareholders’ equity
DEBT RATIO

For financial healthy firm, interest coverage ratio should be above 2
this ratio is currently below 2 but is expected to improve
INTEREST COVERAGE RATIO

High financial leverage
- Total liabilities : on average 1.4 times of Equity (Paid in Capital)
LONG TERM SOLVENCY
Year 9 Year 10 Year 11 Year 12 Year 13 Year 9 Year 10 Year 11 Year 12 Year 13
Total Liabilities
561173 607561 615186 673547.370899794
609755.908983628
Equity (PIC)
437630 437630 437630 437630 437630
Liabilities to Equity (PIC)
1.2823001165368
1.38829833420926
1.4057217284007
1.53907952128463
1.39331377872547
50,000.0
250,000.0
450,000.0
650,000.0
10.0%
50.0%
90.0%
130.0%
170.0%
Total Liabilities to Equity (PIC)

CAPACITY FOR DEBT
• High Debt Ratios
• Low Interest Coverage Ratios
• Poor Long Term Solvency
• High Financial Leverage
• Negative Shareholders’ Equity – shareholders owe money
• Low capacity to carry additional debt
Risk Level: HIGH

ANALYSIS – LOAN ASSESSMENT
Credit Risk As-sessment
Circumstances
Character of Man-agement
Contingent Liabilities
Covenants
Collateral
Credit History
Capacity for Debt
Cash Flow Projection

CASH FLOW TO LIABILITIES
• Low Operating Cash Flow to Current Liabilities Ratio
• High short-term liquidity risk
• A ratio of 0.40 or more was common for a typical healthy manufacturing or retailing firm
Year Year 9 Year 10 Year 11 Year 12 Year 13
Operating Cash Flow to Current Liabilities 0.187 0.182 0.142 -0.040 0.270

CASH FLOW TO LIABILITIES
• Low Operating Cash Flow to Total Liabilities Ratio
• A ratio of 0.20 or more is common for a financially healthy company
Year Year 9 Year 10 Year 11 Year 12 Year 13
Operating Cash Flow to Total Liabilities 0.101 0.098 0.076 -0.022 0.145

SENSITIVITY ANALYSIS
• As a preliminary analysis on Cash Flow, 6 Key Forecast Variables were identified from the assumptions:• Sales
• Cost of Goods Sold
• Selling and Administration Expenses
• Interest Expenses
• Accounts Receivable
• Inventory
• The original assumptions and projections stated in the case are treated as the “Best Case” scenario
• “Worst Case” and “Most Likely Case” scenarios were generated by simultaneously varying all 6 variables

SENSITIVITY ANALYSIS – BEST CASE
• Annual sales projected to increase 25% during Year 12, 13
• Reduction of Cost of Good Sold = 51%, 49% of sales for Year 12, 13 respectively
• Selling and Administrative Expenses = 41% of sales, for Year 12, 13
• Interest Expense = 6%
• Accounts Receivable: Days Accounts Receivable Out-standing = 11 days for Year 12, 13
• Inventories: Days Inventory Held = 155 days for Year 12, 13
Using the ORIGINAL Numbers from projection.

SENSITIVITY ANALYSIS – WORST CASE
• No Sales (Revenue) Growth in Year 12, 13
• COGS increased to previous level, 69.2% of Sales for Year 12, 13
• Selling, General and Admin Expense increased to 50% of Sales for Year 12, 13
• Interest Rate increased to 7%
• Accounts Receivable: Days Accounts Receivable Out-standing = 41 days for Year 12, 13
• Inventories: Days Inventory Held = 177 days for Year 12, 13
Using the WORST Numbers from past years.

SENSITIVITY ANALYSIS – MOST LIKELY CASE• Sales (Revenue) Growth of 15% in Year 12, 13
• COGS increased to 61.2% (average of the past 3 years) of Sales for Year 12, 13
• Selling, General and Admin Expense increased to 45% of Sales for Year 12, 13
• Interest Rate increased to 6.5%
• Accounts Receivable: Days Accounts Receivable Out-standing = 26 days for Year 12, 13
• Inventories: Days Inventory Held = 164 days for Year 12, 13
Using the AVERAGED Numbers from past years.

SENSITIVITY ANALYSIS
• Comparison of Data from the 3 Scenarios
Best Case Worst CaseMost Likely
Case
Year 12
Year 13
Year 12
Year 13
Year 12
Year 13
RETURN ON ASSETS (based on reported amounts): Profit Margin for ROA 4% 10% -24% -19% -10% -6%x Asset Turnover 3 3 2 63 3 6
= Return on Assets 11% 28% -56%-
1214% -26% -34%
ASSET TURNOVER: Accounts Receivable Turnover 33.18 33.18 8.90 8.90 14.04 14.04Revenues/ Average Cash 48.74 167.77 -3.94 -1.57 -9.32 -3.24

SENSITIVITY ANALYSIS
• Comparison of Data from the 3 Scenarios
Best Case Worst CaseMost Likely
Case
Year 12
Year 13
Year 12
Year 13
Year 12
Year 13
Current Ratio 0.92 1.24 0.43 -8.50 0.59 -0.56Quick Ratio 0.14 0.18 -0.61 -14.69 -0.31 -2.40Operating Cash Flow to Current Liabilities -0.04 0.27 -1.26 -1.23 -0.75 -0.59Cash Gap (= Cash Cycle) 69.00 77.00 166.63 165.50 108.87 115.60
Days Sales Held in Cash 7.49 2.18 -92.62-
232.76 -39.18-
112.69
Operating Cash Flow to Total Liabilities -2% 14% -75% -63% -43% -31%Interest Coverage Ratio (reported amounts) 1.91 5.63 -7.39 -7.42 -3.94 -2.97Interest Coverage Ratio (recurring amounts) 1.91 5.63 -7.39 -7.42 -3.94 -2.97

SENSITIVITY ANALYSIS
• From the data seen, that the company will not fare well, even with relatively small changes in the forecast vari-ables
• Negative cash flows were observed for both the worst and most likely scenarios
• It is not immediately clear what variables/assumptions are having the most effect on the financial projection
• Other assumptions may be affecting the projection
• For a more thorough investigation, analysis should not be limited to just the 6 key assumptions stated previously

SENSITIVITY ANALYSIS
• To have a better idea of how each of the assumptions stated in the case affect the financial forecasts, each as-sumption was treated as a variable, isolated and individu-ally varied
• “Goal Seek” was applied on to each variable
• Determine the value of the variable such that the Cash account is zero for the projected year
• The absolute % error between the original assumed value and the “Goal Seek” result of the variable will give an indi-cation of the sensitivity of the variable
• The smaller the absolute % error, the more sensitive

SENSITIVITY ANALYSIS
Original Estimate Goal Seek Result Difference Abs % ErrorYear 12 Year 13 Year 12 Year 13 Year 12 Year 13 Year 12 Year 13
Sales (%) 25.0 25.0 21.4 22.6 -3.6 -2.4 14.4 9.6COGS (%) 51.0 49.0 52.1 47.7 1.1 -1.3 2.2 2.7
Selling and Administration Expenses (%) 41.0 41.0 41.9 40.7 0.9 -0.3 2.2 0.7
Interest Expense (%) 6.0 6.0 8.6 4.9 2.6 -1.1 43.3 18.3Days Account Receivable
Outstanding 11.0 11.0 12.7 13.2 1.7 2.2 15.5 20.0
Days Inventory Held 155.0 155.0 162.2 152.2 7.2 -2.8 4.6 1.8Days Account Payable
Outstanding 97.0 89.0 94.0 84.8 -3.0 -4.2 3.1 4.7
Legal Expenses ($) $ 45,000 N/A $ 56,289 N/A $ 11,289 N/A 25.1 N/A
Capital Expenditures ($) $ 62,500 $ 47,500
$ 74,560
$ 43,220 $ 12,060 $
(4,280) 19.3 9.0
Change in Notes Payable ($) $ 50,000 $ (50,000)
$ 37,991
$ (45,943) $ (12,009) $
4,057 24.0 8.1
Other Current Liabilities ($) $ 33,500 $ 41,000 $ 22,211 $
34,488 $ (11,289) $ (6,512) 33.7 15.9
Change in Long Term Debt ($) $ - $ - $ (11,638) $ 4,205 $ (11,638) $
4,205 N/A N/A
Change in Common Stock ($) $ - $ - $ (11,289) $ 4,777 $ (11,289) $
4,777 N/A N/A
Change in Additional Paid-in Capital ($) $ - $ - $
(11,289) $ 4,777 $ (11,289) $ 4,777 N/A N/A

SENSITIVITY ANALYSIS
• The variables most sensitive to change are:• Selling and Administration Expenses
• COGS
• For Selling and Administration Expenses, the company can easily control this cost by scaling down marketing ex-penses
• Change company strategy: shift away from retail sales, back to wholesale sales

SENSITIVITY ANALYSIS
• For COGS, it is very difficult for the company to control
• Company is very dependent on suppliers from various parts of the world for parts (ie. metal castings, soapstone, catalytic combusters)
• Company does not have the capability to manufacture any of these parts
• If any one of the suppliers to raise prices such that cost is 2.2% or more on current sales, the company will run out of cash (and therefore, cannot pay back interest, loan)
• Sourcing for new suppliers may be difficult, time-consum-ing

SENSITIVITY ANALYSIS
• Metal and soapstone are commodities, and may be sub-ject to price fluctuations
• Fluctuations in exchange rates may also affect costs
• Company only has one revenue stream - the sale of stoves – no other way to cover potential revenue shortfalls
• Company had another business selling lawn products, but it was unsuccessful and was discontinued
• 2.2% is a relatively small difference – makes the company very risky and susceptible to external factors

CASH FLOW PROJECTION
• Low Cash Flow Ratios• Original Projection shows that company can pay interest
and repay capital• However, the projection and assumptions made are very
vulnerable to sensitivity checks• COGS, the most sensitive variable, cannot be easily con-
trolled by the company
Risk Level: HIGH

RECOMMENDATIONSMaking a Decision

SUMMARY
Credit Risk As-sessment
Circumstances
Character of Man-agement
Contingent Liabilities
Covenants
Collateral
Credit History
Capacity for Debt
Cash Flow ProjectionLow Risk
Medium Risk
High Risk
High Risk
Medium Risk
High Risk
High Risk
Medium Risk

SUMMARY
• Reasonableness of the company’s projections:• Projections are too optimistic, sensitive to variations
• Factors affecting industry: • Uncertainty regarding regulations, enforcement• Uncertainty regarding demand, expenses on design, tooling, test-
ing, and compliance
• Factors affecting company:• High Short-term Liquidity Risk• High Long-term Solvency Risk• High Credit Risk
• Ability of company to repay loan:• Low ability to repay loan

RECOMMENDATIONS
• For this particular case, the main risk faced by the bank (lender) is credit default risk
• Based on the current and projected financials, MSC is a very risky company: • Low cash levels• Highly leveraged• Uncertain business environment• Expenses difficult to control, predict
• The ability of MSC to pay back the loan is low

RECOMMENDATIONS
• There is very little collateral for the bank to hold on to should MSC default
• The bank should loan the amount to MSC only if it can charge an interest rate on the loan that is significantly higher than the market rate
• The bank should also place strict covenants on the loan, so that it can have more control over the loan conditions and risks
• The bank can pass the risk to a third party by entering into a credit default swap

GENERAL RECOMMENDATIONS
• Lenders can protect themselves from a potential credit risk arising from sensitive ratios by:• Risk-based pricing: Lenders generally charge a higher interest rate
to borrowers who are likely to default. Higher compensation for tak-ing higher risk.
• Covenants: Lenders may write into loan agreements certain stipu-lations that borrowers must comply with. Protects against undue deterioration of borrower’s financial condition.
• Credit insurance and credit derivatives: Lenders may hedge their credit risk by purchasing credit insurance or credit derivatives. These contracts transfer the risk from the lender to the seller (in-surer) in exchange for payment.

THE ENDThank you for listening!