Massachusetts Institute ofTechn%gy Massachusetts Institute ...
Upload
truongcongCategory
view
218download
0
Exp.#2-1
MASSACHUSETTS INSTITUTE OF TECHNOLOGY DEPARTMENT OF CHEMISTRY
5.32 Intermediate Chemical Experimentation Spring, 2001
EXPERIMENT #2: QUALITATIVE ORGANIC ANALYSIS
I. Introduction The identification of the structure of chemical substances is an activity fundamental to all varieties of research in organic chemistry. In some instances, the chemist may wish to establish that an unknown substance is identical to a previously reported compound. In other cases, the structure of an entirely new unknown compound must be deduced. This experiment is designed to simulate these common research situations. The aim of the experiment is to separate and identify the components of a binary organic mixture. Unknown samples will consist of approximately 2 g of a mixture of two organic compounds. One unknown in each sample is an organic acid (e.g. carboxylic acid, phenol or sulfonic acid). The other unknown in each sample is a neutral organic compound (e.g., ketone, ester, amide etc.). The unknowns will be separated by extraction (monitored by thin layer chromatography). The separated compounds will then be purified by recrystallization, and their infrared, 1H NMR, and GC/MS spectra will be measured. The structure of the neutral unknown will be deduced by analysis of these spectral data together with analytical and 13C NMR data supplied by the teaching staff. The acid unknown will be identified by comparison of its spectral characteristics with those of previously reported compounds, and by the preparation of a suitable derivative (optional). II. References 1. Zubrick, J. W.; The Organic Lab Survival Manual, 3rd Ed.; Wiley: New York, 1992. (Z) 2. Pasto, D. J.; Johnson, C.R.; Miller, M.; Experiments and Techniques in Organic Chemistry; Prentice-Hall: Englewood Cliffs, NJ, 1992. (PJM) 3. Lambert, J. B.; Shurvell, H. F.; Lightner, D. A.; Cooks, R. G.; Organic Structural Spectroscopy; Prentice-Hall: Upper Saddle River, NJ, 1998. (LSLC) 4. Silverstein, R. M.; Bassler, G. C.; T.C. Morrill, T. C.; Spectrometric Identification of Organic Compounds, 5th edition; Wiley: New York, 1991. 5. McLafferty, F.; Tureen, F.; Interpretation of Mass Spectra; University Science Books: Mill Valley, CA, 1993. Lists of acid unknowns are contained in S. Rappaport, Handbook of Tables for Organic Compound Identification, 3rd Edition, Chemical Rubber Co. (1967). III. Procedure

Exp.#2-2
A. TLC Analysis of Mixture (Z: chap.26; or PJM: section 2.6.4) Determine analytical TLC conditions that clearly resolve your unknown components. Be sure you are familiar with the effect of a compound's polarity on its mobility on a TLC plate. Your objective is to find a TLC solvent and stain such that a sample can be quickly and conveniently analyzed for the presence/absence of the two components of the mixture. It is desirable to find a solvent system that elutes one or both of the two components somewhere near the middle of the plate. 1. TLC Plates - precoated plastic-backed silica gel plates containing a fluorescent indicator will be provided. 2. Eluents - stock solutions of 1/1, 3/1, and 1/3 ethyl acetate/hexane mixtures will be provided. These solvent systems will resolve most binary mixtures. 2-10% ether in dichloromethane may also be an effective solvent to try for difficult mixtures. 3. Spot plates with a glass capillary using solution of approximately 5 mg of unknown in 0.5 mL of a suitable solvent (Et2O or Et2O:CH2Cl2, etc.). Always spot a sample of the original mixture on the same plate as a test sample for definitive comparison purposes. If you desire to spot a neutralized aqueous solution, you must remove the water in vacuo prior to eluting the plate. 4. Visualization a. Nondestructive - When the plate has developed, remove it from the chamber and allow the solvent to evaporate. Place the plate under the short-wave UV lamp. Highly conjugated molecules, e.g. aromatic systems, will show up as dark spots on a green background. Beware that minor impurities can often show up rather strongly under UV light while an unknown with no significant UV chromophore will be completely invisible. b. Destructive - Staining with ethanolic p-anisaldehyde-H2SO4/CH3COOH solution is very effective for visualizing a variety of organic molecules. The plate is simply dipped in the solution and then placed on a hot plate (100-150 °C). Phosphomolybdic acid solution is another very effective stain for most organic compounds. CeIV(SO4)2 solution in sulfuric acid may also be useful. Organic molecules will appear as a brown spot on a white background. B. Testing of the Extraction Procedure Determine the acidic properties of your unknowns by conducting small-scale extractions of a solution of your mixture. In a small test tube, try to dissolve 5-10 mg of your mixture in 0.5 mL or so of ether. If the mixture is not soluble, some dichloromethane can be added. Add a portion of 5% NaHCO3 or 5% NaOH and swirl the test tube gently to mix. Ether alone or mixtures of ether and hexane are the best solvents for the extraction of neutral organic compounds from ionized forms of organic acids because these ionic species have very little if any solubility in these solvents. The addition of significant portions of dichloromethane or the use of dichloromethane alone may extract both the neutral compound and the organic salt. Determine by TLC analysis

Exp.#2-3
whether your unknown components are still present in the organic phase (you can remove a portion of the upper organic layer with a pipette). Pay particular attention to whether the products of the extraction are identical to the components of the original mixture. After removal of the ether layer, the aqueous layer can be washed with a fresh portion of solvent and then analyzed by TLC for the other component of the mixture (you must allow the water to dry from the plate in order for this to work.) Check to make sure that your acid component is not affected upon neutralization of aqueous extracts - reactions of organic compounds with acid or base are not uncommon. With some skill, the small-scale extraction is extremely quick and easy to perform (however a larger scale test extraction may also be performed using a small separatory funnel). C. Separation of Mixture by Extraction (Z: chap. 15 or PJM sections 2.1 2.5) Based on the results of the small-scale extractions, separate the components of your mixture by an appropriate extraction procedure. A 60 mL or 125 mL separatory funnel should be effective for this purpose. Use no more than 2/3 of your mixture (save the remainder in case of an accident!). Two or three extractions with small quantities of solvent are more efficient than a single large extraction. Whether or not further extractions are necessary can be ascertained by analyzing the most recent extraction by TLC relative to the combined extractions. The organic solutions should be dried by filtration through anhydrous magnesium sulfate before evaporation using a Buchner funnel or fritted glass funnel (available from the stockroom). The rate at which anhydrous magnesium sulfate will dry an organic solvent is extremely rapid - just be sure to carefully pour ethereal solutions from the top of the separatory funnel without allowing water to pour in. In fact, a good practice is to pass each sequential organic extract through a fritted glass funnel containing anhydrous magnesium sulfate (later extractions serve to wash through the compound from the first portions). In order to separate 1 gram of your mixture, you will likely find that a total of 25 mL aqueous base and 150 mL of organic solvent is adequate for the entire operation. When removing the solvent on the rotary evaporator, it is advisable to use a dish of lukewarm water under the flask rather than steam since some of the unknowns may not be very stable. Upon confirming that the neutral compound has been effectively removed, neutralize the aqueous layer and isolate the acid component of your mixture. Record the weights of original and separated material. D. Purification of Solid Unknowns (Z: chap. 13 or PJM: section 2.2) Purify both unknowns by recrystallization. Some of the unknowns will solidify upon concentration. For those that don't it is a good idea to save a small portion of the original solid mixture as seed crystals for recrystallization of one component. Good solvents for recrystallization include ether, hexane, dichloromethane, ethyl acetate and mixtures of these three solvents. An all-purpose procedure involves initially adding 1-2 mL of ether to the solid in a 50 mL flask. If the solid starts to dissolve rapidly, then add some hexane

Exp.#2-4
until it begins to crash out, then warm gently to dissolve. If the solid appears to dissolve slightly, then warm ether is probably the best choice. If the solid does not dissolve at all, then dichloromethane can be added and perhaps a more polar solvent like ethyl acetate or ethanol. Once the material has been dissolved in the optimum solvent, it can be allowed to cool slowly to room temperature on the bench at which time a very small seed crystal can be added if crystallization has not already taken place. Then the mixture may be placed in the refrigerator or freezer to complete crystallization. Be warned that for many compounds, a fluffy crystalline product may be a lot less material than expected. Crystals that have been isolated on the filter can usually be effectively freed from solvents such as ether, hexane and dichloromethane by sucking air through for 10-15 minutes. Oven drying is not recommended because most of the unknowns will either melt or decompose. Record the amount recovered, the melting point and melting range for each of your unknowns. A sharp melting range is the best indication of purity and a prerequisite to investing a lot of time in spectral analysis. E. NMR Spectral Analysis (Z: chap. 33) Obtain 1H NMR spectra (in CDCl3) of both of your unknowns. If not soluble in CDCl3, try deuterated acetone or DMSO - ask your TA. Be sure that your sample is pure and is not wet with solvent and that your NMR tube is also free of any solvent that may have been used to wash it out. Such solvent peaks can obscure important peaks in the spectrum. Once you obtain a good spectrum, be sure to print out all of the information that you will need to analyze the spectrum including integrals, expansions and peak listings - having to redo spectra because of these two problems can lead to a great deal of congestion on the instruments. The TAs can give you a copy of the 1H NMR spectrum of your neutral unknown if you find that your spectrum contains some minor inadequacy or ambiguity. However, if your acid unknown contains stray peaks, it would be quite unfortunate. As soon as possible, check each 1H NMR spectrum carefully for purity and try to assign a number of protons to each peak or cluster of peaks based on the integration. Also, the sooner you begin analysis of the multiplet patterns, the better. First read the section on analysis of 1H NMR coupling patterns, then make sure you understand how to do the practice problems on the First Report. As soon as possible, check each 1H NMR spectrum carefully for purity and try to assign a number of protons to each peak or cluster of peaks based on the integration. Check for the presence of common impurities such as ether, acetone, etc. as well as the deuterated solvent peak(s) and water (which appears at various places in different solvents). Once you have determined which peaks belong to your compound, make a list of them in your worksheet. In the table, organize the chemical shift, multiplicities (singlet, doublet, triplet). Some of the peaks in the spectrum may appear as unmanageable multiplets (m), however the more carefully and patiently you analyze the peaks, the more information you will glean from the spectrum. Such analysis of complex multiplets (dd, ddd, dt, etc.) and matching of the coupling constants allows one to trace out the spin system of the unknown (Figure 1).

Exp.#2-5
F. IR Analysis (Z: chap. 32 or PJM: chapter 5) Obtain an IR spectrum of each component of your unknown mixture. Using the FTIR spectrophotometer, IR spectra can be measured on solutions of solid samples and thin-films of liquid samples. Identify in your notebook the principal absorptions in each spectrum and determine which functional groups are most likely present. G. UV Spectral Analysis (Optional) H. GC-Mass Spectral Analysis You will obtain the high-resolution mass spectral data for your neutral unknown. This will be accomplished using the Hewlett-Packard 5890 Series II GC/MS. Sign up in advance to use this instrument in 4-474 and ask your instrument TA or Ray Dove for help using this delicate equipment. As mass spectrometry is the most sensitive analytical tool available to the organic chemist, be careful to prepare a sample that is not too concentrated. Usually, a solution containing 1 mg of your neutral unknown dissolved in 0.5 mL of dichloromethane is sufficient to obtain a strong spectrum. Small disposable sample tubes are available for this purpose. After you have completed parts E, F and H, you should prepare to show your TAs that your spectral characterization of your two unknowns is acceptable to precede. You will then receive a 13C NMR spectrum and an elemental analysis of your neutral unknown. I. Organic Acid Unknown: Preparation of Derivatives Locate the m.p. of your organic acid unknown in the Tables for the Identification of Organic Compounds, keeping in mind that it could be a carboxylic acid, a phenol or a sulfonic acid. Examine the entries in the appropriate table within 6 °C of your measured melting point. Eliminate as many structures as possible on the basis of your NMR and IR data. Choose a derivative of your acid unknown which will allow you to confirm its identity or distinguish between two possibilities. Not all derivatives are listed for each entry in the Tables for the Identification of Organic Compounds. Procedures for preparation of common derivatives of almost any functional group are presented in PJM: chap. 9. Preparation of Acid Chloride and conversion to Amide or Anilide.
Exp.#2-6
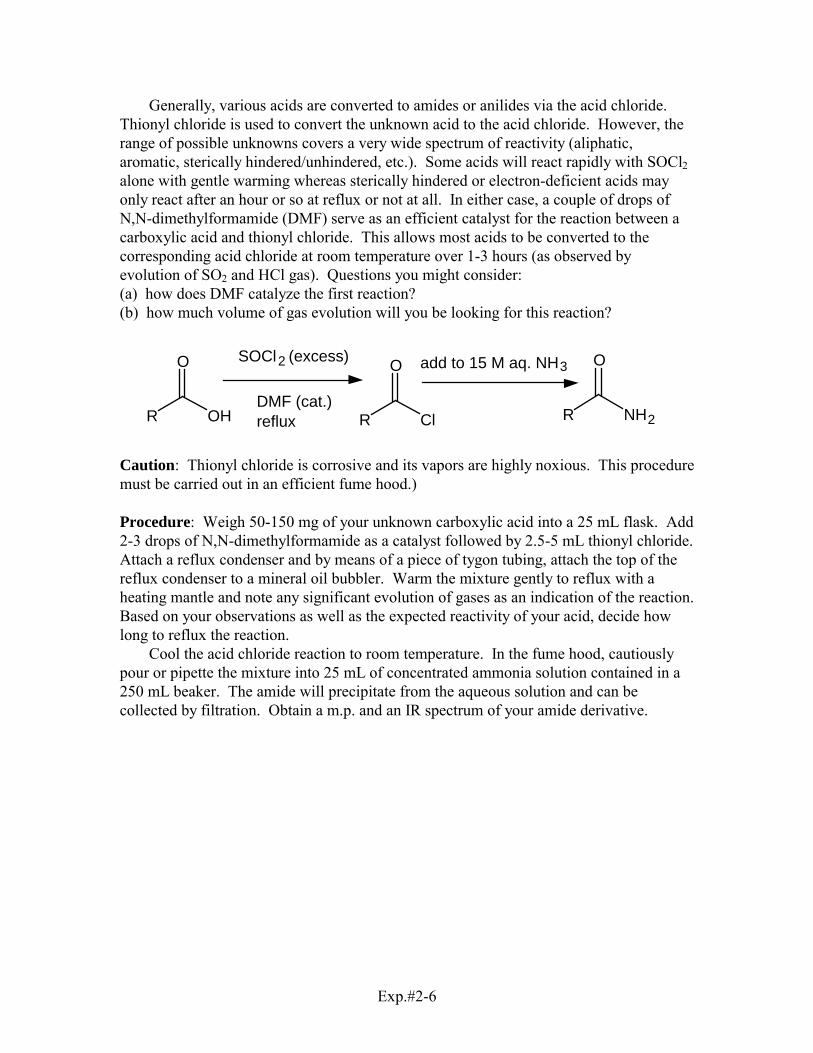
Generally, various acids are converted to amides or anilides via the acid chloride. Thionyl chloride is used to convert the unknown acid to the acid chloride. However, the range of possible unknowns covers a very wide spectrum of reactivity (aliphatic, aromatic, sterically hindered/unhindered, etc.). Some acids will react rapidly with SOCl2 alone with gentle warming whereas sterically hindered or electron-deficient acids may only react after an hour or so at reflux or not at all. In either case, a couple of drops of N,N-dimethylformamide (DMF) serve as an efficient catalyst for the reaction between a carboxylic acid and thionyl chloride. This allows most acids to be converted to the corresponding acid chloride at room temperature over 1-3 hours (as observed by evolution of SO2 and HCl gas). Questions you might consider: (a) how does DMF catalyze the first reaction? (b) how much volume of gas evolution will you be looking for this reaction?
R OH
O
R Cl
O
R NH2
OSOCl2 (excess)
DMF (cat.)reflux
add to 15 M aq. NH3
Caution: Thionyl chloride is corrosive and its vapors are highly noxious. This procedure must be carried out in an efficient fume hood.) Procedure: Weigh 50-150 mg of your unknown carboxylic acid into a 25 mL flask. Add 2-3 drops of N,N-dimethylformamide as a catalyst followed by 2.5-5 mL thionyl chloride. Attach a reflux condenser and by means of a piece of tygon tubing, attach the top of the reflux condenser to a mineral oil bubbler. Warm the mixture gently to reflux with a heating mantle and note any significant evolution of gases as an indication of the reaction. Based on your observations as well as the expected reactivity of your acid, decide how long to reflux the reaction. Cool the acid chloride reaction to room temperature. In the fume hood, cautiously pour or pipette the mixture into 25 mL of concentrated ammonia solution contained in a 250 mL beaker. The amide will precipitate from the aqueous solution and can be collected by filtration. Obtain a m.p. and an IR spectrum of your amide derivative.

Exp.#2-7
A STEPWISE GUIDE TO STRUCTURE ELUCIDATION
In order to determine the structure of your neutral unknown, you will draw upon the several powerful spectroscopic and analytical methods described above. Detailed below is a systematic approach to structure elucidation. While reading about each of the five stages of the structure elucidation process, follow the example to see how this is applied to a sample unknown. I. Determination of Molecular Formula (and Unsaturation number) II. Identification of Unsaturated Groups III. Analysis of 1H NMR Coupling Patterns IV. Assemblage of Molecular Subunits V. Confirmation of Structure
I. Determination of Molecular Formula (and Unsaturation number) The following data will be important for determining the molecular formula: Elemental Analysis, Mass Spectrum Highest Ion Pattern, 1H NMR (integration) and 13C NMR (# of lines). The goal is to find a molecular formula that is consistent with all of these.
Elemental Analysis. In research, samples are sent to outside laboratories for the purpose of obtaining % composition of C and H (N, S are more expensive). 2-5 milligrams of material is subject to complete combustion in an atmosphere of O2 and the resulting H2O and CO2 accurately weighed to obtain %C and %H within ± 0.4%. In practice, stray solvents and impurities can lead to incorrect results. Your TA's have calculated an elemental analysis of your unknown for the elements C, H, N, S which is within ± 0.4% for each element. Since you are guaranteed of the ± 0.4% range, you can apply a high level of confidence in this data. GC-MS Highest Ion Pattern. A single large peak eluting from the gas chromatograph is good evidence that your neutral unknown was pure and passed through the GC unharmed. Each molecule passing into the Mass Spec is first converted by electron ionization (EI) to the molecular ion (M�+) in which the molecule has simply lost one electron. For nearly all of the unknowns, some of the M�+ ions will survive and show up in the spectrum. If this is the case, then the Elemental Analysis data and GC-MS may be used directly to determine the number of C, H, N and S atoms in the molecular formula (check out the example to see how easy this is). If the Highest Ion Pattern of your mass spectrum is not M�+, then figuring out the molecular formula will be a fair amount more difficult. The following symptoms suggest that you don't have M�+: 1. The calculations using the elemental analysis and the Highest Ion Pattern do not span an integer for each element. (see example)
2. The mass of M�+ does not agree with the Nitrogen Rule. (The Nitrogen Rule states that a molecule or M�+ ion with an even number of nitrogen atoms must have an even mass. And similarly, a molecule or M�+ ion with an odd number of nitrogen atoms must have an odd mass.)

Exp.#2-8
The Highest Ion Pattern of the mass spectrum will generally display at least three peaks at consecutive m/e values if a sufficiently strong M�+ signal has been detected. The ratio of intensities of M�+, (M+1)�+ and (M+2)�+ result from the statistical presence of (A+1) and (A+2) isotopes of the individual elements. The M+1 peak % results primarily from the number of carbons in the organic molecule. The M+2 peak % will generally be 1% or less that of the M peak % for small to medium sized organic molecules containing only C,H,N and O. A sizeable M+2 peak indicates the presence of (A+2) elements, most notably Cl and Br. Below are shown several possible isotopic patterns for the M�+ region of the spectrum.
Isotopic Patterns for Selected Elements Isotopic Patterns for CxHyOn
A isotope =100% A+1 (relative %) A+2 (relative %) M peak=100% M+1 peak %* M+2 peak %
1H 2D (0.015%) - - - C1 1.1 % 0.00%
12C 13C (1.1%) - - - C2 2.2 % 0.01 %
14N 15N (0.37%) - - - C3 3.3 % 0.04 %
16O 17O (0.04%) 18O (0.20%) C4 4.4 % 0.07 %
19F - - - - - - C5 5.5 % 0.12 %
28Si 29Si (5.1%) 30Si (3.4%) C6 6.6 % 0.18 %
31P - - - - - - C7 7.7 % 0.25 %
32S 33S (0.80%) 34S (4.4%) C8 8.8 % 0.34 %
35Cl - - - 37Cl (32.5%) C9 9.9 % 0.44 %
79Br - - - 81Br (98%) C10 11.0 % 0.54 %
127I - - - - - - C11 12.1 % 0.67 %
*add 0.37% for each N
M�+
(M+1) �+
(M+2) �+
No S,Cl,Br
M�+
(M+1) �+
(M+2) �+
One S atom
M�+
(M+2) �+
One Cl atom
M�+ (M+2) �+
One Br atom Two Br atoms
(M+3) �+(M+3) �+
M�+
(M+2) �+
(M+4) �+
1H NMR (integration). The integration of the 1H NMR spectrum is the most reliable method for determining the number of protons in the molecular formula. Only two problems can interfere with this:
1. Stray peaks in the 1H NMR spectrum may be mistakenly counted. 2. Exchangeable protons (e.g., NH, OH) are broadened and may be exchanged with D2O present in some deuterated solvents (e.g. d6-acetone) thus giving a lower integral. Occasionally, these peaks (e.g., -COOH) may be overlooked altogether.
13C NMR (# lines). The number carbons should be checked with the number of lines in the 13C NMR. First, make sure that you know which peaks are from the deuterated solvent. Since 13C NMR spectra are generally acquired with broadband 1H

Exp.#2-9
decoupling, all resonances will appear as sharp singlets unless they are coupled to other nuclei such as 2D (I = 1), 19F (I = 1/2) or 31P (I = 1/2). So # Lines > #C means that your unknown has one or more of these atoms. # Lines < #C means that your unknown has groups for which pairs or sets of carbons are equivalent by virtue of symmetry or free rotation.
Unsaturation Number. For a molecule having molecular formula CxHyNzOn, the number of double bonds + number of rings = 1�x-0.5�y+0.5�z+0�n+1. This is a direct result of the known valences of these elements (C=4,H=1,N=3,O=2). For other elements, all that is needed is to know the valence of the element. Halogens can safely be said to have valence = 1 for the majority of organic compounds. However phosphorus may have valence = 3 or 5. And sulfur may have valence = 2,4 or 6 (e.g., CH3SCH3, CH3SOCH3, PhSO3H). II. Identification of Unsaturated Functional Groups Careful examination of the IR, and 13C NMR spectra will reveal all of the unsaturated functional groups that are present in your unknown. The first stage of this search involves examination of the IR spectrum. Although several regions of the IR spectrum can reveal useful information about the unknown (see pages xx-xx), at this stage, we are only interested in examining the two regions of the IR spectrum that will help us identify special unsaturated functional groups. In the 2300 to 2000 cm-1 region, any peak that is observed, no matter how small, is likely to be diagnostic of one of these functional groups. By contrast, in the 1800 to 1650 cm-1 region, a carbonyl peak will always be strong, very likely the strongest peak in the spectrum. -C≡≡≡≡N, -C≡≡≡≡C-, >C=C=C< Region (2300 cm-1 to 2000 cm-1)
cm-1 comments 13C ppm 2250 ν(-C≡N) sharp, weak to med intens, almost always observed 117-123 ppm
2150 ν(RC≡CH) sharp, weak to med intens, check for ν(C-H) at 3300 ppm
2260-2190 ν(R-C≡C-R') sharp, weak to med intens, obsd only for R,R' different ppm
1950 ν(>C=C=C<) sharp, strong allene 200-210 ppm
Exp.#2-10
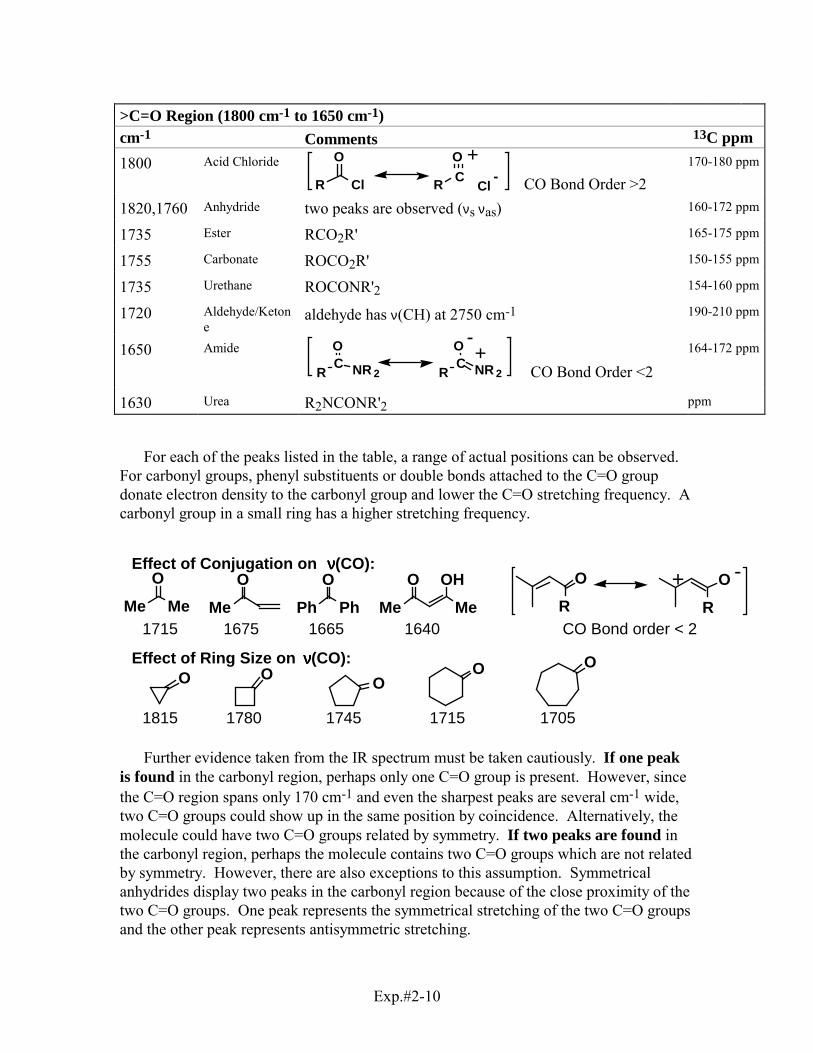
>C=O Region (1800 cm-1 to 1650 cm-1)
cm-1 Comments 13C ppm 1800 Acid Chloride
R Cl
O
R CO +
Cl - CO Bond Order >2
170-180 ppm
1820,1760 Anhydride two peaks are observed (νs νas) 160-172 ppm
1735 Ester RCO2R' 165-175 ppm
1755 Carbonate ROCO2R' 150-155 ppm
1735 Urethane ROCONR'2 154-160 ppm
1720 Aldehyde/Ketone
aldehyde has ν(CH) at 2750 cm-1 190-210 ppm
1650 Amide
R C NR 2
O +R C NR 2
O -
CO Bond Order <2
164-172 ppm
1630 Urea R2NCONR'2 ppm
For each of the peaks listed in the table, a range of actual positions can be observed. For carbonyl groups, phenyl substituents or double bonds attached to the C=O group donate electron density to the carbonyl group and lower the C=O stretching frequency. A carbonyl group in a small ring has a higher stretching frequency.
RO
R
Effect of Conjugation on νννν(CO):O+ -
CO Bond order < 2
Effect of Ring Size on νννν(CO):
MeMeO O
MeO
Ph PhO
MeOH
Me
O
1715
O
1675 1665
OO
1640
O
1815 1780 1745 1715 1705 Further evidence taken from the IR spectrum must be taken cautiously. If one peak is found in the carbonyl region, perhaps only one C=O group is present. However, since the C=O region spans only 170 cm-1 and even the sharpest peaks are several cm-1 wide, two C=O groups could show up in the same position by coincidence. Alternatively, the molecule could have two C=O groups related by symmetry. If two peaks are found in the carbonyl region, perhaps the molecule contains two C=O groups which are not related by symmetry. However, there are also exceptions to this assumption. Symmetrical anhydrides display two peaks in the carbonyl region because of the close proximity of the two C=O groups. One peak represents the symmetrical stretching of the two C=O groups and the other peak represents antisymmetric stretching.
Exp.#2-11
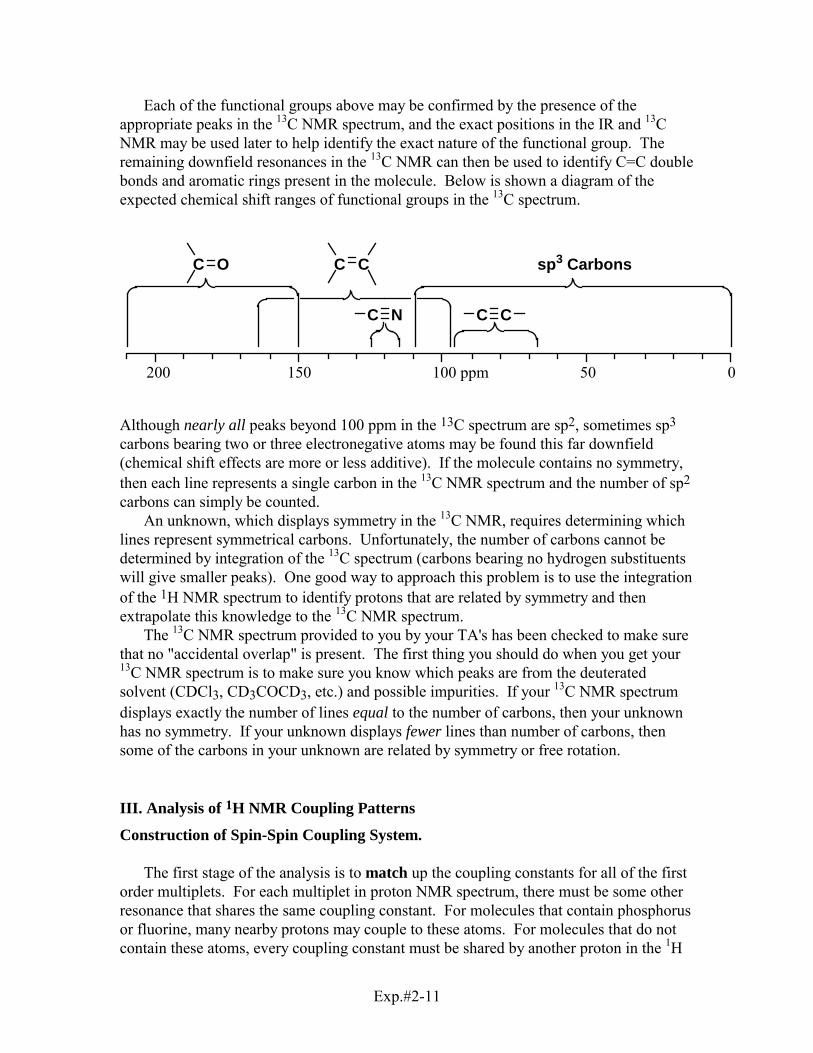
Each of the functional groups above may be confirmed by the presence of the appropriate peaks in the 13C NMR spectrum, and the exact positions in the IR and 13C NMR may be used later to help identify the exact nature of the functional group. The remaining downfield resonances in the 13C NMR can then be used to identify C=C double bonds and aromatic rings present in the molecule. Below is shown a diagram of the expected chemical shift ranges of functional groups in the 13C spectrum.
050100 ppm150200
C N C C
C O C C sp3 Carbons
Although nearly all peaks beyond 100 ppm in the 13C spectrum are sp2, sometimes sp3
carbons bearing two or three electronegative atoms may be found this far downfield (chemical shift effects are more or less additive). If the molecule contains no symmetry, then each line represents a single carbon in the 13C NMR spectrum and the number of sp2 carbons can simply be counted. An unknown, which displays symmetry in the 13C NMR, requires determining which lines represent symmetrical carbons. Unfortunately, the number of carbons cannot be determined by integration of the 13C spectrum (carbons bearing no hydrogen substituents will give smaller peaks). One good way to approach this problem is to use the integration of the 1H NMR spectrum to identify protons that are related by symmetry and then extrapolate this knowledge to the 13C NMR spectrum. The 13C NMR spectrum provided to you by your TA's has been checked to make sure that no "accidental overlap" is present. The first thing you should do when you get your 13C NMR spectrum is to make sure you know which peaks are from the deuterated solvent (CDCl3, CD3COCD3, etc.) and possible impurities. If your 13C NMR spectrum displays exactly the number of lines equal to the number of carbons, then your unknown has no symmetry. If your unknown displays fewer lines than number of carbons, then some of the carbons in your unknown are related by symmetry or free rotation. III. Analysis of 1H NMR Coupling Patterns
Construction of Spin-Spin Coupling System. The first stage of the analysis is to match up the coupling constants for all of the first order multiplets. For each multiplet in proton NMR spectrum, there must be some other resonance that shares the same coupling constant. For molecules that contain phosphorus or fluorine, many nearby protons may couple to these atoms. For molecules that do not contain these atoms, every coupling constant must be shared by another proton in the 1H

Exp.#2-12
NMR spectrum. Usually, coupling constants will match to within approximately 0.2 Hz. Furthermore, note that if a methyl group is a doublet, then some other proton in the spectrum must appear as a 1:3:3:1 quartet or have this pattern combined with some other coupling constants. It is important that multiplets be interpreted correctly as described on pages 30-40. Once the coupling constants are matched between each other in the 1H NMR spectrum, the task is to construct a spin system showing their relationships within the molecule. In order to do this, some decisions must be made about whether a given H-H coupling constant is geminal, vicinal, or long-range. If a coupling constant is large (>3 Hz), it may safely be assumed to be geminal or vicinal and these should be considered first. A series of vicinal coupling constants can be used to construct a chain of the organic compound. The coupling information, if analyzed correctly, offers valuable and reliable information about the structure of a new compound.
IV. Assemblage of Molecular Subunits Methyl and ethyl substituents in an unknown structure can reliably be assigned connectivity to different groups based on their chemical shift values. Since the chemical shifts of peaks in the 1H NMR spectrum are subject to subtle effects of solvent and structure chemical shifts of other protons can be difficult to interpret beyond the order of 0.5 to 1 ppm.
Analysis of peak fragments in Mass Spectrum. Peaks in the mass spectrum can be very helpful in piecing together the molecular subunits found above. For molecules that contain bromine or chlorine atoms, it becomes especially easy to follow the fragments that contain the halogen atom isotopic pattern.
V. Confirmation of Structure The final stage of the analysis involves bringing together all of the data of the unknown compound and confirming that all of the data can be correctly rationalized for the structure proposed.

Exp.#2-13
EXAMPLE UNKNOWN
70 80 90 100 110 130 140 150 160 170 180120 190 200
209211
M •+(M
+2)
210
156
139
111
17412810475
85
100000
200000
300000Example 1 GC-MS
m/e
I. Determination of Molecular Formula (and Unsaturation number) The GC-mass spectrum shows a highest ion pattern at m/e 209 which will be assumed to be M�+. From the intensity of the (M+2)�+ peak, one Cl is clearly present (35Cl 76%, 37Cl 24% nat. abund.). Using the elemental analysis data, the number of C,H,N,S atoms can be obtained:
56.94% x 209 ÷ 12.01 = 9.91 57.74% x 209 ÷ 12.01 = 10.05 � 10 C 3.84% x 209 ÷ 1.01 = 7.95 4.64% x 209 ÷ 1.01 = 9.60 � 8 or 9 H 5.94% x 209 ÷ 14.01 = 0.886 6.74% x 209 ÷ 14.01 = 1.005 � 1 N
The ± 0.4% error does not allow us to figure out exactly how many H atoms are in the molecular formula. However, from the 1H NMR integration, it is clear that there are 8 H. The 13C NMR spectrum shows 10 lines, which is consistent for 10 C if the molecule has no symmetry. Adding up the groups so far, 10 x 12 + 8 x 1 +1 x 14 + 1 x 35 = 177. 209 - 177 = 32. (Note that 35 is used for the mass of the 35Cl isotope corresponding to the larger peak at m/e 209.) The molecular formula is therefore C10H8NO2Cl. Unsaturation # = 10 - 4.5 + 0.5 + 1 = 7.
Molecular Formula & MW
Elemental Anal. calc. obsd.
GC-MS Highest Ion Pattern
1H NMR integration
13C NMR # of lines
C10H8NO2Cl MW 209.64
C 57.34% H 4.24% N 6.34% S 0.0% each ±0.4%
100% 13.0% 36.1% 3.5%M•+
(M+1)•+(M+2)•+
(M+3)•+
209 210 211 212
1:2:1:2:2
10 lines
Exp.#2-14
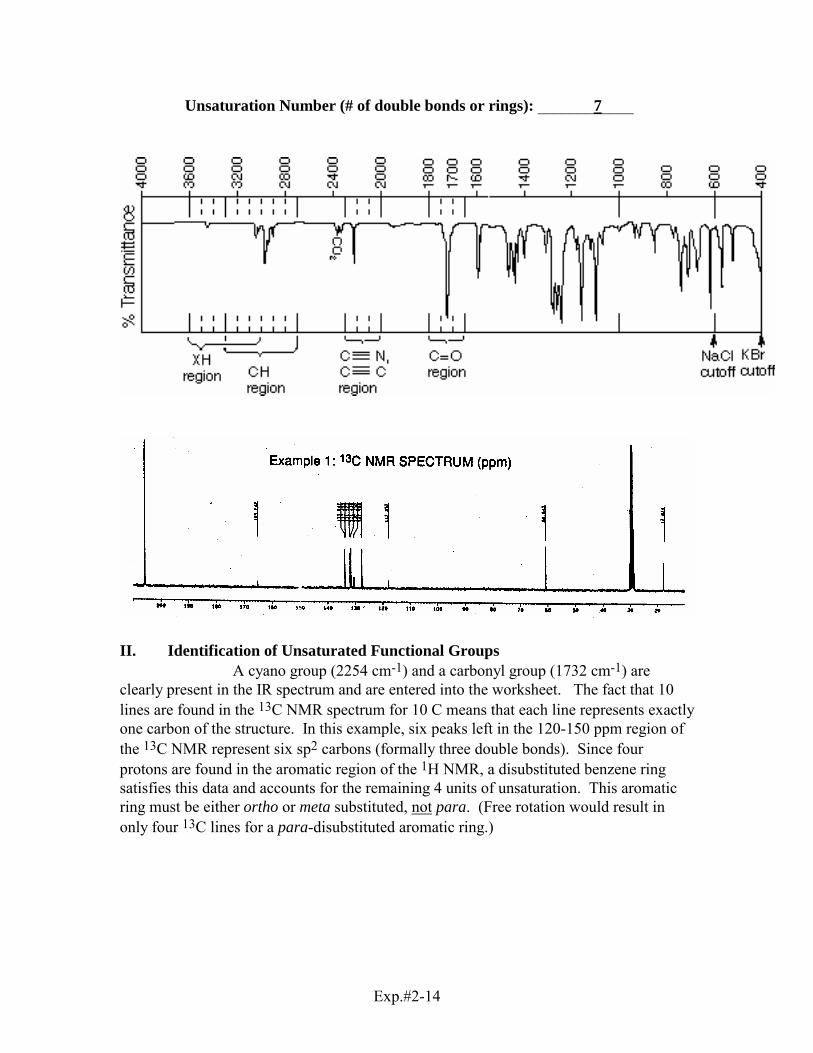
Unsaturation Number (# of double bonds or rings): _______7____
II. Identification of Unsaturated Functional Groups A cyano group (2254 cm-1) and a carbonyl group (1732 cm-1) are clearly present in the IR spectrum and are entered into the worksheet. The fact that 10 lines are found in the 13C NMR spectrum for 10 C means that each line represents exactly one carbon of the structure. In this example, six peaks left in the 120-150 ppm region of the 13C NMR represent six sp2 carbons (formally three double bonds). Since four protons are found in the aromatic region of the 1H NMR, a disubstituted benzene ring satisfies this data and accounts for the remaining 4 units of unsaturation. This aromatic ring must be either ortho or meta substituted, not para. (Free rotation would result in only four 13C lines for a para-disubstituted aromatic ring.)

Exp.#2-15
Unsaturated Functional Group
IR (cm-1)
13C NMR ppm # of lines, #C
1H NMR ppm #H
Unsaturation No. of FG
-C≡N >C=O
X
Y
Xor
Y
2254 1732 ν(CH) 3050
118.0 ppm 1 line = 1 C 165.0 ppm 1 line = 1 C 133.6,133.5, 6 lines = 6C 131.8,131.4, 130 2 127 6
- - - - - - 7.90,7.59, 4H 7.56,7.47
2 1 4
Remaining Molecular Symmetry: None. Remaining Unsaturation: None.
III. Analysis of 1H NMR Coupling patterns In order to figure out whether the aromatic ring is ortho or meta disubstituted, we need to analyze the 1H NMR spectrum carefully. The coupling constants between aromatic protons will tell the relationship of the two protons to each other (Jortho ≈ 6-8 Hz, Jmeta ≈ 2 Hz, Jpara < 1 Hz). Careful analysis of the three ddd patterns leads to the numerical coupling constants shown in the table. Next, as many of the coupling constants are matched (within a ± 0.2 Hz error allowance) as possible. Protons that share a common coupling constant are assigned as coupled to each other by that coupling constant. Hb is coupled to Hd with J = 7.0 Hz so Hb and Hd are ortho to each other. Since Hb also has a J = 8.0 Hz coupling constant, another proton is also ortho to Hb. Same thing for Hd. Therefore, the aromatic ring is ortho-disubstituted and the proton assignments are as shown below.
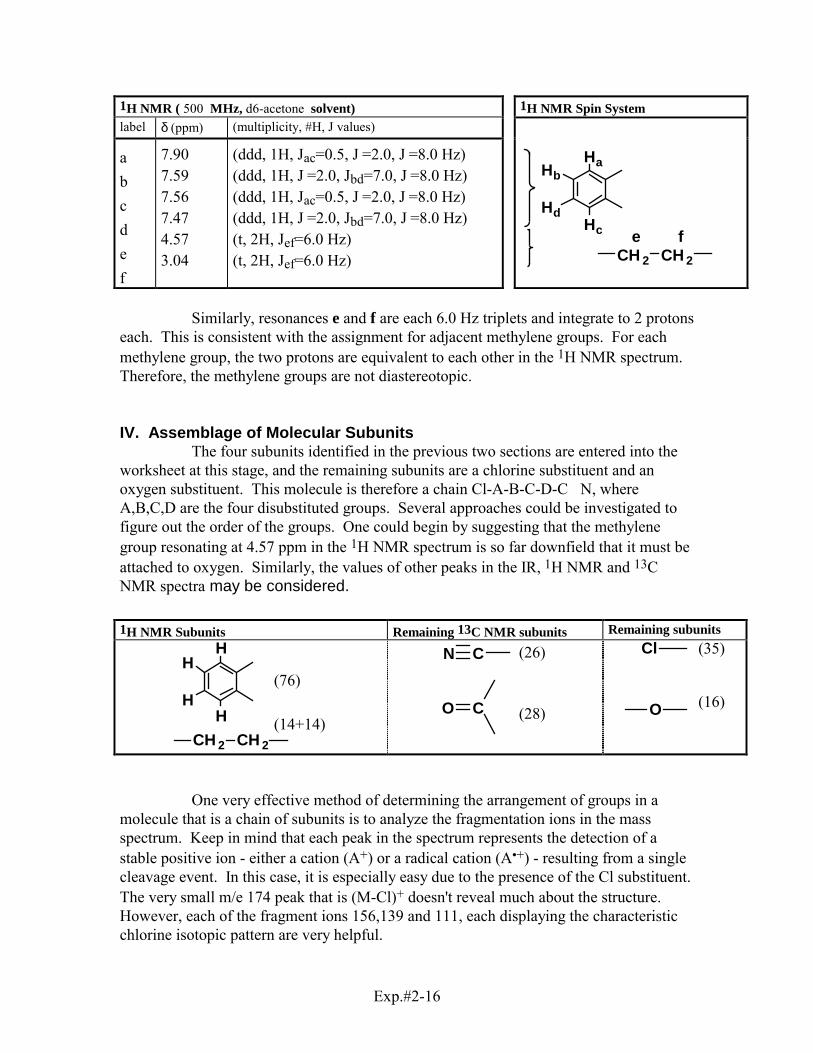
Exp.#2-16
1H NMR ( 500 MHz, d6-acetone solvent) 1H NMR Spin System label δ (ppm) (multiplicity, #H, J values)
a b c d e f
7.90 7.59 7.56 7.47 4.57 3.04
(ddd, 1H, Jac=0.5, J =2.0, J =8.0 Hz) (ddd, 1H, J =2.0, Jbd=7.0, J =8.0 Hz) (ddd, 1H, Jac=0.5, J =2.0, J =8.0 Hz) (ddd, 1H, J =2.0, Jbd=7.0, J =8.0 Hz) (t, 2H, Jef=6.0 Hz) (t, 2H, Jef=6.0 Hz)
Ha
HdHc
Hb
CH 2 CH 2
e f
Similarly, resonances e and f are each 6.0 Hz triplets and integrate to 2 protons each. This is consistent with the assignment for adjacent methylene groups. For each methylene group, the two protons are equivalent to each other in the 1H NMR spectrum. Therefore, the methylene groups are not diastereotopic. IV. Assemblage of Molecular Subunits The four subunits identified in the previous two sections are entered into the worksheet at this stage, and the remaining subunits are a chlorine substituent and an oxygen substituent. This molecule is therefore a chain Cl-A-B-C-D-C�N, where A,B,C,D are the four disubstituted groups. Several approaches could be investigated to figure out the order of the groups. One could begin by suggesting that the methylene group resonating at 4.57 ppm in the 1H NMR spectrum is so far downfield that it must be attached to oxygen. Similarly, the values of other peaks in the IR, 1H NMR and 13C NMR spectra may be considered. 1H NMR Subunits Remaining 13C NMR subunits Remaining subunits
H
HH
H
CH 2 CH 2
(76)
(14+14)
CN
CO
(26)
(28)
Cl
O
(35)
(16)
One very effective method of determining the arrangement of groups in a molecule that is a chain of subunits is to analyze the fragmentation ions in the mass spectrum. Keep in mind that each peak in the spectrum represents the detection of a stable positive ion - either a cation (A+) or a radical cation (A�+) - resulting from a single cleavage event. In this case, it is especially easy due to the presence of the Cl substituent. The very small m/e 174 peak that is (M-Cl)+ doesn't reveal much about the structure. However, each of the fragment ions 156,139 and 111, each displaying the characteristic chlorine isotopic pattern are very helpful.
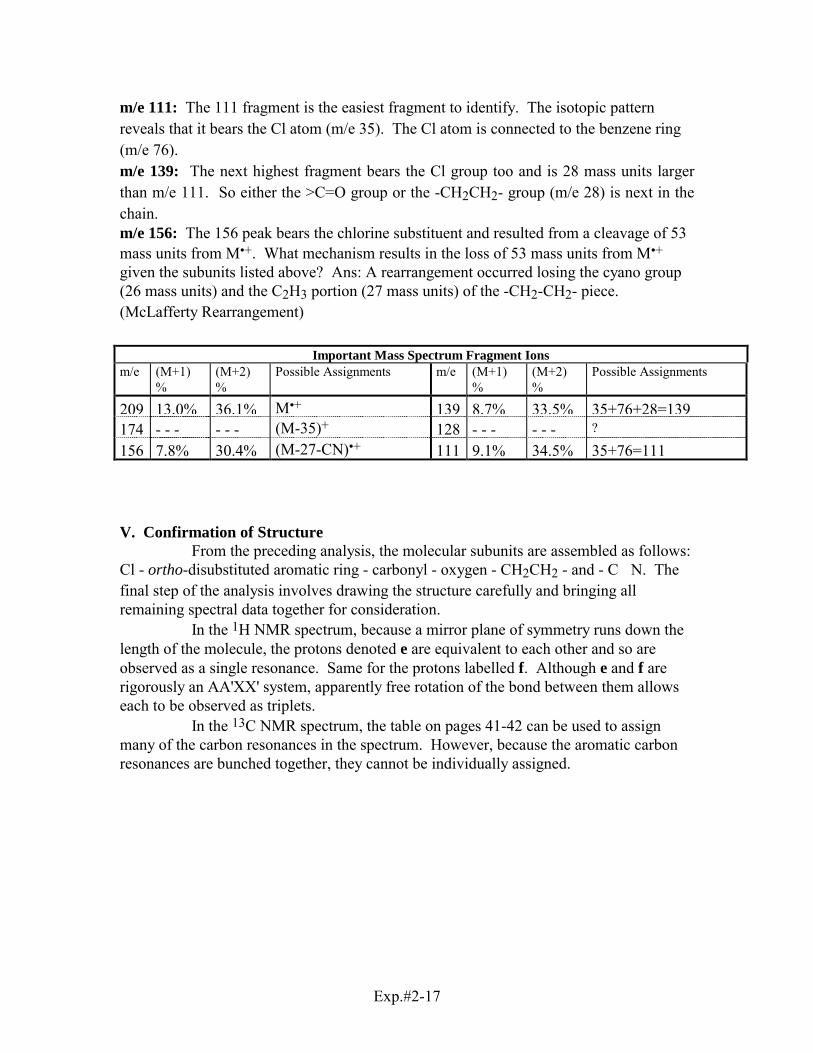
Exp.#2-17
m/e 111: The 111 fragment is the easiest fragment to identify. The isotopic pattern reveals that it bears the Cl atom (m/e 35). The Cl atom is connected to the benzene ring (m/e 76). m/e 139: The next highest fragment bears the Cl group too and is 28 mass units larger than m/e 111. So either the >C=O group or the -CH2CH2- group (m/e 28) is next in the chain. m/e 156: The 156 peak bears the chlorine substituent and resulted from a cleavage of 53 mass units from M�+. What mechanism results in the loss of 53 mass units from M�+ given the subunits listed above? Ans: A rearrangement occurred losing the cyano group (26 mass units) and the C2H3 portion (27 mass units) of the -CH2-CH2- piece. (McLafferty Rearrangement)
Important Mass Spectrum Fragment Ions
m/e (M+1) %
(M+2) %
Possible Assignments m/e (M+1) %
(M+2) %
Possible Assignments
209 13.0% 36.1% M�+ 139 8.7% 33.5% 35+76+28=139174 - - - - - - (M-35)+ 128 - - - - - - ?
156 7.8% 30.4% (M-27-CN)�+ 111 9.1% 34.5% 35+76=111
V. Confirmation of Structure From the preceding analysis, the molecular subunits are assembled as follows: Cl - ortho-disubstituted aromatic ring - carbonyl - oxygen - CH2CH2 - and - C�N. The final step of the analysis involves drawing the structure carefully and bringing all remaining spectral data together for consideration. In the 1H NMR spectrum, because a mirror plane of symmetry runs down the length of the molecule, the protons denoted e are equivalent to each other and so are observed as a single resonance. Same for the protons labelled f. Although e and f are rigorously an AA'XX' system, apparently free rotation of the bond between them allows each to be observed as triplets. In the 13C NMR spectrum, the table on pages 41-42 can be used to assign many of the carbon resonances in the spectrum. However, because the aromatic carbon resonances are bunched together, they cannot be individually assigned.

Exp.#2-18
Cl
OC
CC
O
C N
H H
HHHa
Hb
Hd
Hc
e
f Cl
OC
CH 2CH 2
O
C N165.0
133.6 133.5 131.8 131.4 130.2 127.6
Aromatic C's 60.6
17.9
118.0
1H NMR Assignments 13C NMR Assignments
For the mass spectrum, it is good practice to draw the mechanism for two or more of the prominent peaks in the spectrum. Shown below is the McLafferty Rearrangement that leads to the peak at m/e 156 and the 37Cl isotope peak at m/e 158.
••
+ •+•••
•
••
+
M•+ = 209
O
CHOCH 2CNH
O
CHOCH 2CN
H
OCH 2
CH
O CH 2CNH
A•+ = 156
H ~
B
α ~
Cl Cl
Cl
M = 209
O
CH 2OCH 2CN
Cl
- e-

Exp.#2-19
FIRST REPORT
RESULTS (5 points) Discuss the relative polarity of the two compounds and any other information learned about the compounds based on TLC analysis and acid/base extraction. Briefly describe the separation of the two components of your mixture. Describe the conditions used for the purification of each of the compounds including solvents used for recrystallization, temperatures, etc. Report the melting point and melting range of each purified compound and use this as well as TLC to assess the purity of the compounds. QUESTIONS (5 points). You will find out the structure of three compounds based on spectral information provided.
FINAL REPORT Briefly describe the procedure used for the separation and purification of each of the two components of your unknown mixture. Include the conditions used for recrystallization as well as the % recovery from recrystallization. Discuss the evidence for purity based on TLC, melting point analysis and 1H NMR.
Identification of Acid Unknown Present the spectral data obtained for your acid unknown. Tabulate the features of the 1H NMR spectrum. Locate in reference (2) above the table of known compounds with the functional groups of your acid unknown from the tables containing carboxylic acids or phenols. Tabulate in your report the names and structures of all compounds with melting points within 6° of your acid or base unknown. Eliminate as many structures as possible on the basis of your accumulated data (explain your reasoning). Describe the preparation of the derivative which you carried out to confirm the structure of your unknown.
Identification of Neutral Unknown Present the spectral data obtained for your neutral unknown. For each spectrum, note such important experimental conditions as the solvent in which they were taken, and point out any features that are believed to be artifacts or impurities. For the 1H NMR spectrum, tabulate the features of the spectrum including integrations, multiplicities and coupling constants (where possible). For the 13C NMR spectrum, tabulate the peaks for the spectrum and note the solvent and position of the solvent peaks. Similarly present the results of the IR, GC-MS spectra in a tabular fashion. Describe in a general sense how each of the spectroscopic methods is most powerful for the analysis of unknowns, i.e. detection of certain elements, determination of molecular weight, determination of molecular formula, sensitivity to symmetry, electronic effects, etc. Proceed to determine the molecular formula of your neutral unknown. Describe how each of the methods 1H NMR, 13C NMR, elemental analysis and GC-MS can be valuable in this effort - and what their possible shortcomings can be. Ultimately your molecular formula must be compatible with all of these.

Exp.#2-20
Deduce the structure of your neutral unknown. Discuss your reasoning in detail.. Show on separate structures of your unknown your assignments of the proton and 13C resonances. Valuable insight concerning the interpretation of 1H NMR spectra may be obtained by inspection of molecular models of proposed structures. Make assignments of the prominent peaks in the IR spectrum. Also show how one or more of the fragmentation patterns in the mass spectrum are consistent with your structure. All of these methods will be valuable in determining the structure of your neutral unknown. If it was necessary to perform a functional group classification test, describe how this supports your proposed structure. Submit to your TA each purified unknown so that its purity, mp, etc. can be checked.

Exp.#2-21
NEUTRAL UNKNOWN WORKSHEET Molecular Formula & MW
Elemental Anal. calc. obsd.
GC-MS Highest Ion Pattern
1H NMR integration
13C NMR # of lines
Unsaturation Number (# of double bonds or rings):______________ Unsaturated Functional Group
IR (cm-1)
13C NMR ppm # of lines, #C
1H NMR ppm #H
Unsaturation No. of FG
Remaining Molecular Symmetry: Remaining Unsaturation: 1H NMR ( MHz, solvent) 1H NMR Spin System label δ (ppm) (multiplicity, #H, J values)
Exp.#2-22
Subunits Remaining 13C NMR subunits Remaining subunits
Important Mass Spectrum Fragment Ions m/e (M+1)
% (M+2) %
Possible Assignments m/e (M+1) %
(M+2) %
Possible Assignments
Assembled Subunits Reasoning

Exp.#2-23
Structure of Unknown showing 1H NMR and 13C NMR assignments
Mass Spectral Fragmentation Mechanisms