Mass Spectrometric Discovery and Selective Reaction Monitoring (SRM) of Putative Protein Biomarker...
10
Mass Spectrometric Discovery and Selective Reaction Monitoring (SRM) of Putative Protein Biomarker Candidates in First Trimester Trisomy 21 Maternal Serum Mary F Lopez,* ,† Ramesh Kuppusamy, ‡ David A Sarracino, † Amol Prakash, † Michael Athanas, § Bryan Krastins, † Taha Rezai, † Jennifer N Sutton, † Scott Peterman, † and Kypros Nicolaides ‡ ThermoFisher Scientific BRIMS, 790 Memorial Drive, Cambridge, Massachusetts 02139, VAST Scientific, 790 Memorial Drive, Cambridge, Massachusetts 02139, and Fetal Medicine Foundation, 137 Harley Street, London, United Kingdom W1G 6BG Received February 18, 2010 The accurate diagnosis of Trisomy 21 requires invasive procedures that carry a risk of miscarriage. The current state-of-the-art maternal serum screening tests measure levels of PAPP-A, free bhCG, AFP, and uE3 in various combinations with a maximum sensitivity of 60-75% and a false positive rate of 5%. There is currently an unmet need for noninvasive screening tests with high selectivity that can detect pregnancies at risk, preferably within the first trimester. The aim of this study was to apply proteomics and mass spectrometry techniques for the discovery of new putative biomarkers for Trisomy 21 in first trimester maternal serum coupled with the immediate development of quantitative selective reaction monitoring (SRM) assays. The results of the novel workflow were 2-fold: (1) we identified a list of differentially expressed proteins in Trisomy21 vs Normal samples, including PAPP-A, and (2) we developed a multiplexed, high-throughput SRM assay for verification of 12 new putative markers identified in the discovery experiments. To narrow down the initial large list of differentially expressed candidates resulting from the discovery experiments, we incorporated receiver operating characteristic (ROC) curve algorithms early in the data analysis process. We believe this approach provides a substantial advantage in sifting through the large and complex data typically obtained from discovery experiments. The workflow efficiently mined information derived from high-resolution LC-MS/MS discovery data for the seamless construction of rapid, targeted assays that were performed on unfractionated serum digests. The SRM assay lower limit of detection (LLOD) for the target peptides in a background of digested serum matrix was approximately 250-500 attomoles on column and the limit of accurate quantitation (LOQ) was approximately 1-5 femtomoles on column. The assay error as determined by coefficient of variation at LOQ and above ranged from 0 to 16%. The workflow developed in this study bridges the gap between proteomic biomarker discovery and translation into a clinical research environment. Specifically, for Trisomy 21, the described multiplexed SRM assay provides a vehicle for high-throughput verification of these, and potentially other, peptide candidates on larger sample cohorts. Keywords: biomarker • discovery • Trisomy 21 • SRM assay • mass spectrometry • proteomics Introduction Women over 35 years old constitute about 15% of pregnan- cies in most developed countries worldwide. The risk for many chromosomal defects in fetal development increases with maternal age. Down’s Syndrome (DS) occurs at a rate of 1 in 600-800 pregnancies and prompts most prenatal diagnoses that involve invasive procedures such as amniocentesis or chorionic villous sampling. These procedures carry a risk of miscarriage and therefore are only applied to women in high risk groups. 1,2 Over the past several years, there has been an effort to develop less invasive screening methods that can identify aneuploidy early in the pregnancy. Maternal blood tests that measure serum protein markers associated with DS such as free b-hCG, PAPP-A, alpha fetoprotein and inhibin A, combined with the measurement of nuchal translucency, have garnered increased acceptance for first trimester screening 3 but the sensitivity and specificity of these markers could still be improved. Previous proteomic studies have identified a variety of other putative serum markers. 4-6 In the most recent study, the authors employed a combination of immunodepletion of high-abundance proteins coupled with quantitative mass * To whom correspondence should be addressed. Mary F Lopez, PhD., Director, BRIMS, Thermo Fisher Scientific, 790 Memorial Dr., Cambridge, MA 02139, Cell Ph: 617 834 1862, Fax: 617 225 0935 Email: mary.lopez@ thermofisher.com. † ThermoFisher Scientific BRIMS. ‡ Fetal Medicine Foundation. § VAST Scientific. 10.1021/pr100153j 2011 American Chemical Society Journal of Proteome Research 2011, 10, 133–142 133 Published on Web 05/25/2010
Transcript of Mass Spectrometric Discovery and Selective Reaction Monitoring (SRM) of Putative Protein Biomarker...

Mass Spectrometric Discovery and Selective Reaction Monitoring
(SRM) of Putative Protein Biomarker Candidates in First Trimester
Trisomy 21 Maternal Serum
Mary F Lopez,*,† Ramesh Kuppusamy,‡ David A Sarracino,† Amol Prakash,† Michael Athanas,§
Bryan Krastins,† Taha Rezai,† Jennifer N Sutton,† Scott Peterman,† and Kypros Nicolaides‡
ThermoFisher Scientific BRIMS, 790 Memorial Drive, Cambridge, Massachusetts 02139, VAST Scientific,790 Memorial Drive, Cambridge, Massachusetts 02139, and Fetal Medicine Foundation, 137 Harley Street,
London, United Kingdom W1G 6BG
Received February 18, 2010
The accurate diagnosis of Trisomy 21 requires invasive procedures that carry a risk of miscarriage.The current state-of-the-art maternal serum screening tests measure levels of PAPP-A, free bhCG, AFP,and uE3 in various combinations with a maximum sensitivity of 60-75% and a false positive rate of5%. There is currently an unmet need for noninvasive screening tests with high selectivity that candetect pregnancies at risk, preferably within the first trimester. The aim of this study was to applyproteomics and mass spectrometry techniques for the discovery of new putative biomarkers for Trisomy21 in first trimester maternal serum coupled with the immediate development of quantitative selectivereaction monitoring (SRM) assays. The results of the novel workflow were 2-fold: (1) we identified alist of differentially expressed proteins in Trisomy21 vs Normal samples, including PAPP-A, and (2) wedeveloped a multiplexed, high-throughput SRM assay for verification of 12 new putative markersidentified in the discovery experiments. To narrow down the initial large list of differentially expressedcandidates resulting from the discovery experiments, we incorporated receiver operating characteristic(ROC) curve algorithms early in the data analysis process. We believe this approach provides asubstantial advantage in sifting through the large and complex data typically obtained from discoveryexperiments. The workflow efficiently mined information derived from high-resolution LC-MS/MSdiscovery data for the seamless construction of rapid, targeted assays that were performed onunfractionated serum digests. The SRM assay lower limit of detection (LLOD) for the target peptides ina background of digested serum matrix was approximately 250-500 attomoles on column and thelimit of accurate quantitation (LOQ) was approximately 1-5 femtomoles on column. The assay erroras determined by coefficient of variation at LOQ and above ranged from 0 to 16%. The workflowdeveloped in this study bridges the gap between proteomic biomarker discovery and translation intoa clinical research environment. Specifically, for Trisomy 21, the described multiplexed SRM assayprovides a vehicle for high-throughput verification of these, and potentially other, peptide candidateson larger sample cohorts.
Keywords: biomarker • discovery • Trisomy 21 • SRM assay • mass spectrometry • proteomics
Introduction
Women over 35 years old constitute about 15% of pregnan-cies in most developed countries worldwide. The risk for manychromosomal defects in fetal development increases withmaternal age. Down’s Syndrome (DS) occurs at a rate of 1 in600-800 pregnancies and prompts most prenatal diagnosesthat involve invasive procedures such as amniocentesis or
chorionic villous sampling. These procedures carry a risk ofmiscarriage and therefore are only applied to women in highrisk groups.1,2 Over the past several years, there has been aneffort to develop less invasive screening methods that canidentify aneuploidy early in the pregnancy. Maternal blood teststhat measure serum protein markers associated with DS suchas free b-hCG, PAPP-A, alpha fetoprotein and inhibin A,combined with the measurement of nuchal translucency, havegarnered increased acceptance for first trimester screening3 butthe sensitivity and specificity of these markers could still beimproved. Previous proteomic studies have identified a varietyof other putative serum markers.4-6 In the most recent study,the authors employed a combination of immunodepletion ofhigh-abundance proteins coupled with quantitative mass
* To whom correspondence should be addressed. Mary F Lopez, PhD.,Director, BRIMS, Thermo Fisher Scientific, 790 Memorial Dr., Cambridge,MA 02139, Cell Ph: 617 834 1862, Fax: 617 225 0935 Email: [email protected].
† ThermoFisher Scientific BRIMS.‡ Fetal Medicine Foundation.§ VAST Scientific.
10.1021/pr100153j 2011 American Chemical Society Journal of Proteome Research 2011, 10, 133–142 133Published on Web 05/25/2010
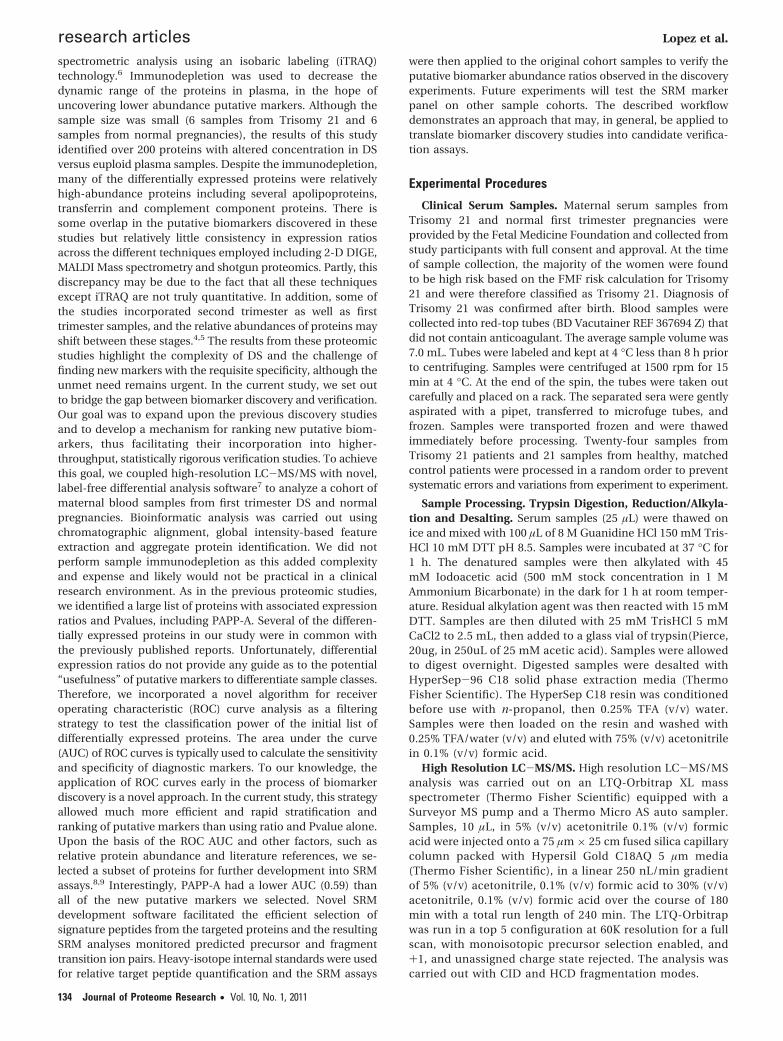
spectrometric analysis using an isobaric labeling (iTRAQ)technology.6 Immunodepletion was used to decrease thedynamic range of the proteins in plasma, in the hope ofuncovering lower abundance putative markers. Although thesample size was small (6 samples from Trisomy 21 and 6samples from normal pregnancies), the results of this studyidentified over 200 proteins with altered concentration in DSversus euploid plasma samples. Despite the immunodepletion,many of the differentially expressed proteins were relativelyhigh-abundance proteins including several apolipoproteins,transferrin and complement component proteins. There issome overlap in the putative biomarkers discovered in thesestudies but relatively little consistency in expression ratiosacross the different techniques employed including 2-D DIGE,MALDI Mass spectrometry and shotgun proteomics. Partly, thisdiscrepancy may be due to the fact that all these techniquesexcept iTRAQ are not truly quantitative. In addition, some ofthe studies incorporated second trimester as well as firsttrimester samples, and the relative abundances of proteins mayshift between these stages.4,5 The results from these proteomicstudies highlight the complexity of DS and the challenge offinding new markers with the requisite specificity, although theunmet need remains urgent. In the current study, we set outto bridge the gap between biomarker discovery and verification.Our goal was to expand upon the previous discovery studiesand to develop a mechanism for ranking new putative biom-arkers, thus facilitating their incorporation into higher-throughput, statistically rigorous verification studies. To achievethis goal, we coupled high-resolution LC-MS/MS with novel,label-free differential analysis software7 to analyze a cohort ofmaternal blood samples from first trimester DS and normalpregnancies. Bioinformatic analysis was carried out usingchromatographic alignment, global intensity-based featureextraction and aggregate protein identification. We did notperform sample immunodepletion as this added complexityand expense and likely would not be practical in a clinicalresearch environment. As in the previous proteomic studies,we identified a large list of proteins with associated expressionratios and Pvalues, including PAPP-A. Several of the differen-tially expressed proteins in our study were in common withthe previously published reports. Unfortunately, differentialexpression ratios do not provide any guide as to the potential“usefulness” of putative markers to differentiate sample classes.Therefore, we incorporated a novel algorithm for receiveroperating characteristic (ROC) curve analysis as a filteringstrategy to test the classification power of the initial list ofdifferentially expressed proteins. The area under the curve(AUC) of ROC curves is typically used to calculate the sensitivityand specificity of diagnostic markers. To our knowledge, theapplication of ROC curves early in the process of biomarkerdiscovery is a novel approach. In the current study, this strategyallowed much more efficient and rapid stratification andranking of putative markers than using ratio and Pvalue alone.Upon the basis of the ROC AUC and other factors, such asrelative protein abundance and literature references, we se-lected a subset of proteins for further development into SRMassays.8,9 Interestingly, PAPP-A had a lower AUC (0.59) thanall of the new putative markers we selected. Novel SRMdevelopment software facilitated the efficient selection ofsignature peptides from the targeted proteins and the resultingSRM analyses monitored predicted precursor and fragmenttransition ion pairs. Heavy-isotope internal standards were usedfor relative target peptide quantification and the SRM assays
were then applied to the original cohort samples to verify theputative biomarker abundance ratios observed in the discoveryexperiments. Future experiments will test the SRM markerpanel on other sample cohorts. The described workflowdemonstrates an approach that may, in general, be applied totranslate biomarker discovery studies into candidate verifica-tion assays.
Experimental Procedures
Clinical Serum Samples. Maternal serum samples fromTrisomy 21 and normal first trimester pregnancies wereprovided by the Fetal Medicine Foundation and collected fromstudy participants with full consent and approval. At the timeof sample collection, the majority of the women were foundto be high risk based on the FMF risk calculation for Trisomy21 and were therefore classified as Trisomy 21. Diagnosis ofTrisomy 21 was confirmed after birth. Blood samples werecollected into red-top tubes (BD Vacutainer REF 367694 Z) thatdid not contain anticoagulant. The average sample volume was7.0 mL. Tubes were labeled and kept at 4 °C less than 8 h priorto centrifuging. Samples were centrifuged at 1500 rpm for 15min at 4 °C. At the end of the spin, the tubes were taken outcarefully and placed on a rack. The separated sera were gentlyaspirated with a pipet, transferred to microfuge tubes, andfrozen. Samples were transported frozen and were thawedimmediately before processing. Twenty-four samples fromTrisomy 21 patients and 21 samples from healthy, matchedcontrol patients were processed in a random order to preventsystematic errors and variations from experiment to experiment.
Sample Processing. Trypsin Digestion, Reduction/Alkyla-tion and Desalting. Serum samples (25 µL) were thawed onice and mixed with 100 µL of 8 M Guanidine HCl 150 mM Tris-HCl 10 mM DTT pH 8.5. Samples were incubated at 37 °C for1 h. The denatured samples were then alkylated with 45mM Iodoacetic acid (500 mM stock concentration in 1 MAmmonium Bicarbonate) in the dark for 1 h at room temper-ature. Residual alkylation agent was then reacted with 15 mMDTT. Samples are then diluted with 25 mM TrisHCl 5 mMCaCl2 to 2.5 mL, then added to a glass vial of trypsin(Pierce,20ug, in 250uL of 25 mM acetic acid). Samples were allowedto digest overnight. Digested samples were desalted withHyperSep-96 C18 solid phase extraction media (ThermoFisher Scientific). The HyperSep C18 resin was conditionedbefore use with n-propanol, then 0.25% TFA (v/v) water.Samples were then loaded on the resin and washed with0.25% TFA/water (v/v) and eluted with 75% (v/v) acetonitrilein 0.1% (v/v) formic acid.
High Resolution LC-MS/MS. High resolution LC-MS/MSanalysis was carried out on an LTQ-Orbitrap XL massspectrometer (Thermo Fisher Scientific) equipped with aSurveyor MS pump and a Thermo Micro AS auto sampler.Samples, 10 µL, in 5% (v/v) acetonitrile 0.1% (v/v) formicacid were injected onto a 75 µm × 25 cm fused silica capillarycolumn packed with Hypersil Gold C18AQ 5 µm media(Thermo Fisher Scientific), in a linear 250 nL/min gradientof 5% (v/v) acetonitrile, 0.1% (v/v) formic acid to 30% (v/v)acetonitrile, 0.1% (v/v) formic acid over the course of 180min with a total run length of 240 min. The LTQ-Orbitrapwas run in a top 5 configuration at 60K resolution for a fullscan, with monoisotopic precursor selection enabled, and+1, and unassigned charge state rejected. The analysis wascarried out with CID and HCD fragmentation modes.
research articles Lopez et al.
134 Journal of Proteome Research • Vol. 10, No. 1, 2011

Label-Free Differential Analysis, Protein Identificationand Receiver Operating Characteristic (ROC) Analysis. Label-free differential analysis, protein identification and peaklistgeneration were performed using the SIEVE v.1.2.1 (ThermoFisher Scientific) algorithm7 incorporating the SEQUEST v.28search engine,10 Percolator11 and a novel algorithm for clas-sification incorporating ROC curves.12 The iterative workflowincluded chromatographic alignment, global intensity-basedfeature extraction and aggregate protein identification assign-ment. Chromatographic alignment was based upon pairwiseMS full scan comparison of all experimental MS runs withrespect to a chosen reference MS run. Subsequent to chro-matographic alignment, potentially interesting features wereexposed based upon high-intensity peaks found in the alignedcollective data set. Individually, these peaks defined frames, iewell-defined rectangular regions in the full scan (M/Z vsretention time) plane. Reconstructed ion chromatograms werecalculated for each frame to assess relative expression ratiosand supporting statistics. After framing, MS2 fragment scansassociated with each frame were processed with SEQUEST10
and peptide quality scores were derived by processing againstdecoy shuffled databases using Percolator.11
Peptides assessed with less than 2% estimated false discoveryrate were retained and a consensus protein report was con-structed by statistically aggregating frame information toconstruct peptides and peptide information to build proteins(see Supplementary Table 1 for the complete list of identifiedproteins). The ROC curves were created by calculating the truepositive (TP) rate (sensitivity) and the false positive (FP) rate(100-specificity) to differentiate the two populations. For theROC plots in this study, the FPs and TPs were tabulated asthe criteria threshold was swept across both of the curves. Thecutoff point or threshold used to discriminate the two popula-tions was used to construct the ROC curves.
SEQUEST search parameters included the following:
1. Allowed missed cleavages: 3
2. Fixed modifications: 1 (C)
3. Variable modifications: 1 (M)
4. Mass tolerance for precursor ions: 25 ppm
5. Mass tolerance for fragment ions: 0.5 Da
6. Database searched: ipi human v361 processed database
7. Number of protein entries in the database actuallysearched: 82 806
8. Cut off score value for accepting individual MS/MSspectra: 2% FDR
9. Justification of the threshold: Percolator recommendedvalue
Individual MS/MS spectra with ion assignments for singlepeptide identifications are provided in Supplementary Data File1 (Supporting Information).
Upon the basis of the MS1 peak areas from the variousLC-MS/MS runs, SIEVE identified proteins that discriminatedthe biological groups. For this implementation, the true positiveand the false positive rates at any chosen threshold value ofcorresponding protein abundance were plotted to generate theROC curve. The area under the curve (AUC) was then used toclassify the candidate peptides. While many other statisticaltools are commonly used to identify putative biomarkers,13 wefind that AUC is particularly robust in a large study such asthis one where a high degree of biological variance is evident.In these cases, values such as expression ratios and p-valuesof the t test are highly sensitive to outliers.
SRM Assays. SRM assays were developed on a Vantage triplequadrupole mass spectrometer, Surveyor MS pump, CTC PALAutosampler and an IonMax Source equipped with a high flowmetal needle (Thermo Fisher Scientific). Reverse phase separa-tions were carried out in a 9 min linear gradient from 5 to 30%B, with a total run time of 15 min (Solvent A ) Water 0.2% FA,Solvent B ) ACN 0.2% FA). The flow rate during the lineargradient was set to 160 µL/min. The total injection volume was20 µL for all samples and points on the curve. A 50 mm ×1mm 1.9 µm Hypersil Gold column was run at a temperature of50 °C. There were three technical replicates per sample.
Calibration Curve Generation. Calibration curves werecreated with a pool of all samples as a background matrix. Eachpoint on the calibration curve (and every sample analyzed)included 100 fmol of heavy labeled peptides. The amount ofbackground matrix on column was 30 µg for each point on thecalibration curve, as well as in all analyzed samples. In addition,all samples were brought up in a solution of 200 µg/mL ofglucagon in 97% Water 3% ACN and 0.2% FA to minimizebinding to plastic surfaces.
Choice of Peptides and Transitions. The obtained retentiontime information from the discovery MS experiments wasimported into Pinpoint to build a preliminary scheduled SRMmethod for optimization. To accomplish this, individual instru-ment parameters such as collision energy, tube lens, dwell timeand predicted retention times were automatically tested forevery transition. After multiple iterations, the optimized, (i.e.,highest intensity signal and least overlap with other transitions),list of peptides and transitions were finalized and one proteo-typic peptide15 and several fragment transitions were chosenfor each protein, (see Supplementary Table 2 for a list of allpeptides and transitions, Supporting Information), for a totalof 12 peptides, both light and heavy-labeled, totaling 191transitions. Figure 6a shows the distribution of these transitionsover the gradient illustrating the benefit of scheduling. Thistechnology ensured high quantitative data quality because nomore than 64 transitions are monitored across any part of thegradient.
The decision to limit the number of peptides from eachprotein to one was based on two factors: (1) multiple peptidesmight quantify different isoforms of the same protein therebyproducing conflicting results and our goal was to monitor themost common isoform (and hence the most abundant peptide),and (2) the choice of a nonredundant peptide sequence andits characterization using a synthetic standard with multiple,coeluting transitions ensured the verification of peptide identity(eliminating interferences) and thus its validity as a surrogatefor the target protein.
Pinpoint software (Thermo Fisher Scientific) was used fortargeted protein quantitation (Figure 1). Peptides were identi-fied by coeluting light and heavy-labeled transitions in thechromatographic separation. For additional verification andelimination of interferences, the transition ratios were con-firmed using discovery spectra. Time alignment and relativequantification of the transitions were performed with Pinpoint.All clinical samples were assayed in triplicate.
t-SRM (Scheduling of SRMs). Transitions were scheduledbased on the retention time observed in the discovery experi-ments. In the first iteration, a window of (1 min (around themapped discovery retention time, see Figure 3), was used toschedule the various transitions. In the next iteration, a windowof (0.5 min (around the observed retention time) was used toschedule the transitions. The choice of the window size was
SRM Assay Development of Trisomy 21 Biomarker Candidates research articles
Journal of Proteome Research • Vol. 10, No. 1, 2011 135

based upon the error rates that are typically seen in the twosteps. Over the course of multiple iterative serum runs, theretention times varied by less than 10 s or <2% of the gradientlength. The corresponding start and end times for the varioustransitions are stated in Supplementary Table 2 (SupportingInformation).
Light and Heavy-Labeled Peptides. Light and heavy versionsof each target peptide were synthesized (Thermo FisherScientific, Ulm Germany). Heavy peptides had identical se-quences to the light peptides, but the C-terminal Lysine orArginine was fully labeled (>98.5%) with 13C or 15N,14 seeSupplementary Table 2 for peptide sequences (SupportingInformation). The peptides were high purity (>97%) allowingus to confidently characterize their ionization, elution andfragmentation characteristics, therefore facilitating optimizationof the SRM assay.
Ingenuity Pathway Analysis. Protein interactions and path-ways were analyzed using the Ingenuity Pathway Analysis (IPA)software and database (Ingenuity Systems, Redwood City, CA).Ingenuity’s knowledge base is created by manual curation ofthe scientific literature supported by experimental results thatare structured into an ontological relational database. Weanalyzed a data set of 378 proteins generated from thedifferential expression discovery analysis using SIEVE software.The data set was imported directly into IPA for a Core analysis.For IPA network analysis, direct interactions between themolecules were analyzed.
Results
Figure 1 illustrates a mass spectrometry-driven workflowlinking unbiased biomarker discovery with the developmentof targeted assays. This strategy facilitates the high-throughputverification of large lists of putative biomarkers in an efficient
and rapid manner. Inherent to the success of the workflow isthe similarity of peptide ion fragmentation behavior in trap andtriple quadrupole instruments. Figure 2 demonstrates thecorrespondence between fragment ion intensities in CID andfragmentation spectra generated an LTQ linear ion trap andtriple quadrupole mass spectrometers, respectively. This cor-respondence holds true for different triple quadrupole instru-ments such as TSQ Quantum (Figure 2) and Vantage (used inthis study) because the instruments are identical with respectto Q1, Q2 and Q3 and the high energy collision dissociation(HCD) mode. Therefore, fragmentation is expected to beidentical. As is evident from the figure, major fragment ionintensities are closely correlated allowing the data generatedin discovery experiments with SIEVE software to be mined forthe optimization of SRM assay development using Pinpointsoftware. Although algorithms can be used to predict uniquepeptides and SRM transitions (in the absence of empiricaldiscovery data), this hypothetical approach provides no assur-ance that the peptides will actually be detected in the sample.Therefore, the optimal approach, in our hands, was to utilizeMS/MS spectra from LC MS/MS discovery experiments toenhance the design of effective SRM assays for putativebiomarker verification. Furthermore, development of a com-prehensive SRM method for multiple peptides and transitionsrequired efficient scheduling of peptides and transitions acrossthe LC gradient. In order to extrapolate elution behavior ofpeptides from the discovery LC workflow to the targeted LCworkflow, 10 heavy peptides were spiked into samples and runon both platforms (discovery hybrid trap and targeted triplequadrupole, see methods section). The observed retentiontimes obtained with both systems were used to generate aretention time plot comparing the linearity of the discoveryLC versus the targeted LC workflows (Figure 3). The high R2
value (0.93) demonstrated the strong correlation between thetwo workflows thereby ensuring the feasibility of predictivescheduling.
Analysis of High Resolution MS2 Data by SIEVE. Individualsamples were processed and subjected to nanospray high-resolution LC-MS/MS and the resulting RAW mass spectralfiles were analyzed with SIEVE as described in the methods.
In order to generate a “short list” of putative biomarkers forfurther verification and development into SRM assays the ROCplots and AUC values for every peptide created by SIEVE wereevaluated. Figure 4 represents a screen capture of the proteinreport for one such differentially expressed protein, SerumAmyloid 4 (SA4). Figure 4, top panel, shows the integratedintensities for the peptide EALQGVGDMGR in each of the MSraw files. Blue represents Trisomy 21 samples and red repre-sents normal samples. The LC-MS/MS analysis identified 9individual peptides for SA4 protein, Figure 4, bottom panel.Average protein ratios were calculated using variance weightedaveraging of each individual peptide measurement. Figure 4,bottom panel, shows a whisker plot of the ratios calculated forthe 9 peptides from SA4. The average weighted ratio of allpeptides from SA4, Trisomy 21 over Normal, was 0.61 with acalculated area-under-ROC curve of 0.71 (Table 1), indicatingthat it was underexpressed in the Trisomy 21 samples and hadpotential to differentiate the two groups. Using this approach,all RAW files were analyzed and a list of differentially expressedproteins was generated (see Supplementary Table 1 for thecomplete list of differentially expressed proteins and peptides,Supporting Information).
Figure 1. Discovery-driven SRM Assay workflow.Samples areanalyzed with high-resolution LC-MS/MS and SIEVE softwareto generate a database of differentially expressed proteins. TheSIEVE database is then mined by Pinpoint software and a subsetlist of target proteins is chosen for SRM assay development.Iterative, scheduled SRM assays are run on a triple quadrupoleMS to optimize the assay. Clinical samples are then interrogatedwith the optimized, multiplexed SRM assays.
research articles Lopez et al.
136 Journal of Proteome Research • Vol. 10, No. 1, 2011

Most of the differentially expressed proteins that wereidentified, (with FDR of 2% or less), were underexpressed.Potential systematic baseline bias in the individual peptide ratiomeasurements was excluded by examining the ratio of allmonoisotopic/C12 peaks in the entire full scan data set. In thiscase, the overall ratio was determined to be 0.99 ( 2.2. PAPP-Aprotein was one of the proteins identified and the Trisomy 21over normal expression ratio was 0.69. The underexpressionof PAPP-A in the Trisomy 21 vs normal samples in this cohortis consistent with its expression (underexpression) in firsttrimester DS screening applications. The ROC AUC for PAPP-Awas 0.59 indicating that it had relatively weak classificationpower in this cohort and significantly lower classification powerthan many other proteins. Our intent was to discover and
evaluate new putative markers therefore we did not includePAPP-A for further evaluation in our study. From the completeprotein list, we selected 12 proteins for further developmentinto multiplexed SRM assays (Table 1) using the followingcriteria:
1. AUC curve values > 0.60. This filter included only proteinsthat had the potential to discriminate Trisomy 21 from normalsamples. Many of the differentially expressed proteins had low(<50) AUC values; the highest was serum amyloid 4 with a valueof 0.71 (Table 1).
2. High-abundance proteins. This emphasized proteins thatcould be robustly identified by SRM assays in serum digestswithout fractionation, depletion or further enrichment, therebyensuring a simple assay that could be easily developed andpotentially translated into a clinical research environment.
3. Literature references. Novel protein biomarkers that hadeither been previously reported to be involved with Trisomy21 or other pregnancy-related diseases. We chose not to focuson markers (PAPP-A, fbHCG, etc) that are already in routineclinical use.
With respect to the determination of what qualified as anacceptable differentially expressed target protein, we believethat ratio is less important than classification power; hence,our choice of ROC AUC as a more stringent distinguishingcriteria. Also, because discovery experiments are so time andlabor intensive, we chose to run a larger set of biologicalreplicates (versus technical replicates) in our discovery experi-ments to gain a better understanding of the biological variance.Indeed the point of developing the described workflow was toemploy the high-throughput SRM assays to verify the putativelist of target biomarkers initially identified in the discoveryexperiments. Based upon our previous experience with thedescribed discovery platform, our coefficient of variation wastypically less than 15%.7
Figure 2. Comparative product ion spectra for two human apolipoprotein E peptides in +2 charge state. (A) LTQ via on-resonance CID.(B) SRM on the TSQ Quantum Ultra. The Quantum Ultra (this figure) and Vantage triple quadrupole (used in the study) instrumentsare identical with respect to Q1, Q2 and Q3. The high energy collision dissociation (HCD) fragmentation is therefore expected to beidentical. A high degree of correspondence between the two platforms is evident in the intensities of the most abundant fragmentions.
Figure 3. LC retention time plot for 10 heavy peptides comparingthe discovery (LTQ Orbitrap XL hybrid trap) and targeted (TSQVantage triple quadrupole) platforms. Peptides were chosenbased upon their predicted elution times across the gradient. TheDiscovery gradient was 180 min in length and the SRM gradientwas 9 min in length. The observed linear correlation betweenthe two LC workflows was 0.93.
SRM Assay Development of Trisomy 21 Biomarker Candidates research articles
Journal of Proteome Research • Vol. 10, No. 1, 2011 137

Table 1. Expression Ratios of Biomarker Candidates from SIEVE and Pinpoint Analyses
protein ID
SIEVE T21/N averageratio all peptides
FDR 0.02SIEVE area-under
ROC curveSIEVE number
of peptides
Pinpoint T21/Nratio SRM target
peptide
NP_001630.1| serum amyloid P component precursor[Homo sapiens] [mass ) 25 387]
0.74 0.66 1 0.71
NP_002855.1| pregnancy-zone protein[Homo sapiens] [mass ) 163 835]
0.53 0.61 2 0.76
NP_000005.2| alpha-2-macroglobulin precursor[Homo sapiens] [mass ) 163 291]
0.65 0.62 28 0.76
NP_001634.1| apolipoprotein A-II preproprotein[Homo sapiens] [mass ) 11 175]
0.68 0.63 2 0.76
NP_001636.1| apolipoprotein C-I precursor[Homo sapiens] [mass ) 9332]
0.66 0.66 2 0.66
NP_000437.3| paraoxonase 1[Homo sapiens] [mass ) 39 731]
0.63 0.67 1 0.71
NP_000030.1| apolipoprotein A-I preproprotein[Homo sapiens] [mass ) 30 778]
0.68 0.67 16 0.76
NP_000375.2| apolipoprotein B[Homo sapiens] [mass ) 515 527]
0.67 0.62 8 0.76
NP_000031.1| apolipoprotein C-III precursor[Homo sapiens] [mass ) 10 852]
0.72 0.66 1 0.66
NP_000403.1| histidine-rich glycoprotein precursor[Homo sapiens] [mass ) 59 578]
0.34 0.65 1 0.71
NP_006503.1| serum amyloid A4; constitutive[Homo sapiens] [mass ) 14 807]
0.61 0.71 2 0.58
NP_000474.2| apolipoprotein C-II[Homo sapiens] [mass ) 11 284]
0.60 0.66 1 0.58
Figure 4. Label-free quantitative analysis using SIEVE. Protein report view of differential expression analysis. (Top panel) Integratedintensity graph for Serum Amyloid 4 (SA4) peptide EALQGVGGDMGR in all raw files, Red ) Normal, Blue ) Trisomy 21. (Bottompanel) Whisker plot of Normal/Trisomy 21 ratios for all peptides identified in the data set from SA4. The average ratio for all thepeptides is 0.67 ( 0.314 with a p-value of 9.9 × 10⁻²⁰.
research articles Lopez et al.
138 Journal of Proteome Research • Vol. 10, No. 1, 2011
As is evident in Table 1, all the proteins we selected ascandidates were decreased in Trisomy 21 vs normal samples.
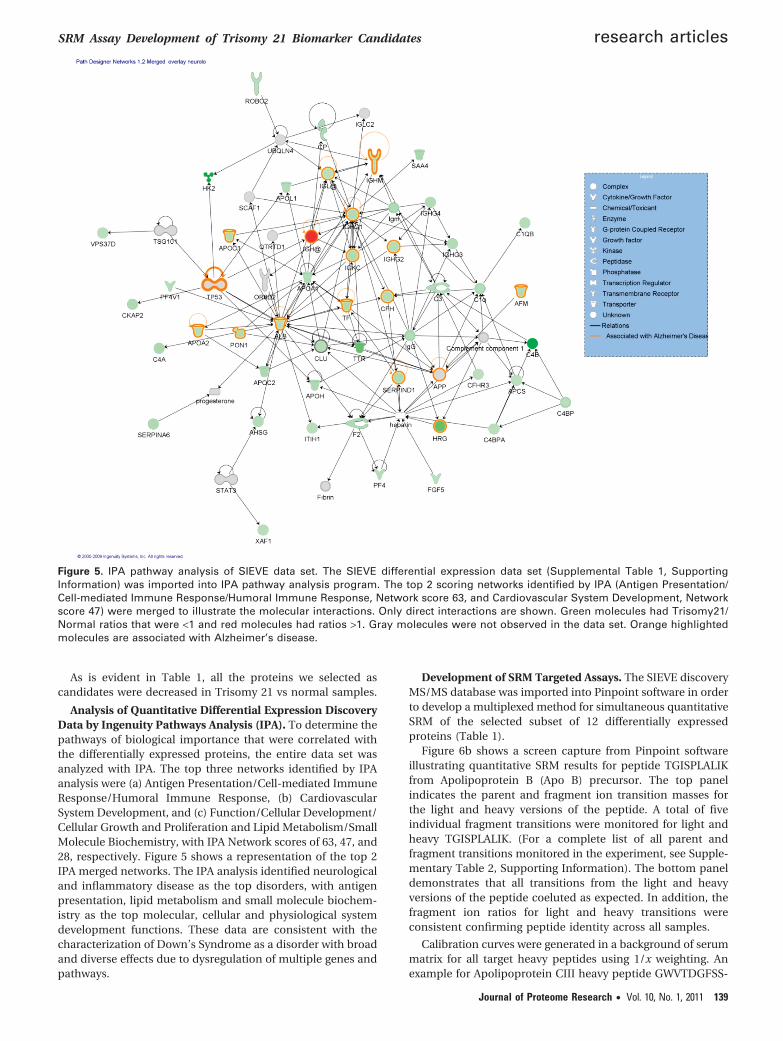
Analysis of Quantitative Differential Expression DiscoveryData by Ingenuity Pathways Analysis (IPA). To determine thepathways of biological importance that were correlated withthe differentially expressed proteins, the entire data set wasanalyzed with IPA. The top three networks identified by IPAanalysis were (a) Antigen Presentation/Cell-mediated ImmuneResponse/Humoral Immune Response, (b) CardiovascularSystem Development, and (c) Function/Cellular Development/Cellular Growth and Proliferation and Lipid Metabolism/SmallMolecule Biochemistry, with IPA Network scores of 63, 47, and28, respectively. Figure 5 shows a representation of the top 2IPA merged networks. The IPA analysis identified neurologicaland inflammatory disease as the top disorders, with antigenpresentation, lipid metabolism and small molecule biochem-istry as the top molecular, cellular and physiological systemdevelopment functions. These data are consistent with thecharacterization of Down’s Syndrome as a disorder with broadand diverse effects due to dysregulation of multiple genes andpathways.
Development of SRM Targeted Assays. The SIEVE discoveryMS/MS database was imported into Pinpoint software in orderto develop a multiplexed method for simultaneous quantitativeSRM of the selected subset of 12 differentially expressedproteins (Table 1).
Figure 6b shows a screen capture from Pinpoint softwareillustrating quantitative SRM results for peptide TGISPLALIKfrom Apolipoprotein B (Apo B) precursor. The top panelindicates the parent and fragment ion transition masses forthe light and heavy versions of the peptide. A total of fiveindividual fragment transitions were monitored for light andheavy TGISPLALIK. (For a complete list of all parent andfragment transitions monitored in the experiment, see Supple-mentary Table 2, Supporting Information). The bottom paneldemonstrates that all transitions from the light and heavyversions of the peptide coeluted as expected. In addition, thefragment ion ratios for light and heavy transitions wereconsistent confirming peptide identity across all samples.
Calibration curves were generated in a background of serummatrix for all target heavy peptides using 1/x weighting. Anexample for Apolipoprotein CIII heavy peptide GWVTDGFSS-
Figure 5. IPA pathway analysis of SIEVE data set. The SIEVE differential expression data set (Supplemental Table 1, SupportingInformation) was imported into IPA pathway analysis program. The top 2 scoring networks identified by IPA (Antigen Presentation/Cell-mediated Immune Response/Humoral Immune Response, Network score 63, and Cardiovascular System Development, Networkscore 47) were merged to illustrate the molecular interactions. Only direct interactions are shown. Green molecules had Trisomy21/Normal ratios that were <1 and red molecules had ratios >1. Gray molecules were not observed in the data set. Orange highlightedmolecules are associated with Alzheimer’s disease.
SRM Assay Development of Trisomy 21 Biomarker Candidates research articles
Journal of Proteome Research • Vol. 10, No. 1, 2011 139

LK[Heavy K] is shown in Figure 6c. The lower limit of detection(LLOD) for this target peptide in serum matrix was ap-proximately 250 attomoles on column and the limit of accuratequantification (LOQ) was approximately 500 attomoles -1femtomole on column. LOQ was calculated from the standardcurve where coefficient of variation was less than or equal to20%. LOD was calculated from the lowest point on the curvewhere the peptide was detected. These numbers were typicalfor all the peptides monitored. The assay error as determinedby CV (coefficient of variation) of technical replicate points wason average less than 10%. SRM interferences were ruled outbased upon fragment ion ratios. The ion ratios of multipletransitions must be consistent across different samples andfrom heavy to light peptides. Table 1 shows the quantitativeSRM expression ratios and AUC values of the target peptidesin Trisomy 21 vs normal samples. The differential expressionresults from the SRM experiments were, for the most part,consistent with the SIEVE data. All the target proteins had ratiosthat were <1, that is, they were underexpressed in the Trisomy21 samples. SRM expression values ranged from 0.58 to 0.76.
Discussion
The goals of this study were primarily 2-fold: to integrateunbiased biomarker discovery with hypothesis-driven, targetedassay development in a seamless manner, and application ofthis workflow to DS in an effort to facilitate the developmentof a method for noninvasive, early detection. Mass spectrom-etry has typically been the technology of choice in the searchfor proteomic biomarkers, but the translation of this informa-tion into high-throughput assays that facilitate the verificationof putative markers has not been straightforward. SRM-basedassays provide a powerful vehicle for the verification andimplementation of putative biomarker information derivedfrom high resolution LC-MS/MS experiments because of theirselectivity, sensitivity, robustness and speed.16 However, bridg-ing the gap between the typically long lists of putative biom-arkers in discovery experiments with the capability to runhundreds or thousands of samples using quantitative SRMassays has been hampered because of the lack of an objectiveand efficient mechanism for ranking the best candidates. Inthis report, we describe the development and application ofbioinformatic algorithms, including a novel application of ROCcurves allowing efficient mining of LC-MS/MS discovery datawith subsequent integration into SRM methods, thus pavingthe way for future biomarker verification with larger clinicalcohorts.
The workflow described herein was applied to a small cohortof maternal serum samples from Trisomy 21 and normalpregnancies. Because the definitive diagnosis for DS requiresinvasive procedures that incur significant risk, there is a needfor the development of new, noninvasive assays that can detectthis disorder and preferably, within the first trimester.1 Theunmet need for early markers of DS remains critical due tothe lack of specificity of the currently available blood tests(2-5% false positive rate). As a result of our discovery analysis,we identified over 300 differentially expressed proteins, includ-ing PAPP-A which is currently used as a screening marker forDS (Supplementary Table 1, Supporting Information). Most ofthe differentially expressed proteins that we identified (with aFDR of 0.02 or less) were underexpressed in Trisomy 21 vsnormal samples. From the initial list, we identified a group of12 proteins that fulfilled our criteria for relatively high abun-dance and promising AUC values (Table 1). PAPP-A was not
Figure 6. (A) Development of SRM assay for target proteins.Plot of the number of transitions scheduled for acquisition onthe TSQ Vantage across the length of the gradient. Transitionscheduling limits MS scanning to a window centered onpredicted peptide elution. In this example, the method willallow active scanning of only 64 of 206 total transitions at anygiven time during the gradient. Scheduling increases dwelltime and maximizes quantitative accuracy. (B) Developmentof SRM assay for target proteins. Pinpoint analysis of SRMassay data for Apolipoprotein B peptide TGISPLALIK. (Toppanel) Protein, peptide and transition information includingretention time, signal (normalized to heavy peptide), and signalratio between Trisomy 21 and Normal samples. (Bottom panel)Overlay of chromatograms of peptides TGISPLALIK and TGIS-PLALIK[HeavyK] in a normal sample. The peaks for the heavysynthetic (parent ion 510.8308) and light endogenous (parention 506.8237) peptide coeluted exactly as is clearly illustratedby the individual fragment ion transition traces. (C) Develop-ment of SRM assay for target proteins. Calibration curve ofApolipoprotein CIII synthetic peptide GWVTDGFSSLK[HeavyK]in a background of 30 µg raw serum digest. The 8 point curvemeasured concentrations from 250 attomoles to 500 femto-moles on column, in triplicate. LLOD was estimated at 250-500attomoles and LOQ was calculated to be 1-5 femtomoles. Thelinear correlation coefficient was 0.99 and the CV for pointsabove the LOQ ranged from 0-20%.
research articles Lopez et al.
140 Journal of Proteome Research • Vol. 10, No. 1, 2011

included in the list because our intent was to focus on newputative markers, and also because its ROC AUC of 0.59indicated it had relatively weak classification power for T21 vsnormal in this sample cohort. The final target list included 12underexpressed proteins. It is important to note that biologicalvariation in the data was very great and standard deviationsbetween biological samples ranged from 50-100%. As de-scribed above, we monitored only one peptide from eachprotein in the SRM experiments. This approach was basedupon the assumption that the abundance of the target peptidewas representative of total protein abundance (assumingtrypsin digestion was complete) but this assumption may notnecessarily be accurate for every protein. Also, we do not knowif the target proteins exist only in intact form (as opposed tomultiple truncated forms.17 Therefore, it is difficult to concludewhether any observed differences in discovery vs SRM expres-sion ratios were due to the number of peptides being moni-tored or the large biological variation in the data. Repeatingthe SRM experiment with a larger sample size may resolve thisquestion.
Using the described methods, we were successful in devel-oping a robust, 15 min multiplexed SRM assay for the targetproteins that provided fully quantitative information withoutthe need for any further depletion or enrichment from serumdigests. IPA pathway analysis of the LC-MS/MS discovery datamapped the putative biomarkers to several metabolic pathways,most notably immune response, lipid metabolism and neuro-logical disorders.
Several of the presumed biomarkers that we identified in thisstudy have also been identified in previous studies utilizingproteomic techniques. Most recently,6 isobaric labeling tech-nology was used on depleted plasma to perform biomarkerdiscovery on 6 first trimester DS and normal maternal plasmasamples. This study identified several underexpressed biom-arkers in common with the present study including apolipo-protein A1 and alpha-2-macroglobulin. In contrast to thepresent study, however, pregnancy zone protein and serumamyloid P were found to be overexpressed. In a prior study,4
the authors searched for biomarkers in first and secondtrimester maternal serum from Trisomy 21 and normal patientsamples using a variety of methods including 2D DIGE,MUDPIT, LC/LC-MS/MS and MALDI TOF-MS profiling. Nineproteins were identified as potential biomarkers in commonwith the present study including various apolipoproteins, serumamyloid A, and alpha-2-macroglobulin. A more recent study5
focused on the application of 2D-DIGE to find putative biom-arkers in second trimester maternal plasma. That study alsoidentified proteins in common with the current study includinghistidine rich glycoprotein (HRG) and serum amyloid P. Noneof the previously published proteomic studies identified PAPP-Ain the analyzed samples. Clearly, it is evident that there is alarge degree of variability in the expression ratios reported inMS-based proteomic studies of DS related biomarkers. Thismay be due to many factors including sample size, preparation,and analytical approaches, most of which are not rigorouslyquantitative. The relative lack of consistency in proteomicdiscovery experiments emphasizes the need for more standard-ized methods that allow the processing of larger numbers ofsamples. In addition, the ability to quickly stratify candidatesand verify with orthogonal methods would add a higher levelof confidence to the results of discovery experiments. Majoradvantages of the approach described in the current study arethe powerful combination of ROC analysis of label-free LC-MS/
MS discovery results coupled with the concomitant develop-ment of targeted SRM assays. This allows rapid and accuratequantification in undepleted serum digests thus facilitatinghigh-throughput verification or elimination of putative bio-markers.
With respect to the biology of DS, the broad representationof apolipoproteins in the differentially expressed protein listfrom the current study supports a hypothesis of dysregulationof lipid metabolism in DS. Numerous studies18-22 have docu-mented the central role of lipid metabolism and apolipopro-teins in DS and also in Alzheimer’s Disease where there iscopious evidence of similar pathology and potentially similarmechanisms.23,24 Figure 5 illustrates the significant overlap ofproteins involved in Alzheimer’s disease with the proteins fromour discovery data set identified in the top 2 IPA Networks.
In conclusion, the workflow outlined in this report presentsa seamless bridge between proteomic discovery experimentsand the development of high-throughput, targeted assayssuitable for biomarker verification in a clinical research envi-ronment. The practical application of this approach resultedin the discovery of putative proteomic biomarkers for Trisomy21 in first trimester maternal serum with the subsequentdevelopment of a quantitative, multiplexed high-throughputSRM assay. This assay may, in future studies, be applied toother clinical samples for marker verification and furtherdevelopment. Ultimately, much larger clinical cohorts will berequired to establish prevalence and incidence ranges inpopulation based-studies with an ultimate goal of increasingthe sensitivity and especially the selectivity of screeningmethods for DS.
Abbreviations: LC, liquid chromatography; MS/MS, tandemmass spectrometry; SPE, solid phase extraction; ESI, electro-spray ionization; ACN, acetonitrile; m/z, mass to charge ratio;SRM, selective reaction monitoring, APO, apolipoprotein; DS,Down’s Syndrome; AD, Alzheimer’s Disease; LLOD, lower limitof detection; LOQ, limit of quantitation; FDR, false discoveryrate; FPR, false positive rate, ROC, receiver operating charac-teristic; PAPP-A, pregnancy associated plasma protein; bhCG,beta human chorionic gonadotropin; AFP, alphafetoprotein;uE3, unconjugated estriol; FMF, familial Mediterranean fever.
Supporting Information Available: Thirteen putativemarkers were chosen from the initial SIEVE discovery data setbased upon relative abundance and AUC. Optimized SRMassays were developed for single peptides from the targetproteins and the entire clinical sample set was interrogated intriplicate. The corresponding ratios for the SIEVE and Pinpointanalyses are presented in the table. Supplementary Table 1.Label-free, differential analysis and protein identification.Analyses were performed using the SIEVE algorithm (9) incor-porating SEQUEST (10) and Percolator (11). RAW files from allclinical samples were analyzed. Supplementary Table 2. Pep-tides and transitions that were incorporated into the SRMassays for the targeted proteins. Thirteen proteins were chosenas putative biomarker targets from the SIEVE database. TheSIEVE database was imported into Pinpoint and SRM assayswere developed and optimized using the illustrated peptidesand transitions. Supplementary Data 1. Single peptide-basedprotein identifications. Individual MS/MS spectra and ionassignments for all single peptide identifications are providedin this data file. This material is available free of charge via theInternet at http://pubs.acs.org.
SRM Assay Development of Trisomy 21 Biomarker Candidates research articles
Journal of Proteome Research • Vol. 10, No. 1, 2011 141

References(1) Zournatzi, V.; Daniilidis, A.; Karidas, C.; Tantanasis, T.; Loufopou-
los, A., and; Tzafettas, J. A prospective two years study of firsttrimester screening for Down Syndrome. Hippocratia 2008, 1, 28–32.
(2) Megarbane, A.; Ravel, A.; Mircher, C.; Sturtz, F.; Grattau, Y.;Rethore, M. O.; Delabar, J. M.; Mobley, W. C. The 50th anniversaryof the discovery of trisomy 21: the past, present, and future ofresearch and treatment of Down syndrome. Genet. Med. 2009, 11,611–616.
(3) Kagan, K. O.; Wright, D.; Spencer, K.; Molina, F. S.; Nicolaides,K. H. Prospective validation of first-trimester combined screeningfor trisomy 21. Ultrasound. Obstet. Gynecol. 2008, 5, 493–502.
(4) Nagalla, S. R.; Canick, J. A.; Jacob, T.; Schneider, K. A.; Reddy, A. P.;Thomas, A.; Dasari, S.; Lu, X.; Lapidus, J. A.; Lambert-Messerlian,G. M.; Gravett, M. G.; Roberts, Jr., C. T.; Luthy, D.; Malone, F. D.;D’Alton, M. E. Proteomic analysis of maternal serum in DownSyndrome: identification of novel protein biomarkers. J. ProteomeRes. 2007, 6, 1245–1257.
(5) Kolialexi, A.; Tsangaris, G. Th.; Papntoniou, N.; Anagnostopoulos,A. K.; Vougas, K.; Bagiokos, V.; Antsaklis, A.; Mavrou, A. Applicationof proteomics for the identification of differentially expressedprotein markers for Down syndrome in maternal plasma. Prenat.Diagn. 2008, 28, 691–698.
(6) Kolla, V.; Jeno, P.; Moes, S.; Tercanli, S.; lapaire, O.; Choolani, M.;Hahn, S. Quantitative proteomics analysis of maternal plasma inDown Syndrome pregnancies using isobaric tagging reagent(iTRAQ). J. Biomed. Biotech. 2010, 2010, 1–10.
(7) Sutton, J.; Richmond, T.; Shi, X.; Athanas, M.; Ptak, C.; Gerszten,R.; Bonilla, L. Performance characteristics of an FT MS-basedworkflow for label-free differential MS analysis of human plasma:standards, reproducibility, targeted feature investigation, andapplication to a model of controlled myocardial infarction. Pro-teomics Clin. Appl. 2008, 2, 862–881.
(8) Lange, V.; Picotti, P.; Domon, B.; Aebersold, R. Selected reactionmonitoring for quantitative proteomics: a tutorial. Mol. Syst. Biol.2008, 4, 222.
(9) Anderson, L.; Hunter, C. Quantitative mass spectrometric multiplereaction monitoring assays for major plasma proteins. Mol. Cell.Proteomics 2006, 5, 573–588.
(10) Eng, J.; McCormack, A.; Yates III, J. R. An approach to correlatetandem mass spectral data of peptides with amino acid sequencesin a protein database. J. Am. Soc. Mass Spectrom. 1994, 5, 976–989.
(11) Kall, L.; Canterbury, J.; Weston, J.; Stafford Noble, W.; MacCoss,M. Semi-supervised learning for peptide identification fromshotgun proteomics datasets. Nat. Methods 2007, 4, 923–925.
(12) Schulman, A. I.; Mitchell, R. R. Operating Characteristics from Yes-No and Forced-Choice Procedures. J. Acoust. Soc. Am. 1966, 40(2), 473–477.
(13) Mueller, L. N.; Brusniak, M.; Mani, D. R.; Aebersold, R. Anassessment of software solutions for the analysis of mass spec-trometry based quantitative proteomics data. J. Proteome Res.2008, 7, 51–61.
(14) Gerber, S. A.; Rush, J.; Stemman, O.; Kirschner, M. W.; Gygi, S. P.Absolute quantification of proteins and phosphoproteins from celllysates by tandem MS. Proc. Natl. Acad. Sci. U.S.A. 2003, 100, 6940–6945.
(15) Mallick, P.; Scirle, M.; Chen, S. S.; Flory, M. R.; Lee, H.; Martin, D.;Ranish, J.; Raught, B.; Schmitt, R.; Werner, T.; Kuster, B.; Aebersold,R. Computational prediction of proteotypic peptides for quantita-tive proteomics. Nat. Biotechnol. 2007, 25, 125–131.
(16) Barnidge, D. R.; Goodmanson, M. K.; Klee, G. G.; Muddiman, D. C.Absolute quantification of the model biomarker prostate-specificantigen in serum by LC-MS/MS using protein cleavage and isotopedilution mass spectrometry. J. Proteome Res. 2004, 3, 644–652.
(17) Lopez, M. F.; Rezai, T.; Sarracino, D. A.; Prakash, A.; Krastins, B.;Athanas, M.; Singh, R. J.; Barnidge, D. R.; Oran, P.; Borges, C.;Nelson, R. W. Selected Reaction Monitoring-Mass SpectrometricImmunoassay Responsive to Parathyroid Hormone and RelatedVariants. Clin. Chem. 2010, 56, 281–90.
(18) Bocconi, L.; Nava, S.; Fogliani, R.; Nicolini, U. Trisomy 21 isassociated with hypercholesterolemia during intrauterine life.Am. J. Obstet. Gynecol. 1997, 176, 540–543.
(19) Pueschel, S. M.; Craig, W. Y.; Haddow, J. E. Lipids and lipoproteinsin persons with Down’s syndrome. J. Intellect. Disability Res. 1992,36, 365–369.
(20) Zamorano, A.; Guzman, M.; Aspillaga, M.; Avendano, A.; Gatica,M. Concentrations of serum lipids in children with Down’ssyndrome. Arch. Biol. Med. Exp. (Santiago) 1991, 24, 49–55.
(21) Lacko, A. G.; Hayes, J. D.; McConathy, W. J.; Lacko, I.; Redheendran,R. Lecithin: cholesterol acyltransferase in Down’s syndrome. Clin.Chim. Acta 1983, 132, 133–141.
(22) Marhaug, G.; Dowton, S. B. Serum amyloid A: an acute phaseapolipoprotein and precursor of AA amyloid. Baillieres Clin.Rheumatol. 1994, 8, 553–573.
(23) Beyreuther, K.; Pollwein, P.; Multhaup, G.; Monning, U.; Konig,G.; Dyrks, T.; Schubert, W.; Masters, C. L. Regulation and expres-sion of the Alzheimer’s beta/A4 amyloid protein precursor inhealth, disease, and Down’s syndrome. Ann. N.Y. Acad. Sci. 1993,695, 91–102.
(24) Rumble, B.; Retallack, R.; Hilbich, C.; Simms, G.; Multhaup, G.;Martins, R.; Hockey, A.; Montgomery, P.; Beyreuther, K.; Masters,C. L. Amyloid A4 protein and its precursor in Down’s syndromeand Alzheimer’s disease. N. Engl. J. Med. 1989, 320, 1446–1452.
PR100153J
research articles Lopez et al.
142 Journal of Proteome Research • Vol. 10, No. 1, 2011