Mason Burley ERDC SLDS Conference Olympia, WA May 21, 2014 Big Data, Big Obstacles Assessing the...
29
Mason Burley ERDC SLDS Conference Olympia, WA May 21, 2014 Big Data, Big Obstacles Assessing the Impact of Statewide College Financial Assistance Programs WASHINGTON STATE INSTITUTE FOR PUBLIC POLICY ?
-
Upload
joseph-underwood -
Category
Documents
-
view
214 -
download
0
Transcript of Mason Burley ERDC SLDS Conference Olympia, WA May 21, 2014 Big Data, Big Obstacles Assessing the...

Mason Burley
ERDC SLDS Conference
Olympia, WA
May 21, 2014
Big Data, Big ObstaclesAssessing the Impact of Statewide
College Financial Assistance Programs
WASHINGTON STATE INSTITUTE FOR PUBLIC POLICY
?

DebriefStrategyObstaclesMission
Washington State Institute for Public Policy
http://www.wsipp.wa.gov
May 21, 2014 Slide 2 of 28
• Started in 1969
• Available to WA undergrads
• Available to public/private, two/four students
• Award amounts linked to tuition
• Need-based (median family income)
• Means tested (prorated award)
Subject: State Need Grant (SNG) program

DebriefStrategyObstaclesMission
Washington State Institute for Public Policy
http://www.wsipp.wa.gov
Slide 3 of 28
Problem: Resident undergraduate tuition growth
SectorTuition and
fees (2000–01)
Tuition and fees
(2011–12)
Public research $3,984 $9,993
Public regional $3,092 $6,969
Private four-year $15,597 $31,618
Community and technical college $1,756 $3,542
May 21, 2014

DebriefStrategyObstaclesMission
Washington State Institute for Public Policy
http://www.wsipp.wa.gov
Slide 4 of 28
State Need Grant—Total expenditures (2003-2012)
2003-04
2004-05
2005-06
2006-07
2007-08
2008-09
2009-10
2010-11
2011-12
2012-13
$0
$50
$100
$150
$200
$250
$300
$350
*inflation adjusted (2012) dollars
Dollars
(m
illion
s)
May 21, 2014

DebriefStrategyObstaclesMission
Washington State Institute for Public Policy
http://www.wsipp.wa.gov
Slide 5 of 28
State Need Grant eligible students
2003-04
2004-05
2005-06
2006-07
2007-08
2008-09
2009-10
2010-11
2011-12
2012-13
0
20,000
40,000
60,000
80,000
100,000
120,0005
3,6
75
55
,27
8
65
,32
8
66
,36
4
70
,08
5
72
,51
1
70
,37
6
72
,33
8
74
,70
3
73
,98
5
2,6
65
5,4
78
3,5
83
1,8
80
1,6
01
5,4
98
21
,94
8
25
,67
7
30
,96
6
32
,44
3
SNG Eligible, did not receive grantReceived SNG (local funds)Received SNG
May 21, 2014

DebriefStrategyObstaclesMission
Washington State Institute for Public Policy
http://www.wsipp.wa.gov
Slide 6 of 28
Mission: Are SNG dollars effective?
2012 HB 2127
“Determine to what extent this [SNG] program has increased access and degree attainment for low-income students and to determine whether the funding for the state need grant has been utilized in the most efficient way possible to maximize the enrollment and degree attainment of low-income students”
May 21, 2014

DebriefStrategyObstaclesMission
Washington State Institute for Public Policy
http://www.wsipp.wa.gov
Slide 7 of 28
Mission: Are SNG dollars effective?
• The demographics of recipients, including, but not limited to, gender, race, and income
• The effect on enrollment rates of low-income students at the different institutions of higher education and whether these students attend full-time or part-time
• The effect on persistence, performance, degree completion, and time-to-degree completion
• An inventory of the types of degrees, by field of study
• The interplay of the State Need Grant program with other forms of financial aid
May 21, 2014
DebriefStrategyObstaclesMission
Washington State Institute for Public Policy
http://www.wsipp.wa.gov
Slide 8 of 28
Operatives: Washington State Institute for Public PolicyNon-parti san research at legislati ve/board directi on
Board of DirectorsSenator Jeanne Kohl-Welles, Co-Chair
Representative Maureen Walsh,
Co-Chair
Senator Joe Fain Representative Ruth Kagi
Senator Karen Fraser Representative Larry Springer
Senator Mark Schoesler Representative Hans Zeiger
Richard Rodger, Senate Staff Dir.
Jill Reinmuth, House Staff Dir.
David Schumacher, OFM Governor Appointee
Sandra Archibald, UW Rodolfo Arévalo, EWU
Thomas “Les” Purce, TESC Robert Rosenman, WSUMay 21, 2014

ResultsStrategyMission Obstacles
Washington State Institute for Public Policy
http://www.wsipp.wa.gov
Slide 9 of 28
Research obstacles: Different sources of aid
Aid category Research Regional Privatefour-year
Community/technical colleges
Total
Federal grants—Pell 23% 25% 14% 33% 28%State Need Grant 28% 25% 18% 15% 20%Institutional and other grants 16% 8% 29% 3% 9%Work study 2% 2% 2% 2% 2%Federal loans 18% 26% 21% 15% 18%Need unmet 14% 14% 16% 31% 23%
Need unmet average (dollars) $ 3,349 $ 2,914 $ 6,384 $ 4,921 $ 4,676 Average need per student $ 22,852 $ 19,982 $ 38,910 $ 15,655 $ 19,877
• Calculated need equals cost of attendance minus expected family contribution• Note that not all students receive award/loan in each category• Private loans not included
May 21, 2014

ResultsStrategyMission Obstacles
Washington State Institute for Public Policy
http://www.wsipp.wa.gov
Slide 10 of 28
Research obstacle: Differences among studentsStudent background and profi le• 64% – Community and technical college students• 44% – Independent, over age 25 (37% dependent under age 25)• 84% – Income under half of state median family income• 16% – Independent and married
Enrollment level• 58% – Enrolled full-time, full year• 18% – Enrolled full-time, part year• 33% – Summer enrollment
May 21, 2014

ResultsStrategyMission Obstacles
Washington State Institute for Public Policy
http://www.wsipp.wa.gov
Slide 11 of 28
Research obstacle: Comparison group
…may not be comparable• Higher family incomes• Late filers• More likely to enroll part-time
Unserved SNG students…
…don’t stay “unserved”• 40% receive SNG in following year
…have long term outcomes that are unknown• 2009-10 first year unserved population grew
May 21, 2014
ResultsStrategyMission Obstacles
Washington State Institute for Public Policy
http://www.wsipp.wa.gov
Slide 12 of 28
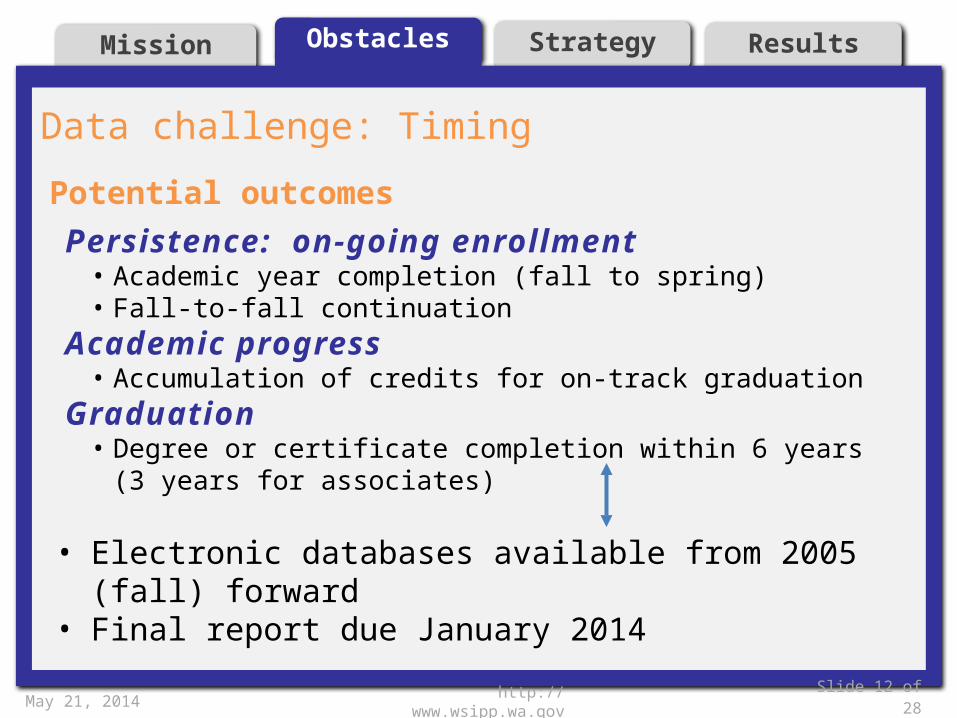
Data challenge: Timing
Persistence: on-going enrollment• Academic year completion (fall to spring)• Fall-to-fall continuation
Academic progress• Accumulation of credits for on-track graduation
Graduati on • Degree or certificate completion within 6 years (3 years for associates)
• Electronic databases available from 2005 (fall) forward
• Final report due January 2014
Potential outcomes
May 21, 2014
ResultsStrategyMission Obstacles
Washington State Institute for Public Policy
http://www.wsipp.wa.gov
Slide 13 of 28
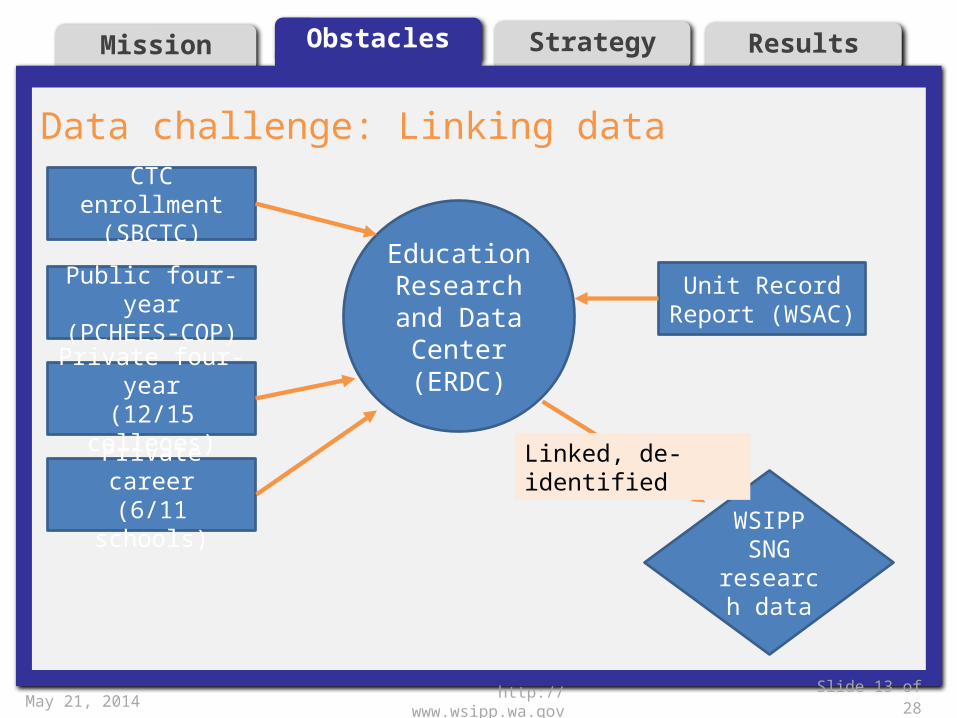
Data challenge: Linking data
Unit Record Report (WSAC)
CTC enrollment(SBCTC)
Public four-year(PCHEES-COP)
Private four-year(12/15 colleges)
Private career(6/11 schools)
Education Research and Data
Center (ERDC)
WSIPP SNG
research data
Linked, de-identified
May 21, 2014
ResultsStrategyMission Obstacles
Washington State Institute for Public Policy
http://www.wsipp.wa.gov
Slide 14 of 28
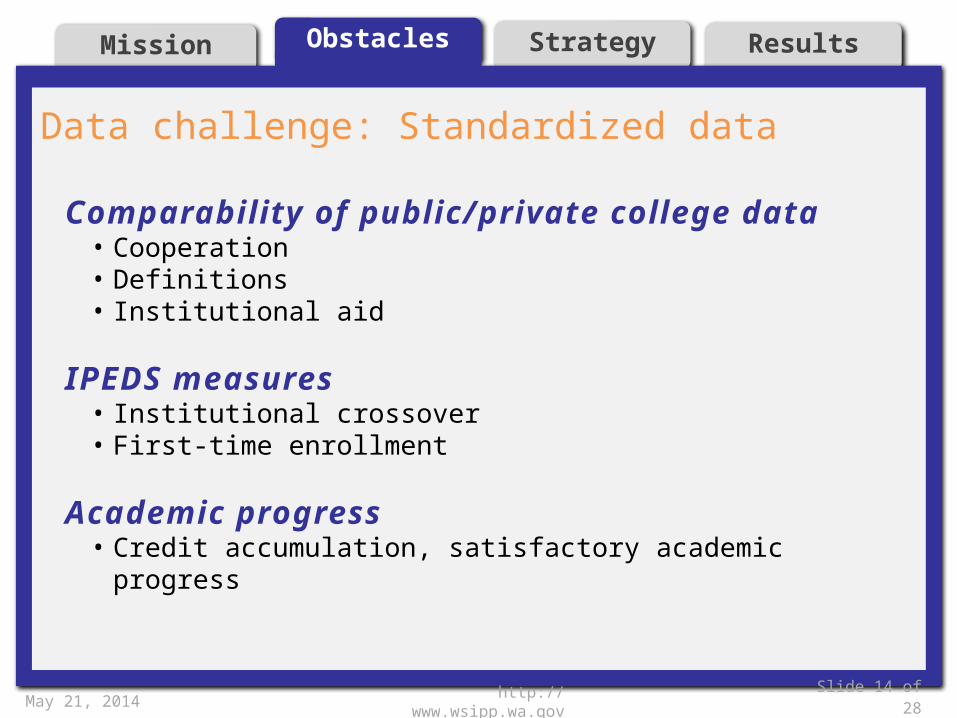
Data challenge: Standardized data
Comparability of public/private college data• Cooperation• Definitions• Institutional aid
IPEDS measures• Institutional crossover• First-time enrollment
Academic progress • Credit accumulation, satisfactory academic progress
May 21, 2014

ResultsMission Obstacles Strategy
Washington State Institute for Public Policy
http://www.wsipp.wa.gov
Slide 15 of 28
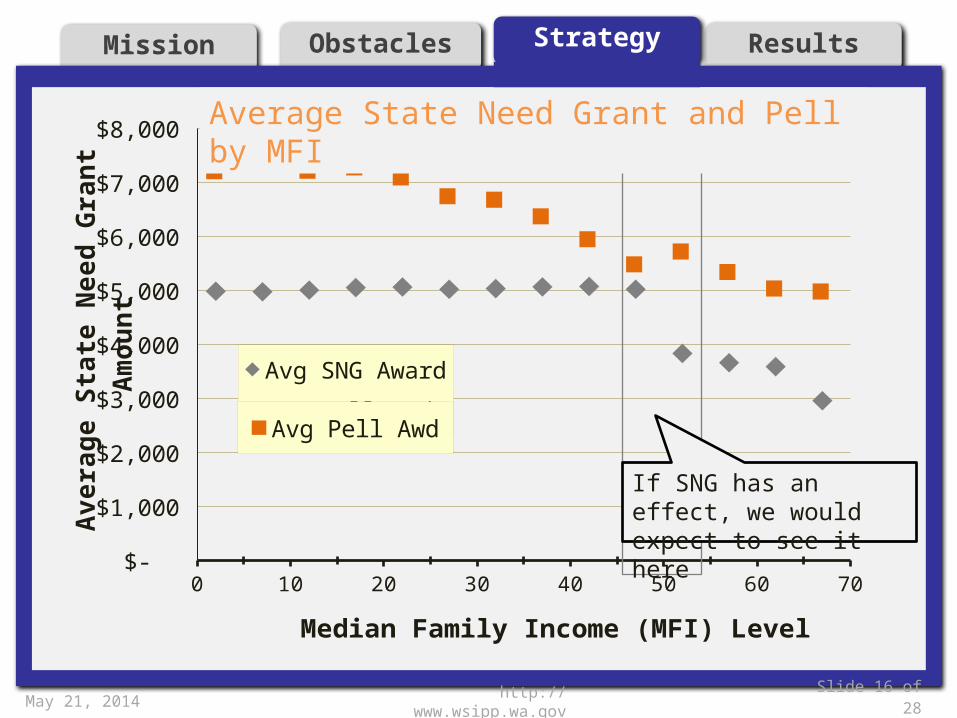
• Difference in SNG amount, but similar profile/aid• Permits reliable inference on SNG effect
Approach: Take advantage of “discontinuities” in SNG design
Median family income range
Income limits (family of four)
Percent of State Need Grant award
0-50% $41,000 100%51-65% $53,000 75%66-70% $57,500 50%71%+ ineligible
May 21, 2014
ResultsMission Obstacles Strategy
Washington State Institute for Public Policy
http://www.wsipp.wa.gov
Slide 16 of 28
0 10 20 30 40 50 60 70 $-
$1,000
$2,000
$3,000
$4,000
$5,000
$6,000
$7,000
$8,000
Avg SNG Award
Avg Pell Awd
Median Family Income (MFI) Level
Aver
age
Stat
e N
eed
Gra
nt A
mou
nt
Avg Pell Awd
Average State Need Grant and Pell by MFI
If SNG has an effect, we would expect to see it here
May 21, 2014

ResultsMission Obstacles Strategy
Washington State Institute for Public Policy
http://www.wsipp.wa.gov
Slide 17 of 28
Financial aid as a percentage of COA by MFI range and sector: 2011-12
0-50
MFI
51-7
0 M
FI
0-50
MFI
51-7
0 M
FI
0-50
MFI
51-7
0 M
FI
0-50
MFI
51-7
0 M
FI
35%23% 29%
19% 19% 12% 18% 13%
20%
9%
23%
10% 12%5%
31%
16%
17%
22%
23%
28% 21%
22%
15%
14%
6%
13%
5%
7% 23%31%
2%
4%
State Need Grant Pell Grant Loans Institutional Aid Other AidRemaining Need EFC
Research Regional Private bacc. CTC
May 21, 2014

ResultsMission Obstacles Strategy
Washington State Institute for Public Policy
http://www.wsipp.wa.gov
Slide 18 of 28
Know thy data….
Acronym soup• COA, EFC, SAP, Need, CIP….
Sector-specifi c defi niti ons• Student classification• Outcome milestones
Verifi cati on and transparency
May 21, 2014

Mission StrategyObstacles Results
Washington State Institute for Public Policy
http://www.wsipp.wa.gov
Slide 19 of 28
Effects* of a 25% reduction SNG on outcomes
CTC students Public Baccalaureate students-9%-8%-7%-6%-5%-4%-3%-2%-1%0%
-3.8
% -2.2
%
-4.6
%
-8.3
%
Persistence (enrolled next fall)
Degree completion
*Based on median coefficient estimates derived from 12 different models testing four dis-continuity bandwidths (2-5%) and three different specifications
May 21, 2014

Mission StrategyObstacles Results
Washington State Institute for Public Policy
http://www.wsipp.wa.gov
Slide 20 of 28
• 4% change in expected fall-to-fall enrollment for CTC students
1,791 students (of total 47,134 enrolled) may change enrollment decision based on $600 change in SNG amount
Fall-to-fall enrollment
A 25% change in the SNG award is associated with….
• 2% change in expected fall-to-fall enrollment for public baccalaureate students
378 students (of total 17,171 enrolled) may change enrollment decision based on $2,000 change in SNG amount
May 21, 2014

Mission StrategyObstacles Results
Washington State Institute for Public Policy
http://www.wsipp.wa.gov
Slide 21 of 28
• 5% change in expected degree completions for CTC students
Total degrees earned may change for 436 entering students (of 10,895 first-time students) with a $600 change in SNG amount
Degree completion
A 25% change in the SNG award is associated with….
• 8% change in expected degree completions for public baccalaureate students
Total degrees earned may change for 439 entering students (of 5,289 first-time students) with a $2,000 change in SNG amount
May 21, 2014

Mission StrategyObstacles Results
Washington State Institute for Public Policy
http://www.wsipp.wa.gov
Slide 22 of 28
Finding 1: Effect of need-based grants on subsequent fall enrollment (elasticity)
Goldrick-Rab et al, 2012
(WI)
Bania et al., 2013 (WA)
Castleman & Long, 2013
(FL)
Bettinger, 2010 (OH)
0.00
0.05
0.10
0.15
0.20
0.25
0.30
0.35
0.40
0.098 0.109
0.162 0.172
Ela
sti
cit
y
Weighted average = 0.140
May 21, 2014

Mission StrategyObstacles Results
Washington State Institute for Public Policy
http://www.wsipp.wa.gov
Slide 23 of 28
Finding 2: Longitudinal (cross sector) outcomes
CTC Earned award No award
Type of student
Transfer to four-
yearNo
transferTransfer to four-
year
Preparedtransfer ready
Still enrolled
Not enrolled Total
Academic 329 (15%)
313 (14%)
166 (7%)
64 (3%)
374 (17%)
998 (44%) 2,250
Workforce 71(4%)
524 (29%)
46(3%)
408 (22%)
127(7%)
651 (36%) 1,826
May 21, 2014
Mission StrategyObstacles Results
Washington State Institute for Public Policy
http://www.wsipp.wa.gov
Slide 24 of 28
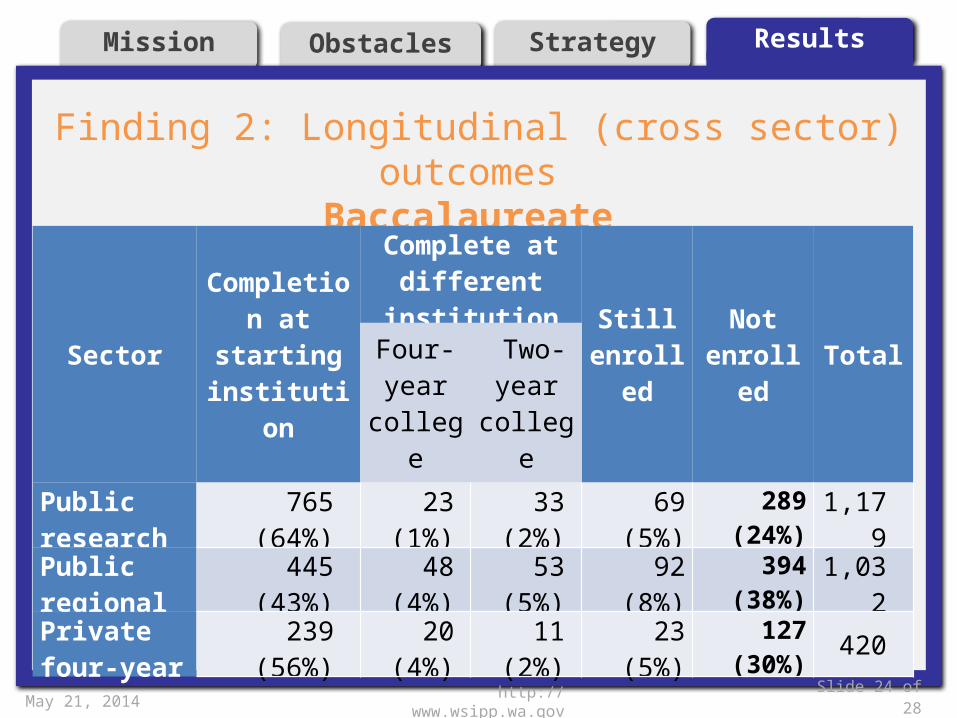
Finding 2: Longitudinal (cross sector) outcomes
Baccalaureate
SectorCompletion at starting institution
Complete at different
institutionStill
enrolledNot
enrolled TotalFour-year
college
Two-year
college
Public research 765 (64%) 23 (1%) 33 (2%) 69 (5%) 289 (24%) 1,179
Public regional 445 (43%) 48 (4%) 53 (5%) 92 (8%) 394 (38%) 1,032
Private four-year 239 (56%) 20 (4%) 11 (2%) 23 (5%) 127 (30%) 420
May 21, 2014
Mission StrategyObstacles Results
Washington State Institute for Public Policy
http://www.wsipp.wa.gov
Slide 25 of 28
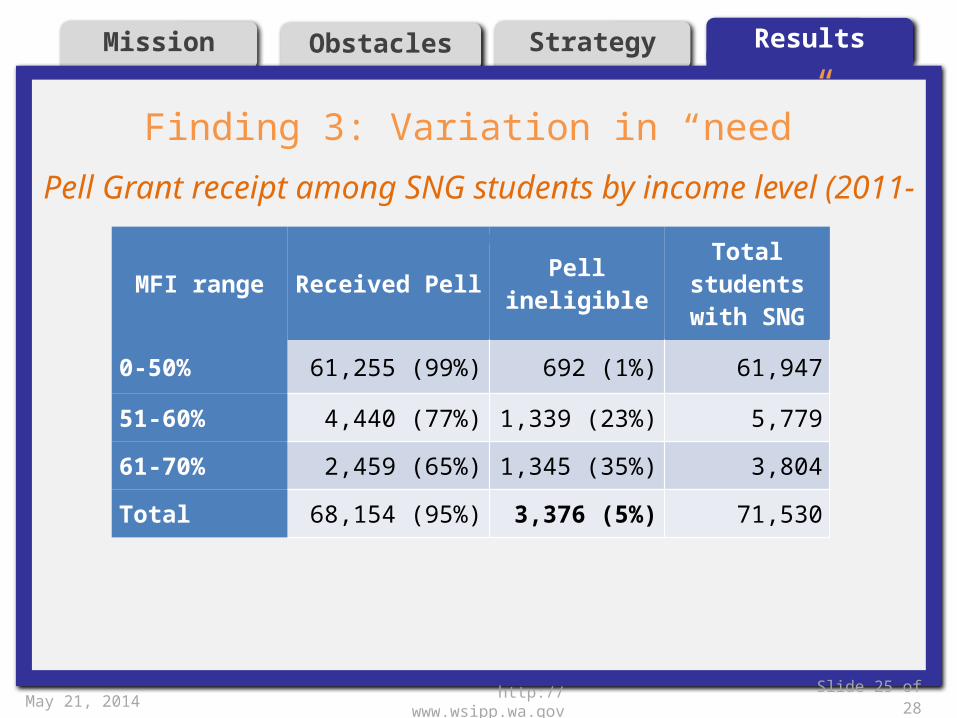
Finding 3: Variation in “need”
Pell Grant receipt among SNG students by income level (2011-12)
MFI range Received Pell Pell ineligible Total students with SNG
0-50% 61,255 (99%) 692 (1%) 61,947
51-60% 4,440 (77%) 1,339 (23%) 5,779
61-70% 2,459 (65%) 1,345 (35%) 3,804
Total 68,154 (95%) 3,376 (5%) 71,530
May 21, 2014
Mission StrategyObstacles Results
Washington State Institute for Public Policy
http://www.wsipp.wa.gov
Slide 26 of 28
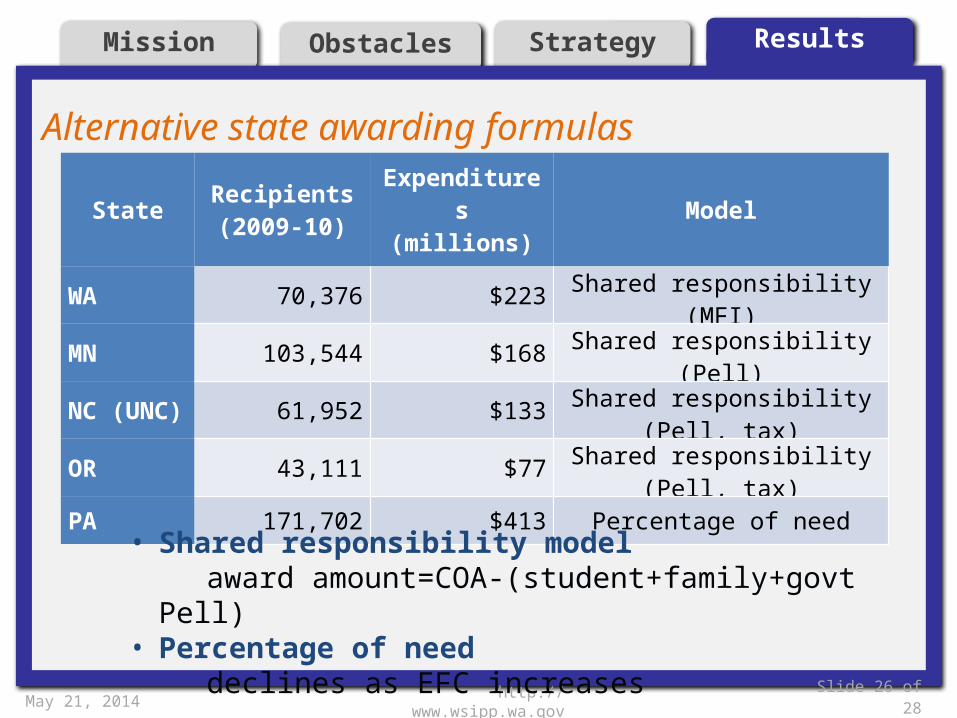
Alternative state awarding formulas
State Recipients(2009-10)
Expenditures (millions) Model
WA 70,376 $223 Shared responsibility (MFI)
MN 103,544 $168 Shared responsibility (Pell)
NC (UNC) 61,952 $133 Shared responsibility (Pell, tax)
OR 43,111 $77 Shared responsibility (Pell, tax)
PA 171,702 $413 Percentage of need
• Shared responsibility modelaward amount=COA-(student+family+govt Pell)
• Percentage of need declines as EFC increases
May 21, 2014
Mission StrategyObstacles Results
Washington State Institute for Public Policy
http://www.wsipp.wa.gov
Slide 27 of 28
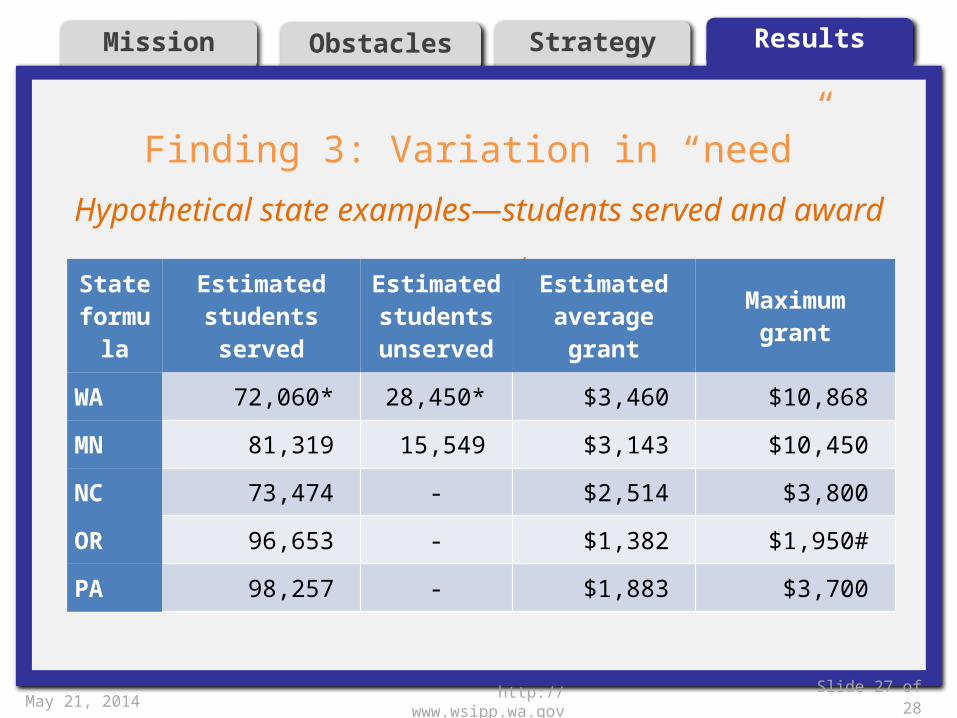
Finding 3: Variation in “need”
Hypothetical state examples—students served and award amounts
State formula
Estimated students served
Estimated students unserved
Estimated average grant Maximum grant
WA 72,060* 28,450* $3,460 $10,868
MN 81,319 15,549 $3,143 $10,450
NC 73,474 - $2,514 $3,800
OR 96,653 - $1,382 $1,950#
PA 98,257 - $1,883 $3,700
May 21, 2014
LESSONS LEARNED
http://www.wsipp.wa.gov
Slide 28 of 28
• Statewide programs do not always include statewide information
• Within/between differences
• An integrated database can be used to test eligibility and awarding formulas
• Right team and structure necessary for program evaluation – THANKS to ERDC, WSAC, and institutional partners
May 21, 2014
THANK YOU
http://www.wsipp.wa.gov
Questions?
Mason Burley
360-528-1645