MARYLAND RURAL ROAD SAFETY STUDY An Analysis of Farm ...
14
MARYLAND RURAL ROAD SAFETY STUDY An Analysis of Farm Vehicle/Farm Equipment-Related Accidents in the State of Maryland INTRODUCTION Agriculture is an important component of Maryland’s economy, with sales over $2 billion annually. Agriculture is the single largest land use in the state encompassing just over 2 million acres of land. Maryland boasts over 12,000 farm operations that are spread throughout every county of the state. Farm vehicles and equipment must travel public roads in order to reach outlying fields and to transport products to market or processing facilities. While Maryland is a small state (9,775 sq. mi.), ranking 42 nd in land area among the 50 states, its estimated 2018 population of 6.025 million people gives it the 5 th greatest population density in the United States (618 people/sq. mi.). Although population is concentrated around the major metropolitan areas of Baltimore and Washington, DC, this high population density inevitably means that drivers will encounter farm-related vehicles and equipment on public roads throughout the state. The Maryland Soybean Board has identified farm vehicle public road safety as a priority issue. Farm vehicle crashes (FVCs) can be costly both in terms of property damage and injuries, and in some circumstances, result in fatalities. Background research has shown that a comprehensive study of FVCs in Maryland has not been attempted and no data is readily available on the cost of FVCs in terms of property damage or medical costs. In order to have information for education of farmers, road planners, and the general driving public, public datasets, farmer surveys, and insurance claim data have been used to describe the extent and characteristics of FVCs in Maryland from 2013-2018. Information from related studies is presented with a discussion on suggested methods for decreasing the occurrence of FVCs in Maryland. RELEVANT STUDIES A 1999 study of farm vehicle-related crashes in North Carolina found that FVCs accounted for less than 1% of all motor vehicle accidents in the United States. The National Safety Council’s 2017 Injury Facts estimated that medically consulted injuries in motor vehicle incidents totaled $4.6 million in 2017, and total motor vehicle injury costs, including wage and productivity losses, medical expenses, administrative expenses, motor-vehicle property damage and employer costs, were estimated to have risen to $434 billion. Based on this data, a conservative estimate for FVCs in the U.S. carried a cost of more than $4.3 billion in 2017. Only a handful of studies have characterized the circumstances and conditions related to farm- vehicle crashes. One of the more recent efforts was conducted by the Great Plains Center for Agricultural Health at the University of Iowa. This study analyzed crash rates using state Department of Transportation data across nine Midwest states from 2005-2010. This study found that 30% of farm-related equipment crashes occurred in urban zip codes. Crashes were more
Transcript of MARYLAND RURAL ROAD SAFETY STUDY An Analysis of Farm ...
MARYLAND RURAL ROAD SAFETY STUDY An Analysis of Farm Vehicle/Farm Equipment-Related Accidents
in the State of Maryland INTRODUCTION Agriculture is an important component of Maryland’s economy, with sales over $2 billion annually. Agriculture is the single largest land use in the state encompassing just over 2 million acres of land. Maryland boasts over 12,000 farm operations that are spread throughout every county of the state. Farm vehicles and equipment must travel public roads in order to reach outlying fields and to transport products to market or processing facilities. While Maryland is a small state (9,775 sq. mi.), ranking 42nd in land area among the 50 states, its estimated 2018 population of 6.025 million people gives it the 5th greatest population density in the United States (618 people/sq. mi.). Although population is concentrated around the major metropolitan areas of Baltimore and Washington, DC, this high population density inevitably means that drivers will encounter farm-related vehicles and equipment on public roads throughout the state. The Maryland Soybean Board has identified farm vehicle public road safety as a priority issue. Farm vehicle crashes (FVCs) can be costly both in terms of property damage and injuries, and in some circumstances, result in fatalities. Background research has shown that a comprehensive study of FVCs in Maryland has not been attempted and no data is readily available on the cost of FVCs in terms of property damage or medical costs. In order to have information for education of farmers, road planners, and the general driving public, public datasets, farmer surveys, and insurance claim data have been used to describe the extent and characteristics of FVCs in Maryland from 2013-2018. Information from related studies is presented with a discussion on suggested methods for decreasing the occurrence of FVCs in Maryland. RELEVANT STUDIES A 1999 study of farm vehicle-related crashes in North Carolina found that FVCs accounted for less than 1% of all motor vehicle accidents in the United States. The National Safety Council’s 2017 Injury Facts estimated that medically consulted injuries in motor vehicle incidents totaled $4.6 million in 2017, and total motor vehicle injury costs, including wage and productivity losses, medical expenses, administrative expenses, motor-vehicle property damage and employer costs, were estimated to have risen to $434 billion. Based on this data, a conservative estimate for FVCs in the U.S. carried a cost of more than $4.3 billion in 2017. Only a handful of studies have characterized the circumstances and conditions related to farm-vehicle crashes. One of the more recent efforts was conducted by the Great Plains Center for Agricultural Health at the University of Iowa. This study analyzed crash rates using state Department of Transportation data across nine Midwest states from 2005-2010. This study found that 30% of farm-related equipment crashes occurred in urban zip codes. Crashes were more

Maryland Rural Road Safety Study
Maryland Soybean Board 2 www.mdsoy.com
likely to occur on high-speed roads, roads with high traffic density, on farm-to-market routes, and on narrow and curvy roads, and roads with narrow lanes. Crash rates were much lower in states where there was compliance with American Society for Agricultural and Biological Engineers standards for lighting and marking of farm equipment. The Midwest study also found that the most common type of collision involved rear-ending a vehicle, followed by accidents when the farm vehicle was turning left, and accidents that occurred when vehicles were passing farm vehicles. Persons in farm vehicles were less likely to be injured than persons in other vehicles. They found a steady increase in the number of crashes that occurred as the year progressed from winter (January-March), through planting season (April-May), growing season (June-August), and harvest (September-December). Fewer crashes occurred on weekends. The majority of crashes occurred during daylight in clear weather. Maryland Traffic Safety Fact Sheets from 2007 and 2008 indicate that 40 and 56 crashes involved farm vehicles in each of these years respectively, but comparable fact sheets for other years were not found. Data available from the National Highway Traffic Safety Administration’s Fatality Analysis Reporting System identify three fatal accidents involving farm equipment that occurred from 2010 to 2016 on Maryland roads (0-0.3% of all crashes each year), but these may under-estimate total fatal crashes because they may not include farm trucks or towed farm equipment, and they do not provide insight as to the total number of crashes occurring in Maryland involving farm vehicles and farm equipment on public roads.
METHODS Data was collected from several sources in order to evaluate the characteristics of FVCs in Maryland. These data sources included information from a farmer survey and discussion, public safety databases, and insurance claim information. Available data spans different time periods within the years 2013 through 2018. Details of each data source follows. Farmer Survey & Comment Session A voluntary survey was designed for farmers to complete online and was broadcast through social media, farm organization newsletters and farmer meetings. Survey questions included: number of incidents that occurred with farm equipment and a passenger vehicle in the last five years; descriptions of the incidents; type of equipment involved; whether people were injured; and estimated costs of medical, farm equipment, passenger vehicle, and property damages. In addition to collecting data online, two comment sessions with farmers were held to discuss the issue and solicit comments and suggestions. Public Safety Databases No published analysis of FVCs for the state of Maryland were found, but motor vehicle accident data from the Maryland State Police and Department of Public Safety is available for the state through the Maryland Open Data Portal. Available data in the Maryland Statewide Vehicle Crash Data (MSVCD) covered the period from January 2015 through June 2018. All accident records

Maryland Rural Road Safety Study
Maryland Soybean Board 3 www.mdsoy.com
involving vehicles identified as farm vehicles or vehicles towing farm equipment were extracted by selecting those records with a body type code of “9” denoting farm vehicle for a towed vehicle configuration code of “12” denoting towed farm equipment. The resultant subset of data included pickups, vans, and buses used as farm vehicles or towing farming equipment. These records were then analyzed for characteristics including, county where accident occurred, type of roadway, time of day, month, weather conditions, accident type (injury/fatal/property damage), type of collision, resultant harm to vehicle, and contributing factors of the drivers to the accident. Data was also requested from the University of Maryland Baltimore, STAR-ORC National Study Center for Trauma and EMS. They provided synthesized data from their records from 2013-2017. There is likely overlap in the data provided by this program and data from the MSVCD as many of the sources (police reports) are the same.
Insurance Claims Data Ten major insurance companies and the Maryland Insurance Administration were contacted to find claims data related to FVCs. The Maryland Insurance Administration does not track this data and suggested contacting individual insurers. Most insurance companies either did not respond to requests or were unwilling to share or research farm-specific cases from their claims data. Only one insurance company, Nationwide, was willing to share data. This data covered claims in the state of Maryland in 2017 and 2018 and included number of claims, information on equipment involved, and amount of loss. RESULTS Farmer Survey There were 16 responses to the farmer survey. Nearly 20% of respondents reported having 3-5 accidents on public roads over the five years, while the remainder reported 1-2 accidents in the last year. Most accidents reported by respondents involved tractors, or tractors in combination with towed equipment (fig. 1).
Figure 1.

Maryland Rural Road Safety Study
Maryland Soybean Board 4 www.mdsoy.com
Survey respondents indicated most damages ranged under $10,000 per category (medical, farm equipment, passenger vehicle, and property damage). Most costs fell in the under $10,000 range for all categories, and only one-quarter of the accidents involved an injury (fig. 2). Comments from surveyed farmers indicated that passenger/other vehicles trying to pass farm equipment caused some of these accidents and that the public needs to be made aware of the right-of-way allowed to farm equipment.
Figure 2.
Comment Session There were 41 farmer participants in the comment sessions, representative of all regions of the state of Maryland. The top concern expressed was drivers attempting to pass when there was not sufficient time or space on the roadway. This caused collisions or farm vehicle drivers to be pushed off the road to prevent a head on accident for the passing driver. Passenger vehicle drivers did not seem aware of the heights of sprayers and other equipment, such that drivers have tried to pass the farm vehicle by going under the equipment, and instead hit the equipment. Some narrow roadways have barriers on the shoulders close to the roadway such that farm vehicles cannot travel without crossing the line, or the barriers are too closely placed on the farm drives to allow for farm equipment to enter the drive. Traffic circles and j-turns are not adequately designed for large vehicles to physically maneuver the turn, requiring operators to drive on curbs, hit signage and barriers. Modified (round) curbs are more viable than standard (square) curbs. Participants encouraged education of drivers and road engineers to increase road safety for farm vehicles and similar large and slow-moving vehicles.
02468
101214
Medical FarmEquipment
PassengerVehicle
Property
Num
ber o
f res
pons
es
Farmer-estimated Costs
Estimated Costs per AccidentFarmer Survey
N/A $0-$10,000 $10,000-$25,000 $25,000-$50,000 $100,000+

Maryland Rural Road Safety Study
Maryland Soybean Board 5 www.mdsoy.com
Public Safety Databases Information obtained from the University of Maryland Baltimore, STAR-ORC National Study Center for Trauma and EMS found a total of 298 farm-vehicle related accidents in their database from 2013 through 2017 (Table 1). However, the providers of the data noted that the “farm vehicle” designation in the crash report often has vehicles that one may not consider a “farm vehicle” (such as construction equipment). From looking through the vehicle make and model, they estimated that this is between one-quarter and one-half of all “farm vehicles”, and it varies greatly by county. However, the data providers also noted that many crashes are not reported or under reported, so these numbers could make up for those. In general, this data reported 617 people were part of a collision where a farm vehicle was involved. Of these 617 people, 300 were in a vehicle besides a farm vehicle and 317 of the people were in a vehicle reported to be a farm vehicle. Sixty-two of the 298 crashes were single vehicle crashes where the farm vehicle was the only participant. Table 1. Region of Maryland where farm-vehicle related accidents occurred from 2013 through 2017 based on data from National Study for Trauma and EMS at the University of Maryland, Baltimore.
By Region (2013-2017) Region Count Counties in Region BALTIMORE 110 Carroll, Howard, Harford, Baltimore, Baltimore City, Anne Arundel WESTERN 51 Garrett, Allegany, Washington, Frederick WASHINGTON, D.C. 49 Montgomery, Prince George's UPPER SHORE 42 Cecil, Kent, Queen Anne’s, Talbot, Caroline LOWER SHORE 34 Wicomico, Somerset, Worcester, Dorchester SOUTHERN MARYLAND 12 Calvert, Charles, St. Mary's Total 298
The Maryland Statewide Vehicle Crash Database included 396,419 records of motor vehicle accidents from January 2015 through June 2018. Extracting just those records that identified a vehicle body type of “farm vehicle” or a towed vehicle type as “farm equipment” resulted in 234 records (Table 2). If all accidents involving farm vehicles/equipment were appropriately identified then roughly 6 of every 1000 accidents in the state, or slightly more than one-half of one percent (0.60%) of all accidents involve farm vehicles or farm equipment. It is likely that, as with the EMS data above, some vehicles were incorrectly identified as being, or not being, a farm vehicle. In lieu of more precise codes that breakdown farm vehicles into tractors, trucks, and various types of equipment, this data is a good representation of farm vehicle accidents in the state of Maryland and their characteristics.

Maryland Rural Road Safety Study
Maryland Soybean Board 6 www.mdsoy.com
The majority of these FVCs occurred in Washington and Frederick counties in western Maryland (10.7% of all FVCs during this period in each county). Counties surrounding major metropolitan areas had the next highest percentage of total accidents with Montgomery, Prince George’s, Baltimore County each accounting for between 8.1 and 9.8% of FVCs.
Table 2. Number of farm vehicle/equipment related accidents by county (2015-second quarter 2018)
County 2015 2016 2017 2018* Total Percent of all
accidents
Allegany 0 0 0 1 1 0.4 Anne Arundel 3 5 4 2 14 6.0 Baltimore 8 4 5 2 19 8.1 Calvert 1 1 0 0 2 0.8 Caroline 4 0 1 1 6 2.6 Carroll 2 2 7 1 12 5.1 Cecil 1 4 4 1 10 4.3 Charles 1 1 2 1 5 2.1 Dorchester 3 1 1 1 6 2.6 Frederick 5 8 11 1 25 10.7 Garrett 2 2 1 0 5 2.1 Harford 1 4 5 0 10 4.3 Howard 1 1 1 1 4 1.7 Kent 2 1 2 0 5 2.1 Montgomery 5 6 9 3 23 9.8 Prince George's 5 5 8 2 20 8.5 Queen Anne's 1 1 4 1 7 3.0 St. Mary's 2 0 2 0 4 1.7 Somerset 3 1 2 0 6 2.6 Talbot 3 0 1 0 4 1.7 Washington 9 8 2 6 25 10.7 Wicomico 5 0 2 3 10 4.3 Worcester 1 1 3 0 5 2.1 Baltimore City 3 1 0 2 6 2.6 Total 71 57 77 29* 234
*Data only available for the first 2 quarters of 2018 (January through June).

Maryland Rural Road Safety Study
Maryland Soybean Board 7 www.mdsoy.com
The majority (70% or more annually) of FVCs were listed as property damage crashes (fig. 3), while roughly 28% were injury crashes and slightly less than 2% of FVCs were fatal crashes (4 of 234).
Figure 3. Over 75% of FVCs occurred during daylight hours, with only 16.5% occurring in the dark. Fewer than 10% of FVCs took place during dawn or dusk light conditions. Over 72% of FVCs occurred in clear weather, while 9% occurred during cloudy conditions and 9% when there was precipitation (rain, sleet, or snow). Most FVCs occurred mid-day between 9:00 a.m. and 3:00 p.m. (39%) followed by afternoon/evening hours from 3:00 to 7:00 p.m. (30%). The remainder of FVCs were evenly distributed between nighttime hours from 7:00 p.m. to 5:30 a.m. and mornings from 5:30 to 9:00 a.m. (15.5% each).
0%
10%
20%
30%
40%
50%
60%
70%
80%
90%
100%
2015 2016 2017 2018 Total
Perc
ent o
f all
farm
veh
icle
-rela
ted
cras
hes
Crash Type 2015-2018
Fatal Crash Injury Crash Property Damage Crash

Maryland Rural Road Safety Study
Maryland Soybean Board 8 www.mdsoy.com
The number of FVCs was greatest in the months of June through October (fig. 4).
Figure 4.
Most FVCs in Maryland occur on two-way undivided roads (52.8%), followed by two-way divided highways with barriers or medians (21.9%). Divided highways without a physical barrier or median accounted for 7.8% of accidents. The largest number of incidents occurred on state highways (38%), followed closely by county roads (30%), but U.S. routes and interstate highways accounted for 11% and 8.5% of total FVCs, respectively (fig. 5).
Figure 5.
0
5
10
15
20
25N
umbe
r of A
ccid
ents
Farm Vehicle/Equipment Accidents by Month
2015 2016 2017 Total
0102030405060708090
100
CountyRoad
StateRoad
US Route InterstateHighway
MunicipalRoad
OtherPublicRoad
OtherRoadN
umbe
r of A
ccid
ents
(tot
al=2
34)
Route Type
Maryland Rural Road Safety Study
Maryland Soybean Board 9 www.mdsoy.com
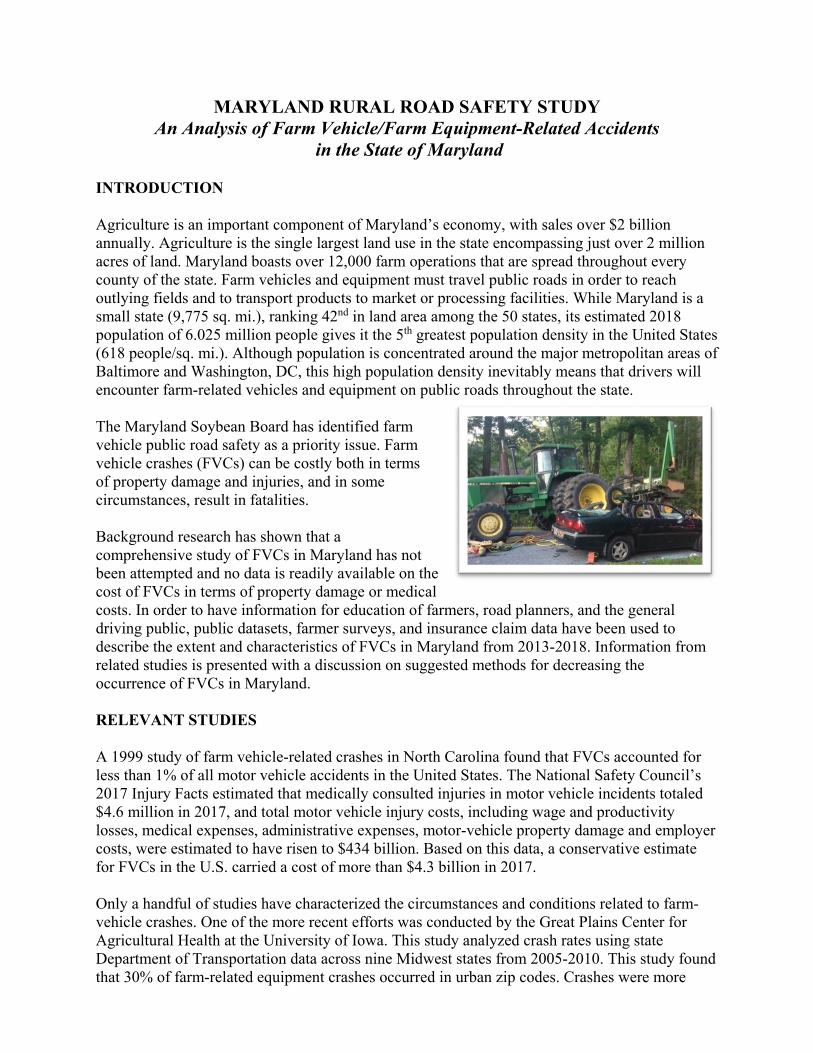
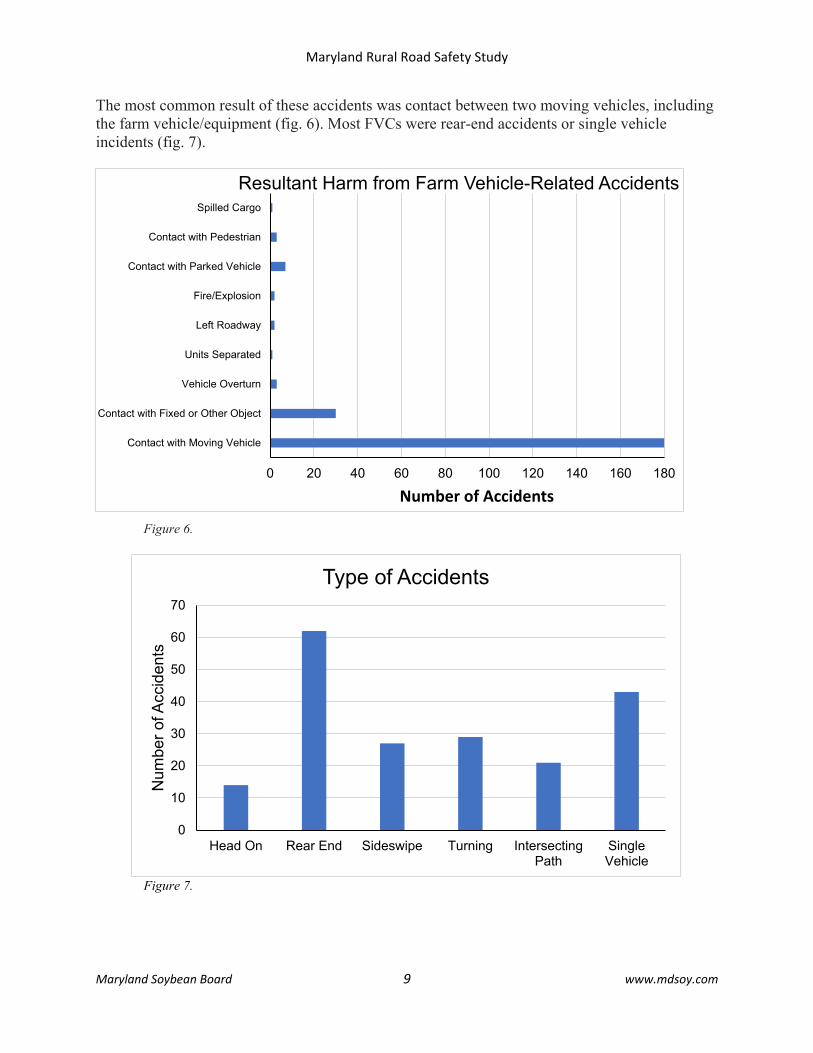
The most common result of these accidents was contact between two moving vehicles, including the farm vehicle/equipment (fig. 6). Most FVCs were rear-end accidents or single vehicle incidents (fig. 7).
Figure 6.
Figure 7.
0
10
20
30
40
50
60
70
Head On Rear End Sideswipe Turning IntersectingPath
SingleVehicle
Num
ber o
f Acc
iden
ts
Type of Accidents
0 20 40 60 80 100 120 140 160 180
Contact with Moving Vehicle
Contact with Fixed or Other Object
Vehicle Overturn
Units Separated
Left Roadway
Fire/Explosion
Contact with Parked Vehicle
Contact with Pedestrian
Spilled Cargo
Number of Accidents
Resultant Harm from Farm Vehicle-Related Accidents

Maryland Rural Road Safety Study
Maryland Soybean Board 10 www.mdsoy.com
Contributing factors to these accidents were wide-ranging for drivers, but prominent among the listed contributing factors was lack of attention, running off the road, failure to yield the right of way, and excessive speed (fig. 8). Note that there is not a specific identification of cell phone usage, which would be recorded under the categories of Lack of Attention or Other.
Figure 8.
Insurance Claims Data Data provided by Nationwide Insurance regarding FVC crashes in 2017 and 2018 indicated only 13 claims that were defined as “involving farm equipment”. Of these claims, seven accidents involved tractors, two involved tractors towing equipment, two involved combines, one involved a spreader, and one involved a side-by-side off-road vehicle. Losses ranged from $1,000 to more than $30,000.
Lack of Attention34%
Over Corrected2%
Fatigue1%
Other12%
Improper Turning1%
Ran Off Road10%
Swerved/Avoided Object in Road
2%
Excessive Speed9%
Failed to Obey Traffic Control
3%
Failed to Keep Right of Center
7%
Improper Passing3%
Improper Lane Change2%
Followed Too Closely5%
Failed to Yield Right-of-way9%
CONTRIBUTING FACTORS

Maryland Rural Road Safety Study
Maryland Soybean Board 11 www.mdsoy.com
ACTION MATTERS There is some work currently underway to bring awareness to the issue by state farm organizations promoting rural road safety. Education efforts through digital media, radio, farm signage and networking remind all drivers of the need for caution driving around farm equipment. Farmers were encouraged to use slow-moving vehicle (SMV) signs on appropriate vehicles and homeowners advised that posting SMVs in yards was not permitted. The State of Maryland, through the Maryland Department of Agriculture and State Highway Administration, ran radio ads and posted farm road safety caution signs during spring planting and fall harvest. As the characteristics of FVCs in Maryland are quite like FVCs that have been studied in other states where agriculture has an equal or greater footprint, it is worth considering strategies being recommended or employed in other agricultural regions for Maryland. One of the most commonly addressed issues in FVC prevention is signage and lighting. Research indicates that states with high numbers of farmers following lighting and marking recommendations by the American Society for Agricultural and Biological Engineers have associated reduced rates of FVCs. While a new federal regulation requires farm equipment manufactured after June 2017 comply with these standards, many models of older farm equipment may not be as well-lit or marked. Therefore, encouraging implementation of lighting and marking standards on all equipment may decrease risk of accidents. Maryland law requires farm vehicles to have two single-beam or multiple-beam headlamps, and at least two red lamps visible when lighted from a distance of not less than 1,000 feet to the rear. Additionally, Maryland law requires farm equipment driven at a speed of 25 mph or less to have a slow-moving vehicle emblem mounted on the rear of the vehicle. Studies of road characteristics have found that FVCs are more likely to occur on high speed (>50 MPH) roads, roads with high traffic density, and roads with smaller lanes/road widths. Steep grades (6-10%) and curvy road segments were also associated with greater odds of FVCs. Roadway design/improvement efforts can attempt to mitigate these problems through wider road/lanes and roundabouts, wider shoulders, slow-vehicle pullouts, use of modified versus standard curbs, and slower speeds on potentially dangerous road sections, particularly along routes that have high density of agricultural lands or along farm-to-market routes. Road maintenance, including tree trimming, should accommodate the increased size of farm vehicles. Increased use of fixed and mobile rural road signs that warn of tractors and slow-moving farm equipment is another strategy that may provide warning to non-farm drivers of when to be especially aware of farm equipment. The use of these signs may be particularly beneficial during spring tillage and fall harvest when agricultural traffic is greater or near locations such as rural storage facilities or markets.

Maryland Rural Road Safety Study
Maryland Soybean Board 12 www.mdsoy.com
Driver education can play a key role in understanding the SMV emblem and developing proper driving procedures around slow-moving vehicles. The high incidence of rear-end accidents indicate that difficulty recognizing slow-moving farm equipment may be a problem. This can be accomplished by:
• developing and disseminating community awareness program to promote safe driving when agriculture machinery is present on roadways
• recommend road safety segments on public television (Maryland Farm & Harvest) and local news programs
• creating and adding a module to the state driver’s training and licensing process • raising awareness seasonally through an active digital campaign focused on farm
equipment roadway safety information • educating farmers on best practices for operating agricultural equipment on public roads
in farm meetings, trucking safety forums, farm podcasts; safety emphasis in extension’s teen tractor driving course; develop online courses for farm employees
Recognizing farm vehicles in the Maryland Strategic Highway Safety Plan would help bring awareness to the unique needs of operating farm equipment on Maryland’s roads. This is a statewide safety plan outlining strategies to reduce injuries on Maryland roadways. CONCLUSION As Maryland’s population increasingly moves beyond urban/suburban areas, encounters between drivers of farm vehicles and equipment and non-farm drivers on public roads will inevitably continue to grow. Maryland farmers have indicated that they increasingly feel less safe driving and transporting farm equipment on public roads. Given that Maryland is home to very large urban populations as well as extensive rural areas, it is important that farmers understand how to best protect their equipment and their own health by preventing these types of accidents. It is critical that the non-farming public who share public roads with farm equipment understands how to safely travel roads where farm equipment is present. Finally, it is imperative that the state include the requirements of farm vehicles to plan for their safe movement on Maryland roads.

Maryland Rural Road Safety Study
Maryland Soybean Board 13 www.mdsoy.com
REFERENCES American Society for Agricultural and Biological Engineers, Publications & Standards,
https://www.asabe.org/Publications-Standards. Committee on Agricultural Safety and Health Research and Extension. 2009. Agricultural
Equipment on Public Roads. USDA-CSREES, Washington, DC. Costello, T.M., Schulman, M.D., and Luginbuhl, R.C. 2003. Understanding the public health
impacts of farm vehicle public road crashes in North Carolina. Journal of Agricultural Safety and Health 9:19-32.
Costello, T.M., Schulman, M.D., and Mitchell, R.E. 2009. Risk factors for a farm vehicle public
road crash. Accident Analysis and Prevention 41:42-47. Daniel Knopp, Research Analyst, University of Maryland Baltimore, STAR-ORC National
Study Center for Trauma and EMS, Email sent to Owl Creek Consulting. January 15, 2019.
Gerberich, S.G., Roberson, L.S., Gibson, R.W., and Renier, C. 1996. An epidemiological study of
roadway fatalities related to farm vehicles: United States, 1988-1993. Journal of Occupational and Environmental Medicine 38:1135-1140.
Gkritza, K., Kinzenbaw, C.R., Hallmark, S., and Hawkins, N. 2010. An empirical analysis of
farm vehicle crash injury severities on Iowa’s public road system. Accident Analysis and Prevention 42:1392-1397.
Great Plains Center for Agricultural Health, Farm Equipment Crash Study, https://gpcah.public-
health.uiowa.edu/center-projects/farm-equipment-crash-study/. Greenan, M., Toussaint, M., Peek-Asa, C., Rohlman, D., and Ramirez, M.R. 2016. The effects of
roadway characteristics on farm equipment crashes: A geographic information systems approach. Injury Epidemiology 3:31, 7p.
Harland, KK., Greenan, M., Ramirez, M. 2014. Not just a rural occurrence: Differences in
agricultural equipment crash characteristics by rural-urban crash site and proximity to town. Accident Analysis and Prevention 70:8-13.
Juan Navas, Staff Operations Director, Nationwide Insurance Email sent to Owl Creek
Consulting, February 1, 2019. Luginbuhl, R.C., Jones, V.C., and Langley, R.L. 2003. Farmers’ perceptions and concerns: The
risks of driving farm vehicles on rural roadways in North Carolina. Maryland Department of Transportation, Maryland Traffic Safety Facts 2008,
https://www.roads.maryland.gov/MHSO/overview_sheet_2008.pdf.

Maryland Rural Road Safety Study
Maryland Soybean Board 14 www.mdsoy.com
Maryland Secretary of State Office, Famous Facts about Maryland, https://sos.maryland.gov. National Agricultural Statistics Service, 2017 State Agriculture Overview, https://www.nass.
usda.gov/Quick_Stats/Ag_Overview/stateOverview.php?state=MARYLAND. National Highway Traffic Safety Administration, Fatality Analysis Reporting System,
https://cdan.nhtsa.gov/tsftables/tsfar.htm. National Safety Council. 2017. Injury Facts Motor Vehicles, https://injuryfacts.nsc.org/motor-
vehicle/overview/introduction/. National Safety Council. 2017. Undercounted is underinvested: How incomplete crash reports
impact efforts to save lives, https://www.nsc.org/Portals/0/Documents/ DistractedDrivingDocuments/Crash%20Report/Undercounted-is-Underinvested.pdf.
Nuckolls, K. 2018. Moving Farm Machinery: Safety and Liability Laws. Maryland Risk
Management Education Blog, http://agrisk.umd.edu/blog/moving-farm-machinery-safety-and-liability-laws.
Peek-Asa, C., Sprince, N.L., Whitten, P.S., Falb, S.R., Madsen, M.D., and Swerling, C. 2007.
Characteristics of crashes with farm equipment that increase potential for injury. The Journal of Rural Health 23: 339-347.
Ramirez, M., Bedford, R., Wu, H., Harland, K., Cavanaugh, J.E., and Peek-Asa, C. 2016.
Lighting and marking policies are associated with reduced farm equipment-related crash rates: A policy analysis of nine Midwestern U.S. states. Occupational and Environmental Medicine 73:621-626.
State of Maryland, Maryland at a Glance,
https://msa.maryland.gov/msa/mdmanual/01glance/html/agri.html. State of Maryland, Open Data Portal, https://data.maryland.gov/. Toussaint, M., Faust, K., Peek-Asa, C., and Ramirez, M. 2015. Characteristics of farm
equipment-related crashes associated with injury in children and adolescents on farm equipment. Journal of Rural Health 33:127-134.
U.S. Census Bureau, 2018 Population Estimates, www.census.gov. Zwerling, C., Peek-Asa, C., Whitten, P.S., Choi, S-W., Sprince, N.L., and Jones, M.P. 2005.
Fatal motor vehicle crashes in rural and urban areas: Decomposing rates into contributing factors. Injury Prevention 11:24-28.