Martinus Vranken TF CC Practical examples of surveyors ... · Martinus Vranken , MSc. Project...
8
1 Practical examples of the surveyor’s contribution to energy and climate policy FIG Taskforce Climate Change, June 17th 2014, Kuala Lumpur, Malaysia Martinus Vranken, MSc. Project manager Energy and Climate the Netherlands’ Cadastre 2 Agenda Energy and climate challenges The need for information 4 examples in the Netherlands Conclusions
Transcript of Martinus Vranken TF CC Practical examples of surveyors ... · Martinus Vranken , MSc. Project...
1
Practical examples of the surveyor’s contribution
to energy and climate policy
FIG Taskforce Climate Change, June 17th 2014, Kuala Lumpur, Malaysia
Martinus Vranken , MSc.
Project manager Energy and Climate
the Netherlands’ Cadastre
2
Agenda
� Energy and climate challenges
� The need for information
� 4 examples in the Netherlands
� Conclusions

2
3
Energy and Climate Challenges
� Mitigation: Reducing Greenhouse Gas
emissions:
– Energy efficiency
– Renewable energy sources
– Clean use of fossil fuels
� Adaptation: Coping with increasing
waterlevels, droughts, heat .....
4
The need for information and the policy cycle
3
5
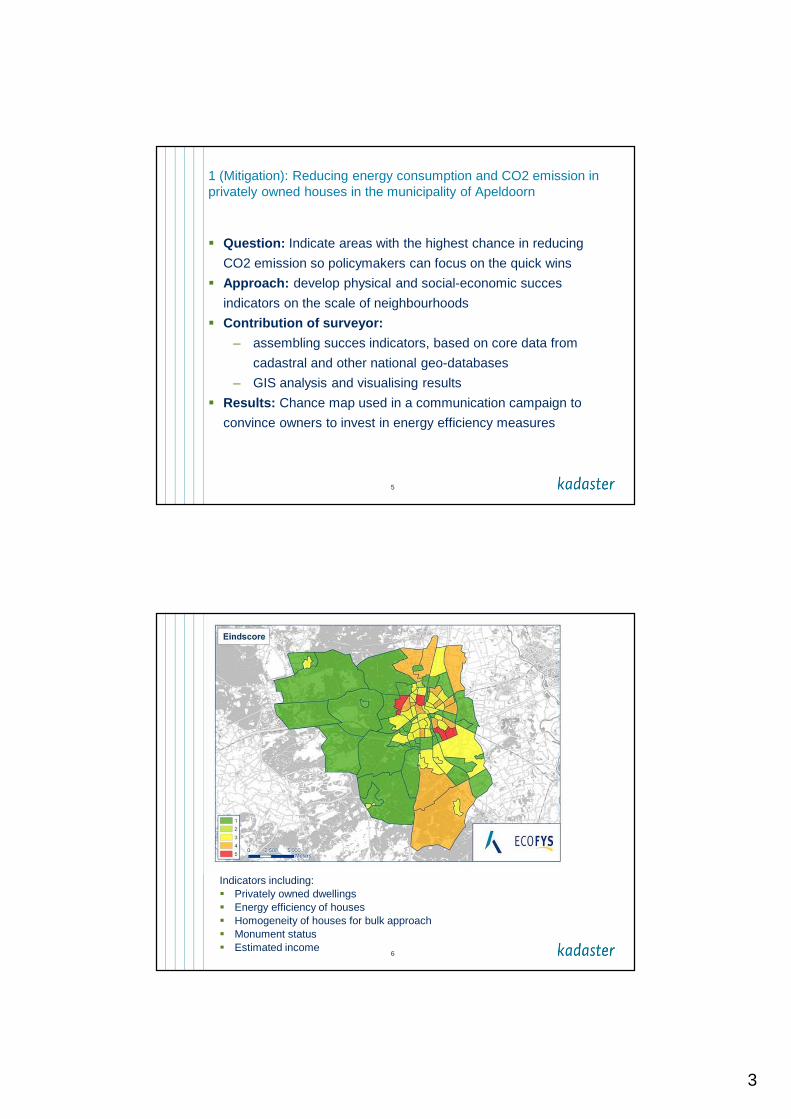
1 (Mitigation): Reducing energy consumption and CO2 emission in privately owned houses in the municipality of Apeldoorn
� Question: Indicate areas with the highest chance in reducing
CO2 emission so policymakers can focus on the quick wins
� Approach: develop physical and social-economic succes
indicators on the scale of neighbourhoods
� Contribution of surveyor:
– assembling succes indicators, based on core data from
cadastral and other national geo-databases
– GIS analysis and visualising results
� Results: Chance map used in a communication campaign to
convince owners to invest in energy efficiency measures
6
Indicators including:� Privately owned dwellings � Energy efficiency of houses � Homogeneity of houses for bulk approach� Monument status� Estimated income
4
7
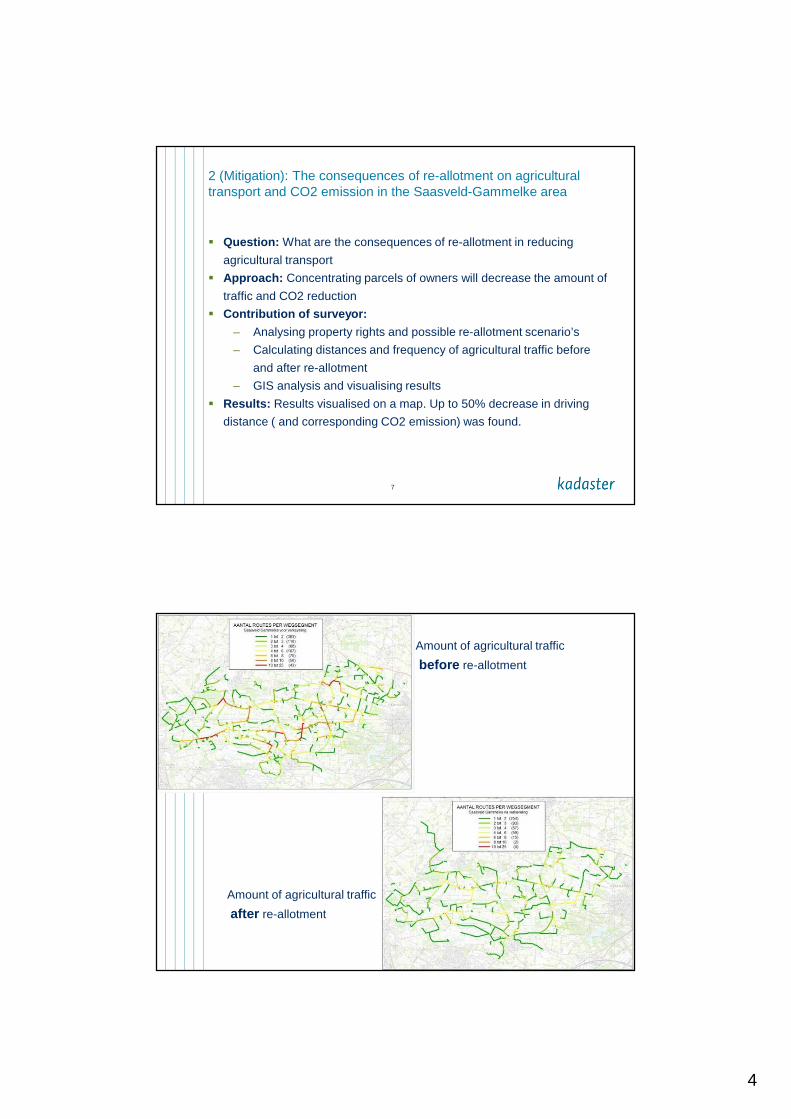
2 (Mitigation): The consequences of re-allotment on agricultural transport and CO2 emission in the Saasveld-Gammelke area
� Question: What are the consequences of re-allotment in reducing
agricultural transport
� Approach: Concentrating parcels of owners will decrease the amount of
traffic and CO2 reduction
� Contribution of surveyor:
– Analysing property rights and possible re-allotment scenario’s
– Calculating distances and frequency of agricultural traffic before
and after re-allotment
– GIS analysis and visualising results
� Results: Results visualised on a map. Up to 50% decrease in driving
distance ( and corresponding CO2 emission) was found.
8
Amount of agricultural traffic
before re-allotment
Amount of agricultural traffic
after re-allotment
5
9
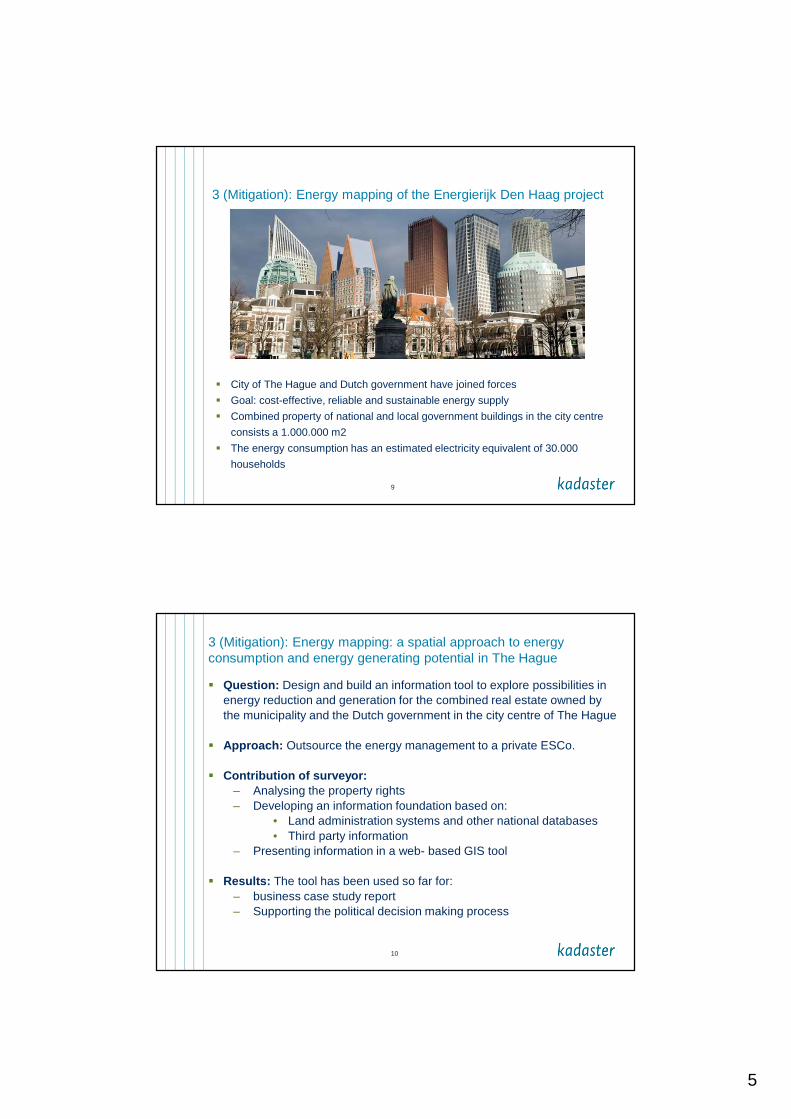
3 (Mitigation): Energy mapping of the Energierijk Den Haag project
� City of The Hague and Dutch government have joined forces
� Goal: cost-effective, reliable and sustainable energy supply
� Combined property of national and local government buildings in the city centre
consists a 1.000.000 m2
� The energy consumption has an estimated electricity equivalent of 30.000
households
10
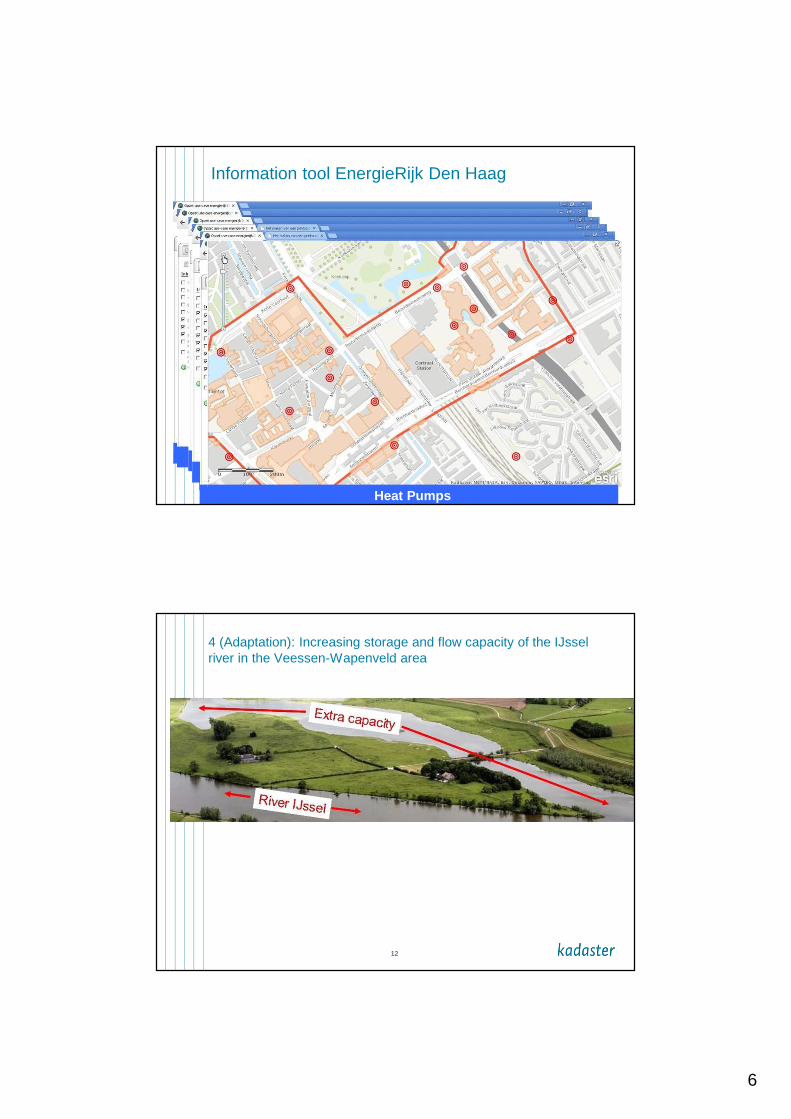
3 (Mitigation): Energy mapping: a spatial approach to energy consumption and energy generating potential in The Hague
� Question: Design and build an information tool to explore possibilities in energy reduction and generation for the combined real estate owned by the municipality and the Dutch government in the city centre of The Hague
� Approach: Outsource the energy management to a private ESCo.
� Contribution of surveyor:– Analysing the property rights– Developing an information foundation based on:
• Land administration systems and other national databases• Third party information
– Presenting information in a web- based GIS tool
� Results: The tool has been used so far for:– business case study report– Supporting the political decision making process
6
11
Study area downtown The HagueState and municipality owned real estateReal estate with monument statusBuildings and topographyBuilding characteristics and energy labels
Heat gridHeat Pumps
Information tool EnergieRijk Den Haag
12
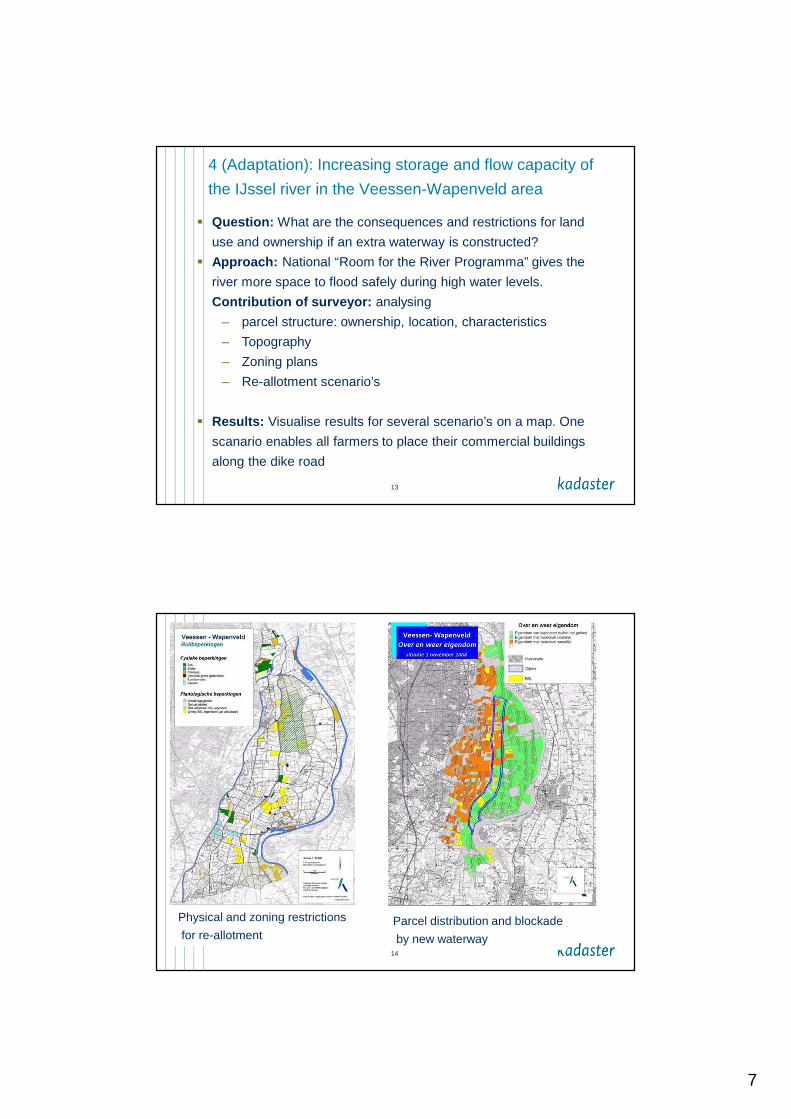
4 (Adaptation): Increasing storage and flow capacity of the IJssel river in the Veessen-Wapenveld area
7
13
� Question: What are the consequences and restrictions for land
use and ownership if an extra waterway is constructed?
� Approach: National “Room for the River Programma” gives the
river more space to flood safely during high water levels.
Contribution of surveyor: analysing
– parcel structure: ownership, location, characteristics
– Topography
– Zoning plans
– Re-allotment scenario’s
� Results: Visualise results for several scenario’s on a map. One
scanario enables all farmers to place their commercial buildings
along the dike road
4 (Adaptation): Increasing storage and flow capacity of
the IJssel river in the Veessen-Wapenveld area
14
Physical and zoning restrictions
for re-allotmentParcel distribution and blockade
by new waterway
8
15
Conclusions
� By combining core data from Land Administration Systems and other spatial datasets, highly relevant information can be build to support the development and implementation of energy and climate policy.
� The surveyor can contribute to this if he/she– has a thorough knowledge of the energy and climate challenges– understands the policy cycle and the level of information needed by
decision makers– is able to cooperate with other organisations to assemble this
information at a local, national or even international scale.
16
Thanks for your attention