Martin Donohoe. Determinants of Health Era Era Socioeconomic status Socioeconomic status Sex Sex...
131
Martin Donohoe Martin Donohoe
-
Upload
arnold-boyd -
Category
Documents
-
view
218 -
download
0
Transcript of Martin Donohoe. Determinants of Health Era Era Socioeconomic status Socioeconomic status Sex Sex...

Martin DonohoeMartin Donohoe

Determinants of HealthDeterminants of Health EraEra Socioeconomic statusSocioeconomic status SexSex RaceRace LocationLocation EnvironmentEnvironment GeneticsGenetics Health HabitsHealth Habits Access to CareAccess to Care Quality of CareQuality of Care

Health CareHealth Care
PreventionPreventionDiagnosisDiagnosisTreatmentTreatment

Copyright ©2010 American Public Health Association
Frieden, T. R. Am J Public Health 2010;100:590-595
The health impact pyramid

The State of U.S. Health The State of U.S. Health CareCare
42 million (13.4%) uninsured42 million (13.4%) uninsured42,000 deaths/year42,000 deaths/year
30 million more underinsured30 million more underinsuredRemain in dead-end jobsRemain in dead-end jobsGo without needed care and/or Go without needed care and/or prescriptionsprescriptions
MarryMarry

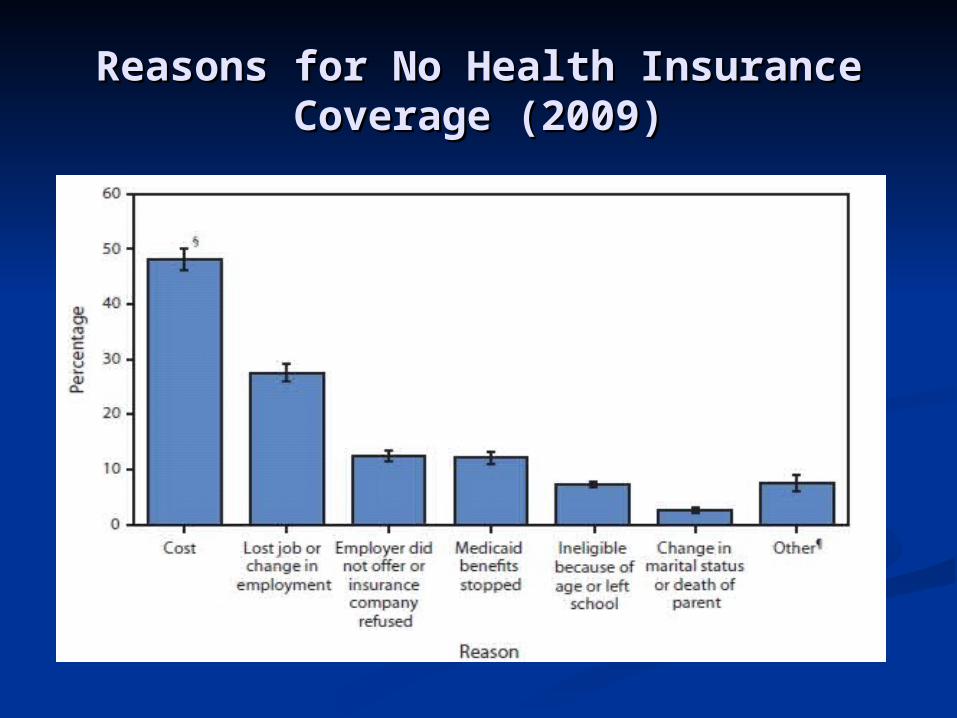
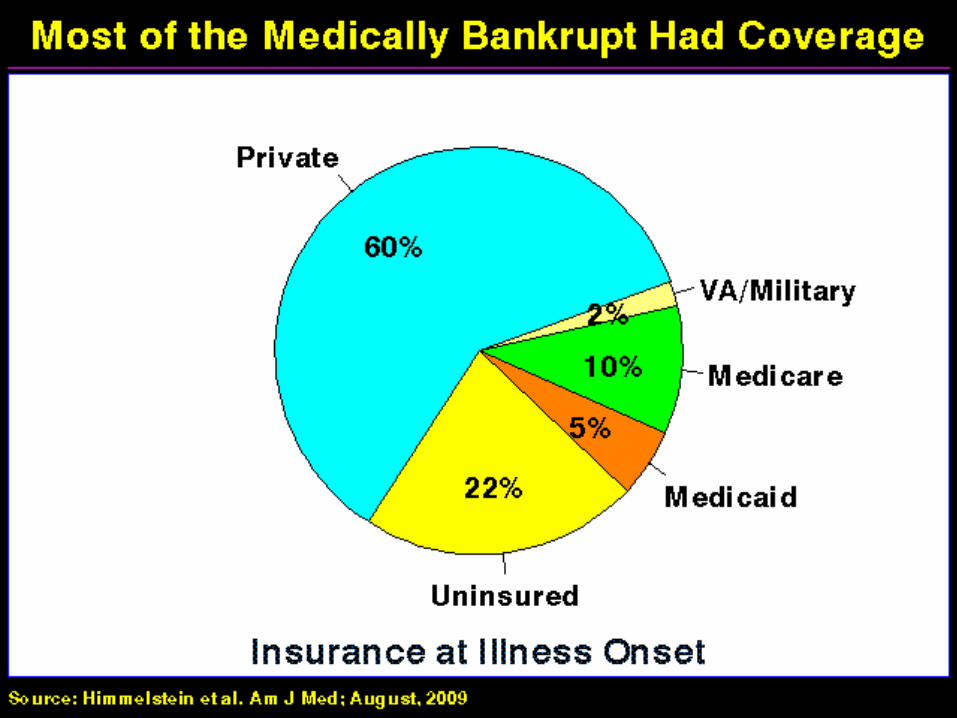
Reasons for No Health Insurance Reasons for No Health Insurance Coverage (2009)Coverage (2009)

The State of U.S. Health The State of U.S. Health CareCare
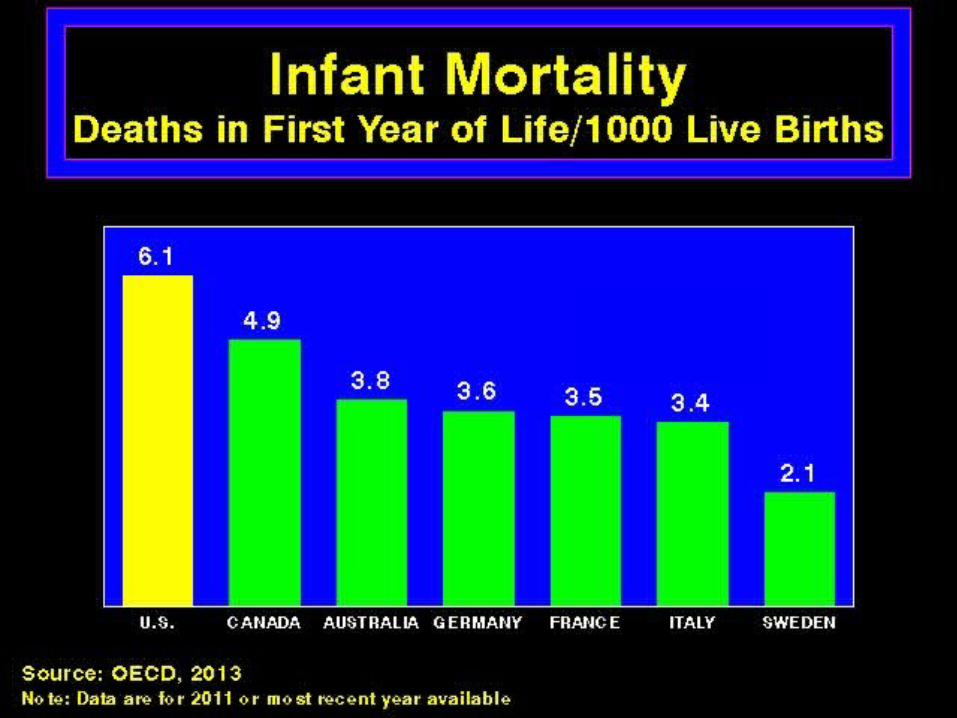
US ranks near the bottom US ranks near the bottom among westernized nations in among westernized nations in overall population health (#24), overall population health (#24), life expectancy (#42), infant life expectancy (#42), infant and maternal mortality, etc.and maternal mortality, etc.
15% of Americans live in 15% of Americans live in povertypoverty
22% of US children live in 22% of US children live in povertypoverty


Health Care Expenditures Health Care Expenditures per Capitaper Capita
U.S. = $9,255 (17.4% of GDP)U.S. = $9,255 (17.4% of GDP)U.S. #1 in spending on health U.S. #1 in spending on health
care, #25 in spending on social care, #25 in spending on social servicesservices
Canada, Australia, Japan, Canada, Australia, Japan, Europe: $3,000 to $6,000Europe: $3,000 to $6,000Average for low income Average for low income developing nations = $22-$25developing nations = $22-$25

Who Pays for Health Who Pays for Health Care?Care?
Government (federal, state, and local)Government (federal, state, and local) Medicare, Medicaid, VA, IHS, jails and Medicare, Medicaid, VA, IHS, jails and
prisonsprisons Private insurance:Private insurance:
806 companies, each with an assortment 806 companies, each with an assortment of plans)of plans)
Just 2 companies control over 50% of the Just 2 companies control over 50% of the market in 45 statesmarket in 45 states
Primarily employer-basedPrimarily employer-based Out-of-pocketOut-of-pocket

Who Pays for Health Who Pays for Health Care?Care?
Health care costs = 17.4% of Health care costs = 17.4% of GDP (1/2 of worldwide health GDP (1/2 of worldwide health care costs)care costs)
Huge variability in chargesHuge variability in chargesChargemasterChargemaster


Health Insurance Health Insurance IndustryIndustry
DelistingDelisting Cherry pickingCherry picking Pre-existing conditionsPre-existing conditions Charging uninsured 2-3X moreCharging uninsured 2-3X more Hiring debt collection agencies, Hiring debt collection agencies,
which sometimes hound patients which sometimes hound patients in the ER (in violation of EMTALA)in the ER (in violation of EMTALA)

Health Insurance Health Insurance Industry/BureaucracyIndustry/Bureaucracy
High administrative costsHigh administrative costs $450 billion/yr$450 billion/yr 15-30% (vs. 2-3% for Medicare and 15-30% (vs. 2-3% for Medicare and
Medicaid)Medicaid) Hospital bureaucracy consumes ¼ Hospital bureaucracy consumes ¼
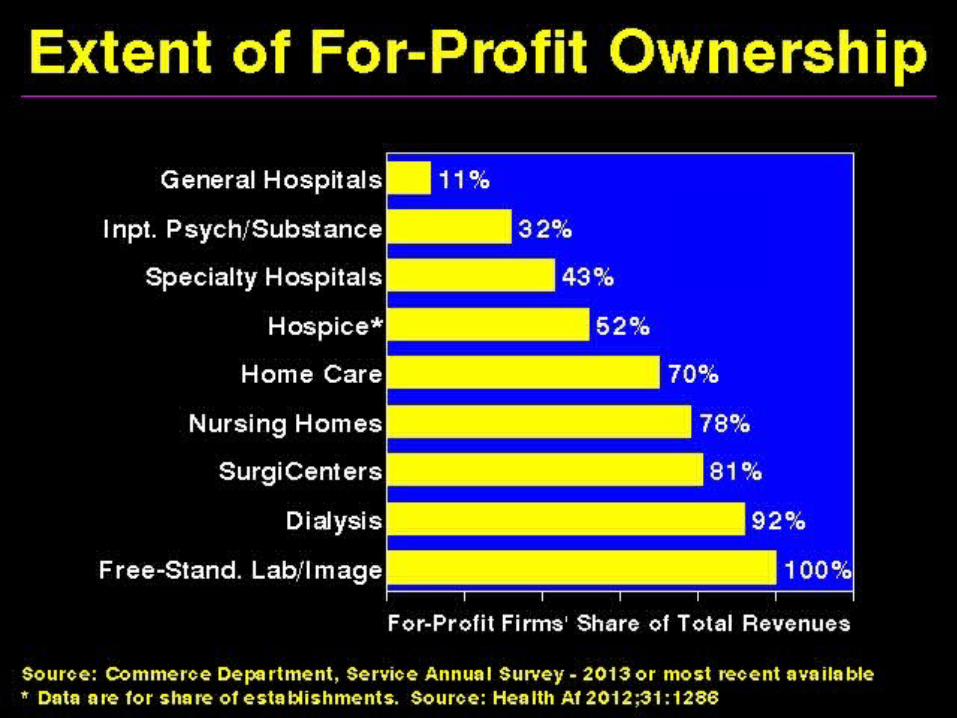
of hospital budgetsof hospital budgetsHighest at for-profit hospitalsHighest at for-profit hospitalsNo effect on quality of careNo effect on quality of care

Health Insurance Health Insurance Industry/BureaucracyIndustry/Bureaucracy
High administrative costsHigh administrative costsAverage full-time physician Average full-time physician
spends over $86,430/yr on spends over $86,430/yr on billing and insurance functionsbilling and insurance functions$83,000 trying to recoup payment; $83,000 trying to recoup payment; $3430 on prior authorizations$3430 on prior authorizations
17,849 different billing codes (in 17,849 different billing codes (in 2011) - now 141,0582011) - now 141,058

Administrative WorkAdministrative Work
Average doctor spends 17% of Average doctor spends 17% of working hours (8.7 hrs/wk) on working hours (8.7 hrs/wk) on administration (not including administration (not including charting, patient phone calls, charting, patient phone calls, usual care)usual care)
Doctors spending more time on Doctors spending more time on administration have lower administration have lower career satisfactioncareer satisfaction


Health Insurance Health Insurance IndustryIndustry
Amount actually spent on patient care Amount actually spent on patient care referred to as “medical loss ratio”referred to as “medical loss ratio”
Large profit marginsLarge profit margins Median pay of health care CEOs = $11.1 Median pay of health care CEOs = $11.1
million (2012)million (2012) Healthcare CEOs passed bankers as best paid Healthcare CEOs passed bankers as best paid
(2011)(2011)
Loyalty: shareholders (not patients)Loyalty: shareholders (not patients) CorruptionCorruption


Distribution of National Health Distribution of National Health ExpendituresExpenditures
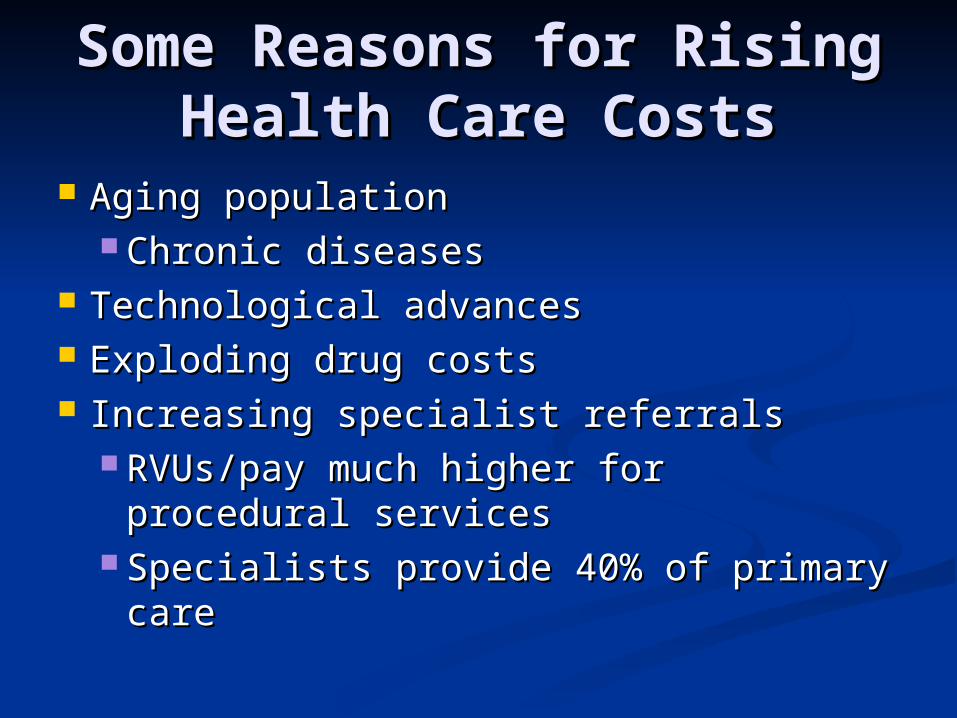
Some Reasons for Rising Some Reasons for Rising Health Care CostsHealth Care Costs
Aging populationAging population Chronic diseasesChronic diseases
Technological advancesTechnological advances Exploding drug costsExploding drug costs Increasing specialist referralsIncreasing specialist referrals
RVUs/pay much higher for procedural RVUs/pay much higher for procedural servicesservices
Specialists provide 40% of primary Specialists provide 40% of primary carecare

Some Reasons for Rising Some Reasons for Rising Health Care CostsHealth Care Costs
Procedural variabilityProcedural variability
Overuse of diagnostic tests, Overuse of diagnostic tests, medications, and therapeutic medications, and therapeutic proceduresprocedures
Administrative costsAdministrative costs

Medicaidlobby


Drug Companies’ Cost Drug Companies’ Cost StructureStructure
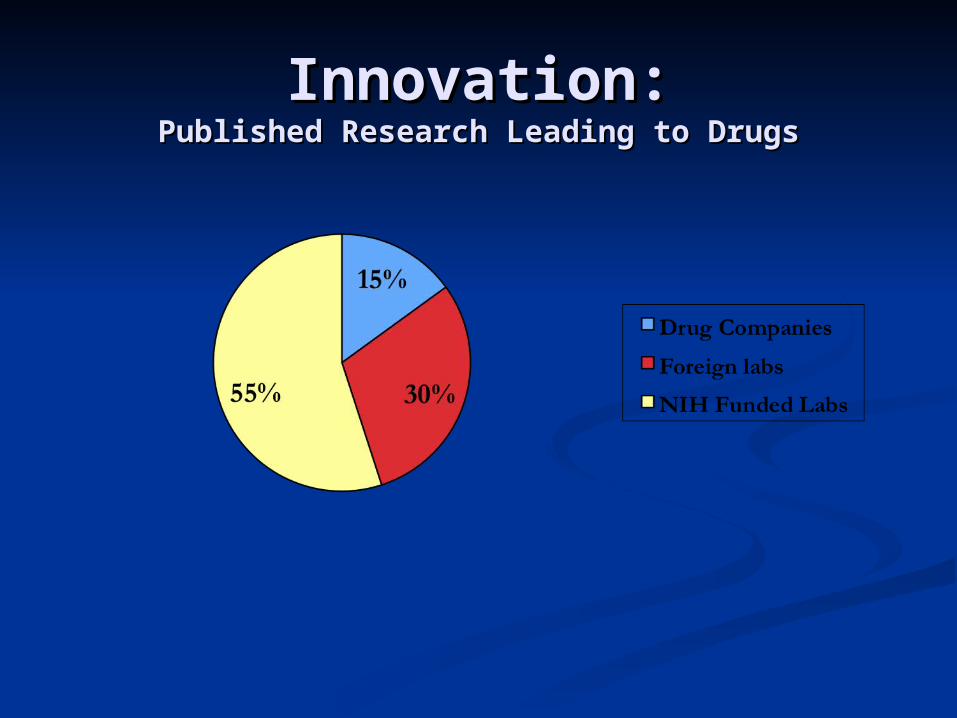
Innovation:Innovation:Published Research Leading to DrugsPublished Research Leading to Drugs

Drug Company Drug Company MalfeasanceMalfeasance
The pharmaceutical industry is the The pharmaceutical industry is the biggest defrauder of the federal biggest defrauder of the federal government, as determined by government, as determined by payments made for violations of the payments made for violations of the federal False Claims Act (FCA)federal False Claims Act (FCA) Accounted for 25% of all FCA Accounted for 25% of all FCA
payouts between 2000 and 2010payouts between 2000 and 2010 Defense industry – 11%Defense industry – 11%


LobbyingLobbying 15,000 full-time lobbyists15,000 full-time lobbyists Health insurance, pharmaceutical, Health insurance, pharmaceutical,
and organized medicine spend huge and organized medicine spend huge sums of money to influence sums of money to influence legislation and policylegislation and policyMore than twice the amount spent More than twice the amount spent
by the defense, aerospace, and oil by the defense, aerospace, and oil and gas industries combinedand gas industries combined

The “Global Economy”The “Global Economy” 53 of the world’s 100 largest 53 of the world’s 100 largest
economies are private economies are private corporations; 47 are countriescorporations; 47 are countriesWal-Mart is larger than Wal-Mart is larger than Israel and GreeceIsrael and Greece
AT&T is larger than Malaysia AT&T is larger than Malaysia and Irelandand Ireland

Premature Deaths in the Premature Deaths in the U.S.U.S.
10% due to inadequate 10% due to inadequate medical caremedical care
60% due to behaviors, social 60% due to behaviors, social circumstances, and circumstances, and environmental exposuresenvironmental exposures
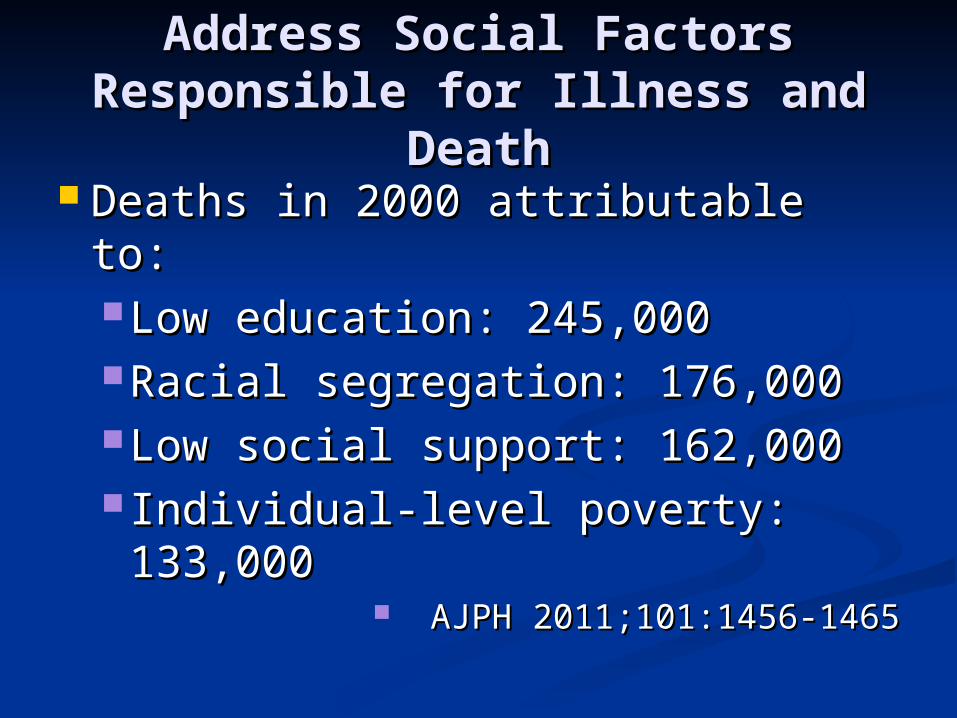
Address Social Factors Address Social Factors Responsible for Illness and Responsible for Illness and
DeathDeath Deaths in 2000 attributable to:Deaths in 2000 attributable to:
Low education: 245,000Low education: 245,000Racial segregation: 176,000Racial segregation: 176,000Low social support: 162,000Low social support: 162,000 Individual-level poverty: Individual-level poverty:
133,000133,000 AJPH 2011;101:1456-1465AJPH 2011;101:1456-1465

Address Social Factors Address Social Factors Responsible for Illness and Responsible for Illness and
DeathDeath Deaths in 2000 attributable to:Deaths in 2000 attributable to:
Income inequality: 119,000 Income inequality: 119,000 (population-attributable (population-attributable mortality – 5.1%)mortality – 5.1%)
Area-level poverty: 39,000 Area-level poverty: 39,000 (population-attributable (population-attributable mortality – 1.7%)mortality – 1.7%)
AJPH 2011;101:1456-1465AJPH 2011;101:1456-1465

Address Social Factors Address Social Factors Responsible for Illness and Responsible for Illness and
DeathDeath Deaths in 2000 attributable to:Deaths in 2000 attributable to:
AMI – 193,000AMI – 193,000CVD – 168,000CVD – 168,000Lung CA – 156,000Lung CA – 156,000
AJPH 2011;101:1456-1465AJPH 2011;101:1456-1465

Deaths per yearDeaths per year
Tobacco = 400,000 (+ 50,000 ETS)Tobacco = 400,000 (+ 50,000 ETS) Obesity = 300,000Obesity = 300,000 Alcohol = 100,000Alcohol = 100,000 Microbial agents = 90,000Microbial agents = 90,000 Toxic agents = 60,000 (likely higher)Toxic agents = 60,000 (likely higher) Firearms = 35,000Firearms = 35,000 Sexual behaviors = 30,000Sexual behaviors = 30,000 Motor vehicles = 25,000Motor vehicles = 25,000 Illicit drug use = 20,000Illicit drug use = 20,000

Major Contributors to Major Contributors to Illness and DeathIllness and Death
Estimated that medical care accounts for Estimated that medical care accounts for only 10% of overall healthonly 10% of overall health Social, environmental, behavioral, and Social, environmental, behavioral, and
genetic factors = 90%genetic factors = 90% 40% of US mortality due to tobacco, poor 40% of US mortality due to tobacco, poor
diet, physical inactivity, and misuse of diet, physical inactivity, and misuse of alcoholalcohol Every $1 invested in programs covering Every $1 invested in programs covering
above items saves $5.60 in health care above items saves $5.60 in health care costscosts

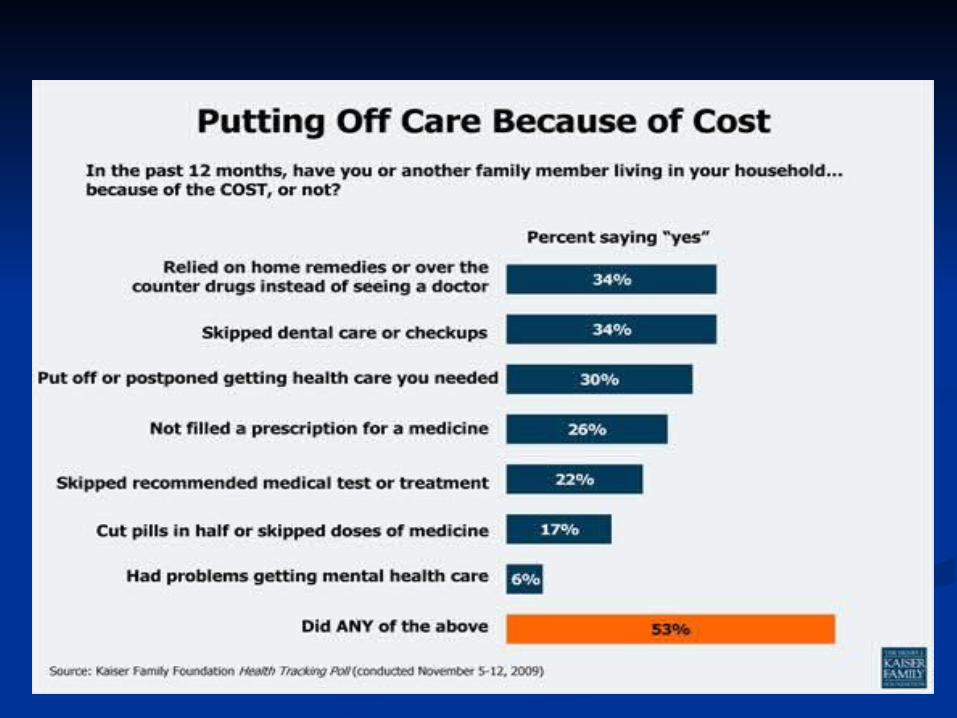
PreventionPrevention
2-4% of national health care 2-4% of national health care expendituresexpenditures
Every $1 spent on building biking Every $1 spent on building biking trails and walking paths would save trails and walking paths would save nearly $3 in medical expensesnearly $3 in medical expenses
Every $1 spent on wellness Every $1 spent on wellness programs, companies would save programs, companies would save over $3 in medical costs and almost over $3 in medical costs and almost $3 in absenteeism costs$3 in absenteeism costs

Public Health SpendingPublic Health Spending
Public health spending minimalPublic health spending minimal
Mortality rates fall 1-7% for Mortality rates fall 1-7% for every 10% increase in public every 10% increase in public health spendinghealth spending

ComplianceCompliance
33% of prescriptions go unfilled33% of prescriptions go unfilled Only 50-65% of patients take medicines as Only 50-65% of patients take medicines as
prescribedprescribed Noncompliant patients more likely to be Noncompliant patients more likely to be
hospitalized and to diehospitalized and to die Noncompliant patients have twice the annual Noncompliant patients have twice the annual
medical care costs of those who are compliantmedical care costs of those who are compliant Cost, health literacy contribute to Cost, health literacy contribute to
noncompliancenoncompliance 25% of Americans functionally illiterate25% of Americans functionally illiterate

Poverty and HungerPoverty and Hunger US: 15% of residents and 22% of children US: 15% of residents and 22% of children
live in povertylive in poverty Rates of poverty in Blacks and Hispanics Rates of poverty in Blacks and Hispanics
= 2X Whites= 2X Whites Poverty associated with worse physical Poverty associated with worse physical
and mental healthand mental health Income inequality associated with higher Income inequality associated with higher
death rates among those at low end of death rates among those at low end of economic spectrumeconomic spectrum

Economic DisparitiesEconomic DisparitiesWomen 75 centsWomen 75 cents/$1 Men/$1 MenMedian income of black Median income of black
U.S. families as a percent U.S. families as a percent of white U.S. families of white U.S. families 62%62%60% in 196860% in 1968
63% for Hispanic families63% for Hispanic families


Educational ApartheidEducational Apartheid
High levels of de facto school High levels of de facto school segregation by race and SESsegregation by race and SES
Gross discrepancies in per-pupil Gross discrepancies in per-pupil spending and teacher salariesspending and teacher salaries
Achievement and graduation gaps Achievement and graduation gaps growinggrowing

Patient EducationPatient Education
Patient education materials typically Patient education materials typically written at 10written at 10thth-14-14thth grade level grade levelAverage patient reads at 8Average patient reads at 8thth grade grade
levellevel
<50% of visits for major illnesses <50% of visits for major illnesses involve health education (across all involve health education (across all provider types)provider types)

EducationEducation
Medical advances averted a Medical advances averted a maximum of 178,000 deaths maximum of 178,000 deaths between 1996 and 2002between 1996 and 2002
Correcting disparities in Correcting disparities in education-associated mortality education-associated mortality would have save 1.3 million lives would have save 1.3 million lives during the same periodduring the same period
AJPH 2007;97:679-83AJPH 2007;97:679-83

Urban/Rural DisparitiesUrban/Rural Disparities
25% of the U.S. population 25% of the U.S. population lives in rural areaslives in rural areas
Only 10% of U.S. physicians Only 10% of U.S. physicians practice in rural areaspractice in rural areas

Racial Disparities in Racial Disparities in Health Care CoverageHealth Care Coverage
Percent uninsured:Percent uninsured: Whites = 12%Whites = 12% Asians = 17%Asians = 17% African-Americans = 21%African-Americans = 21% Hispanics = 32%Hispanics = 32% Undocumented immigrants = 59% Undocumented immigrants = 59%
(emergency care exception)(emergency care exception) CA Proposition 189CA Proposition 189

Racial Disparities in Health Care:Racial Disparities in Health Care:African-AmericansAfrican-Americans
Higher maternal and infant Higher maternal and infant mortalitymortality
Higher death rates for most Higher death rates for most diseasesdiseases
Shorter life expectanciesShorter life expectanciesLess health insuranceLess health insuranceUndergo fewer diagnostic tests / Undergo fewer diagnostic tests / therapeutic procedurestherapeutic procedures


Health Disparities Health Disparities Among LatinosAmong Latinos
Higher rates of:Higher rates of: Overweight and obesityOverweight and obesity Certain cancersCertain cancers StrokeStroke DiabetesDiabetes Asthma/COPDAsthma/COPD Chronic liver disease/cirrhosisChronic liver disease/cirrhosis HIV/AIDSHIV/AIDS HomicideHomicide
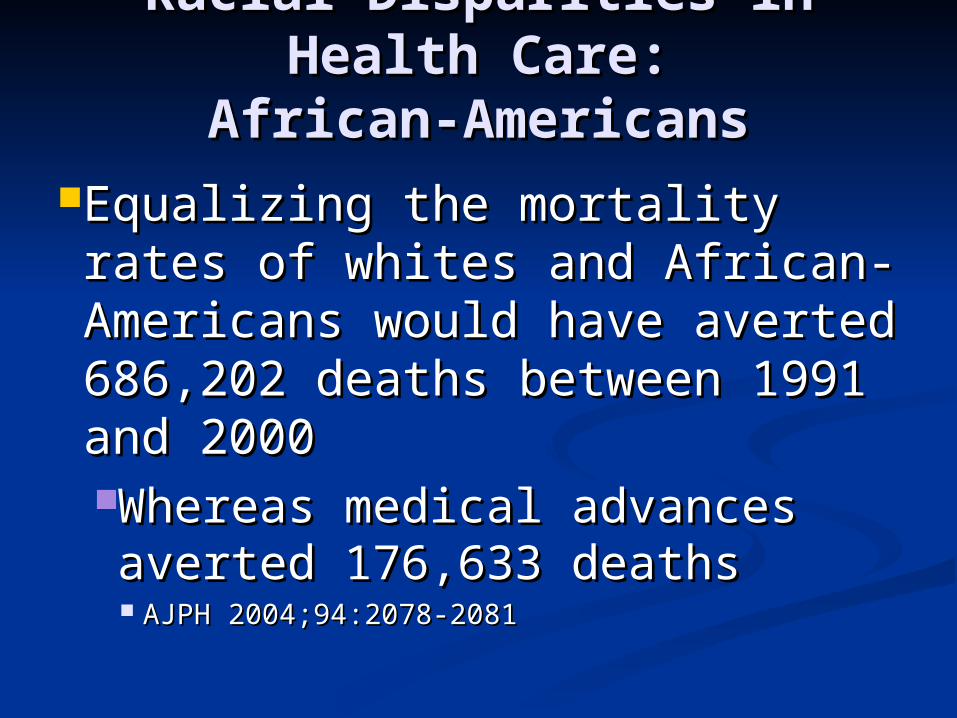
Racial Disparities in Health Racial Disparities in Health Care:Care:
African-AmericansAfrican-AmericansEqualizing the mortality rates Equalizing the mortality rates of whites and African-of whites and African-Americans would have averted Americans would have averted 686,202 deaths between 1991 686,202 deaths between 1991 and 2000and 2000Whereas medical advances Whereas medical advances averted 176,633 deathsaverted 176,633 deaths AJPH 2004;94:2078-2081AJPH 2004;94:2078-2081

Outside the USOutside the US One billion people lack clean One billion people lack clean
drinking water and 3 billion lack drinking water and 3 billion lack sanitationsanitation13,000-15,000 deaths per day 13,000-15,000 deaths per day
worldwide from water-related worldwide from water-related diseasesdiseases
Hunger kills as many individuals in Hunger kills as many individuals in eight days as died during the atomic eight days as died during the atomic bombing of Hiroshimabombing of Hiroshima
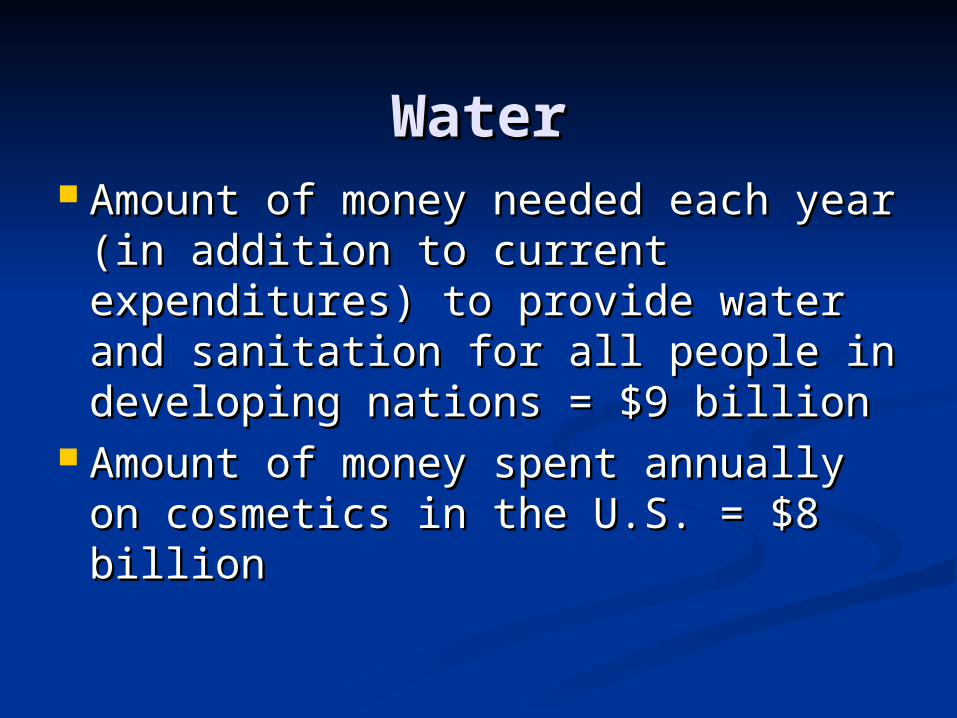
WaterWater Amount of money needed each Amount of money needed each
year (in addition to current year (in addition to current expenditures) to provide water expenditures) to provide water and sanitation for all people in and sanitation for all people in developing nations = $9 billiondeveloping nations = $9 billion
Amount of money spent annually Amount of money spent annually on cosmetics in the U.S. = $8 on cosmetics in the U.S. = $8 billionbillion
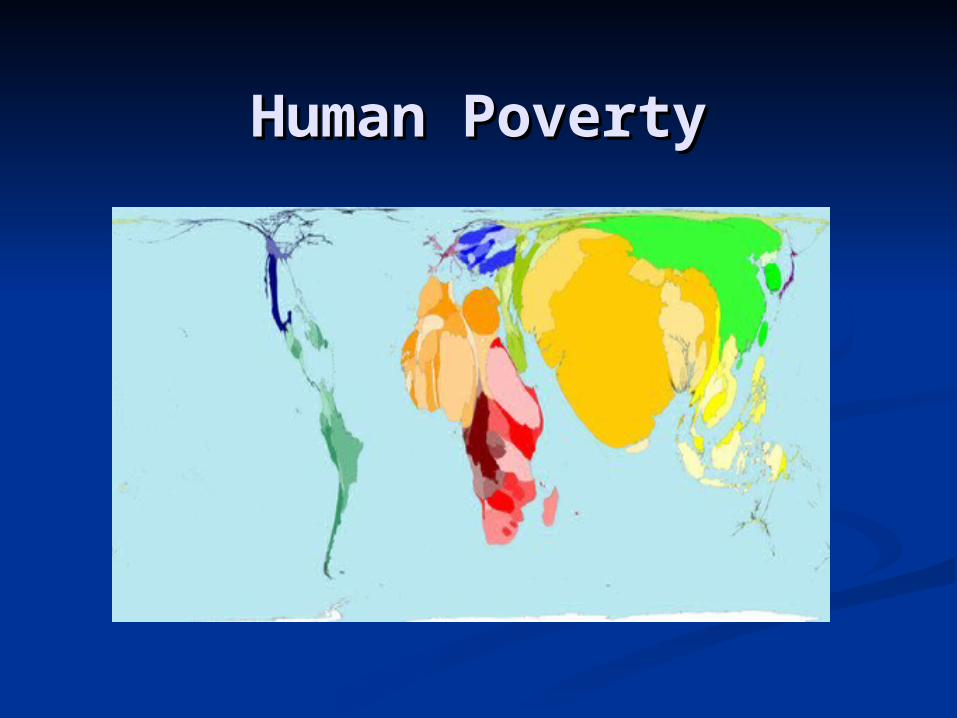
Human PovertyHuman Poverty

Percentage of population living Percentage of population living on less than one dollar per dayon less than one dollar per day

HIV PrevalenceHIV Prevalence

Malaria DeathsMalaria Deaths

OverpopulationOverpopulation World population - exponential World population - exponential
growthgrowth 1 billion in 18001 billion in 1800 2.5 billion in 19502.5 billion in 1950 6 billion in 20006 billion in 2000 7 billion in 20117 billion in 2011 est. 9 billion by 2050est. 9 billion by 2050

Status of WomenStatus of Women
Women do 67% of the Women do 67% of the world’s workworld’s work
Receive 10% of global Receive 10% of global incomeincome
Own 1% of all propertyOwn 1% of all property

Worldwide, every minuteWorldwide, every minute 380 women become pregnant (190 380 women become pregnant (190
unplanned or unwanted)unplanned or unwanted) 110 women experience pregnancy-related 110 women experience pregnancy-related
complicationscomplications 40 women have unsafe abortions40 women have unsafe abortions 1 woman dies from childbirth or unsafe 1 woman dies from childbirth or unsafe
abortionabortion
Reason: Lack of access to reproductive Reason: Lack of access to reproductive health serviceshealth services
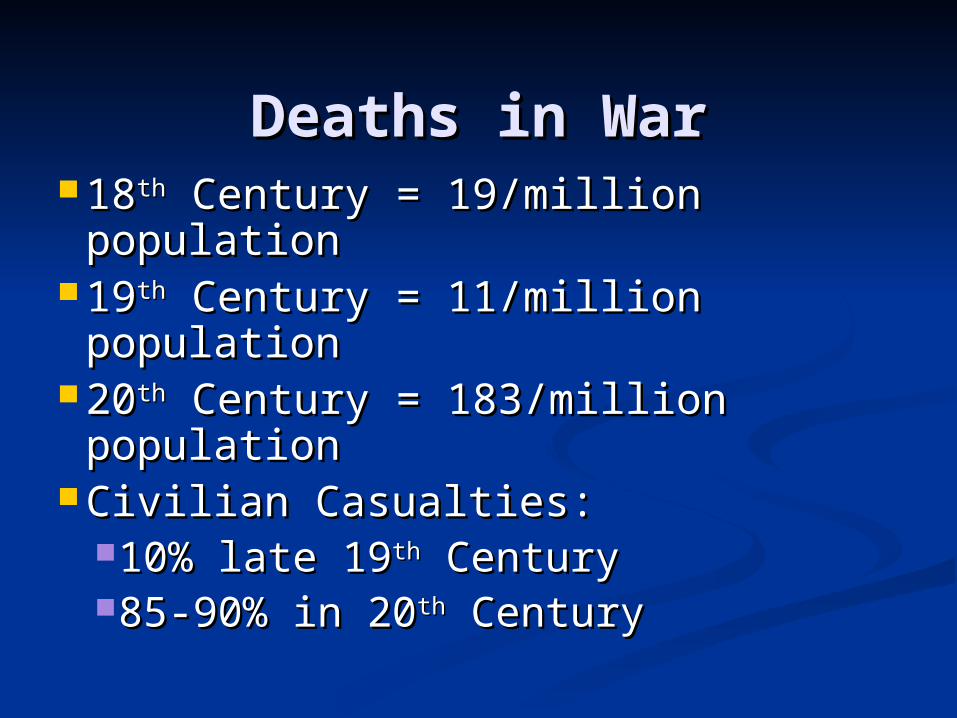
Deaths in WarDeaths in War 1818thth Century = 19/million Century = 19/million
populationpopulation 1919thth Century = 11/million Century = 11/million
populationpopulation 2020thth Century = 183/million Century = 183/million
populationpopulation Civilian Casualties:Civilian Casualties:
10% late 1910% late 19thth Century Century85-90% in 2085-90% in 20thth Century Century

Contemporary WarsContemporary Wars250 wars in the 20250 wars in the 20thth CenturyCentury
Most conflicts within poor Most conflicts within poor statesstates• Many over oilMany over oil

War Deaths, 1945-2000War Deaths, 1945-2000

The Medical Brain DrainThe Medical Brain Drain
U.S. is largest consumer of health U.S. is largest consumer of health care personnelcare personnel
U.S. (4.5% of world’s population) has U.S. (4.5% of world’s population) has 8% of world’s doctors and 7% of 8% of world’s doctors and 7% of world’s nursesworld’s nurses
Five times as many migrating doctors Five times as many migrating doctors flow from developing to developed flow from developing to developed nations than in the opposite directionnations than in the opposite direction Even greater imbalance for nursesEven greater imbalance for nurses
The Medical Brain DrainThe Medical Brain Drain
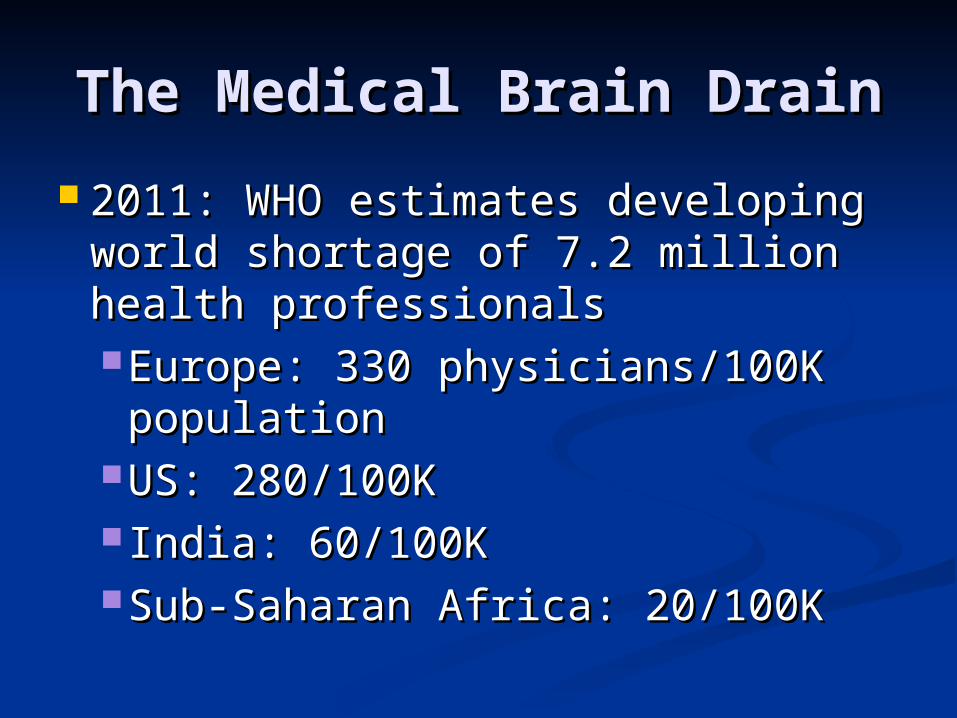
2011: WHO estimates developing 2011: WHO estimates developing world shortage of 7.2 million world shortage of 7.2 million health professionalshealth professionalsEurope: 330 physicians/100K Europe: 330 physicians/100K
populationpopulationUS: 280/100KUS: 280/100K India: 60/100KIndia: 60/100KSub-Saharan Africa: 20/100K Sub-Saharan Africa: 20/100K

The Medical Brain DrainThe Medical Brain Drain
Example of “inverse care law”:Example of “inverse care law”:Those countries that need the most Those countries that need the most
health care resources are getting health care resources are getting the leastthe least
Voluntary WHO Global Code of Voluntary WHO Global Code of Practice on the International Practice on the International Recruitment of Health Care Personnel Recruitment of Health Care Personnel (adopted 2010)(adopted 2010)U.S. working on implementingU.S. working on implementing

TobaccoTobaccoCigarettes most heavily Cigarettes most heavily marketed products in marketed products in the worldthe world$2 billion/year in the $2 billion/year in the U.S.U.S.
U.S. leading exporter U.S. leading exporter of cigarettesof cigarettes

Tobacco – Weapon of Mass Tobacco – Weapon of Mass DestructionDestruction
Direct medical costs = $100 Direct medical costs = $100 billion/yr billion/yr
Lost productivity = $97 billion/yrLost productivity = $97 billion/yr Medical care and lost Medical care and lost
productivity due to tobacco use productivity due to tobacco use costs each U.S. citizen costs each U.S. citizen approximately $600/yrapproximately $600/yr

Consequences of Environmental Consequences of Environmental DestructionDestruction
Global warming: 160,000 Global warming: 160,000 deaths and 5.5 million deaths and 5.5 million disability-adjusted life years disability-adjusted life years lost per year (will double by lost per year (will double by 2020)2020)
Air pollution: 60,000 - 75,000 Air pollution: 60,000 - 75,000 premature deaths/yr. (U.S.); premature deaths/yr. (U.S.); 1.8 million worldwide1.8 million worldwide

Consequences of Consequences of Environmental Environmental
DestructionDestruction Pesticides in food Pesticides in food → → 1,000,000 deaths 1,000,000 deaths
over the last 6 years; 1 million cancers over the last 6 years; 1 million cancers in current generation of Americansin current generation of Americans
Lead and mercury exposure multi-Lead and mercury exposure multi-billion dollar problemsbillion dollar problems
Other toxins – linked with heart Other toxins – linked with heart disease, asthma, cancer, infertility, disease, asthma, cancer, infertility, Parkinson’s disease, Alzheimer’s, Parkinson’s disease, Alzheimer’s, autism, etc.autism, etc.

Toxic PollutantsToxic Pollutants
¼ US citizens live within 4 miles ¼ US citizens live within 4 miles of a Superfund siteof a Superfund site
Environmental RacismEnvironmental Racism Waste dumps/incinerators more Waste dumps/incinerators more
common in lower SES common in lower SES neighborhoodsneighborhoods
e.g., “Cancer Belt” (Baton e.g., “Cancer Belt” (Baton Rouge to New Orleans)Rouge to New Orleans)

Extinction/Species LossExtinction/Species Loss
Mass ExtinctionMass Extinction More than 1/2 of the top 150 More than 1/2 of the top 150
prescription drugs from plants, prescription drugs from plants, other living organismsother living organisms
More than 250,000 known More than 250,000 known flowering speciesflowering species <0.5% surveyed for medicinal <0.5% surveyed for medicinal
valuevalue

Overconsumption Overconsumption (“Affluenza”)(“Affluenza”)
U.S. = 4.5% of world’s populationU.S. = 4.5% of world’s populationOwns 50% of the world’s wealthOwns 50% of the world’s wealth
U.S. responsible for:U.S. responsible for:25% of world’s energy 25% of world’s energy consumptionconsumption
33% of paper use33% of paper use72% of hazardous waste 72% of hazardous waste productionproduction

New Remote Control Can Be Operated by New Remote Control Can Be Operated by Remote: No More Leaning Forward To Get Remote: No More Leaning Forward To Get Remote From Coffee Table Means Greater Remote From Coffee Table Means Greater
Convenience For TV ViewersConvenience For TV Viewers

But Are We Happier?But Are We Happier?
U.S. ranks 24U.S. ranks 24thth in citizen in citizen satisfaction with quality of lifesatisfaction with quality of life
Average American works 200 Average American works 200 more hrs/yr than in 1960 (#1 more hrs/yr than in 1960 (#1 in world)in world)
Vacations shorterVacations shorter

But Are We Happier?But Are We Happier?
No guaranteed paid sick leaveNo guaranteed paid sick leave Although many cities, some states now Although many cities, some states now
guaranteeguarantee
8/10 Americans want a new job8/10 Americans want a new job Fewer close friendsFewer close friends More loneliness/depressionMore loneliness/depression
Pharmaceutical fixesPharmaceutical fixes

Worldwide Health: Can Worldwide Health: Can Aid Help?Aid Help?
US ranks 21US ranks 21stst in the world in in the world in foreign aid as a percentage foreign aid as a percentage of GDP (0.7%)of GDP (0.7%)
Foreign Aid:Foreign Aid:1/3 military1/3 military1/3 economic1/3 economic1/3 food and development1/3 food and development

Worldwide Health: Can Worldwide Health: Can Aid Help?Aid Help?
U.S charitable giving approximately U.S charitable giving approximately $250 billion/year$250 billion/year 2.5% of income2.5% of income 2.9% at height of Great Depression2.9% at height of Great Depression Poor donate higher percentage of Poor donate higher percentage of
their incomes than rich; blacks their incomes than rich; blacks more than whitesmore than whites
Most stays in USMost stays in US
US Charity Care SufferingUS Charity Care SufferingPublic hospitals and ERs closingPublic hospitals and ERs closing
Long waits mean many leave Long waits mean many leave before being seenbefore being seen
Hospitals provide very little Hospitals provide very little charitable care (<1% when charitable care (<1% when adjusted for Medicare charges; adjusted for Medicare charges; includes bad debt)includes bad debt)

US Charity Care US Charity Care SufferingSuffering
Free clinic demand increasing, more Free clinic demand increasing, more patients being turned awaypatients being turned away
Hospitals turning to lucrative Hospitals turning to lucrative initiatives to improve financial situationinitiatives to improve financial situationCosmetic surgery, luxury clinics, Cosmetic surgery, luxury clinics, aggressive billing practices (including aggressive billing practices (including charging uninsured more than charging uninsured more than insured), recruiting wealthy foreign insured), recruiting wealthy foreign patientspatients

Maldistribution of WealthMaldistribution of Wealth Top 250 billionaires worldwide worth Top 250 billionaires worldwide worth
$1 trillion, the combined income of $1 trillion, the combined income of bottom 2.5 billion people (45% of bottom 2.5 billion people (45% of world’s population)world’s population)
U.S: Richest 1% of the population U.S: Richest 1% of the population owns 50% of the country’s wealth owns 50% of the country’s wealth -poorest 90% own 30%-poorest 90% own 30%-widest gap of any industrialized -widest gap of any industrialized nationnation

Income Inequality KillsIncome Inequality Kills
Higher income Higher income inequality is associated inequality is associated with increased with increased mortality at all per mortality at all per capita income levelscapita income levels

Income InequalityIncome Inequality
Lower life expectancyLower life expectancy Higher rates of infant and child Higher rates of infant and child
mortalitymortality 20 million deaths per year 20 million deaths per year
worldwideworldwide Short heightShort height Poor self-reported healthPoor self-reported health AIDSAIDS

Income InequalityIncome Inequality
DepressionDepression Mental IllnessMental Illness ObesityObesity CrimeCrime Diminished trust in people and Diminished trust in people and
institutionsinstitutions

Maldistribution of Maldistribution of Wealth is DeadlyWealth is Deadly
880,000 deaths/yr in U.S. 880,000 deaths/yr in U.S. would be averted if the would be averted if the country had an income gap country had an income gap like Western European like Western European nations, with their stronger nations, with their stronger social safety netssocial safety nets
BMJ 2009;339:b4471BMJ 2009;339:b4471
Maldistribution of Maldistribution of WealthWealth
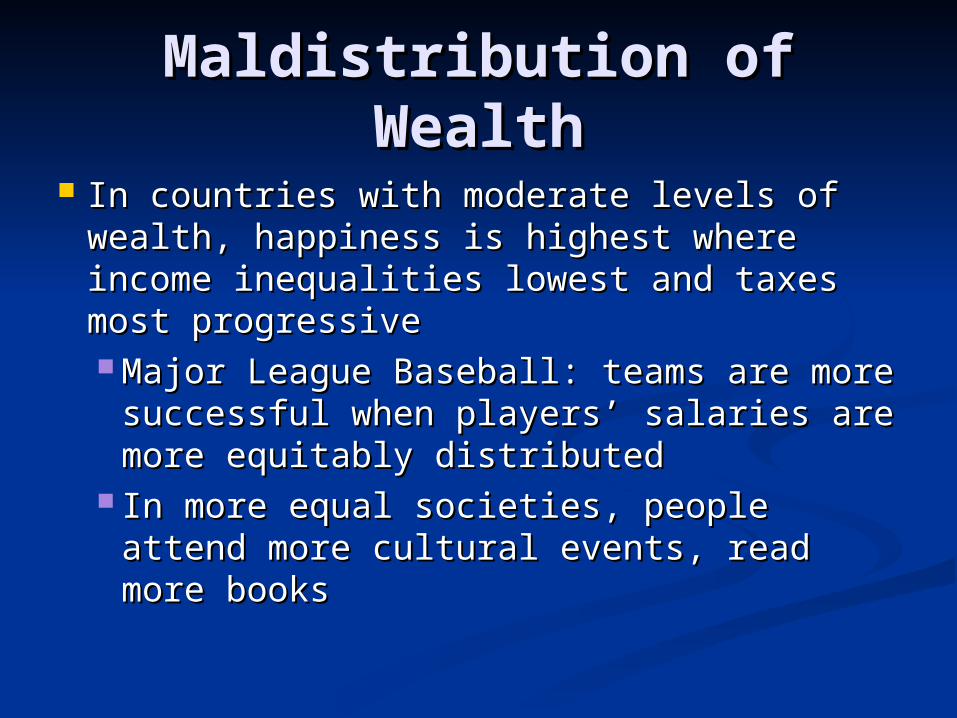
In countries with moderate levels of In countries with moderate levels of wealth, happiness is highest where wealth, happiness is highest where income inequalities lowest and taxes income inequalities lowest and taxes most progressivemost progressive Major League Baseball: teams are Major League Baseball: teams are
more successful when players’ salaries more successful when players’ salaries are more equitably distributedare more equitably distributed
In more equal societies, people attend In more equal societies, people attend more cultural events, read more booksmore cultural events, read more books

Maldistribution of wealthMaldistribution of wealth
Less than 4% of the combined Less than 4% of the combined
wealth of the 225 richest wealth of the 225 richest
individuals in the world would pay individuals in the world would pay
for ongoing access to basic for ongoing access to basic
education, health care (including education, health care (including
reproductive health care), adequate reproductive health care), adequate
food, safe water, and adequate food, safe water, and adequate
sanitation for all humanssanitation for all humans

Health Requires EqualityHealth Requires Equality““All men are created All men are created equal”equal”Declaration of IndependenceDeclaration of Independence
““Some people are more Some people are more equal than others”equal than others”George OrwellGeorge Orwell

Hudson River, 2009Hudson River, 2009

U.N. Declaration of Human U.N. Declaration of Human RightsRights
““Everyone has the right to Everyone has the right to a standard of living a standard of living adequate for the health and adequate for the health and well-being of himself and of well-being of himself and of his family, including food, his family, including food, clothing, housing and clothing, housing and medical care”medical care”

SolutionsSolutionsPay as you goPay as you goInsuranceInsuranceGovernment-run programGovernment-run program
VA, HISVA, HISPPACAPPACASingle PayerSingle Payer
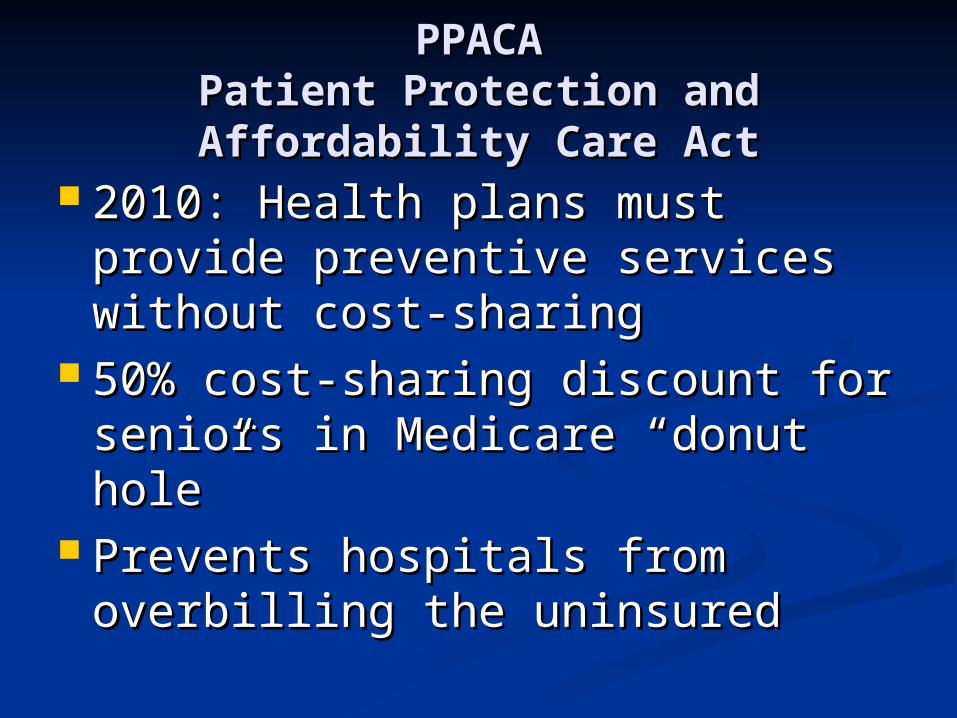
PPACAPPACAPatient Protection and Patient Protection and Affordability Care ActAffordability Care Act
2010: Health plans must provide 2010: Health plans must provide preventive services without cost-preventive services without cost-sharingsharing
50% cost-sharing discount for 50% cost-sharing discount for seniors in Medicare “donut hole”seniors in Medicare “donut hole”
Prevents hospitals from Prevents hospitals from overbilling the uninsuredoverbilling the uninsured

PPACAPPACAPatient Protection and Patient Protection and Affordability Care ActAffordability Care Act
2010: Young adults up to age 26 may 2010: Young adults up to age 26 may stay on parents’ health planstay on parents’ health plan
2010: Small business tax credits to 2010: Small business tax credits to offset costs of insuring employeesoffset costs of insuring employees
2010: Insurers cannot deny coverage 2010: Insurers cannot deny coverage to children with preexisting to children with preexisting conditionsconditions
2010: No lifetime benefit limits and 2010: No lifetime benefit limits and no rescissionsno rescissions

PPACAPPACAPatient Protection and Patient Protection and Affordability Care ActAffordability Care Act
2010: Uninsured with preexisting 2010: Uninsured with preexisting conditions eligible for special insurance conditions eligible for special insurance plans after 6 months without insuranceplans after 6 months without insurance
2011: Insurers must spend at least 80-2011: Insurers must spend at least 80-85% of premium dollars on health care85% of premium dollars on health care
2014: No denial of coverage or higher 2014: No denial of coverage or higher premiums for preexisting conditionspremiums for preexisting conditions Up to ½ of AmericansUp to ½ of Americans

PPACAPPACAPatient Protection and Patient Protection and Affordability Care ActAffordability Care Act
2014: 26 million uninsured adults 2014: 26 million uninsured adults with incomes under $29,327 will gain with incomes under $29,327 will gain coverage through Medicaid with little coverage through Medicaid with little or no premium or cost sharingor no premium or cost sharing
2014: Up to 17 million adults with 2014: Up to 17 million adults with incomes between $29,327 and incomes between $29,327 and $88,200 for a family of 4 will get tax $88,200 for a family of 4 will get tax credits to help purchase private credits to help purchase private health plans through new state health plans through new state insurance exchanges (sliding scale)insurance exchanges (sliding scale)

PPACAPPACAPatient Protection and Patient Protection and Affordability Care ActAffordability Care Act
Creates public website listing payments Creates public website listing payments from drug, device, biological, and from drug, device, biological, and medical products companies to medical products companies to physiciansphysicians
Levies 2.3% medical device excise tax Levies 2.3% medical device excise tax on manufacturerson manufacturers
Establishes 10% tanning salon taxEstablishes 10% tanning salon tax Employers must provide time and space Employers must provide time and space
for mothers to nurse babies up to age 1for mothers to nurse babies up to age 1

PPACAPPACAPatient Protection and Patient Protection and Affordability Care ActAffordability Care Act
Problems:Problems:Complex, increases Complex, increases
bureaucracybureaucracy906 page bill906 page billComputer problemsComputer problems
Many states plan to opt outMany states plan to opt outDelays in implementationDelays in implementation

PPACAPPACAPatient Protection and Patient Protection and Affordability Care ActAffordability Care Act
Problems:Problems: Leaves 32 million without insuranceLeaves 32 million without insurance
40% of these eligible for, but not 40% of these eligible for, but not enrolled in, Medicaid or CHIPenrolled in, Medicaid or CHIP
22% undocumented immigrants22% undocumented immigrantsTranslates into 32,000 excess Translates into 32,000 excess annual deathsannual deaths

PPACAPPACAPatient Protection and Patient Protection and Affordability Care ActAffordability Care Act
Problems:Problems: No effective cost control measuresNo effective cost control measures Will not reduce medical bankruptciesWill not reduce medical bankruptcies Will drain $billions from Medicare Will drain $billions from Medicare
payments to safety net clinics, payments to safety net clinics, threatening the remaining uninsuredthreatening the remaining uninsured
Estimated 7,000 – 17,000 deaths Estimated 7,000 – 17,000 deaths estimated due to lack of Medicaid estimated due to lack of Medicaid expansion in opt-out statesexpansion in opt-out states

PPACAPPACAPatient Protection and Patient Protection and Affordability Care ActAffordability Care Act
Unfair to women - segregation of Unfair to women - segregation of abortion funding, may affect abortion funding, may affect contraceptive coveragecontraceptive coverage
Poor likely to purchase less Poor likely to purchase less expensive plans with worse expensive plans with worse coverage and higher deductibles coverage and higher deductibles and copaymentsand copayments
?Penalties if poor do not buy ?Penalties if poor do not buy insurance?insurance?

PPACAPPACAPatient Protection and Patient Protection and Affordability Care ActAffordability Care Act
Problems:Problems: Loopholes allow charges up to 3x Loopholes allow charges up to 3x
higher for elderly, higher charges higher for elderly, higher charges for large companies with for large companies with predominantly female workforcespredominantly female workforces
Benefits insurance companies, Benefits insurance companies, continues present inefficienciescontinues present inefficiencies
$billions just to enroll people

PPACAPPACAPatient Protection and Patient Protection and Affordability Care ActAffordability Care Act
Problems: Pay for Performance likely to backfire per Pay for Performance likely to backfire per
behavioral economics research, behavioral economics research, incentivizes greedincentivizes greed
ACOs contributing to ACOs contributing to upcoding/overdiagnosis arms raceupcoding/overdiagnosis arms race
Electronic health records mandated, but Electronic health records mandated, but no evidence of cost savings or better careno evidence of cost savings or better care
Limits provider discussions re gun Limits provider discussions re gun ownership and safetyownership and safety

PPACAPPACAPatient Protection and Patient Protection and Affordability Care ActAffordability Care Act
Inadequate numbers of primary care Inadequate numbers of primary care providersproviders Communities with a high number of Communities with a high number of
PCPs per capita have lower medical PCPs per capita have lower medical costs and better outcomescosts and better outcomesBut only 49% of physician visits in But only 49% of physician visits in 2013 were with primary care doctors2013 were with primary care doctors
High levels of burnout and career High levels of burnout and career dissatisfactiondissatisfaction

PPACAPPACAPatient Protection and Patient Protection and Affordability Care ActAffordability Care Act
Over 1/3 of physicians are Over 1/3 of physicians are accepting no new Medicaid accepting no new Medicaid patients, and ¼ see no Medicaid patients, and ¼ see no Medicaid patientspatientsDue to low reimbursements, Due to low reimbursements,
multiple social needsmultiple social needs Availability of some subspecialists Availability of some subspecialists
extremely limited (e.g., psychiatry)extremely limited (e.g., psychiatry)
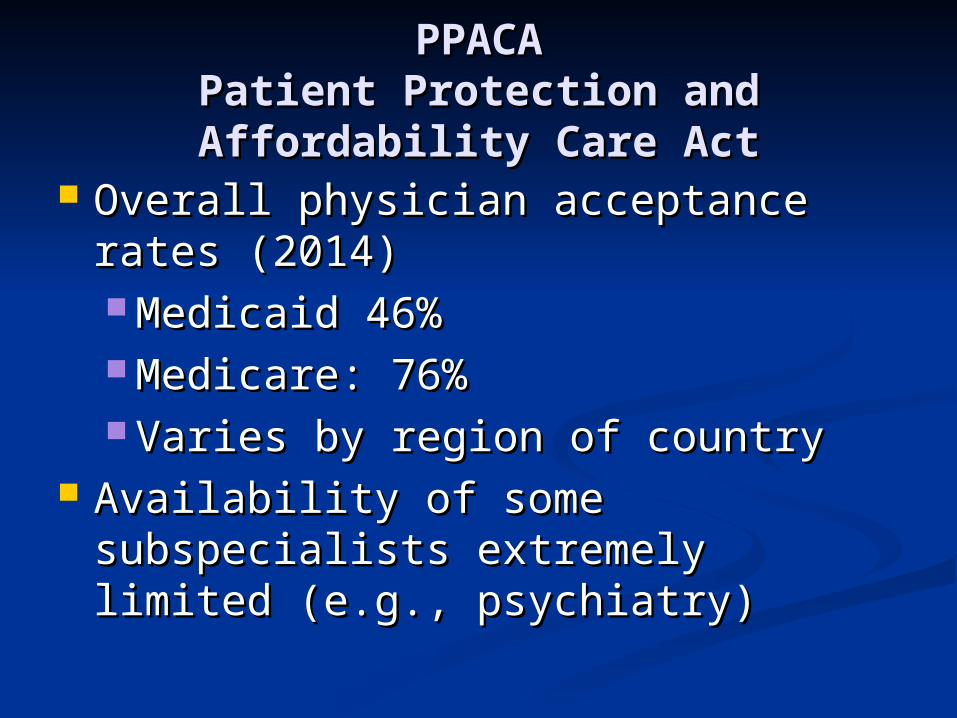
PPACAPPACAPatient Protection and Patient Protection and Affordability Care ActAffordability Care Act
Overall physician acceptance rates Overall physician acceptance rates (2014)(2014) Medicaid 46%Medicaid 46% Medicare: 76%Medicare: 76% Varies by region of countryVaries by region of country
Availability of some subspecialists Availability of some subspecialists extremely limited (e.g., psychiatry)extremely limited (e.g., psychiatry)

PPACAPPACAPatient Protection and Patient Protection and Affordability Care ActAffordability Care Act
Career arc of Elizabeth Fowler Career arc of Elizabeth Fowler (architect of plan):(architect of plan): VP for Public Policy and External Affairs VP for Public Policy and External Affairs
(informal lobbying) at WellPoint (nation’s (informal lobbying) at WellPoint (nation’s largest insurer)largest insurer)
Chief health policy counsel to Senator Chief health policy counsel to Senator Max Baucus (who drafted legislation)Max Baucus (who drafted legislation)
Head of Global Health Policy at Head of Global Health Policy at pharmaceutical giant Johnson and pharmaceutical giant Johnson and JohnsonJohnson

"If anyone...has a better approach "If anyone...has a better approach that will bring down premiums, bringthat will bring down premiums, bringdown the deficit, cover the uninsured, down the deficit, cover the uninsured, strengthen Medicare for seniors,strengthen Medicare for seniors,and stop insurance company abuses, and stop insurance company abuses, let me know."let me know."-- President Obama, State of the -- President Obama, State of the Union, 1/27/10Union, 1/27/10

Single PayerSingle Payer Cradle to grave, portable insurance for Cradle to grave, portable insurance for
everyoneeveryone All medically-necessary services coveredAll medically-necessary services covered Free choice of doctor and hospitalFree choice of doctor and hospital Global and local budgeting determined by Global and local budgeting determined by
physicians, patients, other health physicians, patients, other health professionalsprofessionals
Cost saving, job-creatingCost saving, job-creating Public accountabilityPublic accountability Broad supportBroad support

Paying for Health Care Paying for Health Care TodayToday
Federal Government
(existing Medicare,
Medicaid, other)
Out-of-pocket
State and Local Govt (existing
Medicaid, other)
Private Insurance
How We Pay for Health Care Today
Source: Health Affairs, Feb. 2008; data for 2006

How Single Payer Could Be Paid How Single Payer Could Be Paid For: For:
One Example from a Recent Study One Example from a Recent Study of a California Planof a California Plan
Federal Government
(existing Medicare,
Medicaid, other)
Business (self-employed) income tax
(12%)
State and Local Govt (existing
Medicaid, other)
Surcharge on income (1% above $200,000)
Employee Payroll Tax (4%)
Employer Payroll Tax (8%)
Investment income tax (4%)
Note: Payroll and income taxes between $7,000 and $200,000 only. Source: Health Care for All Californians Act: Cost and Economic Impacts Analysis, The Lewin Group, January 2005

Covering Everyone withCovering Everyone with No Additional Spending No Additional Spending
Additional costsAdditional costs
Covering the uninsured and poorly-insured Covering the uninsured and poorly-insured +6.4%+6.4%
Elimination of cost-sharing and co-pays Elimination of cost-sharing and co-pays +5.1%+5.1%
SavingsSavings
Reduced insurance administrative costs -5.3%Reduced insurance administrative costs -5.3%
Reduced hospital billing costs Reduced hospital billing costs -1.9% -1.9%
Reduced physician office costs -3.6%Reduced physician office costs -3.6%
Bulk purchasing of drugs & equipment -2.8%Bulk purchasing of drugs & equipment -2.8%
Primary care emphasis & reduce fraud Primary care emphasis & reduce fraud --2.2%2.2%
Source: Health Care for All Californians Plan, Lewin Group, January 2005
Total Costs +11.5%
Total Savings -15.8% Net Savings - 4.3%

Single PayerSingle Payer Not socialism any more than Not socialism any more than
having a police force and fire having a police force and fire department which serve department which serve everyone or offering free public everyone or offering free public education to children through education to children through grade twelve is socialismgrade twelve is socialism Imagine if insurance companies Imagine if insurance companies
ran the fire departmentran the fire department

What You Can DoWhat You Can Do Educate yourselves and othersEducate yourselves and others
““Information is the currency of Information is the currency of democracy” (Thomas Jefferson)democracy” (Thomas Jefferson)
Take care of your body – you only Take care of your body – you only get one (no trade-ins)get one (no trade-ins)
Live, laugh, and love – life is shortLive, laugh, and love – life is short Join groups working to improve Join groups working to improve
health carehealth care

Act Now!Act Now!
"If you think you are too "If you think you are too small to have an impact, small to have an impact, try going to bed with a try going to bed with a mosquito in your tent“mosquito in your tent“
- African Proverb- African Proverb

Further Info/References/Contact Further Info/References/Contact InfoInfo
Public Health and Social Justice WebsitePublic Health and Social Justice Websitehttp://www.phsj.org
Physicians for a National Health PlanPhysicians for a National Health Planhttp://www.pnhp.org/
Kaiser Family FoundationKaiser Family Foundationhttp://www.kff.org/
Martin DonohoeMartin [email protected]