MARS DISCOVERY DISTRICT 2013 · MaRS Discovery District as at March 31, 2013, ... that open markets...
24
MaRS Discovery District Financial Statements March 31, 2013, March 31, 2012 and April 1, 2011
Transcript of MARS DISCOVERY DISTRICT 2013 · MaRS Discovery District as at March 31, 2013, ... that open markets...

MaRS Discovery District
Financial StatementsMarch 31, 2013, March 31, 2012 andApril 1, 2011

PricewaterhouseCoopers LLPNorth American Centre, 5700 Yonge Street, Suite 1900, North York, Ontario, Canada M2M 4K7T: +1 416 218 1500, F: +1 416 218 1499
“PwC” refers to PricewaterhouseCoopers LLP, an Ontario limited liability partnership.
June 14, 2013
Independent Auditor’s Report
To the Board of Directors ofMaRS Discovery District
We have audited the accompanying financial statements of MaRS Discovery District, which comprise thestatements of financial position as at March 31, 2013, March 31, 2012 and April 1, 2011 and the statementsof operations, changes in net assets and cash flows for the years ended March 31, 2013 and March 31,2012, and the related notes, which comprise a summary of significant accounting policies and otherexplanatory information.
Management’s responsibility for the financial statementsManagement is responsible for the preparation and fair presentation of these financial statements inaccordance with Canadian accounting standards for not-for-profit organizations, and for such internalcontrol as management determines is necessary to enable the preparation of financial statements that arefree from material misstatement, whether due to fraud or error.
Auditor’s responsibilityOur responsibility is to express an opinion on these financial statements based on our audit. We conductedour audits in accordance with Canadian generally accepted auditing standards. Those standards requirethat we comply with ethical requirements and plan and perform the audit to obtain reasonable assuranceabout whether the financial statements are free from material misstatement.
An audit involves performing procedures to obtain audit evidence about the amounts and disclosures inthe financial statements. The procedures selected depend on the auditor’s judgment, including theassessment of the risks of material misstatement of the financial statements, whether due to fraud orerror. In making those risk assessments, the auditor considers internal control relevant to the entity’spreparation and fair presentation of the financial statements in order to design audit procedures that areappropriate in the circumstances, but not for the purpose of expressing an opinion on the effectiveness ofthe entity’s internal control. An audit also includes evaluating the appropriateness of accounting policiesused and the reasonableness of accounting estimates made by management, as well as evaluating theoverall presentation of the financial statements.
We believe that the audit evidence we have obtained in our audits is sufficient and appropriate to provide abasis for our audit opinion.

OpinionIn our opinion, the financial statements present fairly, in all material respects, the financial position ofMaRS Discovery District as at March 31, 2013, March 31, 2012 and April 1, 2011 and the results of itsoperations and its cash flows for the years ended March 31, 2013 and March 31, 2012 in accordance withCanadian accounting standards for not-for-profit organizations.
Chartered Accountants, Licensed Public Accountants

MaRS Discovery DistrictStatements of Financial Position
(in thousands of dollars)
Approved by the Board of Directors
___________________________________ Director ________________________________ Director
The accompanying notes are an integral part of these financial statements.
March 31,2013
$
March 31,2012
$
April 1,2011
$(note 2) (note 2)
Assets
Current assetsCash 7,150 9,371 5,469Restricted cash (note 3) 17,609 11,591 2,232Restricted investment (note 3) 1,464 3,810 4,834Tenant and client receivables (note 4) 973 790 921Other receivables and prepayments (note 5) 1,041 1,076 1,336Due from related parties (note 6) 2,656 221 86
30,893 26,859 14,878
Restricted cash (note 3) 12,639 4,721 8,210
Restricted investment (note 3) - 2,556 4,033
Investment in related parties (note 7) 600 10 -
Capital assets (note 9) 109,853 113,849 116,942
153,985 147,995 144,063
Liabilities
Current liabilitiesAccounts payable and accrued liabilities 6,336 4,297 5,487Loans and mortgages payable (note 10) 21,902 745 4,868Restricted grants (note 11) 11,574 11,380 6,261Due to related parties (note 6) - - 53
39,812 16,422 16,669
Loans and mortgages payable (note 10) - 21,902 18,502
Restricted grants (note 11) 12,639 7,277 12,243
Deferred capital grants (note 12) 62,115 64,857 67,599
114,566 110,458 115,013
Net Assets
Unrestricted 8,694 8,101 3,077
Investment in capital assets 25,836 26,345 25,973
Endowment (note 13) 4,889 3,091 -
39,419 37,537 29,050
153,985 147,995 144,063
Contingencies and commitments (note 16)
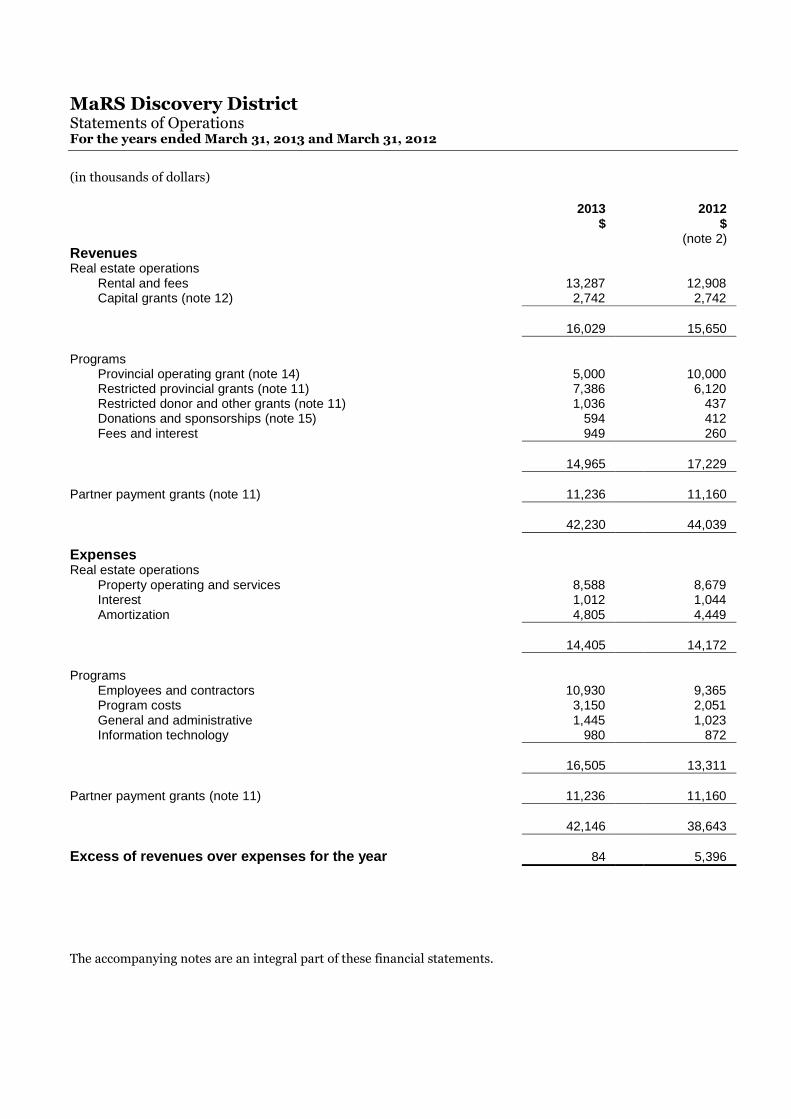
MaRS Discovery DistrictStatements of OperationsFor the years ended March 31, 2013 and March 31, 2012
(in thousands of dollars)
The accompanying notes are an integral part of these financial statements.
2013$
2012$
(note 2)RevenuesReal estate operations
Rental and fees 13,287 12,908Capital grants (note 12) 2,742 2,742
16,029 15,650
ProgramsProvincial operating grant (note 14) 5,000 10,000Restricted provincial grants (note 11) 7,386 6,120Restricted donor and other grants (note 11) 1,036 437Donations and sponsorships (note 15) 594 412Fees and interest 949 260
14,965 17,229
Partner payment grants (note 11) 11,236 11,160
42,230 44,039
ExpensesReal estate operations
Property operating and services 8,588 8,679Interest 1,012 1,044Amortization 4,805 4,449
14,405 14,172
ProgramsEmployees and contractors 10,930 9,365Program costs 3,150 2,051General and administrative 1,445 1,023Information technology 980 872
16,505 13,311
Partner payment grants (note 11) 11,236 11,160
42,146 38,643
Excess of revenues over expenses for the year 84 5,396

MaRS Discovery DistrictStatements of Changes in Net AssetsFor the years ended March 31, 2013 and March 31, 2012
(in thousands of dollars)
The accompanying notes are an integral part of these financial statements.
2013
Investmentin capital
assets$
Unrestricted$
RestrictedEndowment
$Total
$
Net assets - Beginning of year 26,345 8,101 3,091 37,537
Endowment contributions (note 13) - - 1,771 1,771Deferred endowment interest income - net of
expenditures (note 13) - - 27 27Change in net investment in capital assets (509) 509 - -Excess of revenues over expenses for the year - 84 - 84
Net assets - End of year 25,836 8,694 4,889 39,419
2012
Investmentin capital
assets$
Unrestricted$
RestrictedEndowment
$Total
$(note 2)
Net assets - Beginning of year 25,973 3,077 - 29,050
Endowment contributions (note 13) - - 3,084 3,084Deferred endowment interest income - net of
expenditures (note 13) - - 7 7Change in net investment in capital assets 372 (372) - -Excess of revenues over expenses for the year - 5,396 - 5,396
Net assets - End of year 26,345 8,101 3,091 37,537

MaRS Discovery DistrictStatements of Cash FlowsFor the years ended March 31, 2013 and March 31, 2012
(in thousands of dollars, unless otherwise stated)
The accompanying notes are an integral part of these financial statements.
2013$
2012$
(note 2)
Cash provided by (used in)
Operating activitiesExcess of revenues over expenses for the year 84 5,396Items not affecting cash
Amortization of capital assets 4,805 4,449Writeoff of capital assets 38 -Amortization of deferred capital grants (2,742) (2,742)
Changes in working capital balance and other operational balances (note 18) 5,039 (827)
7,224 6,276
Financing activitiesReceipt of endowment 1,771 3,084Repayment of loans and mortgages (note 10) (745) (723)
1,026 2,361
Investing activitiesInvestment in related parties (590) (10)Redemption of investment 4,902 2,501Additions to capital assets (847) (1,356)
3,465 1,135
Increase in cash during the year 11,715 9,772
Cash - Beginning of year 25,683 15,911
Cash - End of year 37,398 25,683
Cash is comprised ofCash 7,150 9,371Restricted cash 30,248 16,312
37,398 25,683
MaRS Discovery DistrictNotes to Financial StatementsMarch 31, 2013 and March 31, 2012
(in thousands of dollars, unless otherwise stated)
(1)
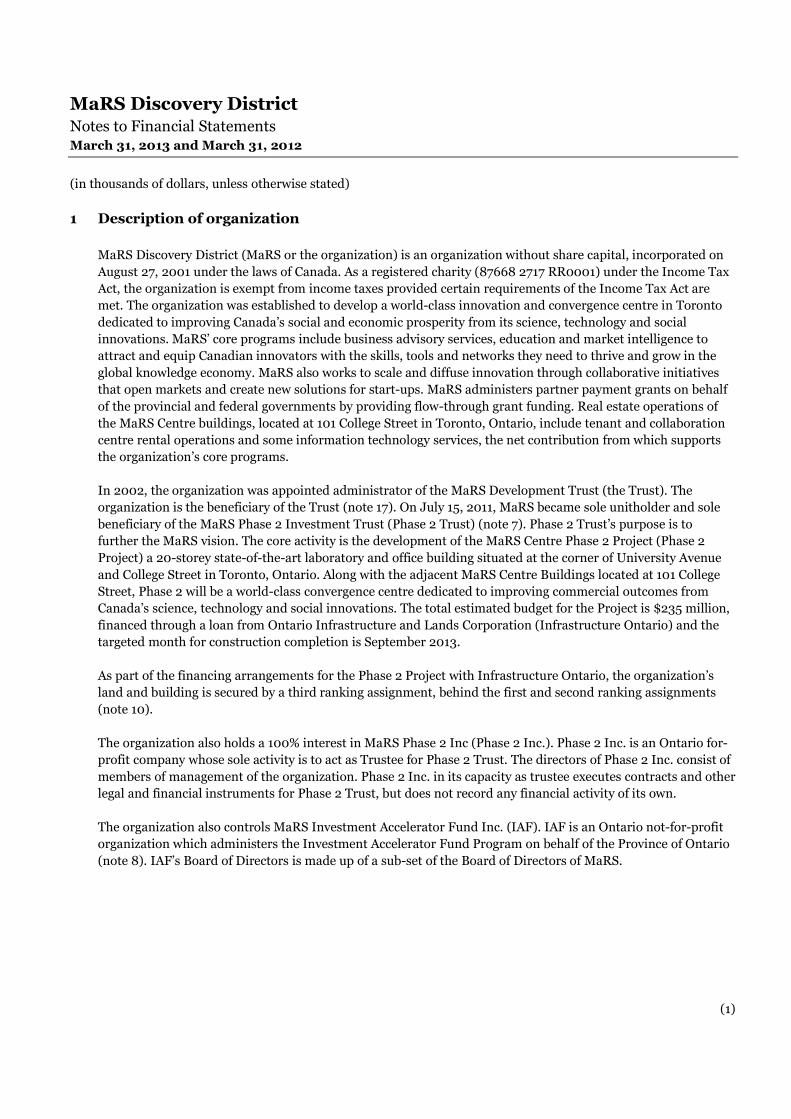
1 Description of organization
MaRS Discovery District (MaRS or the organization) is an organization without share capital, incorporated on
August 27, 2001 under the laws of Canada. As a registered charity (87668 2717 RR0001) under the Income Tax
Act, the organization is exempt from income taxes provided certain requirements of the Income Tax Act are
met. The organization was established to develop a world-class innovation and convergence centre in Toronto
dedicated to improving Canada’s social and economic prosperity from its science, technology and social
innovations. MaRS’ core programs include business advisory services, education and market intelligence to
attract and equip Canadian innovators with the skills, tools and networks they need to thrive and grow in the
global knowledge economy. MaRS also works to scale and diffuse innovation through collaborative initiatives
that open markets and create new solutions for start-ups. MaRS administers partner payment grants on behalf
of the provincial and federal governments by providing flow-through grant funding. Real estate operations of
the MaRS Centre buildings, located at 101 College Street in Toronto, Ontario, include tenant and collaboration
centre rental operations and some information technology services, the net contribution from which supports
the organization’s core programs.
In 2002, the organization was appointed administrator of the MaRS Development Trust (the Trust). The
organization is the beneficiary of the Trust (note 17). On July 15, 2011, MaRS became sole unitholder and sole
beneficiary of the MaRS Phase 2 Investment Trust (Phase 2 Trust) (note 7). Phase 2 Trust’s purpose is to
further the MaRS vision. The core activity is the development of the MaRS Centre Phase 2 Project (Phase 2
Project) a 20-storey state-of-the-art laboratory and office building situated at the corner of University Avenue
and College Street in Toronto, Ontario. Along with the adjacent MaRS Centre Buildings located at 101 College
Street, Phase 2 will be a world-class convergence centre dedicated to improving commercial outcomes from
Canada’s science, technology and social innovations. The total estimated budget for the Project is $235 million,
financed through a loan from Ontario Infrastructure and Lands Corporation (Infrastructure Ontario) and the
targeted month for construction completion is September 2013.
As part of the financing arrangements for the Phase 2 Project with Infrastructure Ontario, the organization’s
land and building is secured by a third ranking assignment, behind the first and second ranking assignments
(note 10).
The organization also holds a 100% interest in MaRS Phase 2 Inc (Phase 2 Inc.). Phase 2 Inc. is an Ontario for-
profit company whose sole activity is to act as Trustee for Phase 2 Trust. The directors of Phase 2 Inc. consist of
members of management of the organization. Phase 2 Inc. in its capacity as trustee executes contracts and other
legal and financial instruments for Phase 2 Trust, but does not record any financial activity of its own.
The organization also controls MaRS Investment Accelerator Fund Inc. (IAF). IAF is an Ontario not-for-profit
organization which administers the Investment Accelerator Fund Program on behalf of the Province of Ontario
(note 8). IAF’s Board of Directors is made up of a sub-set of the Board of Directors of MaRS.

MaRS Discovery DistrictNotes to Financial StatementsMarch 31, 2013 and March 31, 2012
(in thousands of dollars, unless otherwise stated)
(2)
2 Transition to accounting standards for not-for-profit organizations
Effective April 1, 2012, the organization elected to adopt Canadian accounting standards for not-for-profit
organizations (ASNPO) as issued by the Canadian Accounting Standards Board. The accounting policies
selected under this framework have been applied consistently and retrospectively as if these policies had always
been in effect. The organization has not utilized any transitional exemptions on the adoption of ASNPO. There
were no adjustments to the statements of financial position, operations, changes in net assets or cash flows.
3 Summary of significant accounting policies
The significant accounting policies are as follows:
Rental revenue
The organization retains substantially all of the benefits and risks of ownership of its income-producing
properties and, therefore, accounts for leases with its tenants as operating leases. Rental revenue includes all
amounts earned from tenants under lease agreements, including property tax and operating cost recoveries,
parking income and incidental income. The organization reports base rental revenue on a straight-line basis,
whereby the total amount of cash to be received under a lease is recognized in income in equal periodic
amounts over the term of the lease. The amount by which straight-line rental revenue exceeds or is lower than
base rents collected in accordance with the lease agreements is included in other receivables and prepayments.
Capital grants and deferred revenue
The organization follows the deferral method of accounting for contributions. Under the deferral method,
unrestricted contributions and donations and grants for operations, including the unrestricted portion of the
College of Founders’ contributions to fund operations, are recognized as revenue when received, whereas
restricted contributions are deferred and recognized as revenue when the related expenses are incurred. Capital
grants are deferred and amortized on a basis corresponding with the amortization rate for the related capital
asset. The organization has not recognized contributions of materials or services in the statements of
operations.
Restricted and partner program grants and restricted endowment
Restricted grants are funds received in support of specified programs, projects or activities agreed upon by
MaRS and various funders. Restricted program grants are recognized in income as the related expenses are
incurred.
Partner payment grants are funds received for programs that MaRS administers on behalf of the provincial and
federal governments by providing flow-through funding to grant recipients. Revenue is recognized in income as
expenses are incurred. MaRS utilizes internal resources to support these programs.
Restricted endowment funds have an external restriction that contributions received are to be invested and
interest income generated will support a specified program, unless otherwise approved by the funder.
MaRS Discovery DistrictNotes to Financial StatementsMarch 31, 2013 and March 31, 2012
(in thousands of dollars, unless otherwise stated)
(3)
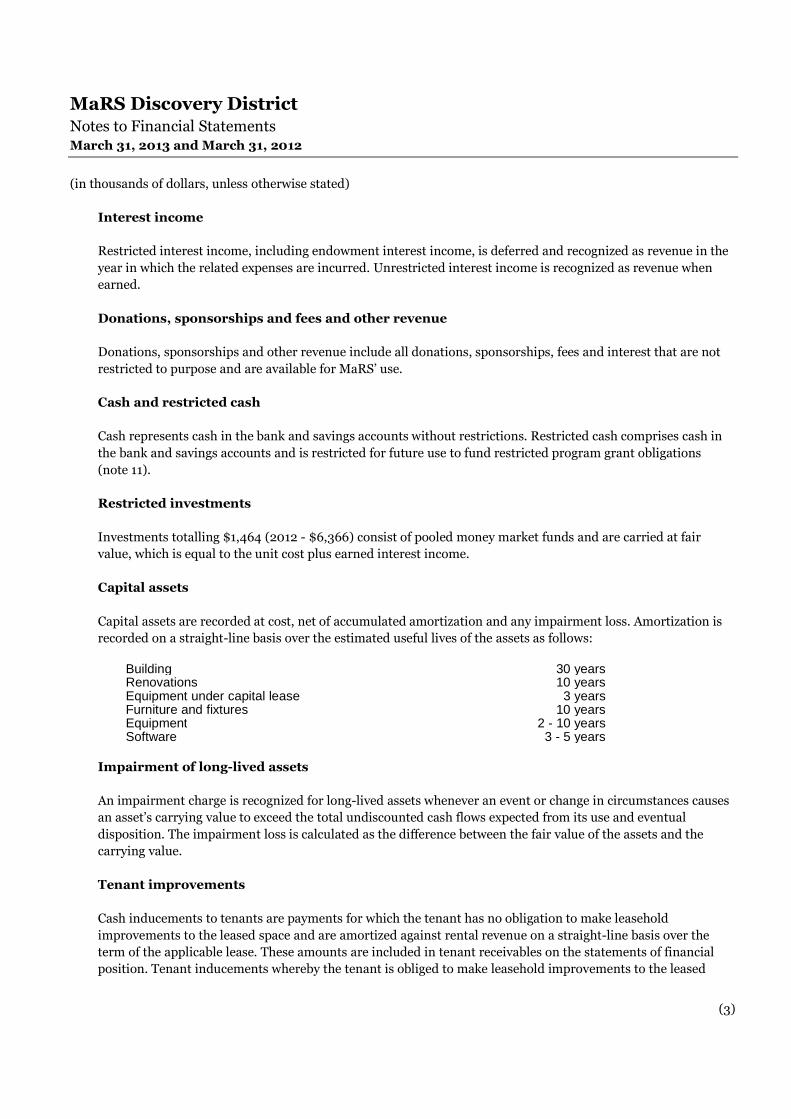
Interest income
Restricted interest income, including endowment interest income, is deferred and recognized as revenue in the
year in which the related expenses are incurred. Unrestricted interest income is recognized as revenue when
earned.
Donations, sponsorships and fees and other revenue
Donations, sponsorships and other revenue include all donations, sponsorships, fees and interest that are not
restricted to purpose and are available for MaRS’ use.
Cash and restricted cash
Cash represents cash in the bank and savings accounts without restrictions. Restricted cash comprises cash in
the bank and savings accounts and is restricted for future use to fund restricted program grant obligations
(note 11).
Restricted investments
Investments totalling $1,464 (2012 - $6,366) consist of pooled money market funds and are carried at fair
value, which is equal to the unit cost plus earned interest income.
Capital assets
Capital assets are recorded at cost, net of accumulated amortization and any impairment loss. Amortization is
recorded on a straight-line basis over the estimated useful lives of the assets as follows:
Building 30 yearsRenovations 10 yearsEquipment under capital lease 3 yearsFurniture and fixtures 10 yearsEquipment 2 - 10 yearsSoftware 3 - 5 years
Impairment of long-lived assets
An impairment charge is recognized for long-lived assets whenever an event or change in circumstances causes
an asset’s carrying value to exceed the total undiscounted cash flows expected from its use and eventual
disposition. The impairment loss is calculated as the difference between the fair value of the assets and the
carrying value.
Tenant improvements
Cash inducements to tenants are payments for which the tenant has no obligation to make leasehold
improvements to the leased space and are amortized against rental revenue on a straight-line basis over the
term of the applicable lease. These amounts are included in tenant receivables on the statements of financial
position. Tenant inducements whereby the tenant is obliged to make leasehold improvements to the leased

MaRS Discovery DistrictNotes to Financial StatementsMarch 31, 2013 and March 31, 2012
(in thousands of dollars, unless otherwise stated)
(4)
space are amortized on a straight-line basis over the useful life of the improvement to amortization expense.
These amounts are included in other receivables and prepayments on the statements of financial position.
Leasehold improvements made by the organization on the tenants’ behalf are amortized on a straight-line basis
over the useful life of the improvement to amortization expense. These amounts are included in capital assets
on the statements of financial position as renovation (note 9).
Use of estimates
The preparation of financial statements in conformity with ASNPO requires management to make estimates
and assumptions that affect the reported amounts of assets and liabilities and the disclosure of contingent
assets and liabilities at the date of the financial statements and the reported amounts of revenues and expenses
during the reporting period. Actual results could differ from those estimates. Estimates are used in determining
allowance for doubtful accounts, useful life of capital assets and internal allocations.
Investments in related parties
Phase 2 Inc. and Phase 2 Trust are wholly owned subsidiaries and are considered profit-oriented enterprises.
MaRS has elected not to consolidate these entities and therefore accounts for them using the equity method.
MaRS Investment Accelerator Fund Inc., an entity deemed to be controlled by MaRS, is considered a not-for-
profit organization. MaRS has elected not to consolidate this entity but has disclosed its financial information in
note 8.
Cogniciti Inc., is an entity which MaRS is deemed to have significant influence over. MaRS has recorded this
investment using the cost method.
Financial instruments
MaRS initially measures its financial assets and liabilities at fair value. MaRS subsequently measures all of its
financial assets and liabilities at amortized cost. Financial assets and liabilities include restricted and
unrestricted cash, tenant and other receivables, accounts payable and accrued liabilities, loans and mortgages
payable. Amortization is recorded on a straight-line basis.
Financial assets are tested for impairment at the end of each reporting period where there are indicators that
the assets may be impaired. Any impairment loss is recognized in the statements of operations.
Transaction costs are capitalized and amortized on a straight-line basis over the useful life of the related
financial instrument.

MaRS Discovery DistrictNotes to Financial StatementsMarch 31, 2013 and March 31, 2012
(in thousands of dollars, unless otherwise stated)
(5)
4 Tenant and client receivables
2013$
2012$
Tenant and client receivables 1,788 1,628Allowance for doubtful accounts (815) (838)
973 790
5 Other receivables and prepayments
2013$
2012$
Grants and other receivables 474 470Prepaid expenses 253 307Tenant improvements and straight-line rent - net of accumulated
amortization of $303 (2012 - $282) 314 299
1,041 1,076
6 Related party transactions
The following amounts were due from related parties, recorded at exchange amount, at the end of the year and
represent all those with which MaRS has material transactions.
2013$
2012$
Due from MaRS Phase 2 Investment Trust (i) 2,405 124Due from MaRS Discovery Services Inc. (ii) 250 -Due from MaRS Investment Accelerator Fund Inc. (iii) 1 5Due from Cogniciti Inc. (iv) - 92
Due from related parties 2,656 221
i) Phase 2 Trust is a unit trust that holds the development of the Phase 2 Project (note 7). During the year,
the organization provided services in the amount of $539 (2012 - $ 195) for project management and
accounting services. Periodically during the year, MaRS provided temporary cash flow bridging to Phase 2
Trust relating to the construction of the Phase 2 Project of $3,790 (2012 - $3,251) and received interest of
$23 (2012 - $nil). Of the total receivable from Phase 2 Trust at year-end, $144 (2012 - $124) relates to
services and $2,261 (2012 - $nil) relates to temporary cash flow bridging.
ii) MaRS Discovery Services Inc. (MDSI) is an Ontario not-for-profit organization. The directors of MDSI are
MaRS Discovery District’s CEO, Treasurer and an adviser of the organization. MDSI’s sole activity in the
year was to hold an investment in JOLT Fund L.P. in the amount of $250 (2012 - $nil), which was funded
through a loan received from MaRS in 2013, bearing interest at 2% per annum with a repayment date of

MaRS Discovery DistrictNotes to Financial StatementsMarch 31, 2013 and March 31, 2012
(in thousands of dollars, unless otherwise stated)
(6)
June 2017. JOLT Fund L.P., a limited partnership of private investors, invests in promising startup
companies developing products or services in mobile and digital technologies. These investee companies
participate in the JOLT program, an education and mentoring program offered by MaRS.
MDSI also holds 100% of MaRS 101 Ventures Inc. (MaRS 101), an Ontario for-profit company which acts
as the general partner to JOLT Fund L.P. MaRS 101’s operating revenues and expenses are immaterial as it
is supported through the work of volunteers. Additionally MDSI holds 100% of MaRS Discovery
Enterprises Inc. (MDEI), an Ontario for-profit company whose sole activity in the year was to hold an
investment in Cogniciti Inc. (iv) in the amount of $320 (2012 - $320). There were no transactions between
MaRS and MaRS 101 or between MaRS and MDEI during 2013 and 2012.
iii) MaRS Investment Accelerator Fund Inc. (IAF) is an Ontario not-for-profit organization which administers
the Investment Accelerator Fund Program on behalf of the Province of Ontario (note 8). IAF’s Board of
Directors is made up of a sub-set of the Board of Directors of MaRS. During the year, the organization
provided services in the amount of $217 (2012 - $182). The services provided included rent, information
technology support, market intelligence, accounting, human resources and other general and
administrative expenses.
iv) Cogniciti Inc. is a joint venture formed in 2009 through a partnership between Baycrest Centre for
Geriatric Care (Baycrest), one of the world’s leading cognitive science institutes and MaRS. Baycrest aims
to commercialize evidence-based interventions to support brain fitness, a key mandate of the Baycrest
Centre for Brain Fitness. Baycrest holds an 80% interest and MaRS (through MaRS and MDEI) holds 20%
(note 6). During the year, the organization provided services in the amount of $134 (2011 - $200) to
Cogniciti Inc. The services provided included the secondment of a senior advisor to Cogniciti Inc. for
general management, as well as accounting services.
7 Investment in related parties
2013$
2012$
MaRS Phase 2 Inc. (i) - -MaRS Phase 2 Investment Trust (ii) 510 10Cogniciti Inc. (note 6(iv)) 90 -
600 10
i) The organization holds a 100% interest in Phase 2 Inc., at a cost of $1 dollar.

MaRS Discovery DistrictNotes to Financial StatementsMarch 31, 2013 and March 31, 2012
(in thousands of dollars, unless otherwise stated)
(7)
ii) The organization is the sole unitholder and sole beneficiary of the Phase 2 Trust and holds a subscription of
10,000 units with a cost of $10. MaRS provided an additional capital contribution of $500 to MaRS Phase
2 during the year to fund an investment in Triphase Accelerator Limited Partnership, an oncology drug
development accelerator. To date all project costs have been capitalized and operating activity is targeted to
commence September 2013.
The assets, liabilities and net assets as at March 31 and the revenues, expenses and cash flows for the years
ending March 31 for Phase 2 Trust are as follows:
2013$
2012$
Assets 183,306 59,352Liabilities 182,796 59,342Unitholder’s Equity 510 10
Revenues - -Expenses - -
Cash flow from operating activities (8,828) 16,656Cash flow from financing activities 130,373 40,684Cash flow from investing activities (123,268) (55,615)
8 MaRS Investment Accelerator Fund Inc.
Funded by the Province of Ontario, the IAF is a seed fund that assists emerging Ontario technology companiesto bring their products and services to market. The IAF administers the investment of up to $500 in early stage,privately-held companies, with no significant revenue or institutional investment, that have the potential to beglobal leaders in their field and provide sustainable economic benefits to Ontario. The IAF also provides acomprehensive platform of resources, people, connections and funding that entrepreneurs and innovators canaccess to launch their new ventures. The terms of the funding agreement with the province permit the province,at its sole discretion, to request that the IAF return any funds held, including proceeds earned on investments.
The IAF primarily makes investments in the form of convertible secured debentures, with maturity dates of 12to 36 months from date of issuance. In the event of significant financing, acquisition or at the IAF’s option, theconvertible debenture may convert into equity instruments and conversion terms may include a share pricediscount. At year end, the IAF held 65 investments (2012 - 51).
The assets, liabilities and net assets as at March 31 and the revenues, expenses and cash flows for the yearsending March 31 for MaRS IAF are as follows:
2013$
2012$
Assets 39,400 32,448Liabilities 6,684 7,421
Net assets 32,716 25,027

MaRS Discovery DistrictNotes to Financial StatementsMarch 31, 2013 and March 31, 2012
(in thousands of dollars, unless otherwise stated)
(8)
2013$
2012$
Revenue 9,048 11,912Expenses 1,686 1,709Interest income 1,160 1,150Cash flow from operating activities (271) 104Cash flow from financing activities 7,000 11,871Cash flow from investing activities (6,650) (9,761)
Assets primarily consist of restricted cash for investments and proceeds earned loans receivable (convertibledebentures) and equity investments. Liabilities include restricted grants for investments. Revenues reflect grantfunds utilized for operations and investments and expenses are comprised of operating expenditures forpersonnel and general and administrative expenses. Interest income includes gains on disposition, impairmentallowances and interest income from the recording of loans receivable at fair value and subsequently measuringat amortized cost.
9 Capital assets
2013
Cost$
Accumulatedamortization
$Net
$
Income-producing propertiesLand 4,293 - 4,293Building 105,913 25,860 80,053Renovations 462 92 370
110,668 25,952 84,716Land and building under development (i) 23,351 - 23,351Other assets
Equipment under capital lease 259 153 106Furniture and fixtures 1,723 1,151 572Equipment 5,252 4,563 689Software and computer equipment 1,794 1,375 419
143,047 33,194 109,853

MaRS Discovery DistrictNotes to Financial StatementsMarch 31, 2013 and March 31, 2012
(in thousands of dollars, unless otherwise stated)
(9)
2012
Cost$
Accumulatedamortization
$Net
$
Income-producing propertiesLand 4,293 - 4,293Building 105,721 22,326 83,395Renovations 420 50 370
110,434 22,376 88,058Land and building under development (i) 23,351 - 23,351Other assets
Equipment under capital lease 133 108 25Furniture and fixtures 1,663 983 680Equipment 5,903 4,483 1,420Software and computer equipment 881 566 315
142,365 28,516 113,849
i) The organization incurred pre-development costs associated with the Phase 2 Project prior to the
establishment of the Phase 2 Trust.
In 2007, MaRS entered into a 99-year lease of the land to be developed with Alexandria Real Estate
Holdings Inc. (ARE or the lessee). The terms of the lease were such that MaRS has transferred all rights of
the land to the lessee in return for the construction of a building and set payments. The land and the
building will be the property of the organization at the termination of the lease. The lease included an
upfront non-refundable payment of $5 million received in 2007, a $1 million payment upon completion of
certain targets, which were not met, and annual fixed amounts thereafter of $715. The total of these
amounts were being recognized on straight-line basis over the term of the lease. In 2011, the critical terms
were amended and the remaining total deferred balance of $3,320 was recognized in revenue in 2011.
In 2012 MaRS Phase 2 Inc., as trustee to Phase 2 Trust, exercised an option in the amended ground lease
with ARE to sublet the property to Phase 2 Trust, thereby enabling it to develop and manage this property.

MaRS Discovery DistrictNotes to Financial StatementsMarch 31, 2013 and March 31, 2012
(in thousands of dollars, unless otherwise stated)
(10)
10 Loans and mortgages payable
The organization has used the following two credit facilities relating to the initial construction of the building as
follows:
2013$
2012$
First mortgage loan, bearing interest at 4.891%, calculatedsemi-annually and amortized over 25 years; dueNovember 2013 (i) 18,006 18,501
Fixed rate term loan, bearing interest at prime plus 0.15%,calculated semi-annually and amortized over 20 years;due October 2013 (ii) 3,896 4,146
21,902 22,647Less: Current portion 21,902 745
- 21,902
The mortgage under (i) is secured by a first ranking mortgage on the land and building, a first ranking
assignment of all rents and leases arising and a first ranking general security agreement, whereby the bank
holds all the assets of the organization as security until the loan is repaid. The facility listed under (ii) is also
secured by a general security agreement and a second mortgage in the amount of $10,000 on the land and
building.
An additional unused revolving loan in the amount of $5,000 and a non-revolving term loan in the amount of
$2,000 are available for use, with no amounts drawn at year-end.
MaRS will renegotiate the mortgage and term loan to extend the due date.

MaRS Discovery DistrictNotes to Financial StatementsMarch 31, 2013 and March 31, 2012
(in thousands of dollars, unless otherwise stated)
(11)
11 Restricted grants
Restricted grants are funds received in support of specified programs, projects or activities agreed upon by
MaRS and various funders. These grants are recognized in income as the related expenses are incurred.
Restricted provincial grants are provided from the Province of Ontario for programs executed by MaRS.
Restricted donor and other grants are provided by philanthropic donors and other funders such as the
Government of Canada. Partner payment grants are programs that MaRS administers on behalf of the
provincial and federal governments by providing flow-through funding to grant recipients. MaRS utilizes
internal resources to support these programs.
2013
Openingbalance
$
Fundsreceived
receivable$
Recognizedin
operations$
Endingbalance
$
Restricted provincial grantsYouth Social Impact Academy (i) - 10,001 - 10,001Data Catalyst (ii) 4,780 - 1,011 3,769EXCITE (iii) 1,132 - 403 729Business Acceleration Program (iv) - 4,044 3,894 150Social Innovation Generation (ii) - 1,000 1,000 -MaRS Regional Innovation Centre (ii) 262 750 752 260Other 507 324 326 505
6,681 16,119 7,386 15,414
Restricted donor and other grantsCentre for Impact Investing (v) 856 875 685 1,046Other 33 808 351 490
889 1,683 1,036 1,536
Partner payment grantsPremier’s Summit Award (vi) 11,087 (14) 3,810 7,263Business Acceleration Program (v) - 6,740 6,740 -Other - 686 686 -
11,087 7,412 11,236 7,263
18,657 25,214 19,658 24,213Less: Current portion 11,574
Long-term portion 12,639
MaRS Discovery DistrictNotes to Financial StatementsMarch 31, 2013 and March 31, 2012
(in thousands of dollars, unless otherwise stated)
(12)
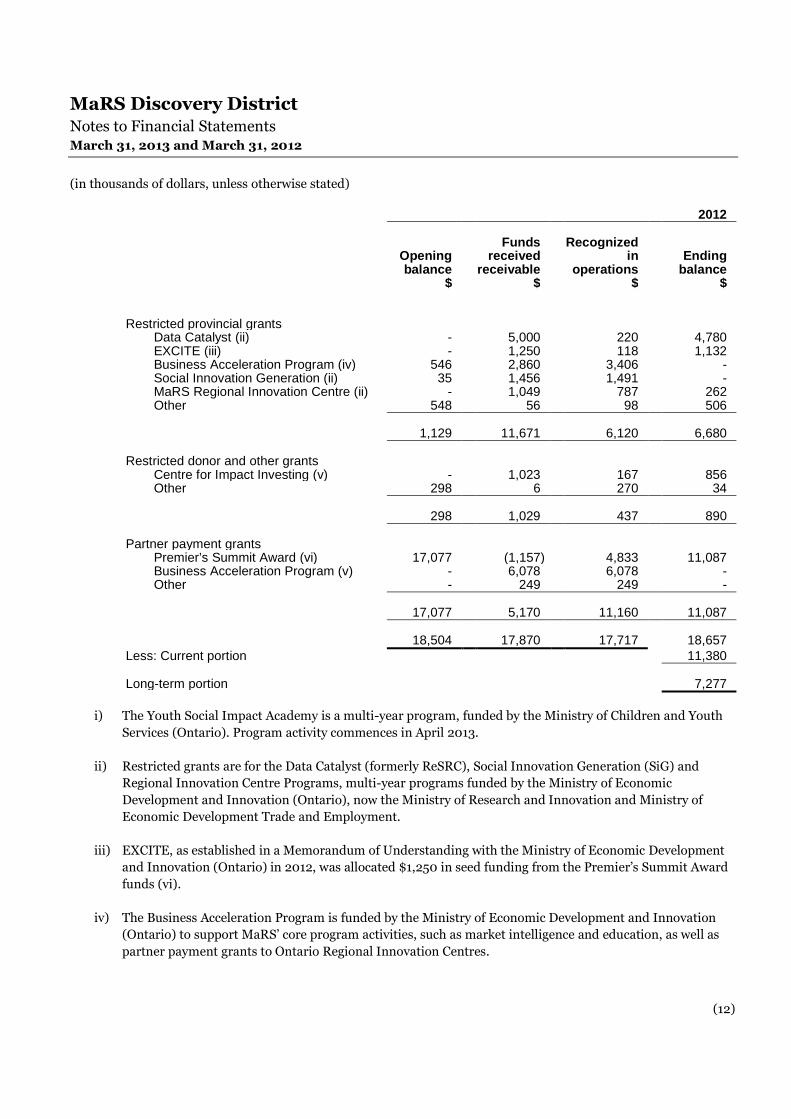
2012
Openingbalance
$
Fundsreceived
receivable$
Recognizedin
operations$
Endingbalance
$
Restricted provincial grantsData Catalyst (ii) - 5,000 220 4,780EXCITE (iii) - 1,250 118 1,132Business Acceleration Program (iv) 546 2,860 3,406 -Social Innovation Generation (ii) 35 1,456 1,491 -MaRS Regional Innovation Centre (ii) - 1,049 787 262Other 548 56 98 506
1,129 11,671 6,120 6,680
Restricted donor and other grantsCentre for Impact Investing (v) - 1,023 167 856Other 298 6 270 34
298 1,029 437 890
Partner payment grantsPremier’s Summit Award (vi) 17,077 (1,157) 4,833 11,087Business Acceleration Program (v) - 6,078 6,078 -Other - 249 249 -
17,077 5,170 11,160 11,087
18,504 17,870 17,717 18,657Less: Current portion 11,380
Long-term portion 7,277
i) The Youth Social Impact Academy is a multi-year program, funded by the Ministry of Children and Youth
Services (Ontario). Program activity commences in April 2013.
ii) Restricted grants are for the Data Catalyst (formerly ReSRC), Social Innovation Generation (SiG) and
Regional Innovation Centre Programs, multi-year programs funded by the Ministry of Economic
Development and Innovation (Ontario), now the Ministry of Research and Innovation and Ministry of
Economic Development Trade and Employment.
iii) EXCITE, as established in a Memorandum of Understanding with the Ministry of Economic Development
and Innovation (Ontario) in 2012, was allocated $1,250 in seed funding from the Premier’s Summit Award
funds (vi).
iv) The Business Acceleration Program is funded by the Ministry of Economic Development and Innovation
(Ontario) to support MaRS’ core program activities, such as market intelligence and education, as well as
partner payment grants to Ontario Regional Innovation Centres.

MaRS Discovery DistrictNotes to Financial StatementsMarch 31, 2013 and March 31, 2012
(in thousands of dollars, unless otherwise stated)
(13)
v) The Centre for Impact Investing (CII) was incubated in the SiG and has launched into its own program, and
is primarily funded through multi-year grants from private foundations and corporations.
vi) In 2006, the organization was granted $25,000 from the Province of Ontario to administer the Premier’s
Summit Award (PSA). The original grant and total net accumulated related investment income of $3,255
(2011 - $3,149) are restricted for distribution to grantees and to cover administration costs related to PSA,
as well as seed fund EXCITE (iii). During the year, the invested funds earned interest of $106 and disbursed
awards and expenses of $3,930 resulting in a net change of ($3,824) (note 16).
12 Deferred capital grants
Leaders from Canada’s academic, business and scientific communities founded the organization. The College of
Founders was established in 2001 and consists of individuals and corporations who made philanthropic
donations in order to provide the financial foundation required to implement the organization’s vision. A total
of $13,734 was received from the following founders: AIC Limited, AstraZeneca Canada Inc., Mr. Lawrence S.
Bloomberg, Cancer Care Ontario, Eli Lilly Canada Inc., Dr. John R. Evans, Mr. Arthur S. Labatt, Mr. Wilf
Lewitt, MDS Inc., Mr. Peter Munk, Mr. Joseph L. Rotman, RBC Financial Group, Mr. Allan Slaight and Mr.
William P. Wilder. In addition, contributions from government funders totalling $74,925 have been received. A
summary of the contributions to date and their respective recognition in the financial statements is as follows:
College ofFounders’
contribution$
Governmentof Ontario
contributions$
Governmentof Canada
contributions$
OntarioInnovation
Trustgrant
$
TBCCgrant (i)
$Total
$
Funding committed to theorganization 13,734 36,000 20,000 10,000 8,925 88,659
Funding recorded in prior periods (8,067) (8,175) (4,278) (2,559) (1,909) (24,988)Interest income recorded in prior
periods - - - 1,186 - 1,186
Funding received and deferredas capital grants instatement of financialposition as at March 31,2012 5,667 27,825 15,722 8,627 7,016 64,857
Funding recorded as income inthe year ended March 31,2012 (238) (1,167) (667) (373) (297) (2,742)
Funding deferred as capitalgrants in statement offinancial position as atMarch 31, 2013 5,429 26,658 15,055 8,254 6,719 62,115
i) Toronto Biotechnology Commercialization Centre
MaRS Discovery DistrictNotes to Financial StatementsMarch 31, 2013 and March 31, 2012
(in thousands of dollars, unless otherwise stated)
(14)
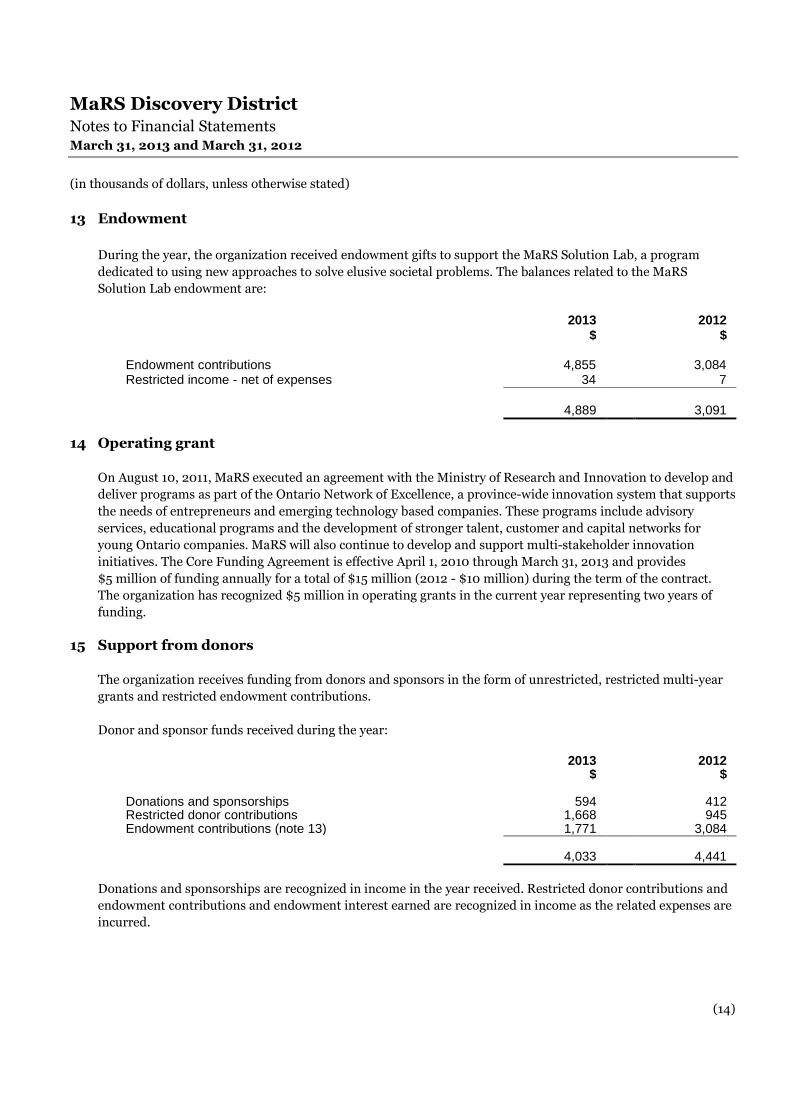
13 Endowment
During the year, the organization received endowment gifts to support the MaRS Solution Lab, a program
dedicated to using new approaches to solve elusive societal problems. The balances related to the MaRS
Solution Lab endowment are:
2013$
2012$
Endowment contributions 4,855 3,084Restricted income - net of expenses 34 7
4,889 3,091
14 Operating grant
On August 10, 2011, MaRS executed an agreement with the Ministry of Research and Innovation to develop and
deliver programs as part of the Ontario Network of Excellence, a province-wide innovation system that supports
the needs of entrepreneurs and emerging technology based companies. These programs include advisory
services, educational programs and the development of stronger talent, customer and capital networks for
young Ontario companies. MaRS will also continue to develop and support multi-stakeholder innovation
initiatives. The Core Funding Agreement is effective April 1, 2010 through March 31, 2013 and provides
$5 million of funding annually for a total of $15 million (2012 - $10 million) during the term of the contract.
The organization has recognized $5 million in operating grants in the current year representing two years of
funding.
15 Support from donors
The organization receives funding from donors and sponsors in the form of unrestricted, restricted multi-year
grants and restricted endowment contributions.
Donor and sponsor funds received during the year:
2013$
2012$
Donations and sponsorships 594 412Restricted donor contributions 1,668 945Endowment contributions (note 13) 1,771 3,084
4,033 4,441
Donations and sponsorships are recognized in income in the year received. Restricted donor contributions and
endowment contributions and endowment interest earned are recognized in income as the related expenses are
incurred.

MaRS Discovery DistrictNotes to Financial StatementsMarch 31, 2013 and March 31, 2012
(in thousands of dollars, unless otherwise stated)
(15)
16 Contingencies and commitments
There are currently ten recipients of the PSA with a cumulative amount of $6,589 yet to be disbursed. The
organization cannot predict when the remaining disbursements will be made, as they are dependent on the
researcher’s funding needs. The awards must be fully disbursed within five years of signing the agreements.
MaRS holds a head lease with Phase 2 Trust for approximately 120,000 square feet of rentable area in the new
Phase 2 building. The lease commitment commences November 1, 2013 for a ten year term at yearly amounts of
$3,619 for years 1-5 and $3,981 for years 6-10. The aggregate amount of future payments are:
$
2014 1,5082015 3,6192016 3,6192017 3,6192018 3,619Thereafter 22,016
MaRS expects to sub-lease the committed space to external mission-related companies and organizations.
17 MaRS Development Trust
MaRS Development Trust’s (the Trust) purpose was to issue $100,000 in bonds to finance the property
development of the Toronto Medical Discovery Tower facility (the project), situated at the corner of College and
Elizabeth Streets in Toronto, Ontario, for University Health Network (UHN), to operate the project and act as
landlord under the UHN lease agreement. Under the UHN lease agreement, the project has been leased in its
entirety to UHN pursuant to the 30-year lease dated December 12, 2002, with the Trust receiving finance
income recognized over the term of the lease in a manner that produces a constant rate of return on the
investment in the lease. As beneficiary of the Trust, MaRS Discovery District will assume the ownership of the
project upon full repayment of the bonds in 2032.
18 Changes in working capital balance and other operational balances
2013$
2012$
Tenant and client receivables (183) 131Other receivables and prepayments 35 260Due from/to related parties (2,435) (188)Accounts payable and accrued liabilities 2,039 (1,190)Restricted grants 5,583 160
5,039 (827)

MaRS Discovery DistrictNotes to Financial StatementsMarch 31, 2013 and March 31, 2012
(in thousands of dollars, unless otherwise stated)
(16)
19 Government remittances
Government remittances consist of amounts (such as property taxes, sales taxes and payroll withholding taxes)
required to be paid to government authorities and are recognized when the amounts come due. In respect of
government remittances, $nil (2012 - $nil) is included within accounts payable and accrued liabilities.
20 Senior management remuneration
The salaries of the organization’s senior management have been disclosed to the Province of Ontario, in
accordance with the Public Sector Disclosure Act. The organization is subject to the Public Sector Disclosure Act
by virtue of being a non-profit organization that received in excess of $1,000 in funding from the Government
of Ontario.
21 Risk management
The main risks to which MaRS’ financial instruments are exposed are as follows:
Interest rate risk
Interest rate risk is the risk the fair value of future cash flows of a financial instrument will fluctuate
because of changes in market interest rates. The organization manages this risk by investing in low risk
investments such as short-term deposits and money market funds that invest in government bonds.
Liquidity risk
Liquidity risk is the risk the organization will not be able to meet its financial obligations as they come due.
The organization manages liquidity risk through regular monitoring of forecast and actual cash flows.
Given the organization’s available liquid resources as compared to the timing of the payment of liabilities,
management assesses the organization’s liquidity risk to be low.
Credit risk
Credit risk is the risk that one party to a financial instrument will cause a financial loss for the other party
by failing to discharge an obligation. The organization is exposed to credit risk in the event of non-
performance by counter-parties in connection with accounts receivable from tenant leases or collaboration
centre clients.
Market risk
Investments are subject to market risk, which includes price risk. The price risk of the portfolio is the
volatility and risk of capital loss associated with investment in bonds. The organization manages this risk
by investing in fixed income instruments and short-term investments that meet specific investment criteria
established and approved by the Board of Directors and designed to adequately diversify the organization’s
investments to reduce exposure to market risk.
MaRS Discovery DistrictNotes to Financial StatementsMarch 31, 2013 and March 31, 2012
(in thousands of dollars, unless otherwise stated)
(17)
22 Comparative figures
Certain comparative figures have been reclassified where necessary to conform with the current year’s financial
statement presentation.