MARRIOTT INTERNATIONAL, INC. 2006 Annual Report · The Ritz-Carlton® Hotel Company has enjoyed...
74
MARRIOTT INTERNATIONAL, INC. 2006 Annual Report Celebrating 80 years of service
Transcript of MARRIOTT INTERNATIONAL, INC. 2006 Annual Report · The Ritz-Carlton® Hotel Company has enjoyed...
MARRIOTT INTERNATIONAL, INC. 2006 Annual Report
Celebrating 80 years of service
14% 16%
13%
18%
10% 12%
22%
2006 2005 2004 2003 2002 2001 2000
RETURN ON INVESTED CAPITAL (ROIC) (from continuing operations excluding
the synthetic fuel segment)
Celebrating 80 years of serviceMARRIOTT. . . the place to be.
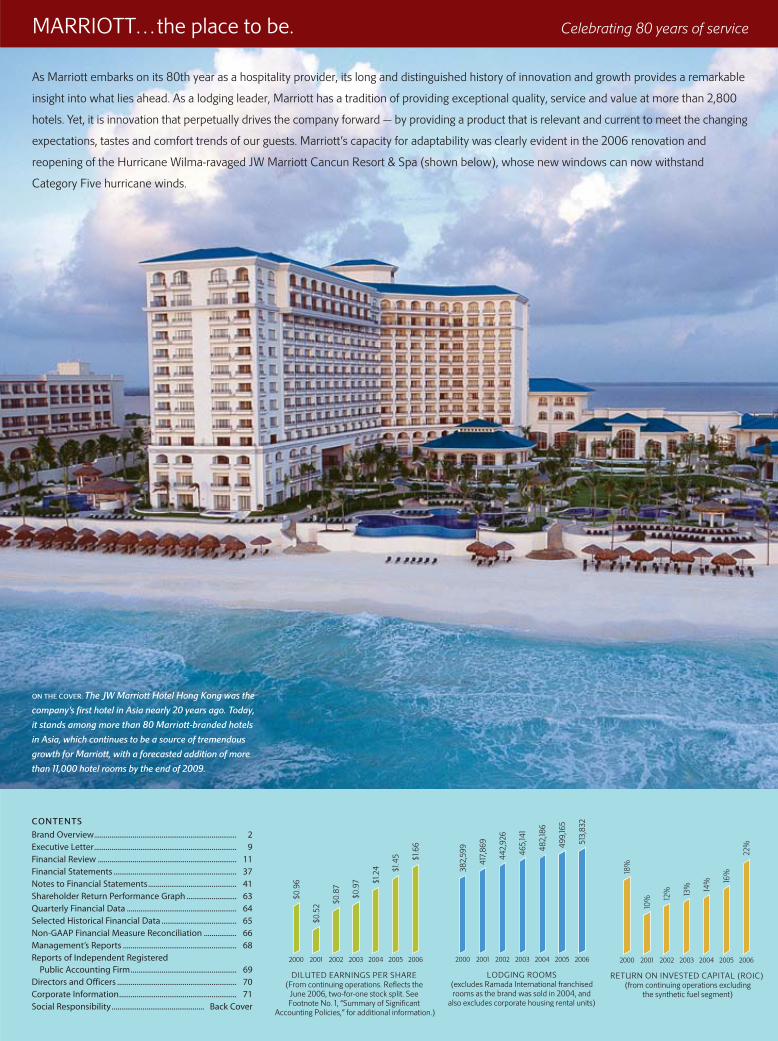
As Marriott embarks on its 80th year as a hospitality provider, its long and distinguished history of innovation and growth provides a remarkable
insight into what lies ahead. As a lodging leader, Marriott has a tradition of providing exceptional quality, service and value at more than 2,800
hotels. Yet, it is innovation that perpetually drives the company forward—by providing a product that is relevant and current to meet the changing
expectations, tastes and comfort trends of our guests. Marriott’s capacity for adaptability was clearly evident in the 2006 renovation and
reopening of the Hurricane Wilma-ravaged JW Marriott Cancun Resort & Spa (shown below), whose new windows can now withstand
Category Five hurricane winds.
ON THE COVER: The JW Marriott Hotel Hong Kong was the
company’s first hotel in Asia nearly 20 years ago. Today,
it stands among more than 80 Marriott-branded hotels
in Asia, which continues to be a source of tremendous
growth for Marriott, with a forecasted addition of more
than 11,000 hotel rooms by the end of 2009.
$1.2
4 $1.4
5
$0.9
7
$0.9
6
$0.5
2 $0.8
7
DILUTED EARNINGS PER SHARE (From continuing operations. Reflects the
June 2006, two-for-one stock split. See Footnote No. 1, “Summary of Significant
Accounting Policies,” for additional information.)
$1.6
6
2006 2005 2004 2003 2002 20012000
CONTENTS
Brand Overview.......................................................................... 2Executive Letter.......................................................................... 9Financial Review ........................................................................ 11Financial Statements ................................................................ 37Notes to Financial Statements.............................................. 41Shareholder Return Performance Graph .......................... 63Quarterly Financial Data ......................................................... 64Selected Historical Financial Data ....................................... 65Non-GAAP Financial Measure Reconciliation ................. 66Management’s Reports ........................................................... 68Reports of Independent Registered
Public Accounting Firm....................................................... 69Directors and Officers .............................................................. 70Corporate Information............................................................. 71Social Responsibility ................................................ Back Cover
2006 2005 2004 2003 2002 2001 2000
382,
599
417,
869
442,
926
465,
141
482,
186
499,
165
LODGING ROOMS (excludes Ramada International franchised rooms as the brand was sold in 2004, and
also excludes corporate housing rental units)
513,
832

The Ritz-Carlton® Hotel Company has enjoyedmore than two decades as an award-winning,luxury hospitality organization. The Ritz-Carltonmanages 60 award-winning hotels and resorts;private condominiums; fractional ownerships; golf communities with exclusive private homes;elegant spas; and highly successful restaurants.The Ritz-Carlton name has become synonymouswith delivering the finest service and creatingexceptional experiences for guests around the globe.
Bulgari Hotels & Resorts®, developed in partnershipwith jeweler and luxury goods designer BulgariSpA, is a collection of sophisticated, intimateluxury properties located in exclusive destinations.Properties feature Bulgari’s striking contemporaryinterpretation of luxury design and cuisine. TheBulgari Resort Bali opened fall 2006 with 59private villas, two restaurants and comprehensivespa facilities in a spectacular sea-view setting.
The JW Marriott® Collection, the most distinctivehotels bearing the Marriott name, invites guests to enjoy a new dimension of luxury—from designerbedding and delectable dining to extraordinary spa and golf offerings — enhanced by exquisiteenvironments, approachable elegance and attentiveservice at more than 35 locations worldwide.
SM
Marriott® Hotels & Resorts, the flagship brand,inspires your best performance during travel,engineering an experience with the services andhuman touches that help you achieve and revive.With 470 properties worldwide, Marriott providesa current approach to the classic hospitality thathas made it a leading choice for travelers for over70 years.
Marriott Resorts is our award-winning portfolio of distinctive properties — from colorful and exoticcorners of the globe to exciting family playgrounds— designed for travelers seeking memorable andrewarding experiences. Marriott Resorts locationsoffer attentive service and exceptional amenities,many with world-class golf and spa facilities.
Renaissance® Hotels & Resorts keeps your lifeinteresting during travel, offering stylish environmentsand opportunities to explore each unique destinationalong with the attentive service of an upscale hotel.At 135 worldwide Renaissance locations, everymoment adds up to an interesting stay that fulfillsyour journey.
Renaissance ClubSport®, a new “lifestyle” concept,combines boutique-style ambience of RenaissanceHotels & Resorts with sleek, upscale, full-servicefitness clubs. Renaissance ClubSport offersdistinctive décor in guest rooms, imaginativedining, attentive service and world-class sports andfitness amenities. The fitness club is complimentaryfor guests and offers memberships to localcommunities. The first Renaissance ClubSport is located in Walnut Creek, Calif.; seven moreproperties are under development.
Marriott Conference Centers provide the ultimateexperience for small to mid-size meetings indistraction-free, retreat-style surroundings. Locatednear major U.S. cities, Marriott Conference Centersoffer special meeting expertise and technicalsupport as well as a variety of social and leisureenvironments, a combination that ensures creativeand effective group events.
(PICTURED FROM TOP TO BOTTOM)
Rome Marriott Grand Hotel Flora
The Portman Ritz-Carlton, Shanghai
SpringHill Suites Savannah Airport
Residence Inn Model Kitchen
Marriott’s Shadow Ridge® (Marriott Vacation Club)
Our Brands

Courtyard by Marriott® offers its guests exactlywhat they need to achieve their goals — andperform at their peak — when on the road. Inmore than 730 locations around the world,Courtyard provides an enabling environment thatprovides its guests “peace of mind,” connectionand restoration.
SpringHill Suites by Marriott® offers spaciousstudio suites, expertly blending function withinnovative and contemporary style. With morethan 150 hotels, SpringHill Suites provides flexibledesign, inspiring service, and enhanced amenitiesto meet the needs of the growing upper-moderatesegment of enjoyment-seeking travelers.
Fairfield Inn by Marriott®, Marriott’s mostaffordable brand, offers all the award-winningquality and hospitality of Marriott at a satisfyingvalue. Fairfield Inn & SuitesSM offers uniquelydesigned suites, an exercise room and enhancedamenities. There are nearly 520 Fairfield Innhotels, including more than 160 Fairfield Inn &Suites locations throughout the United States.
Residence Inn by Marriott®, the leading extended-stay brand, helps guests feel connected while awayfrom home. Spacious suites with full kitchens andseparate areas for sleeping, working, relaxing andeating offer homelike comfort and functionality.Guests experience a true sense of community asthey interact with our friendly staffs, enjoy ourenhanced complimentary hot breakfast, and mingleat our evening social hours at more than 510 hotels.
Moderate-tier, extended-stay guests find comfortin being self-sufficient and doing things their way.To sustain their life’s rhythm, TownePlace Suites byMarriott® provides a place to unpack, settle in andconnect to the local area. With a casual, residentialatmosphere and a productive home office and fullkitchen in every suite, at more than 120 hotels,TownePlace Suites is all about real living.
Marriott Executive Apartments® is the idealsolution for longer-stay trips in key internationalgateway cities. Offering studios to three-bedroomapartments in more than 15 locations, MarriottExecutive Apartments delivers the comforts ofhome plus the indulgence of quality hotel services,including around-the-clock staffing, housekeepingand laundry service. The living areas offer fullyequipped kitchens and dedicated work andrelaxation areas.
Marriott ExecuStay®, a leading U.S. corporateapartment provider, offers temporary housing totravelers who prefer the spaciousness and privacyof an apartment for extended stays of 30 days orlonger. With locations in most major, secondaryand tertiary U.S. cities, ExecuStay finds the rightsolution for each traveler and delivers a fullyfurnished, accessorized apartment with as little as one day’s notice.
Marriott Vacation ClubSM (MVC) is the recognized,worldwide leader in the vacation ownershipindustry. The 45 MVC properties around the globeoffer a lifetime of memorable vacations featuringone- to three-bedroom villas (depending onlocation) with living and dining areas, masterbedroom and bath, balcony, full kitchen andwasher/dryer. Flexible usage options includeexchange to MVC resorts and trade for MarriottRewards® points.
Horizons by Marriott Vacation Club® providesaffordable vacation ownership, while offering avariety of amenities and activities for the entirefamily. Each villa includes living and dining areas,balcony, kitchen and washer/dryer. Horizonsowners have a flexible usage program includingexchange to other Marriott Vacation Club resorts,and the ability to trade for Marriott Rewards points.Locations: Orlando, Fla., and Branson, Mo.
Grand Residences by Marriott® provides secondhome options through fractional real estate offeringsand select private ownership opportunities. Designedfor regional second home destinations, the brand isdedicated to providing carefree property ownershipthrough Marriott management expertise and avariety of amenities and services. Locations:Panama City Beach, Fla.; South Lake Tahoe, Calif.;and London, England.
The Ritz-Carlton Club® is a deeded, fractionalownership real estate offering combining the benefits of second home ownership with renowned Ritz-Carlton service. Designed as a private club,Members may access their home Club or other Ritz-Carlton Clubs. Locations: Aspen Highlands andBachelor Gulch, Colo.; St. Thomas, U.S.V.I.; and Jupiter,Fla., as well as several future properties ranging fromKapalua Bay on Maui to Miami’s South Beach.

As the brand catering to the “enjoyment” guest, Renaissance Hotels & Resorts properties
strive to be even more expressive and relevant to customers who delight in imaginative
settings and savvy service. At some locations, such as the Renaissance Schaumburg Hotel
& Convention Center (shown above) outside of Chicago, guests are already experiencing
the “great room” concept, a new take on lobbies that transforms a one-dimensional public
space into inviting and comfortable zones for both business and leisure activities. At the
Renaissance New York Hotel Times Square (right), a new “urban” room serves as a prototype
for other hotels.

4 | M A R R I O T T I N T E R N A T I O N A L , I N C . 2 0 0 6
Gone are the days of the old hotel coffee
shop. Today, guests are seeking more
than sustenance when they dine in a
hotel restaurant, and Marriott delivers
the culinary experience in a way that is
exciting, contemporary and in concert
with fresh and healthy dining trends.
Marriott restaurants have become
destinations unto themselves — for
both guests and local residents — with
street-side access, concept-driven
menus and an ambience that is stylish,
warm and innovative. Bars, too, now
offer a hip, local vibe, with top-notch
mixology programs, signature drinks
and an intriguing urban style. The
growing prestige of Marriott’s restaurants
is attracting both celebrity chefs and
rising stars, such as Jun Tanaka (shown
above), Gordon Ramsey, Laurent
Tourondel and Bradley Ogden.
A Place to Savor
1331, the fashionable restaurant and bar at
the JW Marriott Hotel Pennsylvania Avenue in
Washington, DC

M A R R I O T T I N T E R N A T I O N A L , I N C . 2 0 0 6 | 5
At Marriott, we know our business
guests are expert travelers, with a
variety of needs and one common
goal — to realize ultimate productivity
while on the road, enjoying the journey
along the way. To that end, Marriott is
constantly creating ways to make
business travel more convenient and
satisfying. This year, Marriott
introduced eFolio, so that guests
can receive their hotel bills via email.
Globally, Marriott has expanded the
business-focused Courtyard brand,
introducing a new prototype in
France and launching an aggressive
roll-out of the hotel “designed by
business travelers” throughout Europe.
These innovations have not gone
unnoticed — in the 2006 TripAdvisor™
global survey, business travelers
named Marriott the most preferred
hotel for business trips.
A Place to Achieve
Courtyard Paris Colombes

6 | M A R R I O T T I N T E R N A T I O N A L , I N C . 2 0 0 6
Marriott International offers nearly
90 spas around the world, including
locations at The Ritz-Carlton, JW Marriott
Hotels & Resorts, Marriott Hotels &
Resorts, and Renaissance Hotels &
Resorts. In settings ranging from
mountain retreats to cosmopolitan
centers to beachside resorts, these spas
help guests achieve that elusive harmony
of mind and body. Each spa reflects the
regional flavor of its location, providing
guests with signature treatments and
distinctive sanctuaries to recharge and
revitalize. Guests at Marriott Hotels &
Resorts spas can bring the experience
home with an exclusive line of personal
care products available for purchase on
ShopMarriott.com.
A Place to Recharge
ABOVE: Renaissance Mumbai Hotel & Convention
Centre. RIGHT: The Ritz-Carlton, Jakarta

M A R R I O T T I N T E R N A T I O N A L , I N C . 2 0 0 6 | 7
For many, leisure time is a precious
commodity — every moment to be
treasured and committed to memory.
Marriott makes the leisure experience
a pure pleasure — from initial planning
to the moment of realization that this is
what life is all about. With Marriott.com,
the award-winning web site, visitors
can search for the perfect getaway or
vacation package, plan a wedding,
create a honeymoon registry and track
progress toward a desired vacation.
Marriott fulfills the dream, with more
than 135 resorts around the world,
including 45 Marriott Vacation Club
resorts in 29 exceptional destinations.
Golf enthusiasts will find more than 70
hotels and resorts offering golf on-site.
Marriott’s Waiohai Beach Club®,
Koloa in Kauai, Hawaii
A Place to Let Go

8 | M A R R I O T T I N T E R N A T I O N A L , I N C . 2 0 0 6
An essential function of Marriott’s success
is our people — the associates whose
talents, diverse cultures, backgrounds
and more than 50 spoken languages
are the essence of our vision to better
serve the needs of our customers
around the world. At Marriott, we
celebrate not what makes us different,
but what makes each of us special,
and we are driven by a distinguished
corporate culture that thrives on the
professional development and upward
mobility of our associates.
As a testament to our uncompromising
commitment to diversity excellence,
Marriott established the Committee
for Excellence. Its mission is to achieve
significant progress in diversity and
ensure Marriott’s position as a leader
in this field. Drivers of success include
the Committee’s focus on the diversity
business case, accountability and
measuring results. Specific goals are
set annually and progress is monitored
throughout the year. These accomplish-
ments have been recognized by the
NAACP, Black Enterprise, DiversityInc,
Latina Style and Hispanic Business.
A Place to Succeed

To Our Shareholders of schedule. Adjusting our historical share prices to reflect the 2006 two-for-one stock split, our share price also reached a recordhigh in 2006.
LEADING THE WAYThis success is due to multiple factors. Our business model, broadbrand portfolio, and innovative programs and initiatives give us acompetitive advantage not easily matched.
By managing and franchising rather than owning hotels, we cangrow much faster, leveraging our management and brand-buildingcapability. Faster unit growth, in turn, drives greater market shareand brand equity, which encourages owners and franchisees todevelop yet more hotels flying our flags.
With 18 brands, Marriott has the broadest lodging and timeshareportfolio in the world. Our lodging brands operate with significantRevPAR premiums over competitors. Despite our industry leader-ship, we continue to innovate to make our products even better.
Guests have enthusiastically embraced changes we’re making in our guest rooms — featuring luxurious bedding, the latest tech-nology, including our new “plug and play” connectivity panel, and,now, a completely smoke-free environment in the United States and Canada. This year, we’ll introduce the “great room” — a rev-olutionary transformation of public space in select Marriott andRenaissance hotels, designed for today’s travelers, who smoothlytransition between work and play. Besides enhancing the guestexperience, we expect the “great room” to generate new incre-mental property-level revenue from food and beverage sales.
At Renaissance Hotels & Resorts, our owners and franchiseesare revitalizing the brand with nearly $2 billion of investmentexpected in new construction, property conversions and renovationprojects worldwide over three years. The Renaissance SchaumburgHotel & Convention Center, a signature property outside of Chicago,opened in 2006 and features the latest technological, architecturaland “savvy service” innovations coming soon to other properties.The Renaissance New York Hotel Times Square is being dramaticallyrenovated and will be the prototype for a cool, new urban look, andEden Roc, a renowned Renaissance Resort and Spa in MiamiBeach, will become one of the finest hotels in Florida.
Our preeminent luxury brand, the Ritz-Carlton, is capitalizing onthe demand for luxury goods. In Los Angeles, both a Ritz-Carltonand a JW Marriott hotel will be part of “LA Live,” a unique complexthat will combine sports, retail, residential and convention centerspace opening in 2010. In Asia we have new Ritz-Carlton hotelsplanned for Tokyo, Shanghai and Beijing.
Our Ritz-Carlton Club fractional and residential properties areincreasingly popular with new projects in sales in the Bahamas,South Beach Miami, Hawaii and San Francisco. Some of our vaca-tion ownership projects are structured as joint ventures enablingMarriott to apply its branding and hospitality expertise with relativelymodest capital investment. We expect roughly one-third of our time-share, fractional and residential contract sales to come from jointventures by 2009, increasing profits while also increasing our ROIC.
We continue to renovate and reinvent our limited-service brands.More than 500 Courtyard and Residence Inn hotels feature our newestgeneration of style and design, including new properties that haveopened in the last few years as well as the nearly 250 Courtyard andResidence Inn properties that have completed renovations. An addi-tional 150 Residence Inn hotels are scheduled for renovation in2007. These renovated and reinvented hotels yield much higherguest satisfaction measurements and profits.
J.W. MARRIOTT, JR.Chairman andChief Executive Officer
WILLIAM J. SHAWPresident and Chief Operating Officer
MARRIOTT INTERNATIONAL ENJOYED AN EXCEPTIONALyear in 2006, and we are celebrating 80 years in business and 50years of hotel industry leadership in 2007. As we look to the future,our continued growth will be defined by our premium brands and a commitment to innovation and service.
The lodging demand environment has rarely been stronger.Modest hotel industry construction in urban locations in the UnitedStates in recent years ushered in improved pricing power in 2006.North American company-operated comparable Revenue PerAvailable Room (RevPAR) increased nearly 9 percent in 2006,largely driven by pricing. Including the impact of foreign exchange,international company-operated comparable RevPAR was stellar forthe year, growing over 12 percent as the strong global economydrove international travel.
In 2006, our owners and franchisees added more than 23,000rooms to our system, demonstrating confidence in our brands. Overthe next several years, we expect owners and franchisees will investnearly $20 billion to expand the Marriott International system,attracted by guest preference for our products and strong roomrates, occupancies and property-level profits.
We also delivered impressive financial results in 2006. Withboth unit expansion and RevPAR growth, management and fran-chise fee revenue increased 19 percent to a record $1.2 billion.Diluted earnings per share from continuing operations reached$1.66. Net cash provided by operating activities totaled $970 mil-lion and share repurchases and dividends returned nearly $1.7 bil-lion to shareholders. Pre-tax return on invested capital (ROIC)reached 22 percent, exceeding our 20 percent goal well ahead
M A R R I O T T I N T E R N A T I O N A L , I N C . 2 0 0 6 | 9

J.W. MARRIOTT, JR.Chairman and Chief Executive Officer
WILLIAM J. SHAWPresident and Chief Operating Officer
The repositioned SpringHill Suites shows great promise as thepreferred brand for active, style-conscious GenXers who enjoy travel and are looking for an upper-moderate tier hotel. Completelyredesigned, the new concept will soon be introduced to many of thebrand’s more than 150 existing hotels.
TownePlace Suites, our moderate-priced extended-stay brand, hasalso been repositioned to better reflect its local surroundings, and thebrand expects more than 90 renovations in the next 18 months. Wealso have great news to report on Fairfield Inn—our “prune and plant”strategy is working: nearly 40 hotels have left the system in the pasttwo years, and a record 100 newly designed hotels are in the pipeline.
Across all of our brands, we remain focused on finding innovativeways for technology to enhance the guest experience. Businesstravelers rave about “eFolio,” which provides emailed copies of hotel bills. At the Redmond Marriott Town Center in Washington,tech-savvy guests are checking in using handheld PDAs. In someMarriott and Renaissance hotel lobbies in North America, guests canprint their airline boarding passes from dedicated computer stations— a service that is really “taking off.”
Selling to customers the way they want to buy is as important ascatering to them upon arrival, and we enjoy a tremendous strengthin our distribution channels. In fact, Marriott.com is one of the topretail web sites in the world, generating property-level Internet salesof $4.3 billion in 2006, 35 percent higher than 2005. Marriott.comaccounted for 87 percent of the company’s Internet sales in 2006.Our sales teams are recognized as the industry’s best, having justbeen named Selling Power magazine’s top global sales team of 2006,and innovations at our Event Booking Centers have enhanced ouroutreach to smaller groups.
Another important competitive advantage is Marriott Rewards,®
our award-winning guest loyalty program. With 26 million membersand 2,700 participating properties in 65 countries and territories,Marriott Rewards is a powerful engine driving customer satisfaction,repeat business and the growth of our brands.
LOOKING FORWARDIn October in Paris, we held our first conference outside the UnitedStates for the investment community, where we presented the com-pany’s business outlook through 2009. We described our bullishnessabout the capacity of our business model to deliver strong fee incomeand generate significant net cash from operating activities in varyingRevPAR environments. We reviewed how diluted earnings per share,excluding our synthetic fuel business, could rise by 15 to 25 percentcompounded over the next three years. And at the same time, ourROIC could reach the mid-to-high 20s in percentage terms by 2009.The robust cash flow from our business, combined with owner andfranchisee preference for our brands, provides us with the flexibilityand strength to opportunistically grow and improve our system, whilereturns to shareholders continue to increase.
Over the next three years, we plan to add 85,000 to 100,000hotel rooms worldwide, with nearly a third of those opening outsideNorth America. With a less than 1 percent market share outside theUnited States, Marriott’s experienced global development engine,proven business model of managing and franchising, and preferredbrands should drive powerful growth. Economic growth in Chinaand India has fueled huge middle classes that will travel as neverbefore. By year-end 2009, we expect to have a portfolio totalingnearly 600,000 rooms, including 120,000 outside North America.
In the shorter term, our all-important group business bookingshave been off to a good start in the first few months of 2007, and
our Marriott brand bookings for 2007, as compared to the prior yearpace, are up nicely. With our product and service enhancementsleading the way, we expect a good year.*
MAKING A DIFFERENCEAs a global leader in hospitality, Marriott takes its role as a corporatecitizen very seriously. With our associates, we work with charitableorganizations, governments and international agencies to help thou-sands of people around the world. This includes supporting pro-grams that help educate and develop an emerging global workforce,benefiting both our communities and the company.
In particular, Marriott supports and respects the protection ofhuman rights. In fact, we amended our human rights policy inNovember. This includes standing against human trafficking and theexploitation of children. To help break the cycle of poverty that oftenmakes at-risk youth vulnerable, Marriott supports programs and part-nerships that train and help them find meaningful employment.
Diversity across our enterprise remains an integral part of our suc-cess, and our board of directors helps drive our progress. The com-pany has pledged to have 500 minority- and women-owned hotelsin its system by 2010, and to spend $1 billion with diverse suppliers.At the end of 2006, we had already reached $400 million in spend-ing and had 400 hotels open or in the pipeline owned or managedby women or minorities.
Marriott is committed to environmental stewardship, helping topreserve natural surroundings and reduce resource consumption.The U.S. Environmental Protection Agency (EPA) has recognizedthese efforts, naming Marriott an ENERGY STAR® Partner of theYear for the last three years. Marriott was the first company to jointhe EPA’s Climate Leaders Program, pledging to reduce greenhousegases by 6 percent per available room by 2010.
OUR SPIRIT TO SERVEWhile we’ve set the stage with new products and services, a supe-rior business model and financial strength, our success wouldn’t be possible without our more than 150,000 associates and theirenduring “Spirit To Serve.®” We retain great talent in large partbecause of our strong company culture, which promotes oppor-tunities for our associates.
Opportunity has defined the Marriott legacy and inspires ourfuture. As we mark our 80th anniversary year, Marriott has greatreason to celebrate, with good economic trends, strong traveldemand and our powerful growth engine pointing toward sustainedoutstanding performance. But as always, we’ll continue to innovate,look for ways to improve our business and better serve our cus-tomers. Because, as J. Willard Marriott, Sr. said when he and hiswife, Alice S. Marriott, founded this company in 1927, “Success isnever final.”
10 | M A R R I O T T I N T E R N A T I O N A L , I N C . 2 0 0 6
* Please see “Risk Factors” later in this report for information about forward-looking state-ments, risks and uncertainties.

FORWARD-LOOKING STATEMENTS
We make forward-looking statements in this report (see“Management’s Discussion and Analysis of FinancialCondition and Results of Operations”) based on the beliefsand assumptions of our management and on informationcurrently available to us. Forward-looking statements includeinformation about our possible or assumed future results ofoperations which follow under the headings “Business andOverview,”“Liquidity and Capital Resources” and other state-ments throughout this report preceded by, followed by orthat include the words “believes,”“expects,”“anticipates,”“intends,”“plans,”“estimates” or similar expressions.
Forward-looking statements are subject to a number ofrisks and uncertainties that could cause actual results to dif-fer materially from those expressed in these forward-lookingstatements, including the risks and uncertainties describedbelow and other factors we describe from time to time in ourperiodic filings with the Securities and ExchangeCommission. We therefore caution you not to rely unduly onany forward-looking statements. The forward-looking state-ments in this report speak only as of the date of this report,and we undertake no obligation to update or revise any for-ward-looking statement, whether as a result of new informa-tion, future developments or otherwise.
RISKS AND UNCERTAINTIES
We are subject to various risks that could have a negativeeffect on the Company and its financial condition. You shouldunderstand that these risks could cause results to differmaterially from those expressed in forward-looking state-ments contained in this report and in other Company com-munications. Because there is no way to determine inadvance whether, or to what extent, any present uncertaintywill ultimately impact our business, you should give equalweight to each of the following.
The lodging industry is highly competitive, which may impactour ability to compete successfully with other hotel and time-share properties for customers. We generally operate in mar-kets that contain numerous competitors. Each of our hoteland timeshare brands competes with major hotel chains innational and international venues and with independentcompanies in regional markets. Our ability to remain compet-itive and to attract and retain business and leisure travelersdepends on our success in distinguishing the quality, valueand efficiency of our lodging products and services fromthose offered by others. If we are unable to compete success-fully in these areas, this could limit our operating margins,diminish our market share and reduce our earnings.
We are subject to the range of operating risks common to thehotel, timeshare and corporate apartment industries. The prof-itability of the hotels, vacation timeshare resorts and corpo-rate apartments that we operate or franchise may beadversely affected by a number of factors, including:
(1) the availability of and demand for hotel rooms, time-share interval, fractional and whole ownership prod-ucts and apartments;
(2) international, national and regional economic andgeopolitical conditions;
(3) the impact of war, actual or threatened terrorist activ-ity and heightened travel security measures institutedin response to war, terrorist activity or threats;
(4) the desirability of particular locations and changes intravel patterns;
(5) travelers’ fears of exposure to contagious diseases,such as Avian Flu and Severe Acute RespiratorySyndrome (“SARS”);
(6) the occurrence of natural disasters, such as earth-quakes, tsunamis and hurricanes;
(7) taxes and government regulations that influence ordetermine wages, prices, interest rates, constructionprocedures and costs;
(8) the availability and cost of capital to allow us andpotential hotel owners and joint venture partners tofund investments;
(9) regional and national development of competingproperties;
(10) increases in wages and other labor costs, energy,healthcare, insurance, transportation and fuel, andother expenses central to the conduct of our busi-ness, including recent increases in energy costs; and
(11) organized labor activities, which could cause thediversion of business from hotels involved in labornegotiations, loss of group business, and/or increasedlabor costs.
Any one or more of these factors could limit or reduce thedemand, or the prices we are able to obtain for hotel rooms,timeshare units and corporate apartments, or could increaseour costs and, therefore, reduce the profit of our lodgingbusinesses. Reduced demand for hotels could also give riseto losses under loans, guarantees and minority equity invest-ments that we have made in connection with hotels that wemanage. Even where such factors do not reduce demand, ourprofit margins may suffer if we are unable to fully recoverincreased operating costs from our customers.
The uncertain pace and duration of the current growth envi-ronment in the lodging industry will continue to impact ourfinancial results and growth. Both the Company and the lodg-ing industry were hurt by several events occurring over thelast several years, including the global economic downturn,the terrorist attacks on New York and Washington inSeptember 2001, the global outbreak of SARS in 2003 andmilitary action in Iraq. Although both the lodging and travelindustries have now largely recovered from the depressedlevels during those years, the duration, pace and full extent ofthe current growth environment remains unclear. Accord-ingly, our financial results and growth could be harmed ifthat recovery stalls or is reversed.
Our lodging operations are subject to international, nationaland regional conditions. Because we conduct our business ona national and international platform, our activities are sus-ceptible to changes in the performance of regional and
M A R R I O T T I N T E R N A T I O N A L , I N C . 2 0 0 6 | 11
Risk Factors

global economies. In recent years, our business was hurt bydecreases in travel resulting from recent economic condi-tions, the military action in Iraq and the heightened travelsecurity measures that have resulted from the threat of fur-ther terrorism. Our future economic performance is similarlysubject to the uncertain economic environment in theUnited States and other regions, the unknown pace of busi-ness travel that results and the occurrence of any future inci-dents in the countries where we operate.
Our growth strategy depends upon third-party owners/oper-ators, and future arrangements with these third parties may beless favorable. Our present growth strategy for developmentof additional lodging facilities entails entering into and main-taining various arrangements with property owners. Theterms of our management agreements, franchise agreementsand leases for each of our lodging facilities are influenced bycontract terms offered by our competitors, among otherthings. We cannot assure you that any of our current arrange-ments will continue, or that we will be able to enter intofuture collaborations, renew agreements, or enter into newagreements in the future on terms that are as favorable to usas those that exist today.
We may have disputes with the owners of the hotels that wemanage or franchise. Consistent with our focus on manage-ment and franchising, we own very few of our lodging proper-ties. The nature of our responsibilities under our managementagreements to manage each hotel and enforce the standardsrequired for our brands under both management and fran-chise agreements may, in some instances, be subject to inter-pretation and may give rise to disagreements. We seek toresolve any disagreements in order to develop and maintainpositive relations with current and potential hotel owners andjoint venture partners but have not always been able to do so.Failure to resolve such disagreements has in the past resultedin litigation, and could do so in the future.
Our ability to grow our management and franchise systems issubject to the range of risks associated with real estate invest-ments. Our ability to sustain continued growth through man-agement or franchise agreements for new hotels and theconversion of existing facilities to managed or franchisedMarriott brands is affected, and may potentially be limited, bya variety of factors influencing real estate development gen-erally. These include site availability, financing, planning, zon-ing and other local approvals and other limitations that maybe imposed by market and submarket factors, such as pro-jected room occupancy, changes in growth in demand com-pared to projected supply, territorial restrictions in ourmanagement and franchise agreements, costs of construc-tion, and anticipated room rate structure.
We depend on capital to buy and maintain hotels, and we orhotel owners may be unable to access capital when necessary. Inorder to fund new hotel investments, as well as refurbish andimprove existing hotels, both the Company and current andpotential hotel owners must periodically spend money. Theavailability of funds for new investments and maintenance ofexisting hotels depends in large measure on capital marketsand liquidity factors over which we can exert little control.Our ability to recover loan and guarantee advances fromhotel operations or from owners through the proceeds of
hotel sales, refinancing of debt or otherwise may also affectour ability to recycle and raise new capital. In addition, down-grades of our public debt ratings by Standard & Poor’s,Moody’s Investor Service or similar companies could increaseour cost of capital.
Our development activities expose us to project cost, comple-tion and resale risks. We develop new hotel, timeshare inter-val, fractional ownership and whole ownership properties,both directly and through partnerships, joint ventures andother business structures with third parties. Our involvementin the development of properties presents a number of risks,including that: (1) construction delays, cost overruns, or actsof God such as earthquakes, hurricanes, floods or fires mayincrease overall project costs or result in project cancella-tions; (2) we may be unable to recover development costs weincur for projects that are not pursued to completion; (3) con-ditions within capital markets may limit our ability, or that ofthird parties with whom we do business, to raise capital forcompletion of projects that have commenced or develop-ment of future properties; and (4) properties that we developcould become less attractive due to changes in mortgagerates, market absorption or oversupply, with the result thatwe may not be able to sell such properties for a profit or atthe prices we anticipate.
Development activities that involve our co-investment withthird parties may further increase completion risk or result in dis-putes that could increase project costs or impair project opera-tions. Partnerships, joint ventures and other businessstructures involving our co-investment with third partiesgenerally include some form of shared control over the oper-ations of the business and create additional risks, includingthe possibility that other investors in such ventures couldbecome bankrupt or otherwise lack the financial resources tomeet their obligations, or could have or develop businessinterests, policies or objectives that are inconsistent withours. Although we actively seek to minimize such risks beforeinvesting in partnerships, joint ventures or similar structures,actions by another investor may present additional risks ofproject delay, increased project costs, or operational difficul-ties following project completion.
Risks associated with development and sale of residentialproperties that are associated with our lodging and timeshareproperties or brands may reduce our profits. In certain hoteland timeshare projects we participate, through minorityinterests and/or licensing fees, in the development and saleof residential properties associated with our brands, includ-ing luxury residences and condominiums under our The Ritz-Carlton and Marriott brands. Such projects pose additionalrisks beyond those generally associated with our lodging andtimeshare businesses, which may reduce our profits or com-promise our brand equity, including the following:
3 Decreases in residential real estate and vacation homeprices or demand generally, which have historicallybeen cyclical, could reduce our profits or even result inlosses on residential sales, and could also result in sig-nificant carrying costs if the pace of sales is slowerthan we anticipate;
3 Increases in interest rates, reductions in mortgageavailability, or increases in the costs of residential
12 | M A R R I O T T I N T E R N A T I O N A L , I N C . 2 0 0 6
ownership could prevent potential customers frombuying residential products or reduce the prices theyare willing to pay;
3 Residential construction may be subject to warrantyand liability claims, and the costs of resolving suchclaims may be significant; and
3 If the pace of sales is slower than we anticipate or salesprices are lower than projected, it may become moredifficult to convince future hotel development part-ners of the value added by our brands.
Damage to or other potential losses involving properties thatwe own, manage or franchise may not be covered by insurance.We have comprehensive property and liability insurance poli-cies with coverage features and insured limits that we believeare customary. Market forces beyond our control maynonetheless limit the scope of insurance coverage that wecan obtain and our ability to obtain coverage at reasonablerates. Certain types of losses, generally of a catastrophicnature, such as earthquakes, hurricanes and floods or terroristacts, may be uninsurable or too expensive to justify insuringagainst. As a result, we may not be successful in obtaininginsurance without increases in cost or decreases in coveragelevels. In addition, in the event of a substantial loss, the insur-ance coverage we carry may not be sufficient to pay the fullmarket value or replacement cost of our lost investment orthat of hotel owners, or in some cases could result in certainlosses being totally uninsured. As a result, we could lose someor all of the capital we have invested in a property, as well asthe anticipated future revenue from the property, and wecould remain obligated for guarantees, debt or other finan-cial obligations related to the property.
Risks relating to acts of God, contagious disease, terroristactivity and war could reduce the demand for lodging, which mayadversely affect our revenues. Acts of God, such as hurricanes,earthquakes and other natural disasters and the spread ofcontagious diseases, such as Avian Flu and SARS, in locationswhere we own, manage or franchise significant propertiesand areas of the world from which we draw a large number ofcustomers can cause a decline in the level of business andleisure travel and reduce the demand for lodging. Actual orthreatened war, terrorist activity, political unrest, civil strife andother geopolitical uncertainty can have a similar effect. Anyone or more of these events may reduce the overall demandfor hotel rooms, timeshare units and corporate apartments orlimit the prices that we are able to obtain for them, both ofwhich could adversely affect our profits.
A failure to keep pace with developments in technology couldimpair our operations or competitive position. The lodging andtimeshare industries continue to demand the use of sophisti-cated technology and systems, including those used for ourreservation, revenue management and property managementsystems, our Marriott Rewards program, and technologies wemake available to our guests.These technologies and systemsmust be refined, updated and/or replaced with more advancedsystems on a regular basis. If we are unable to do so as quicklyas our competitors, or within budgeted costs and time frames,our business could suffer.We also may not achieve the benefitsthat we anticipate from any new technology or system, and a
failure to do so could result in higher than anticipated costs orcould impair our operating results.
An increase in the use of third-party Internet reservationservices could adversely impact our revenues. Some of our hotelrooms are booked through Internet travel intermediaries,such as Travelocity.com®, Expedia.com®, and Priceline.com®,serving both the leisure and, increasingly, the corporate traveland group meeting sectors. While Marriott’s Look NoFurther® Best Rate Guarantee has greatly reduced the abilityof these Internet travel intermediaries to undercut the pub-lished rates at our hotels, these intermediaries continue theirattempts to commoditize hotel rooms by aggressively mar-keting to price-sensitive travelers and corporate accountsand increasing the importance of general indicators of qual-ity (such as “three-star downtown hotel”) at the expense ofbrand identification. These agencies hope that consumerswill eventually develop brand loyalties to their travel servicesrather than to our lodging brands. Although we expect tocontinue to maintain and even increase the strength of ourbrands in the online marketplace, if the amount of salesmade through Internet intermediaries increases significantly,our business and profitability may be harmed.
Changes in privacy law could adversely affect our ability tomarket our products effectively. Our Timeshare segment, andto a lesser extent our other lodging segments, rely on a vari-ety of direct marketing techniques, including telemarketing,email marketing and postal mailings. Any further restrictionsin laws such as the Telemarketing Sales Rule, CANSPAM Act,and various U.S. state laws regarding marketing and solicita-tion or international data protection laws that govern theseactivities could result in concern about the continuing effec-tiveness of telemarketing, email and postal mailing tech-niques and could force further changes in our marketingstrategy. If this occurs, we may not be able to develop ade-quate alternative marketing strategies, which could impactthe amount and timing of our sales of timeshare units andother products. We also obtain access to potential customersfrom travel service providers or other companies with whomwe have substantial relationships and market to some indi-viduals on these lists directly or by including our marketingmessage in the other company’s marketing materials. If theacquisition of these lists were outlawed or otherwiserestricted, our ability to develop new customers and intro-duce them to our products could be impaired.
Operating risks at our synthetic fuel operations could reducethe tax benefits generated by those facilities. The Companyowns four synthetic fuel production facilities. The InternalRevenue Code provides tax credits for the production andsale of synthetic fuels produced from coal through 2007.Although our synthetic fuel facilities incur significant losses,those losses are more than offset by the tax credits gener-ated, which reduce our income tax expense. Problems relatedto supply, production and demand at any of the syntheticfuel facilities, the power plants and other end users that buysynthetic fuel from the facilities, the suppliers of the treat-ment agent or the coal mines from which the facilities buycoal could diminish the productivity of our synthetic fueloperations and adversely impact the ability of those opera-tions to generate tax credits.
M A R R I O T T I N T E R N A T I O N A L , I N C . 2 0 0 6 | 13

High oil prices in 2007 could reduce or eliminate the tax cred-its generated by our synthetic fuel facilities. The tax creditsavailable under the Internal Revenue Code for the productionand sale of synthetic fuel in any given year are phased out ifthe Reference Price of a barrel of oil for that year falls within aspecified price range. The “Reference Price” of a barrel of oil isan estimate of the annual average wellhead price per barrelof domestic crude oil and is determined for each calendaryear by the Secretary of the Treasury by April 1 of the follow-ing year. In 2004 and 2005, the Reference Price was approxi-mately equal to 89 percent of the average price in thoseyears of the benchmark NYMEX futures contract for a barrelof light, sweet crude oil. The price range within which the taxcredit is phased out was set in 1980 and is adjusted annuallyfor inflation. In 2005, the phase-out range was $53.20 to$66.79. Because the Reference Price for a barrel of oil for 2005was below that range, at $50.26, there was no reduction ofthe tax credits available for synthetic fuel produced and soldin 2005.
Assuming a 2 percent inflation adjustment factor for 2006and assuming that the ratio of the Reference Price to theaverage price of the benchmark NYMEX futures contractremains approximately the same in 2006 as it was in 2005 wecurrently estimate that there was a 39 percent reduction ofthe tax credits available for synthetic fuel produced and soldin 2006. Assuming a 2 percent inflation adjustment factor foreach of 2006 and 2007 and assuming the ratio of theReference Price to the average price of the benchmark
NYMEX futures contract remains the same in 2007 as it was in2005, we currently estimate that the tax credits available forthe production and sale of synthetic fuel in 2007 wouldbegin to be phased out if the average price of the bench-mark NYMEX futures contract in 2007 exceeds approximately$62.19 and would be fully phased out if the average price ofthe benchmark NYMEX futures contract in 2007 exceedsapproximately $78.08. The average price of the benchmarkNYMEX futures contract for 2007, through February 9, 2007,was approximately $55.49.
We cannot predict with any accuracy the future price of abarrel of oil. If the Reference Price of a barrel of oil in 2007exceeds the applicable phase-out threshold, the tax creditsgenerated by our synthetic fuel facilities could be reduced oreliminated, which would have a negative impact on ourresults of operations. Late in 2006 and early in 2007, weentered into hedging agreements to minimize operatinglosses that could occur if more than a majority of the taxcredits are phased out in 2007.
Our effective tax rate is likely to increase significantly afterthe synthetic fuel tax credit program expires at the end of 2007.Tax credits contributed by our synthetic fuel operations havesignificantly reduced our effective tax rate during the lastseveral years. Because that program ends with 2007 syntheticfuel production, our facilities will not be able to generatecredits in future years. As a result, our future effective tax rateis likely to increase significantly, thereby reducing our after-tax profits.
14 | M A R R I O T T I N T E R N A T I O N A L , I N C . 2 0 0 6

BUSINESS AND OVERVIEW
We are a worldwide operator and franchisor of 2,832 hotels andrelated facilities. Our operations are grouped into six businesssegments: North American Full-Service Lodging, North AmericanLimited-Service Lodging, International Lodging, Luxury Lodging,Timeshare and Synthetic Fuel. In our Lodging business, we oper-ate, develop and franchise under 13 separate brand names in 68 countries and territories.We also operate and develop Marriotttimeshare properties under four separate brand names.
We earn base, incentive and franchise fees based upon theterms of our management and franchise agreements. Revenuesare also generated from the following sources associated withour Timeshare segment: (1) selling timeshare interval, fractionaland whole ownership properties; (2) operating the resorts; and(3) financing customer purchases of timesharing intervals. Inaddition, we earn revenues from the limited number of hotelswe own and lease and we earn revenues and generate tax cred-its from our synthetic fuel operations.
Generally, lodging demand remained robust through 2006,driven by continued strength associated with business andleisure travelers, while lodging supply growth continued toremain low. At the property level, these factors enabled us toincrease rates and improve revenue mix, which resulted in strongyear-over-year RevPAR increases. Revenue mix improvement is afunction of the strong demand environment and results as someless profitable business is limited in favor of more profitable busi-ness, such as fewer discounted leisure packages in favor of morecorporate business. This deliberate strategy of shifting businessto higher rated tiers, yielded strong year-over-year average dailyrate growth and only modest occupancy declines. Rates havealso increased as stronger demand enabled us to reduce avail-able discounts and special rates. In addition, group rates continueto increase as business negotiated in earlier years at lower rates isreplaced with business negotiated at higher rates.
Demand for our brands is strong in most markets around theworld, and the weak U.S. dollar continues to drive internationaltravelers into the United States. For our North American proper-ties, RevPAR increases in 2006 as compared to the year agoperiod were particularly strong in New York, Boston, Atlanta,Chicago, Dallas, Houston, Los Angeles and Seattle. Across theU.S., demand also strengthened in many smaller city and subur-ban markets during 2006. Internationally, RevPAR increases in2006 versus the prior year were particularly strong in China,Mexico, Australia, the United Kingdom, the Middle East, theNetherlands, France and Germany.
Our brands are strong as a result of superior customer servicewith an emphasis on guest satisfaction, the worldwide presenceand quality of our brands, our Marriott Rewards loyalty program,an information-rich and easy-to-use web site, a multi-channelcentral reservations system and desired property amenitiesincluding meeting and banquet facilities, fitness centers, spas,award-winning restaurants and high-speed and wireless Internetaccess.We, along with owners and franchisees, continue to investin our brands by means of both new and renovated properties,new room and public space designs, enhanced amenities andtechnology offerings.
See the “Risk Factors,” section of this report for importantinformation regarding forward-looking statements made in thisreport and risks and uncertainties that the Company faces.
CONSOLIDATED RESULTS
The following discussion presents an analysis of results of ouroperations for 2006, 2005 and 2004.
Continuing Operations
Revenues2006 COMPARED TO 2005Revenues increased 5 percent to $12,160 million in 2006 from$11,550 million in 2005, as a result of stronger demand for hotelrooms worldwide, partially offset by a decline in revenue associ-ated with our synthetic fuel operation. Base management andfranchise fees increased $117 million as a result of strongerRevPAR and unit growth. In 2006, we recognized $5 million ofbase management fees that were calculated based on priorperiod results, but not earned and due until 2006. Incentivemanagement fees improved $80 million due to stronger RevPARand property-level margin improvements associated with roomrate increases and productivity improvements. Incentive feesinclude $10 million and $14 million for 2006 and 2005, respec-tively, that were calculated based on prior period earnings butnot earned and due until the periods in which they were recog-nized. Stronger catering, food and beverage, spa, and other prof-its also drove property-level margins higher. Year-over-yearRevPAR increases were driven primarily by rate increases. Ownedand leased revenue increased significantly, primarily as a resultof our purchase, early in the second half of 2005, of 13 formerlymanaged properties from CTF Holdings Ltd. (“CTF”). See Foot-note No. 8,“Acquisitions and Dispositions,” later in this report fora detailed description of the CTF transaction. As planned, eightof the CTF properties were sold during 2006: one property wassold in the 2006 first quarter; five properties were sold in the2006 second quarter; and two properties were sold in the 2006third quarter.
Timeshare sales and services revenue increased $90 million(6 percent) over the prior year. The increase largely reflects $77 million of revenue in 2006 from note securitization gains. Asdetailed later in the “Cumulative Effect of Change in AccountingPrinciple” narrative, note securitization gains of $69 million for2005 are not reflected in revenue, but instead are a componentof gains and other income. Additionally, financing and servicesrevenue increased in 2006 versus the prior year, as did villarental revenue. Partially offsetting these increases, developmentrevenue declined due to projects in the early stages of develop-ment that did not reach revenue recognition thresholds and lim-ited available inventory associated with projects that sold out orwere nearing sell-out. As compared to 2005, synthetic fuel rev-enue was significantly lower in 2006, primarily due to the sus-pensions of production in 2006 as a result of high oil prices.Synthetic fuel production resumed in the fourth quarter of 2006.
The 5 percent increase in total revenue includes $404 millionof increased cost reimbursements revenue, to $8,075 million in2006 from $7,671 million in the prior year.This revenue representsreimbursements of costs incurred on behalf of managed and fran-chised properties and relates, predominantly, to payroll costs atmanaged properties where we are the employer. As we recordcost reimbursements based upon the costs incurred with noadded mark-up, this revenue and related expense have no impacton either our operating income or net income.The increase in
M A R R I O T T I N T E R N A T I O N A L , I N C . 2 0 0 6 | 15
Management’s Discussion and Analysis of Financial Condition and Results of Operations

reimbursed costs is primarily attributable to the growth in thenumber of properties we manage and to wage increases.Weadded 13 managed properties (4,126 rooms), net, and 77 fran-chised properties (11,286 rooms), net, to our system in 2006.
2005 COMPARED TO 2004Revenues increased 14 percent to $11,550 million in 2005 from$10,099 million in 2004, as a result of strong demand for hotelrooms worldwide.Year-over-year RevPAR increases were drivenprimarily by rate increases and to a lesser extent by occupancyimprovement. The increase in revenue versus the prior year alsoreflects recognition in 2005 of $14 million of incentive fees thatwere calculated based on prior period results, but not earned anddue until 2005. Higher timeshare sales and services revenuereflecting higher financially reportable development revenuealso improved our 2005 revenues. In addition, revenues increaseddue to the consolidation of our synthetic fuel operations fromthe start of the 2004 second quarter, which resulted in the recog-nition of revenue for all of 2005 versus only three quarters in2004, as we accounted for the synthetic fuel operations using theequity method of accounting in the 2004 first quarter. Further,owned and leased revenue increased significantly, primarily as aresult of the purchase of 13 formerly managed CTF properties.
The 14 percent increase in total revenue includes $743 millionof increased cost reimbursements revenue, to $7,671 million in2005 from $6,928 million in the prior year.The increase in reim-bursed costs is primarily attributable to the growth in the numberof properties we manage and wage increases.We added 45 man-aged properties (4,519 rooms), net, to our system in 2005 (includ-ing the Whitbread properties more fully discussed later in thisreport under the caption “Marriott and Whitbread Joint Venture” inthe “Liquidity and Capital Resources”section), and we also added49 franchised properties (6,333 rooms), net, to our system in 2005.
Operating Income2006 COMPARED TO 2005Operating income increased $456 million to $1,011 million in2006 from $555 million in the prior year. The increase in 2006 is,in part, due to a combined base, franchise and incentive feeincrease of $197 million, reflecting stronger RevPAR growth, unitgrowth and property-level margin improvements. Strongerowned, leased, corporate housing and other revenue net ofdirect expenses contributed $17 million of the improvement inoperating income and reflected the strong demand environ-ment in 2006 and the impact of the CTF properties acquired in2005. The $17 million improvement in 2006 versus the prior yearreflects increased owned and leased results of $20 million, a $12 million increase in termination fees received and $5 millionof higher other income, partially offset by $20 million of lowerland lease income. Also reflected in the year-over-year change inowned and leased results are depreciation charges totaling $7 million recorded in 2006 associated with two properties thatwere reclassified in 2006 from “held for sale” to “held and used.”The depreciation charges totaling $7 million represented theamount that would have been recognized had the two proper-ties been continuously classified as “held and used.”
Timeshare sales and services revenue net of direct expensesincreased $98 million in 2006 and largely reflects $77 million ofrevenue in 2006 from note securitization gains. As noted earlier inthe “Revenue” discussion, note securitization gains of $69 millionfor 2005 are not reflected in revenue, but instead are a compo-nent of gains and other income. Also reflected in the $98 millionfavorable variance, development revenue net of expensesincreased $14 million and financing, services and other revenue
net of expenses increased $7 million. Increased development rev-enue net of expenses primarily reflects lower developmentexpenses associated with projects in 2006 in the early stages ofdevelopment that did not reach revenue recognition thresholdsand the timing of expenses associated with Statement of Position04-2,“Accounting for Real Estate Time-Sharing Transactions”(“SOP 04-2”), implemented in 2006. Increased financing, servicesand other revenue net of expenses reflects a $15 million reversalof marketing related contingency reserves in 2006.
As compared to the year-ago period, general, administrativeand other expenses decreased by $76 million. In 2005, weincurred general, administrative and other expenses of $94 mil-lion primarily due to the non-cash write-off of deferred contractacquisition costs associated with the termination of manage-ment agreements resulting from the CTF transaction. We alsoincurred general, administrative and other expenses of $30 mil-lion in 2005 associated with our bedding incentive program. Weimplemented the bedding incentive program in the 2005 sec-ond quarter to help ensure that guests could enjoy the comfortand luxury of our new bedding by year-end 2005. Furtherimpacting general, administrative and other expenses, 2005reflected performance cure payments of $15 million versus a $6 million similar payment in 2006, and 2005 also reflected $9 million of guarantee charges associated with three propertiesversus the reversal of an additional $5 million of guaranteecharges in 2006. Additionally impacting the year-over-year gen-eral, administrative and other expenses variance were foreignexchange gains totaling $6 million in 2006 as compared tolosses of $5 million in 2005.
Also impacting the year-over-year change in general,administrative and other expenses, development expenses and deferred compensation expenses were higher in 2006 by$15 million and $5 million, respectively. As noted under theheading “New Accounting Standards,” later in this report, weadopted a new accounting standard in 2006 associated withshare-based compensation. This new standard resulted in incre-mental general, administrative and other expenses of $39 mil-lion versus 2005, primarily impacting the unallocated portion ofour general, administrative and other expenses. Of the $76 mil-lion decrease in total general, administrative and otherexpenses, a decrease of $124 million was attributable to ourLodging segments and a $48 million increase was unallocated.
Finally, operating income for 2006 included a synthetic fueloperating loss of $76 million versus an operating loss of $144 mil-lion in the prior year, primarily reflecting production suspensionsin 2006 due to high oil prices. For additional information, see our“Synthetic Fuel” segment discussion later in this report.
2005 COMPARED TO 2004Operating income increased $78 million to $555 million in 2005from $477 million in the prior year, primarily as a result of thefollowing items: a combined base, incentive and franchise feeimprovement of $154 million reflecting a stronger demand envi-ronment; $51 million of stronger timeshare sales and servicesrevenue net of direct expenses reflecting higher financiallyreportable development revenue; and $65 million of strongerowned, leased, corporate housing and other revenue net of directexpenses. The fee improvement versus the prior year also reflectsthe recognition in 2005 of $14 million of incentive fees that werecalculated based on prior period results, but not earned and dueuntil 2005. The increase in owned, leased, corporate housing andother revenue net of direct expenses is primarily attributable toproperties acquired in 2005, including the CTF properties, and toa lesser extent the strong demand environment in 2005, and our
16 | M A R R I O T T I N T E R N A T I O N A L , I N C . 2 0 0 6

receipt in 2005, of a $10 million termination fee associated withone property that left our system.
The favorable items noted above were also partially offset by$146 million of increased general and administrative expensesand $46 million of lower synthetic fuel revenue net of syntheticfuel expenses. Increased general, administrative and otherexpenses were associated with our Lodging segments as unallo-cated general, administrative and other expenses were downslightly compared to the prior year. The increase in general,administrative and other expenses reflects a $94 million chargeimpacting our North American Full-Service and InternationalLodging segments, primarily due to the non-cash write-off ofdeferred contract acquisition costs associated with the termina-tion of management agreements associated with our acquisitionof the CTF properties, and $30 million of expenses associatedwith our bedding incentive program, impacting our NorthAmerican Full-Service, North American Limited-Service andInternational Lodging segments. General, administrative andother expenses in 2005 also reflect pre-tax performance termi-nation cure payments of $15 million associated with two proper-ties, a $9 million pre-tax charge associated with threeguarantees, increased other net overhead costs of $13 millionincluding costs related to the Company’s unit growth, develop-ment and systems, and $2 million of increased foreign exchangelosses partially offset by $5 million of lower litigation expenses.Additionally, in 2004, general, administrative and other expensesincluded a $13 million charge associated with the write-off ofdeferred contract acquisition costs.
Operating income for 2005 included a synthetic fuel operatingloss of $144 million versus a $98 million operating loss in the prioryear, reflecting increased costs and the consolidation of our syn-thetic fuel operations from the start of the 2004 second quarter,which resulted in the recognition of revenue and expenses for allof 2005 versus only three quarters in 2004, as we accounted forthe synthetic fuel operations using the equity method of account-ing in the 2004 first quarter. For additional information, see our“Synthetic Fuel” segment discussion later in this report.
Gains and Other IncomeThe following table shows our gains and other income for 2006,2005 and 2004.
($ in millions) 2006 2005 2004
Timeshare segment note sale gains $ — $ 69 $ 64
Synthetic fuel earn-out payments (made) received, net (15) 32 28
Loss on expected land sale (37) — —
Gains on sales of real estate and other 26 34 48
Other note sale/repayment gains 2 25 5
Gains on sale/income on redemption of joint venture investments 68 7 19
Income from cost method joint ventures 15 14 —
$ 59 $181 $164
Gains on sale/income on redemption of joint venture invest-ments of $68 million in 2006 represents $43 million of net gainsassociated with the sale of joint venture investments and $25 mil-lion of income associated with the redemption of preferredstock we held in one investee. As further explained in the earlier“Revenues” discussion for 2006, Timeshare segment note salegains of $77 million in 2006 are presented in the “Timesharesales and services” revenue caption.
Interest Expense2006 COMPARED TO 2005Interest expense increased $18 million (17 percent) to $124 mil-lion in 2006 from $106 million in 2005. Included within interestexpense for 2006 are charges totaling $46 million relating tointerest on accumulated cash inflows, in advance of our cashoutflows for various programs that we operate on the owners’behalf, including the Marriott Rewards, Gift Certificates and Self-Insurance programs. The increase in interest on these programsover 2005 is related to higher liability balances and higher inter-est rates. Interest expense also increased in 2006, due to ourJune 2005 Series F Notes issuance, our June 2006 Series H Notesissuance, and higher commercial paper balances coupled withhigher rates. Partially offsetting these increases were interestexpense declines associated with the payoff, at maturity, of bothour Series D Notes in April 2005 and Series B Notes in November2005, and the exchange of our Series C and Series E Notes forlower interest rate Series G Notes in 2005.
2005 COMPARED TO 2004Interest expense increased $7 million (7 percent) to $106 millionin 2005 from $99 million in the prior year, reflecting increaseddebt levels, which helped to facilitate significantly higher capitalexpenditures and share repurchases in 2005. Interest expense in2005 reflected our June 2005 Series F Notes issuance and, versusthe prior year, higher commercial paper balances coupled withhigher rates. Included within interest expense for 2005 arecharges totaling $29 million relating to interest on accumulatedcash inflows, in advance of our cash outflows for various pro-grams that we operate on the owners’ behalf, including theMarriott Rewards, Gift Certificates and Self-Insurance programs.The increase over 2004 is related to higher liability balances andhigher interest rates. Partially offsetting these increases wereinterest expense declines associated with the payoff, at maturity,of both our Series D Notes in April 2005 and Series B Notes inNovember 2005, and the capitalization of more interest associ-ated with the development of timeshare properties.
Interest Income, Provision for Loan Losses, andIncome Tax2006 COMPARED TO 2005Interest income, before the provision for loan losses, decreased$34 million (43 percent) to $45 million in 2006 from $79 millionin 2005, primarily reflecting the impact of loans repaid to us in2005. Also reflected in the decrease versus the prior year are $4 million of mark-to-market expenses in 2006 associated withhedges for our synthetic fuel operations. Loan loss provisionsdecreased $31 million versus the prior year reflecting the rever-sal of loan loss provisions totaling $3 million in 2006 comparedto a charge of $17 million in 2005 due to the impairment of ourDelta Air Lines, Inc. aircraft leveraged lease, see the “Investmentin Leveraged Lease” caption later in this report for additionalinformation, and an $11 million loan loss provision in 2005 asso-ciated with one property.
Our tax provision totaled $286 million in 2006 compared toa tax provision of $94 million in 2005. The difference of $192 mil-lion is primarily attributable to $96 million of higher taxes in2006 associated with higher pre-tax income from our lodgingoperations and $96 million of lower tax credits and tax benefitin 2006 associated with our synthetic fuel operations that gen-erated a net tax benefit of $94 million in 2006 compared to anet tax benefit of $190 million in 2005. As discussed in moredetail in the “Synthetic Fuel” segment caption later in thisreport, 2006 includes a provision for an estimated 39 percent
M A R R I O T T I N T E R N A T I O N A L , I N C . 2 0 0 6 | 17

phase-out of tax credits associated with the synthetic fuel oper-ations due to high oil prices.
2005 COMPARED TO 2004Interest income, before the provision for loan losses, decreased$67 million (46 percent) to $79 million in 2005 from $146 millionin the prior year, primarily reflecting the impact of loans repaid tous. Our provision for loan losses increased $36 million versus theprior year reflecting an $11 million charge in 2005 associatedwith one property and a charge of $17 million in 2005 due to theimpairment of our Delta Air Lines, Inc. aircraft leveraged lease andthe reversal in 2004 of loan loss provisions totaling $8 million.
Our tax provision totaled $94 million in 2005 compared to atax provision of $100 million in 2004. The difference of $6 millionis primarily attributable to $19 million of higher taxes in 2005associated with higher pre-tax income from our lodging opera-tions, more than offset by $25 million of higher tax credits andtax benefit in 2005 associated with our synthetic fuel operationsthat generated a net tax benefit of $190 million in 2005 com-pared to a net tax benefit of $165 million in 2004, and to a lesserextent, to a lower tax rate before the impact of the SyntheticFuel segment in 2005, as a result of a higher proportion ofincome in countries with lower effective tax rates. For additionalinformation see the analysis of results of operations for theSynthetic Fuel segment later in this report.
Equity in Earnings (Losses)2006 COMPARED TO 2005The $33 million decline from earnings of $36 million in 2005 toearnings of $3 million in 2006, attributable to our equity invest-ments, reflected the recognition in 2005 of $30 million of equityearnings from the sale of hotels by three equity joint ventures inwhich we had equity interests. In addition, since 2005 we havesold several equity joint ventures.
2005 COMPARED TO 2004Equity in earnings (losses) of equity method investees increased$78 million from a net loss of $42 million in 2004 to net earningsof $36 million in 2005. Twenty-eight million dollars of theincrease is attributable to our synthetic fuel joint ventures thatwe reported as an equity investment in the 2004 first quarter,versus consolidation of the joint ventures for the periods there-after. For additional information see the analysis of results ofoperations for the Synthetic Fuel segment later in this report.The remaining $50 million increase from the prior year is prima-rily attributable to several joint ventures with significant assetsales in 2005, favorably impacting the profitability of the jointventures, producing higher earnings from joint ventures and, toa lesser extent, the stronger 2005 lodging demand environmentand the mix of investments in each year.
Minority Interest2006 COMPARED TO 2005Minority interest decreased $39 million in 2006 from a benefit of$45 million in 2005 to a benefit of $6 million. On the first day ofour 2006 fiscal year, we redeemed our partner’s interest inSynthetic American Fuel Enterprises II, LLC (“SAFE II”), whichowns three of our four synthetic fuel production facilities. Also,effective October 1, 2006, we purchased our partner’s interest inSynthetic American Fuel Enterprises I, LLC (“SAFE I”). Accordingly,in 2006, minority interest represents only our partner’s share ofthe losses in SAFE I, through September 30, 2006. For 2005,minority interest reflects our partner’s share of the synthetic fuel
losses for all four production facilities. In addition, synthetic fueloperating losses in 2006 were significantly lower versus 2005reflecting reduced production. For additional information, seeFootnote No. 2,“Synthetic Fuel,” later in this report.
2005 COMPARED TO 2004Minority interest increased from a benefit of $40 million in 2004to a benefit of $45 million in 2005, primarily as a result of thechange in the method of accounting for our synthetic fuel oper-ations. For 2004, minority interest reflects our partner’s share ofthe synthetic fuel losses from March 26, 2004 (when we beganconsolidating the ventures due to the adoption of FIN 46(R)),through year-end. For 2005, minority interest reflects our part-ner’s share of the synthetic fuel losses for the entire year.
Income from Continuing Operations2006 COMPARED TO 2005Compared to 2005, income from continuing operations increased$49 million (7 percent) to $717 million in 2006, and diluted earningsper share from continuing operations increased $0.21 (14 percent)to $1.66. As discussed in more detail in the preceding sectionsbeginning with “Operating Income,”the increase versus the prioryear is due to higher fee income ($197 million), lower general,administrative and other expenses ($76 million), lower syntheticfuel operating losses ($68 million), higher owned, leased, corporatehousing and other revenue net of direct expenses ($17 million), alower loan loss provision ($31 million) and higher timeshare intervalsales and services revenue net of direct expenses ($98 million).Partially offsetting these favorable variances, were significantlyhigher taxes ($192 million), lower gains and other income ($122 mil-lion), lower interest income ($34 million), higher interest expense($18 million), a lower minority interest benefit ($39 million) andlower equity investment results ($33 million).
2005 COMPARED TO 2004Income from continuing operations increased $74 million (12 percent) to $668 million in 2005 versus the prior year, anddiluted earnings per share from continuing operations increased$0.21 (17 percent) to $1.45. As discussed above in more detail,the increase in income from continuing operations from theprior year is primarily due to the strong demand environmentfor lodging, increased owned, leased and corporate housing andother revenue net of direct expenses ($65 million), principallyreflecting owned and leased properties acquired in the 2005third quarter, increased timeshare sales and services revenue netof direct expenses ($51 million), stronger equity investmentresults ($78 million), higher gains and other income ($17 million)and lower taxes ($6 million). As discussed earlier in the report inmore detail, increased general, administrative and otherexpenses ($146 million) reflected, among other things, the write-off of deferred contract acquisition costs in connection with theCTF transaction and expenses associated with our beddingincentive program, higher synthetic fuel operating losses ($46 million), lower interest income ($67 million), higher interestexpense ($7 million) and a higher loan loss provision ($36 mil-lion) partially offset these favorable items.
Cumulative Effect of Change in Accounting Principle2006Statement of Position 04-2,“Accounting for Real Estate Time-Sharing Transactions”In December 2004, the Financial Accounting Standards Board(“FASB”) issued Financial Accounting Standards (“FAS”) No. 152,
18 | M A R R I O T T I N T E R N A T I O N A L , I N C . 2 0 0 6

“Accounting for Real Estate Time-Sharing Transactions-anamendment of FASB Statements No. 66 and 67,” and theAmerican Institute of Certified Public Accountants issued SOP04-2. Additionally, the FASB amended FAS No. 66,“Accounting forSales of Real Estate,” and FAS No. 67,“Accounting for Costs andInitial Rental Operations of Real Estate Projects,” to excludeaccounting for real estate time-sharing transactions from thesestatements. We adopted SOP 04-2 at the beginning of the 2006first quarter.
Under SOP 04-2, we charge the majority of sales and market-ing costs we incur to sell timeshares to expense when incurred.We also record an estimate of expected uncollectibility on notesreceivable that we receive from timeshare purchasers as a reduc-tion in revenue at the time that we recognize profit on a time-share sale. We also account for rental and other operationsduring holding periods as incidental operations, which requiresus to record any excess of revenues over costs as a reduction ofinventory costs.
The initial adoption of SOP 04-2 in our 2006 first quarter,which we reported as a cumulative effect of change in account-ing principle in our Consolidated Statement of Income, resultedin a non-cash after-tax charge of $105 million ($0.24 per dilutedshare). As a result of tax rate adjustments in the 2006 fourthquarter, we reduced the tax benefit associated with the initialadoption from $68 million to $64 million. Accordingly, the after-tax impact of the adoption was $109 million ($0.25 per dilutedshare). As a result of the change,“Net Income” of $65 million($0.15 per diluted share) as reported in the 2006 first quarter,now totals $61 million ($0.14 per diluted share). The pre-taxcharge totaled $173 million and comprised a $130 million inven-tory write-down, the establishment of a $25 million notes receiv-able reserve and an increase in current liabilities of $18 million.We estimate that the ongoing impact of adoption in subsequentperiods will be immaterial.
The American Resort Development Association, a timesharetrade association of which we are a member, and the Staff of theUnited States Securities and Exchange Commission had commu-nications regarding SOP 04-2 and the income statement presen-tation of timeshare note securitizations gains. As a result ofthose communications, we reclassified in our 2006 third quarter,in our Consolidated Statement of Income, Timeshare segmentnote securitization gains of $40 million recognized in the 2006second quarter from the “Gains and other income” caption tothe “Timeshare sales and services” revenue caption. As a result ofthe change,“Timeshare sales and services” revenue of $331 mil-lion as reported in the 2006 second quarter, now totals $371 mil-lion, and “Gains and other income” of $48 million as reported inthe 2006 second quarter, now totals $8 million. Including $37 million of Timeshare segment note securitization gains rec-ognized in the 2006 fourth quarter, full-year 2006 note securiti-zation gains totaling $77 million are reflected within our“Timeshare sales and services” revenue caption.
We estimate that, for the 20-year period from 2007 through2026, the cost of completing improvements and currentlyplanned amenities for our owned timeshare properties will beapproximately $1.9 billion.
Business SegmentsWe are a diversified hospitality company with operations in sixbusiness segments:
3 North American Full-Service Lodging, which includes theMarriott Hotels & Resorts, JW Marriott Hotels & Resorts,Marriott Conference Centers, Renaissance Hotels &
Resorts, and Renaissance ClubSport brands located in thecontinental United States and Canada;
3 North American Limited-Service Lodging, which includesthe Courtyard, Fairfield Inn, SpringHill Suites, ResidenceInn, TownePlace Suites and Marriott ExecuStay brandslocated in the continental United States and Canada;
3 International Lodging, which includes the Marriott Hotels& Resorts, JW Marriott Hotels & Resorts, RenaissanceHotels & Resorts, Courtyard, Fairfield Inn, Residence Inn,Ramada International and Marriott Executive Apartmentsbrands located outside the continental United States and Canada;
3 Luxury Lodging, which includes The Ritz-Carlton andBulgari Hotels & Resorts brands worldwide;
3 Timeshare, which includes the development, marketing,operation and sale of timeshare, fractional and wholeownership properties under the Marriott Vacation Club,The Ritz-Carlton Club, Grand Residences by Marriott andHorizons by Marriott Vacation Club brands worldwide; and
3 Synthetic Fuel, which includes our interest in the opera-tion of coal-based synthetic fuel production facilities.
In 2006, the company analyzed its internal reporting processand implemented changes in the fourth quarter that weredesigned to improve efficiency. As part of this process, we evalu-ated the impact on segment reporting and made certainchanges that were in accordance with U.S. generally acceptedaccounting principles. These reporting changes are in conform-ity with the requirements of FAS No. 131,“Disclosures aboutSegments of an Enterprise and Related Information,” (“FAS No.131”) and will better enable investors to view the Company theway management views it. Accordingly, we now report six oper-ating segments as compared to five before the change and indi-rect administrative expenses are no longer allocated to oursegments. Senior management allocates resources and assessesperformance based on the six operating segments. The revisedsegment reporting is reflected throughout this report for allperiods presented. Historical figures are presented in a mannerthat is consistent with the revised segment reporting.
We evaluate the performance of our segments based prima-rily on the results of the segment without allocating corporateexpenses, interest expense or indirect general, administrativeand other expenses. With the exception of the Synthetic Fuelsegment, we do not allocate income taxes or interest income toour segments. As note sales are an integral part of the Timesharesegment, we include note sale gains in our Timeshare segmentresults, and we allocate other gains and losses as well as equityearnings or losses from our joint ventures and divisional general,administrative and other expenses to each of our segments.“Other unallocated corporate” represents that portion of our rev-enues, general, administrative and other expenses, equity inearnings or losses, and other gains or losses that are not alloca-ble to our segments.
We have aggregated the brands presented within our NorthAmerican Full-Service, North American Limited-Service, Inter-national and Luxury segments considering their similar economiccharacteristics, types of customers, distribution channels, theregulatory business environment of the brands and operationswithin each segment and our organizational structure and man-agement reporting structure.
M A R R I O T T I N T E R N A T I O N A L , I N C . 2 0 0 6 | 19

At year-end 2006, we operated or franchised the followingproperties by segment (excluding 2,046 corporate housingrental units):
Total Lodging ProductsSegment/Brand (1) Properties Rooms
North American Full-Service Lodging Segment
Marriott Hotels & Resorts 320 126,494Marriott Conference Centers 13 3,476JW Marriott Hotels & Resorts 14 7,563Renaissance Hotels & Resorts 67 25,882Renaissance ClubSport 1 175
415 163,590North American Limited-Service Lodging Segment
Courtyard 665 93,948Fairfield Inn 517 46,486SpringHill Suites 153 17,808Residence Inn 510 61,210TownePlace Suites 123 12,368
1,968 231,820International Lodging Segment
Marriott Hotels & Resorts 150 41,889JW Marriott Hotels & Resorts 22 7,982Renaissance Hotels & Resorts 68 22,169Courtyard 68 11,578Fairfield Inn 1 103Residence Inn 1 76Marriott Executive Apartments 18 3,027Ramada International 2 332
330 87,156Luxury Lodging Segment
The Ritz-Carlton-North America 34 11,068The Ritz-Carlton-International 26 8,338Bulgari Hotels & Resorts-International 2 117
62 19,523Timeshare Segment (2)
Marriott Vacation Club 45 10,512The Ritz-Carlton Club 7 546Grand Residences by Marriott 3 313Horizons by Marriott Vacation Club 2 372
57 11,743
Total 2,832 513,832
(1) North America includes brands located in the continental United States andCanada. International includes brands located outside the United States and Canada.(2) Includes resorts that are in active sales as well as those that are sold out. Products inactive sales may not be ready for occupancy.
Revenues
($ in millions) 2006 2005 2004
North American Full-Service Segment $ 5,196 $ 5,116 $ 4,691
North American Limited-Service Segment 2,060 1,886 1,673
International Segment 1,411 1,017 604
Luxury Segment 1,423 1,333 1,263
Timeshare Segment 1,840 1,721 1,502
Total Lodging 11,930 11,073 9,733
Other unallocated corporate 65 56 45
Synthetic Fuel Segment 165 421 321
$12,160 $11,550 $10,099
Income from Continuing Operations
($ in millions) 2006 2005 2004
North American Full-Service Segment $ 455 $ 349 $ 337
North American Limited-Service Segment 380 303 233
International Segment 237 133 109
Luxury Segment 63 45 35
Timeshare Segment 280 271 203
Total Lodging financial results 1,415 1,101 917
Other unallocated corporate (251) (219) (220)
Synthetic Fuel Segment (after-tax) 5 125 107
Interest income, provision for loan losses and interest expense (excluding the Synthetic Fuel Segment) (72) (55) 55
Income taxes (excluding the Synthetic Fuel Segment) (380) (284) (265)
$ 717 $ 668 $ 594
Equity in Earnings (Losses) of Equity Method Investees
($ in millions) 2006 2005 2004
North American Full-Service Segment $ 2 $21 $ 8
North American Limited-Service Segment — (6) (17)
International Segment — 20 5
Luxury Segment (2) (1) (3)
Timeshare Segment (2) 1 (7)
Total Lodging (2) 35 (14)
Other unallocated corporate 5 1 —
Synthetic Fuel Segment — — (28)
$ 3 $36 $(42)
Marriott LodgingLodging includes our North American Full-Service, NorthAmerican Limited-Service, International, Luxury and Timesharesegments. We consider Lodging revenues and Lodging financialresults to be meaningful indicators of our performance becausethey measure our growth in profitability as a lodging companyand enable investors to compare the sales and results of ourlodging operations to those of other lodging companies.
2006 COMPARED TO 2005We added 136 properties (23,466 rooms) and 45 properties(8,616 rooms) left the system in 2006. Most of the propertiesthat left the system were limited-service properties.
Lodging financial results increased $314 million to $1,415 mil-lion in 2006 from $1,101 million in 2005, and revenues increased$857 million to $11,930 million in 2006, an 8 percent increasefrom revenues of $11,073 million in 2005. The results as com-pared to the prior year reflect a $197 million (19 percent)increase in combined base, franchise and incentive fees from$1,027 million in 2005 to $1,224 million in 2006, $124 million of lower general, administrative and other expenses, $8 millionof higher owned, leased, corporate housing and other revenuenet of direct expenses and $98 million of higher timeshare salesand services revenue net of direct expenses, partially offset by$78 million of lower gains and other income and a $37 milliondecline in earnings associated with equity investments. HigherRevPAR for comparable rooms, resulting from both domesticand international rate increases, higher property-level food and
20 | M A R R I O T T I N T E R N A T I O N A L , I N C . 2 0 0 6

beverage and other revenue, and new unit growth drove theincrease in base and franchise fees. In 2006, we recognized $5 mil-lion of base management fees that were calculated based onprior period results, but not earned and due until 2006. Incentivemanagement fees increased $80 million (40 percent) during2006, reflecting the impact of strong room rate improvementand property-level margin improvements. Incentive fees include$10 million and $14 million for 2006 and 2005, respectively, thatwere calculated based on prior period earnings, but not earnedand due until the periods in which they were recognized. In2006, 62 percent of our managed properties paid incentive feesto us versus 51 percent in 2005.
Systemwide RevPAR, which includes data from our franchisedproperties, in addition to our owned, leased and managed prop-erties, for comparable North American properties increased 9.1 percent over 2005, and RevPAR for our comparable NorthAmerican company-operated properties increased 8.9 percent.North American company-operated house profit marginsimproved 240 basis points versus 2005. Systemwide RevPAR forcomparable international properties, increased 10.5 percent andRevPAR for comparable international company-operated proper-ties increased 11.1 percent. Worldwide RevPAR for comparablesystemwide properties increased 9.4 percent while worldwideRevPAR for comparable company-operated properties increased9.5 percent. In addition, worldwide comparable company-operated house profit margins increased 230 basis points.
2005 COMPARED TO 2004We added 134 properties (21,611 rooms) and 25 properties(4,755 rooms) left the system in 2005. Most of the propertiesthat left the system were Fairfield Inn properties.
Lodging financial results increased $184 million to $1,101 mil-lion in 2005 from $917 million in 2004, and revenues increased$1,340 million to $11,073 million in 2005, a 14 percent increasefrom revenues of $9,733 million in 2004. The results as comparedto the prior year reflect a $154 million (18 percent) increase inbase, franchise and incentive fees from $873 million in 2004 to$1,027 million in 2005, $54 million of higher owned, leased andother revenue net of expenses, an increase of $51 million intimeshare sales and services revenue net of expenses, $49 mil-lion of increased equity results, and increased gains and otherincome of $12 million, partially offset by $134 million of highergeneral, administrative and other expenses. The increase in baseand franchise fees was driven by higher RevPAR for comparablerooms, primarily resulting from both domestic and internationalrate increases and new unit growth. Incentive management feesincreased $59 million (42 percent) in 2005 versus the prior year,reflecting the impact of increased travel worldwide, drivingstrong property-level profits. The increase also reflects recogni-tion in 2005 of $14 million of incentive fees that were calculatedbased on prior period results, but not earned and due until 2005.In 2005, 51 percent of our managed properties paid incentivefees to us versus 32 percent in 2004.
Systemwide RevPAR for comparable North American proper-ties increased 9.5 percent, and RevPAR for our comparable NorthAmerican company-operated properties increased 9.8 percent.Systemwide RevPAR for comparable international properties,increased 11.9 percent and RevPAR for comparable internationalcompany-operated properties increased 11.3 percent. World-wide RevPAR for comparable company-operated propertiesincreased 10.1 percent while worldwide RevPAR for comparablesystemwide properties increased 9.9 percent. In addition, world-wide comparable company-operated house profit marginsincreased 180 basis points.
Lodging DevelopmentWe opened 136 properties totaling 23,466 rooms, across ourbrands in 2006, and 45 properties (8,616 rooms) left the system.Highlights of the year included:
3 We converted 30 properties (6,869 rooms), or 29 percentof our gross room additions for the year, from otherbrands, and 27 percent of the rooms were located in inter-national markets;
3 We opened over 28 percent of the new rooms outside theUnited States;
3 We added 91 properties (11,281 rooms) to our Limited-Service brands; and
3 We opened our second Bulgari Hotels & Resorts brandproperty in Bali, Indonesia in September 2006.
We currently have approximately 100,000 rooms under con-struction, awaiting conversion, or approved for development inour pipeline, and we expect to add approximately 30,000 hotelrooms and timeshare units to our system in 2007. We believe thatwe have access to sufficient financial resources to finance ourgrowth, as well as to support our ongoing operations and meetdebt service and other cash requirements. Nonetheless, our abil-ity to sell properties that we develop and the ability of hoteldevelopers to build or acquire new Marriott-branded properties,both of which are important parts of our growth plan, depend inpart on capital access, availability and cost for other hotel devel-opers and third-party owners. These growth plans are subject tonumerous risks and uncertainties, many of which are outside ofour control. See the “Forward-Looking Statements” and “Risks andUncertainties” captions earlier in this report and the “Liquidityand Capital Resources” caption later in this report.
RevPARThe following tables show occupancy, average daily rate andRevPAR for comparable properties, for each of the brands in ourNorth American Full-Service and North American Limited-Servicesegments, for our International segment by region and the principalbrand in our Luxury Segment,The Ritz-Carlton.We have not pre-sented statistics for company-operated Fairfield Inn properties inthese tables because we operate only a limited number of proper-ties, as the brand is predominantly franchised and such informationwould not be meaningful (identified as “nm” in the tables that fol-low). Systemwide statistics include data from our franchised prop-erties, in addition to our owned, leased and managed properties.
The occupancy, average daily rate and RevPAR statistics used throughout this report for 2006 include the period fromDecember 31, 2005 through December 29, 2006, the statistics for 2005 include the period from January 1, 2005 throughDecember 30, 2005, and the statistics for 2004 include theperiod from January 3, 2004 through December 31, 2004 (exceptin each case, for The Ritz-Carlton brand properties and proper-ties located outside of the United Statesand Canada, which for them includesthe period from January 1 throughDecember 31 for each year).
The adjacent graph shows RevPAR forNorth American Comparable Company-Operated “Composite North American”properties (which includes our MarriottHotels & Resorts, Renaissance Hotels &Resorts,The Ritz-Carlton, Courtyard,Residence Inn,TownePlace Suites,Fairfield Inn and SpringHill Suitesbrands) for the last five fiscal years:
M A R R I O T T I N T E R N A T I O N A L , I N C . 2 0 0 6 | 21
20062005200420032002
RevPAR
$95.
04
$85.
85
$103
.29
$110
.74
$86.
47

Comparable Company- ComparableOperated North Systemwide North
American Properties(1) American Properties(1)
2006 Change vs. 2005 2006 Change vs. 2005
MARRIOTT HOTELS & RESORTS (2)
Occupancy 72.3% –0.6% pts. 70.9% 0.2% pts.Average Daily Rate $168.11 9.1% $154.37 8.3%RevPAR $121.58 8.3% $109.48 8.6%
RENAISSANCE HOTELS & RESORTS
Occupancy 72.8% 0.6% pts. 72.2% 1.1% pts.Average Daily Rate $162.96 8.7% $151.91 8.4%RevPAR $118.57 9.6% $109.75 10.0%
COMPOSITE NORTH AMERICAN FULL-SERVICE (3)
Occupancy 72.4% –0.4% pts. 71.1% 0.3% pts.Average Daily Rate $167.27 9.0% $153.99 8.3%RevPAR $121.10 8.5% $109.52 8.9%
THE RITZ-CARLTON NORTH AMERICA
Occupancy 72.9% 2.1% pts. 72.9% 2.1% pts.Average Daily Rate $307.20 7.1% $307.20 7.1%RevPAR $223.88 10.3% $223.88 10.3%
COMPOSITE NORTH AMERICAN FULL-SERVICE AND LUXURY (4)
Occupancy 72.4% –0.1% pts. 71.2% 0.5% pts.Average Daily Rate $180.17 8.9% $163.03 8.3%RevPAR $130.52 8.7% $116.11 9.0%
RESIDENCE INN
Occupancy 78.3% –1.8% pts. 79.2% –0.5% pts.Average Daily Rate $117.99 9.2% $113.85 8.2%RevPAR $ 92.35 6.8% $ 90.15 7.6%
COURTYARD
Occupancy 70.9% –0.4% pts. 72.5% 0.1% pts.Average Daily Rate $119.30 10.9% $116.67 9.5%RevPAR $ 84.62 10.3% $ 84.57 9.7%
FAIRFIELD INN
Occupancy nm nm 70.7% 1.0% pts.Average Daily Rate nm nm $ 82.05 9.1%RevPAR nm nm $ 58.01 10.6%
TOWNEPLACE SUITES
Occupancy 75.3% –0.3% pts. 75.7% –0.2% pts.Average Daily Rate $ 78.68 10.9% $ 79.69 10.2%RevPAR $ 59.28 10.4% $ 60.35 9.9%
SPRINGHILL SUITES
Occupancy 72.3% –2.0% pts. 74.1% 0.2% pts.Average Daily Rate $102.86 10.7% $ 98.76 9.8%RevPAR $ 74.42 7.8% $ 73.16 10.0%
COMPOSITE NORTH AMERICAN LIMITED-SERVICE (5)
Occupancy 73.3% –0.8% pts. 74.2% 0.1% pts.Average Daily Rate $115.24 10.4% $105.65 9.0%RevPAR $ 84.41 9.1% $ 78.34 9.2%
COMPOSITE NORTH AMERICAN (6)
Occupancy 72.8% –0.4% pts. 73.0% 0.3% pts.Average Daily Rate $152.14 9.5% $128.07 8.7%RevPAR $110.74 8.9% $ 93.47 9.1%
(1) Statistics are for the fifty-two weeks ended December 29, 2006, and December 30, 2005,except for The Ritz-Carlton brand for which the statistics are for the twelve monthsended December 31, 2006 and December 31, 2005. For properties located in Canadathe comparison to 2005 is on a constant dollar basis.
(2) Marriott Hotels & Resorts includes our JW Marriott Hotels & Resorts brand.(3) Composite North American Full-Service statistics include properties located in the con-
tinental United States and Canada for the Marriott Hotels & Resorts and RenaissanceHotels & Resorts brands.
(4) Composite North American Full-Service and Luxury includes the Marriott Hotels &Resorts, Renaissance Hotels & Resorts and The Ritz-Carlton brands.
(5) Composite North American Limited-Service statistics include properties located in thecontinental United States and Canada for the Courtyard, SpringHill Suites, Fairfield Inn,Residence Inn and TownePlace Suites brands.
(6) Composite North American statistics include properties located in the continentalUnited States and Canada for the Marriott Hotels & Resorts, Renaissance Hotels &Resorts, Residence Inn, Courtyard, Fairfield Inn, TownePlace Suites, SpringHill Suites,and The Ritz-Carlton brands.
Comparable Company- Comparable Operated Properties(1) Systemwide Properties(1)
2006 Change vs. 2005 2006 Change vs. 2005
CARIBBEAN AND LATIN AMERICA (2)
Occupancy 74.9% 1.5% pts. 73.0% 0.5% pts.Average Daily Rate $159.93 9.7% $150.93 9.2%RevPAR $119.81 12.0% $110.11 9.9%
CONTINENTAL EUROPE (2)
Occupancy 72.6% 2.0% pts. 70.7% 1.9% pts.Average Daily Rate $147.28 6.6% $150.58 7.2%RevPAR $106.95 9.6% $106.53 10.2%
UNITED KINGDOM (2)
Occupancy 79.6% 3.5% pts. 75.1% 3.1% pts.Average Daily Rate $225.38 9.5% $204.99 8.6%RevPAR $179.44 14.6% $153.94 13.3%
MIDDLE EAST AND AFRICA (2)
Occupancy 68.9% –0.3% pts. 69.0% –0.7% pts.Average Daily Rate $143.12 11.0% $134.95 11.5%RevPAR $ 98.58 10.5% $ 93.05 10.3%
ASIA PACIFIC (2), (3)
Occupancy 75.8% 1.0% pts. 76.2% 0.9% pts.Average Daily Rate $127.09 11.3% $129.26 9.8%RevPAR $ 96.28 12.7% $ 98.46 11.2%
REGIONAL COMPOSITE (4), (5)
Occupancy 74.6% 1.3% pts. 73.6% 1.1% pts.Average Daily Rate $148.13 9.5% $147.12 9.0%RevPAR $110.53 11.4% $108.32 10.7%
THE RITZ-CARLTON INTERNATIONAL
Occupancy 71.7% –0.1% pts. 71.7% –0.1% pts.Average Daily Rate $241.90 9.2% $241.90 9.2%RevPAR $173.35 9.1% $173.55 9.1%
TOTAL INTERNATIONAL (6)
Occupancy 74.4% 1.2% pts. 73.5% 1.0% pts.Average Daily Rate $153.99 9.4% $152.02 9.0%RevPAR $114.61 11.1% $111.78 10.5%
(1) Financial results for all properties are reported on a period-end basis, while statistics forproperties located outside the continental United States and Canada are reported on amonth-end basis. The statistics are for January through December. For the propertieslocated in countries that use currencies other than the U.S. dollar, the comparison to2005 is on a constant dollar basis.
(2) Regional information includes the Marriott Hotels & Resorts, Renaissance Hotels & Resortsand Courtyard brands located outside of the continental United States and Canada.
(3) Excludes Hawaii.(4) Includes Hawaii.(5) Regional Composite statistics include all properties located outside of the continental
United States and Canada for the Marriott Hotels & Resorts, Renaissance Hotels &Resorts, and Courtyard brands.
(6) Total International includes Regional Composite statistics and statistics for The Ritz-Carlton International and Bulgari Hotels & Resorts brands.
Comparable Company- Comparable Operated Properties(1) Systemwide Properties(1)
2006 Change vs. 2005 2006 Change vs. 2005
COMPOSITE LUXURY (2)
Occupancy 72.5% 1.4% pts. 72.5% 1.4% pts.Average Daily Rate $289.50 7.5% $289.50 7.5%RevPAR $209.88 9.7% $209.88 9.7%
TOTAL WORLDWIDE (3)
Occupancy 73.2% –% pts. 73.1% 0.4% pts.Average Daily Rate $152.63 9.5% $131.92 8.8%RevPAR $111.75 9.5% $ 96.39 9.4%
(1) Financial results for all properties are reported on a period-end basis, while statistics forproperties located outside the continental United States and Canada are reported on amonth-end basis. For the properties located in countries that use currencies other thanthe U.S. dollar, the comparison to 2005 is on a constant dollar basis.
(2) Composite Luxury includes worldwide properties for The Ritz-Carlton and BulgariHotels & Resorts brands.
(3) Total Worldwide statistics include all properties worldwide for the Marriott Hotels &Resorts, Renaissance Hotels & Resorts, Residence Inn, Courtyard, Fairfield Inn,TownePlace Suites, SpringHill Suites, and The Ritz-Carlton brands. Statistics for proper-ties located in the continental United States and Canada (except for The Ritz-Carltonbrand) represent the fifty-two weeks ended December 29, 2006, and December 30,2005. Statistics for all The Ritz-Carlton brand properties and properties located outsideof the continental United States and Canada represent the twelve months endedDecember 31, 2006 and December 31, 2005.
22 | M A R R I O T T I N T E R N A T I O N A L , I N C . 2 0 0 6
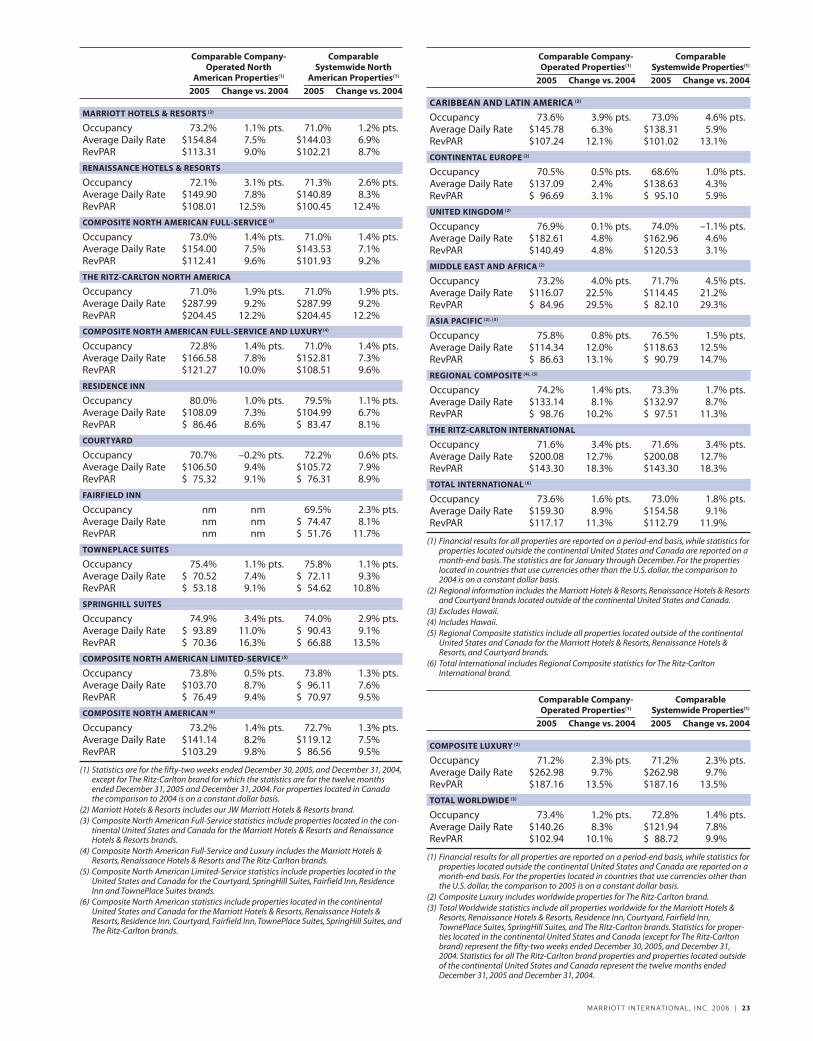
Comparable Company- ComparableOperated North Systemwide North
American Properties(1) American Properties(1)
2005 Change vs. 2004 2005 Change vs. 2004
MARRIOTT HOTELS & RESORTS (2)
Occupancy 73.2% 1.1% pts. 71.0% 1.2% pts.Average Daily Rate $154.84 7.5% $144.03 6.9%RevPAR $113.31 9.0% $102.21 8.7%
RENAISSANCE HOTELS & RESORTS
Occupancy 72.1% 3.1% pts. 71.3% 2.6% pts.Average Daily Rate $149.90 7.8% $140.89 8.3%RevPAR $108.01 12.5% $100.45 12.4%
COMPOSITE NORTH AMERICAN FULL-SERVICE (3)
Occupancy 73.0% 1.4% pts. 71.0% 1.4% pts.Average Daily Rate $154.00 7.5% $143.53 7.1%RevPAR $112.41 9.6% $101.93 9.2%
THE RITZ-CARLTON NORTH AMERICA
Occupancy 71.0% 1.9% pts. 71.0% 1.9% pts.Average Daily Rate $287.99 9.2% $287.99 9.2%RevPAR $204.45 12.2% $204.45 12.2%
COMPOSITE NORTH AMERICAN FULL-SERVICE AND LUXURY(4)
Occupancy 72.8% 1.4% pts. 71.0% 1.4% pts.Average Daily Rate $166.58 7.8% $152.81 7.3%RevPAR $121.27 10.0% $108.51 9.6%
RESIDENCE INN
Occupancy 80.0% 1.0% pts. 79.5% 1.1% pts.Average Daily Rate $108.09 7.3% $104.99 6.7%RevPAR $ 86.46 8.6% $ 83.47 8.1%
COURTYARD
Occupancy 70.7% –0.2% pts. 72.2% 0.6% pts.Average Daily Rate $106.50 9.4% $105.72 7.9%RevPAR $ 75.32 9.1% $ 76.31 8.9%
FAIRFIELD INN
Occupancy nm nm 69.5% 2.3% pts.Average Daily Rate nm nm $ 74.47 8.1%RevPAR nm nm $ 51.76 11.7%
TOWNEPLACE SUITES
Occupancy 75.4% 1.1% pts. 75.8% 1.1% pts.Average Daily Rate $ 70.52 7.4% $ 72.11 9.3%RevPAR $ 53.18 9.1% $ 54.62 10.8%
SPRINGHILL SUITES
Occupancy 74.9% 3.4% pts. 74.0% 2.9% pts.Average Daily Rate $ 93.89 11.0% $ 90.43 9.1%RevPAR $ 70.36 16.3% $ 66.88 13.5%
COMPOSITE NORTH AMERICAN LIMITED-SERVICE (5)
Occupancy 73.8% 0.5% pts. 73.8% 1.3% pts.Average Daily Rate $103.70 8.7% $ 96.11 7.6%RevPAR $ 76.49 9.4% $ 70.97 9.5%
COMPOSITE NORTH AMERICAN (6)
Occupancy 73.2% 1.4% pts. 72.7% 1.3% pts.Average Daily Rate $141.14 8.2% $119.12 7.5%RevPAR $103.29 9.8% $ 86.56 9.5%
(1) Statistics are for the fifty-two weeks ended December 30, 2005, and December 31, 2004,except for The Ritz-Carlton brand for which the statistics are for the twelve monthsended December 31, 2005 and December 31, 2004. For properties located in Canadathe comparison to 2004 is on a constant dollar basis.
(2) Marriott Hotels & Resorts includes our JW Marriott Hotels & Resorts brand.(3) Composite North American Full-Service statistics include properties located in the con-
tinental United States and Canada for the Marriott Hotels & Resorts and RenaissanceHotels & Resorts brands.
(4) Composite North American Full-Service and Luxury includes the Marriott Hotels &Resorts, Renaissance Hotels & Resorts and The Ritz-Carlton brands.
(5) Composite North American Limited-Service statistics include properties located in theUnited States and Canada for the Courtyard, SpringHill Suites, Fairfield Inn, ResidenceInn and TownePlace Suites brands.
(6) Composite North American statistics include properties located in the continentalUnited States and Canada for the Marriott Hotels & Resorts, Renaissance Hotels &Resorts, Residence Inn, Courtyard, Fairfield Inn, TownePlace Suites, SpringHill Suites, andThe Ritz-Carlton brands.
Comparable Company- Comparable Operated Properties(1) Systemwide Properties(1)
2005 Change vs. 2004 2005 Change vs. 2004
CARIBBEAN AND LATIN AMERICA (2)
Occupancy 73.6% 3.9% pts. 73.0% 4.6% pts.Average Daily Rate $145.78 6.3% $138.31 5.9%RevPAR $107.24 12.1% $101.02 13.1%
CONTINENTAL EUROPE (2)
Occupancy 70.5% 0.5% pts. 68.6% 1.0% pts.Average Daily Rate $137.09 2.4% $138.63 4.3%RevPAR $ 96.69 3.1% $ 95.10 5.9%
UNITED KINGDOM (2)
Occupancy 76.9% 0.1% pts. 74.0% –1.1% pts.Average Daily Rate $182.61 4.8% $162.96 4.6%RevPAR $140.49 4.8% $120.53 3.1%
MIDDLE EAST AND AFRICA (2)
Occupancy 73.2% 4.0% pts. 71.7% 4.5% pts.Average Daily Rate $116.07 22.5% $114.45 21.2%RevPAR $ 84.96 29.5% $ 82.10 29.3%
ASIA PACIFIC (2), (3)
Occupancy 75.8% 0.8% pts. 76.5% 1.5% pts.Average Daily Rate $114.34 12.0% $118.63 12.5%RevPAR $ 86.63 13.1% $ 90.79 14.7%
REGIONAL COMPOSITE (4), (5)
Occupancy 74.2% 1.4% pts. 73.3% 1.7% pts.Average Daily Rate $133.14 8.1% $132.97 8.7%RevPAR $ 98.76 10.2% $ 97.51 11.3%
THE RITZ-CARLTON INTERNATIONAL
Occupancy 71.6% 3.4% pts. 71.6% 3.4% pts.Average Daily Rate $200.08 12.7% $200.08 12.7%RevPAR $143.30 18.3% $143.30 18.3%
TOTAL INTERNATIONAL (6)
Occupancy 73.6% 1.6% pts. 73.0% 1.8% pts.Average Daily Rate $159.30 8.9% $154.58 9.1%RevPAR $117.17 11.3% $112.79 11.9%
(1) Financial results for all properties are reported on a period-end basis, while statistics forproperties located outside the continental United States and Canada are reported on amonth-end basis. The statistics are for January through December. For the propertieslocated in countries that use currencies other than the U.S. dollar, the comparison to2004 is on a constant dollar basis.
(2) Regional information includes the Marriott Hotels & Resorts, Renaissance Hotels & Resortsand Courtyard brands located outside of the continental United States and Canada.
(3) Excludes Hawaii.(4) Includes Hawaii.(5) Regional Composite statistics include all properties located outside of the continental
United States and Canada for the Marriott Hotels & Resorts, Renaissance Hotels &Resorts, and Courtyard brands.
(6) Total International includes Regional Composite statistics for The Ritz-CarltonInternational brand.
Comparable Company- Comparable Operated Properties(1) Systemwide Properties(1)
2005 Change vs. 2004 2005 Change vs. 2004
COMPOSITE LUXURY (2)
Occupancy 71.2% 2.3% pts. 71.2% 2.3% pts.Average Daily Rate $262.98 9.7% $262.98 9.7%RevPAR $187.16 13.5% $187.16 13.5%
TOTAL WORLDWIDE (3)
Occupancy 73.4% 1.2% pts. 72.8% 1.4% pts.Average Daily Rate $140.26 8.3% $121.94 7.8%RevPAR $102.94 10.1% $ 88.72 9.9%
(1) Financial results for all properties are reported on a period-end basis, while statistics forproperties located outside the continental United States and Canada are reported on amonth-end basis. For the properties located in countries that use currencies other thanthe U.S. dollar, the comparison to 2005 is on a constant dollar basis.
(2) Composite Luxury includes worldwide properties for The Ritz-Carlton brand.(3) Total Worldwide statistics include all properties worldwide for the Marriott Hotels &
Resorts, Renaissance Hotels & Resorts, Residence Inn, Courtyard, Fairfield Inn,TownePlace Suites, SpringHill Suites, and The Ritz-Carlton brands. Statistics for proper-ties located in the continental United States and Canada (except for The Ritz-Carltonbrand) represent the fifty-two weeks ended December 30, 2005, and December 31,2004. Statistics for all The Ritz-Carlton brand properties and properties located outsideof the continental United States and Canada represent the twelve months endedDecember 31, 2005 and December 31, 2004.
M A R R I O T T I N T E R N A T I O N A L , I N C . 2 0 0 6 | 23

North American Full-Service LodgingNorth American Full-Service Lodging includes our Marriott Hotels& Resorts, JW Marriott Hotels & Resorts, Marriott Conference Centers,Renaissance Hotels & Resorts and Renaissance ClubSport brands.
Annual Change
($ in millions) 2006 2005 2004 2006/2005 2005/2004
Revenues $5,196 $5,116 $4,691 2% 9%
Segment results $ 455 $ 349 $ 337 30% 4%
2006 COMPARED TO 2005In 2006, across our North American Full-Service Lodging seg-ment, we added 15 properties (4,971 rooms) and six properties(1,604 rooms) left the system.
In 2006, RevPAR for comparable company-operated NorthAmerican full-service properties increased 8.5 percent to $121.10.Occupancy for these properties decreased 0.4 percentage pointswhile average daily rates increased 9.0 percent to $167.27.
Compared to the prior year, our 2006 results reflect a $59 millionincrease in base management, incentive management and fran-chise fees.The increase in fees is largely due to stronger RevPAR,driven primarily by rate increases and, to a lesser extent, to higherfood and beverage, meeting room rental and other revenue andproductivity improvements, all of which favorably impacted prop-erty-level house profit margins.The growth in the number of rooms,year-over-year, also contributed to the increase in fees. Incentivefees included $10 million for 2005 that were calculated based onprior period earnings but not earned and due until they were rec-ognized. Similarly, base management fees for 2006 included $4 mil-lion of fees that were calculated based on prior period results, butnot earned and due until 2006. Owned, leased and other revenuenet of direct expenses decreased $8 million primarily as a result ofproperties sold in 2006 and the receipt in 2005 of a $10 million ter-mination fee associated with one property, partially offset by thereceipt in 2006 of $10 million in termination fees.
General, administrative and other expenses decreased $69 mil-lion as a result of, among other things, a $60 million charge in2005, associated with the CTF transaction, more fully discussed inthe previous “Operating Income” discussion, as well as expensesof $14 million in 2005, related to our bedding incentive program,partially offset by increased expenses in 2006 reflecting costsrelated to unit growth and development, systems improvementsand increases in ordinary costs such as wages and benefits. In2005, general, administrative and other expenses included $3 mil-lion of performance cure payments associated with one property.In 2006, general, administrative and other expenses included a $5 million performance cure payment.
Gains and other income was $3 million higher than the prioryear and reflected the redemption of preferred stock in a costmethod investee that generated income of $25 million in 2006and $15 million of higher net gains and other income in 2006reflecting gains in 2006 associated with the sale of joint ventureinvestments and real estate that were partially offset by lowergains in 2006 associated with the sale or repayment beforematurity of loans receivable associated with several properties.Gains and other income for 2006 reflected a $37 million non-cash charge to adjust the carrying amount to net realizablevalue associated with land we own and lease, as further describedin the “Expected Land Sale” caption later in this report. Equityresults decreased by $19 million versus the prior year and
reflected the recognition in 2005 of $16 million in equity earn-ings from two joint ventures as a result of the ventures’ sale ofhotels and our sale of some joint venture investments in 2005and 2006, offset to some extent by improved equity joint ven-ture results reflecting the stronger demand environment.
2005 COMPARED TO 2004In 2005, across our North American Full-Service Lodging seg-ment, we added 20 properties (6,141 rooms) and five properties(1,995 rooms) left the system.
In 2005, RevPAR for comparable company-operated NorthAmerican full-service properties increased 9.6 percent to $112.41.Occupancy for these properties increased 1.4 percentage pointswhile average daily rates increased 7.5 percent to $154.00.
Compared to the prior year, our 2005 segment results reflecta $58 million increase in base management, incentive manage-ment and franchise fees and $35 million of increased owned,leased and other revenue net of direct expenses. The increase infees is largely due to stronger RevPAR, driven primarily by rateincreases that favorably impact property-level house profits, thegrowth in the number of rooms and the recognition in 2005 of$10 million of incentive fees that were calculated based on priorperiod earnings but not earned and due until 2005. The increasein owned, leased, and other revenue net of direct expenses isprimarily attributable to properties acquired in 2005, many ofwhich were sold throughout 2006 as expected, including theCTF properties. In addition, owned, leased and other revenue in2005 reflected our receipt of a $10 million termination fee asso-ciated with one property that left our system.
Somewhat offsetting the net favorable variances were $78 mil-lion of higher general, administrative and other expenses. Asnoted in the preceding “Operating Income” discussion, during2005 we recorded a $60 million pre-tax charge, primarily due tothe non-cash write-off of deferred contract acquisition costsassociated with the termination of CTF management agree-ments, and we incurred expenses of $14 million related to ourbedding incentive program, both of which impacted our general,administrative and other expenses. In 2005, we also recorded per-formance termination cure payments of $3 million associatedwith one property, which impacted general, administrative andother expenses. In addition, in 2005 there were increased over-head costs associated with unit growth and development.
Further impacting segment results, gains and other incomewas $15 million lower than the prior year, while equity resultsincreased by $13 million versus the prior year. The decrease ingains and other income is primarily attributable to the $13 mil-lion gain in 2004 associated with the sale of our interest in theTwo Flags Joint Venture. The increase in equity results is prima-rily attributable to several joint ventures that had significantasset sales in 2005 generating gains, and to a lesser extent, thefavorable variance is also a result of a stronger demand environ-ment and the mix of investments.
North American Limited-Service Lodging North American Limited-Service Lodging includes our Courtyard,Fairfield Inn, SpringHill Suites, Residence Inn, TownePlace Suites, andMarriott ExecuStay brands.
Annual Change
($ in millions) 2006 2005 2004 2006/2005 2005/2004
Revenues $2,060 $1,886 $1,673 9% 13%
Segment results $ 380 $ 303 $ 233 25% 30%
24 | M A R R I O T T I N T E R N A T I O N A L , I N C . 2 0 0 6

2006 COMPARED TO 2005Across our North American Limited-Service Lodging segment,we added 91 properties (11,329 rooms) and 28 properties (3,647 rooms) left the system in 2006. The properties that left thesystem were primarily associated with our Fairfield Inn brand.
In 2006, RevPAR for comparable company-operated NorthAmerican limited-service properties increased 9.1 percent to$84.41. Occupancy for these properties decreased 0.8 percent-age points to 73.3 percent, while average daily rates increased10.4 percent to $115.24.
The $77 million increase in segment results for 2006 primarilyreflects a $77 million increase in base management, incentivemanagement and franchise fees, $27 million of lower general,administrative and other expenses and $6 million of increasedequity results, partially offset by $14 million of lower owned,leased and other revenue net of direct expenses and $19 millionof lower gains and other income. The increase in fees is largelydue to higher RevPAR, driven by rate increases, which impactedproperty-level house profits and, to a lesser extent, to 2006 pro-ductivity improvements and the growth in the number ofrooms. Stronger performance at our renovated Courtyard prop-erties, versus nonrenovated properties, is also contributing tothe increase in segment results over the prior year. The decreasein owned, leased and other revenue net of direct expensesreflects lower lease revenue as a result of our sale, late in 2005, ofa portfolio of land underlying 75 Courtyard hotels, partially off-set by improved owned and leased results in 2006 reflectingstronger demand. The decrease in general, administrative andother expenses of $27 million is attributable to the recognitionof expenses in 2005 totaling $11 million associated with ourbedding incentive program, a $6 million litigation charge and a$3 million guarantee charge. Improved equity results in 2006versus 2005 reflect the impact of a stronger demand environ-ment in 2006, new joint ventures and the impact of owning a 50 percent interest in the Courtyard Joint Venture through thefirst quarter of 2005 versus owning a 21 percent interest there-after. Gains and other income decreased $19 million in 2006 as aresult of the 2005 sale of a portfolio of land that generated gainsand other income of $17 million, a $10 million gain in 2005 asso-ciated with the repayment, before maturity, to us of the loan wemade to the Courtyard Joint Venture, partially offset by higherother real estate and other gains of $4 million in 2006 andincreased income of $4 million in 2006 associated with costmethod joint ventures.
2005 COMPARED TO 2004Across our North American Limited-Service Lodging segment,we added 94 properties (11,170 rooms) and 18 properties (2,309 rooms) left the system in 2005. The properties that left thesystem were primarily associated with our Fairfield Inn brand.
In 2005, RevPAR for comparable company-operated NorthAmerican limited-service properties increased 9.4 percent to$76.49. Occupancy for these properties increased 0.5 percentagepoints to 73.8 percent, while average daily rates increased 8.7 per-cent to $103.70.
The increase in revenues for 2005 over the prior year reflectsstronger RevPAR, driven by occupancy and rate increases andthe growth in the number of rooms. The $70 million increase insegment results versus the prior year reflects a $57 millionincrease in base management, incentive management and fran-chise fees, $8 million of lower owned, leased and other revenue
net of direct expenses, $3 million of higher gains and otherincome, an $11 million increase in equity results, and $7 millionof lower general, administrative and other expenses. General,administrative and other expenses in 2005 included $11 millionof expenses associated with our bedding incentive program. In2004 we wrote off deferred contract acquisition costs, impactinggeneral, administrative and other expenses, totaling $13 million.The 2005 increase in gains and other income is primarily a resultof the 2005 sale of a portfolio of land underlying 75 Courtyardhotels, which generated gains and other income of $17 million, a$10 million gain in 2005 associated with the repayment, beforematurity, to us of the loan we made to the Courtyard JointVenture and increased income of $4 million in 2005 associatedwith cost method joint ventures, partially offset by $27 million ofgains in 2004 primarily associated with land sales. The decline inowned, leased, corporate housing and other revenue net ofdirect expenses is primarily attributable to our ExecuStay brand’sshift to franchising. Improved equity results primarily reflect theimpact of owning a 50 percent interest in the Courtyard JointVenture through the 2005 first quarter versus owning a 21 per-cent interest thereafter. Stronger performance at our reinventedCourtyard properties, versus non-reinvented properties, is alsocontributing to the increase in revenue and segment resultsfrom the prior year. For additional information related to theCourtyard Joint Venture, see the “Courtyard Joint Venture” cap-tion in “Liquidity and Capital Resources” later in this report.
International LodgingInternational Lodging includes our International Marriott Hotels &Resorts, International JW Marriott Hotels & Resorts, InternationalRenaissance Hotels & Resorts, International Courtyard, InternationalFairfield Inn, International Residence Inn, Ramada International,and Marriott Executive Apartments brands.
Annual Change
($ in millions) 2006 2005 2004 2006/2005 2005/2004
Revenues $1,411 $1,017 $604 39% 68%
Segment results $ 237 $ 133 $109 78% 22%
2006 COMPARED TO 2005Across our International Lodging segment, we added 22 proper-ties (5,242 rooms) and 10 properties (3,136 rooms) left the sys-tem in 2006.
In 2006, RevPAR for comparable company-operated interna-tional properties increased 11.1 percent to $114.61. Occupancyfor these properties increased 1.2 percentage points to 74.4 per-cent, while average daily rates increased 9.4 percent to $153.99.Results for our international operations were strong across mostregions. China, Mexico, Australia, Germany, France, the UnitedKingdom and certain Middle Eastern countries all had strongRevPAR increases.
The $104 million increase in segment results for 2006 prima-rily reflects a $43 million increase in base management, incen-tive management and franchise fees, $37 million of lowergeneral, administrative and other expenses, $29 million ofincreased owned, leased, corporate housing and other revenuenet of expenses, and a $15 million increase in gains and otherincome, partially offset by $20 million of lower equity results.Incentive fees included $10 million and $4 million for 2006 and2005, respectively, that were calculated based on prior period
M A R R I O T T I N T E R N A T I O N A L , I N C . 2 0 0 6 | 25

earnings, but not earned and due until the periods they wererecognized. The increase in fees is largely due to higher RevPAR,driven by rate increases, which impacted property-level houseprofits and, to a lesser extent, to productivity improvements andthe growth in the number of rooms. Equity results decreased$20 million in 2006 versus 2005 and reflected the recognition in2005 of $14 million in equity earnings from a joint venture as aresult of the venture’s sale of a hotel and $4 million of increasedequity losses in 2006 associated with one joint venture’s hotelthat was closed for renovation. The increase of $29 million inowned, leased and other revenue net of direct expenses reflects$19 million of improved results for owned and leased propertiesprimarily due to the stronger demand environment and anincrease of $12 million for termination fees for several proper-ties. The $19 million improvement in owned and leased resultsalso reflects the impact of a $5 million charge in 2006 for depre-ciation expense associated with one property that was reclassi-fied from “held for sale” to “held and used” as it was not soldwithin one year of its classification as “held for sale,” as expected.
The $15 million increase in gains and other income is prima-rily attributable to gains on the sale of various joint venturesthroughout 2006, partially offset by lower other income associ-ated with one of the sold cost method joint venture invest-ments. The decrease in general, administrative and otherexpenses of $37 million is attributable to the recognition ofexpenses in 2005 totaling $5 million associated with our bed-ding incentive program as well as a $34 million charge in 2005associated with the CTF transaction discussed more fully in theprevious operating income disclosure. Also impacting general,administrative and other expenses, in 2005 we recordedexpenses totaling $6 million associated with two guarantees,and 2006 reflected $7 million of increased expenses related tounit growth and development, systems improvements andincreased ordinary costs such as wages and benefits.
2005 COMPARED TO 2004Across our International Lodging segment, we added 18 proper-ties (3,217 rooms) and three properties (696 rooms) left the sys-tem in 2005.
In 2005, RevPAR for comparable company-operated interna-tional hotels increased 11.3 percent to $117.17. Occupancy forthese hotels increased 1.6 percentage points to 73.6 percent,while average daily rates increased 8.9 percent to $159.30.Financial results for our international operations were strongacross most regions. In 2005 we experienced strong demandparticularly in China, Mexico, the Caribbean and Egypt. TheEuropean markets generally remained less robust.
The increase in revenues for 2005 over the prior year reflectsstronger RevPAR, driven by occupancy and rate increases andthe growth in the number of rooms across our internationalbrands. The $24 million increase in segment results versus theprior year reflects a $26 million increase in base management,incentive management and franchise fees, a $25 million increasein owned, leased and other revenue net of expenses, and a $15 mil-lion increase in equity results, partially offset by a $46 millionincrease in general, administrative and other expenses. Incentivefees for 2005 include the recognition of $4 million of incentivefees that were calculated based on prior period earnings but notearned and due until 2005. Owned, leased and other revenuenet of expenses increased $25 million reflecting propertiesacquired in 2005 as well as the impact of the stronger demandenvironment in 2005. Gains and other income increased $5 mil-lion in 2005 versus the prior year primarily reflecting increasedcost method joint venture income associated with one new
investment. Equity results increased $15 million and primarilyreflect a joint venture with significant asset sale activity in 2005that increased the profitability of the joint venture. In addition,equity results were impacted by the more favorable demandenvironment in 2005 versus the prior year as well as the mix ofinvestments. General, administrative and other expensesincreased $46 million in 2005 and included a $34 million pre-taxcharge primarily due to the non-cash write-off of deferred con-tract acquisition costs associated with the termination of CTFManagement Agreements and $5 million of higher expensesassociated with our bedding incentive program. Furthermore, in2005 we also recorded charges totaling $6 million associatedwith two guarantees, which impacted general, administrativeand other expenses.
Luxury LodgingLuxury Lodging includes our The Ritz-Carlton and Bulgari Hotels &Resorts brands.
Annual Change
($ in millions) 2006 2005 2004 2006/2005 2005/2004
Revenues $1,423 $1,333 $1,263 7% 6%
Segment results $ 63 $ 45 $ 35 40% 29%
2006 COMPARED TO 2005Across our Luxury Lodging segment, we added three properties(424 rooms) and one property (229 rooms) left the system in 2006.
In 2006, RevPAR for comparable company-operated luxuryproperties increased 9.7 percent to $209.88. Occupancy forthese properties increased 1.4 percentage points to 72.5 per-cent, while average daily rates increased 7.5 percent to $289.50.
The $18 million increase in segment results for 2006 primarilyreflects a $16 million increase in base management and incen-tive management fees, $7 million of lower general, administra-tive and other expenses and $1 million of higher owned, leasedand other revenue net of direct expenses, partially offset by $5 million of lower gains and other income. The increase in feesis largely due to higher RevPAR, driven by rate increases, whichimpacted property-level house profits and, to a lesser extent, toproductivity improvements and the growth in the number ofrooms. The decrease in general, administrative and otherexpenses of $7 million is attributable to a 2005 performance ter-mination cure payment of $12 million associated with one prop-erty, partially offset by a $5 million increase in expenses in 2006reflecting costs related to unit growth and development and an increase in ordinary costs such as wages and benefits. Gainsand other income decreased $5 million in 2006 as a result of a$9 million gain in 2005 associated with the repayment beforematurity of a note receivable associated with one property, par-tially offset by gains totaling $3 million associated with the 2006sale of a preferred interest in one property.
2005 COMPARED TO 2004Across our Luxury Lodging segment, we added two properties(699 rooms) in 2005.
In 2005, RevPAR for comparable company-operated luxuryproperties increased 18.3 percent to $143.30. Occupancy forthese properties increased 3.4 percentage points to 71.6 per-cent, while average daily rates increased 12.7 percent to $200.08.
The increase in revenues for 2005 over the prior year reflectsstronger RevPAR, driven by occupancy and rate increases andthe growth in the number of rooms. The $10 million increase in segment results versus the prior year reflects a $9 million
26 | M A R R I O T T I N T E R N A T I O N A L , I N C . 2 0 0 6

increase in base management and incentive management fees,a $2 million increase in owned, leased and other revenue net of direct expenses and $13 million of higher gains and otherincome, partially offset by $16 million of higher general, adminis-trative and other expenses. General, administrative and otherexpenses in 2005 included a performance termination curepayment of $12 million associated with one property. The 2005increase in gains and other income versus 2004 is a result of a $9 million gain in 2005 associated with the repayment beforematurity of a note receivable associated with one property andother real estate sale gains.
TimeshareTimeshare includes our Marriott Vacation Club, The Ritz-CarltonClub, Grand Residences by Marriott and Horizons by MarriottVacation Club brands.
Annual Change
($ in millions) 2006 2005 2004 2006/2005 2005/2004
Revenues $1,840 $1,721 $1,502 7% 15%
Segment results $ 280 $ 271 $ 203 3% 33%
2006 COMPARED TO 2005Timeshare contract sales, including sales made by our timesharejoint venture projects, which represents sales of timeshare inter-val, fractional and whole ownership products before adjustmentfor percentage of completion accounting, increased 17 percentover 2005.
Timeshare segment revenues of $1,840 million and $1,721 mil-lion, in 2006 and 2005, respectively, include interval, fractional,and whole ownership sales, base management fees, resort rentalfees and cost reimbursements. Timeshare segment revenuesalso include $41 million and $38 million for 2006 and 2005,respectively, of interest income, recorded in our ConsolidatedStatement of Income on the “Timeshare sales and services” rev-enue line, associated with Timeshare segment notes receivable.The $119 million increase in Timeshare segment revenuesreflects a $90 million increase in Timeshare sales and servicesrevenue, a $27 million increase in cost reimbursements revenueand $2 million of increased base management fees. The $90 mil-lion increase in Timeshare sales and services revenue primarilyreflects $77 million of revenue in 2006 from note securitizationgains. As detailed earlier in the “Cumulative Effect of Change inAccounting Principle” narrative, note securitization gains of $69 million for 2005 are not reflected in revenue, but instead are a component of gains and other income.
Segment results of $280 million in 2006 increased $9 millionover 2005.The $9 million increase includes an increase of $98 mil-lion for Timeshare sales and services revenue net of directexpenses and a $2 million increase in base management fees, par-tially offset by a decline of $72 million in gains and other income,a $16 million increase in general and administrative expenses and$3 million of lower joint venture equity earnings.The increase inTimeshare sales and services revenue net of direct expenses of$98 million largely reflects $77 million of revenue in 2006 fromnote securitization gains. As noted earlier in the “Revenue” discus-sion, note securitization gains of $69 million for 2005 are notreflected in revenue, but instead are a component of gains andother income. Also reflected in the $98 million variance, develop-ment revenue net of expenses increased $14 million primarilyreflecting lower development expenses in 2006 associated withprojects in the early stages of development that did not reach rev-enue recognition thresholds and the timing of expenses associated
with SOP 04-2, implemented in 2006. Additionally the $98 millionvariance reflected a $15 million reversal of marketing related con-tingency reserves and $12 million of higher financing revenue netof expense, partially offset by $21 million of lower services rev-enue net of expenses.The $3 million decline in equity income pri-marily reflects start-up losses associated with several new jointventures, partially offset by improved performance at other jointventures.The $72 million decline in gains and other income pri-marily reflected $69 million of note securitization gains in 2005versus the recording of note securitization gains in revenue for2006, while the $16 million increase in general, administrative andother expenses reflected higher program and joint venture devel-opment expenses and customary increases in ordinary costs suchas wages and benefits.
2005 COMPARED TO 2004Timeshare segment revenues were $1,721 million and $1,502 mil-lion, in 2005 and 2004, respectively. Timeshare segment rev-enues include $38 million and $23 million for 2005 and 2004,respectively, of interest income, recorded in our ConsolidatedStatement of Income on the “Timeshare sales and services” rev-enue line, associated with Timeshare segment notes receivable.Timeshare contract sales were flat as compared to the prior year,reflecting limited available inventory at several projects in 2005that were approaching sell-out status versus higher contractsales at those projects in the prior year. The favorable segmentresults compared with 2004 reflect a $51 million increase intimeshare sales and services revenue net of direct expenses, pri-marily reflecting higher financially reportable development rev-enue under the percentage of completion accounting, a higherdevelopment margin, primarily resulting from the mix of unitssold, and higher financing income reflecting a higher averagenotes receivable portfolio balance in 2005. In addition, com-pared with 2004, base fees increased $4 million, gains and otherincome increased $6 million, equity earnings increased $8 mil-lion, and general, administrative and other expenses increased$1 million. Improved equity results primarily reflect start-uplosses in 2004 versus earnings in 2005 associated with one jointventure, and the increase in gains and other income is attributa-ble to note sales that generated gains of $69 million in 2005compared to $64 million in 2004. In 2005 we also decided tocease development of one land parcel, and we recorded a $7 mil-lion charge in conjunction with the write-off of the previouslycapitalized costs that impacted our timeshare direct expenses.
HISTORICAL INFORMATIONThe following graphs show the number of Timeshare segmentowners and the Timeshare segment results for each of the lastfive fiscal years.
M A R R I O T T I N T E R N A T I O N A L , I N C . 2 0 0 6 | 27
20062005200420032002
TIMESHARE SEGMENT RESULTS($ in millions)
$280
$271
$203
$183
$149
20062005200420032002
TIMESHARE SEGMENT OWNERS
282,
600
256,
000
323,
000
349,
000
223,
000

Synthetic FuelSee Footnote No. 2,“Synthetic Fuel,” and Footnote No. 18,“Contingencies,” in this report for additional information regard-ing the Synthetic Fuel segment.
The tables that follow detail the impact of our Synthetic Fuelsegment on our income from continuing operations for 2006,2005 and 2004. Our management evaluates the figures pre-sented in the “Before Syn. Fuel Impact” columns because man-agement expects the Synthetic Fuel segment will no longerhave a material impact on our business after the InternalRevenue Code synthetic fuel tax credit program expires at theend of 2007 and because the presentation reflects the results ofour core Lodging operations. Management also believes thatthese presentations facilitate the comparison of our results withthe results of other lodging companies. However, the figures pre-sented in the “Before Syn. Fuel Impact” columns are non-GAAPfinancial measures, may be calculated and/or presented differ-ently than presentations of other companies, and are not alter-natives to operating income, total tax (provision) benefit, incomefrom continuing operations, or any other operating measureprescribed by U.S. generally accepted accounting principles.
2006 COMPARED TO 2005For 2006, the synthetic fuel operation generated revenue of $165 million versus revenue of $421 million for the prior year, pri-marily reflecting significantly lower production in 2006 as a resultof production suspensions instituted in response to high oilprices. The $76 million operating loss for 2006 includes a $5 mil-lion charge reflecting the write-down of assets at the Alabamaproduction facility as the adjacent mine was closed at year-end,and we did not anticipate operating the facility again at this loca-tion. Gains and other income (expense) reflects either net earn-out payments received or net earn-out payments made. In 2006,net earn-out payments made totaled $15 million, while in 2005net earn-out payments received totaled $32 million. Lowerminority interest income primarily reflects the redemption, earlyin 2006, of our partner’s interest in SAFE II. Additionally, lowerminority interest income in 2006 also reflects our buy-out in the2006 fourth quarter of our partner’s interest in SAFE I. Interestcosts in 2006 of $4 million reflect the cost of hedges entered intoduring 2006 in response to high oil prices and the uncertaintysurrounding the potential phase-out of tax credits. Income fromcontinuing operations for the Synthetic Fuel segment declinedfrom $125 million in 2005 to $5 million in 2006, primarily as aresult of both lower production in 2006 and the estimated 39percent phase-out of tax credits due to high oil prices in 2006.
28 | M A R R I O T T I N T E R N A T I O N A L , I N C . 2 0 0 6
The table below details the impact of our Synthetic Fuel segment on our continuing operations for 2006 and 2005.
2006 2005Before Before
As Syn. Fuel Syn. Fuel As Syn. Fuel Syn. Fuel($ in millions) Reported Impact Impact Reported Impact Impact
Operating income (loss) $1,011 $(76) $1,087 $ 555 $(144) $ 699
Gains and other income (expense) 59 (15) 74 181 32 149
Interest income, provision for loan losses and interest expense (76) (4) (72) (55) — (55)
Equity in earnings (losses) 3 — 3 36 — 36
Income (loss) before income taxes and minority interest 997 (95) 1,092 717 (112) 829
Tax (provision) benefit (348) 32 (380) (261) 23 (284)
Tax credits 62 62 — 167 167 —
Total tax (provision) benefit (286) 94 (380) (94) 190 (284)
Income from continuing operations before minority interest 711 (1) 712 623 78 545
Minority interest 6 6 — 45 47 (2)
Income from continuing operations $ 717 $ 5 $ 712 $ 668 $ 125 $ 543
2005 COMPARED TO 2004For 2005, the synthetic fuel operation generated revenue of$421 million versus revenue of $321 million for the prior year,primarily due to the consolidation of our synthetic fuel opera-tions from the start of the 2004 second quarter, which resultedin the recognition of revenue for the entire 2005 year comparedwith only three quarters in 2004, as we accounted for the syn-thetic fuel operations using the equity method of accounting inthe 2004 first quarter.
The $18 million increase in synthetic fuel income from con-tinuing operations to $125 million from $107 million in 2004 is primarily due to our increased proportion of tax creditsthrough May 31, 2005, associated with the SAFE II facilities that were then under IRS review and higher gains and other
income, partially offset by our decreased proportion of taxcredits through March 31, 2005, associated with the SAFE Ifacility that was not under IRS review. In addition, in 2005 pro-duction was slightly lower and raw materials prices werehigher than in 2004. Gains and other income represents netearn-out payments received. Minority interest increased from abenefit of $40 million in 2004 to a benefit of $47 million in2005, primarily as a result of the change in the method ofaccounting for our synthetic fuel operations. For 2004, minorityinterest reflects our partner’s share of the synthetic fuel lossesfrom March 26, 2004 (when we began consolidating the ven-tures due to the adoption of FIN 46(R)) through year-end. For2005, minority interest represents our partner’s share of thesynthetic fuel losses for the entire year.

New Accounting StandardsFAS No. 123 (revised 2004), “Share-Based Payment”Under our 2002 Comprehensive Stock and Cash Incentive Plan(“the Comprehensive Plan”), we currently award to participatingemployees (1) stock options to purchase our Class A CommonStock (“Stock Option Program”), (2) stock appreciation rights forour Class A Common Stock, and (3) restricted stock units of ourClass A Common Stock.
As noted in Footnote No. 1,“Basis of Presentation,” under theheading “New Accounting Pronouncements,” we adopted FASNo. 123(R),“Accounting for Stock-Based Compensation,” (“FASNo. 123(R)”) using the modified prospective transition methodat the beginning of our 2006 first quarter. In accordance withthe modified prospective transition method, we did not restateour Consolidated Financial Statements for prior periods toreflect the impact of FAS No. 123(R). For all share-based awardsgranted after the date we adopted FAS No. 123(R) and for theunvested portion of previously granted share-based awardsthat were outstanding on that date, FAS No. 123(R) requires thatwe measure compensation costs related to our share-basedpayment transactions at fair value on the grant date and thatwe recognize those costs in the financial statements over thevesting period during which the employee provides service inexchange for the award. Previously, under FAS No. 123 and APBOpinion No. 25, we accounted for our share-based employeecompensation plans using the intrinsic value method under therecognition and measurement principles of “Accounting forStock Issued to Employees,” (“APB Opinion No. 25”) and recog-nized share-based compensation expense for all awards exceptfor our Stock Option Program awards. Share-based compensa-tion expense totaled $62 million and $47 million for 2004 and2005, respectively.
Under FAS No. 123(R), we recorded share-based compensa-tion expense of $108 million in 2006. Deferred compensationcosts related to unvested awards totaled $168 million at year-end 2006, and the weighted average period over which thecosts are expected to be recognized is two years. Deferred com-pensation costs related to unvested awards totaled $137 millionat year-end 2005.
FAS No. 123(R) requires that share-based compensationexpense be recognized over the period from the grant date tothe date on which the award is no longer contingent on the
employee providing additional service (the “substantive vestingperiod”). In periods prior to the adoption of FAS No. 123(R), weshowed share-based compensation expense in our pro formadisclosure only for option awards to retirement-eligible employ-ees over the awards’ stated vesting period. In periods prior to theadoption of FAS No. 123(R), we recorded share-based compensa-tion expense for our other awards to retirement-eligible employ-ees over the awards’ stated vesting period. With the adoption ofFAS No. 123(R), we continue to follow the stated vesting periodfor the unvested portion of awards granted prior to adoption ofFAS No. 123(R) and follow the substantive vesting period forawards granted after the adoption of FAS No. 123(R).
In connection with the adoption of FAS No. 123(R), wereviewed, among other things, our forfeiture and volatilityassumptions. Estimated volatilities for 2006 were based on thehistorical share-price volatility for a period equal to the stockoption’s or share appreciation right’s expected lives, ending onthe day of grant, and calculated based on weekly data. Theweighted average expected stock option or share appreciationright terms for 2006 were a product of the lattice-based bino-mial valuation model that uses suboptimal exercise factors tocalculate the expected terms. In August 2005, the Board ofDirectors amended the Comprehensive Plan to provide partici-pants the ability, during a limited time frame in 2005, to elect toaccelerate the schedule for distribution of certain vesteddeferred shares. The amendment did not alter the previouslyestablished vesting schedule. In 2005, we also changed fromusing the Black-Scholes option pricing method to estimate thefair value of each stock option or share appreciation right on thegrant date, to using the binomial valuation method to improvethe estimate of fair value.
In 2005, we changed the method in which we issue share-based awards to our key employees. In prior years, share-basedcompensation for key employees consisted primarily of stockoptions. Upon consideration of several factors, we began in 2005to award key employees a combination of stock options andrestricted stock units. Therefore, this change resulted in anincrease in restricted stock expense.
The adoption of FAS No. 123(R) in 2006 resulted in the recogni-tion of incremental share-based compensation costs in 2006 of$39 million, a reduction in net income of $25 million (net of taxbenefits of $14 million) and a reduction of both basic and diluted
M A R R I O T T I N T E R N A T I O N A L , I N C . 2 0 0 6 | 29
The table below details the impact of our Synthetic Fuel segment on our continuing operations for 2005 and 2004.
2005 2004Before Before
As Syn. Fuel Syn. Fuel As Syn. Fuel Syn. Fuel($ in millions) Reported Impact Impact Reported Impact Impact
Operating income (loss) $ 555 $(144) $ 699 $ 477 $ (98) $ 575
Gains and other income (expense) 181 32 149 164 28 136
Interest income, provision for loan losses and interest expense (55) — (55) 55 — 55
Equity in earnings (losses) 36 — 36 (42) (28) (14)
Income (loss) before income taxes and minority interest 717 (112) 829 654 (98) 752
Tax (provision) benefit (261) 23 (284) (244) 21 (265)
Tax credits 167 167 — 144 144 —
Total tax (provision) benefit (94) 190 (284) (100) 165 (265)
Income from continuing operations before minority interest 623 78 545 554 67 487
Minority interest 45 47 (2) 40 40 —
Income from continuing operations $ 668 $ 125 $ 543 $ 594 $107 $ 487

earnings per share of $0.06. In accordance with FAS No. 123(R),we present the tax benefits resulting from the exercise of share-based awards as financing cash flows. Prior to the adoption of FASNo. 123(R), we reported the tax benefits resulting from the exer-cise of share-based awards as operating cash flows.The adoptionof FAS No. 123(R) resulted in a decrease in 2006 of $193 million incash flows from operating activities and an increase of $193 mil-lion in cash flows from financing activities related to excess taxbenefits from share-based awards.The aggregate amount of cashwe received from the exercise of stock options granted undershare-based payment arrangements was $184 million, $125 mil-lion, and $206 million for 2006, 2005 and 2004, respectively.
Under the provisions of FAS No. 123(R), the “Deferred com-pensation” line on our Consolidated Balance Sheet, a contra-equity line representing the amount of unrecognizedshare-based compensation costs, is no longer presented.Accordingly, the amount that had been on the “Deferred com-pensation” line at year-end 2005 was reversed in the 2006 firstquarter through the “Additional paid-in-capital” line on ourConsolidated Balance Sheet.
Statement of Position 04-2, “Accounting for Real Estate Time-Sharing Transactions”See the “Cumulative Effect of Change in Accounting Principle”section earlier in this report for information regarding the adop-tion in 2006 of SOP 04-2.
Future Adoption of Accounting StandardsFASB Interpretation No. 48, “Accounting for Uncertainty inIncome Taxes”In July 2006, the FASB issued FASB Interpretation No. 48,“Accounting for Uncertainty in Income Taxes” (“FIN 48”). FIN 48 is an interpretation of FASB Statement No. 109,“Accounting forIncome Taxes,” and it seeks to reduce the diversity in practiceassociated with certain aspects of measurement and recognitionin accounting for income taxes. FIN 48 prescribes a recognitionthreshold and measurement attribute for the financial statementrecognition and measurement of a tax position taken or expectedto be taken in a tax return. Additionally, FIN 48 provides guid-ance on de-recognition, classification, interest and penalties,accounting in interim periods, disclosure and transition. FIN 48 is effective for fiscal years beginning after December 15, 2006,which is our 2007 fiscal year, and its provisions are to be appliedto all tax positions upon initial adoption. Upon adoption of FIN 48, only tax positions that meet a “more likely than not”threshold at the effective date may be recognized or continue to be recognized. The cumulative effect of applying FIN 48, ifany, is to be reported as an adjustment to the opening balanceof retained earnings in the year of adoption. We are evaluatingthe impact that FIN 48 will have on our financial statements.
FAS No. 156, “Accounting for Servicing of Financial Assets”In March 2006, the FASB issued FAS No. 156,“Accounting forServicing of Financial Assets” (“FAS No. 156”). FAS No. 156requires that all separately recognized servicing assets and liabilities are to be initially measured at fair value. It also allowsentities to subsequently elect fair value measurement for itsservicing assets and liabilities. This standard is effective for thefirst fiscal year beginning after September 15, 2006, which is our2007 fiscal year. We have determined that FAS No. 156 will nothave a material impact on our financial statements.
FAS No. 157, “Fair Value Measurements”In September 2006, the FASB issued FAS No. 157,“Fair ValueMeasurements” (“FAS No. 157”). This standard defines fair value,
establishes a methodology for measuring fair value and expandsthe required disclosure for fair value measurements. FAS No. 157is effective for fiscal years beginning after November 15, 2007,which is our 2008 fiscal year. Provisions of FAS No. 157 arerequired to be applied prospectively as of the beginning of thefirst fiscal year in which FAS No. 157 is applied. We are evaluatingthe impact that FAS No. 157 will have on our financial statements.
EITF Issue No. 06-8, “Applicability of the Assessment of aBuyer’s Continuing Investment under FASB Statement No. 66for Sales of Condominiums”In November 2006, the Emerging Issues Task Force of the FASB(“EITF”) reached a consensus on EITF Issue No. 06-8,“Applica-bility of the Assessment of a Buyer’s Continuing Investmentunder FASB Statement No. 66, Accounting for Sales of RealEstate, for Sales of Condominiums” (“EITF 06-8”). EITF 06-8 willrequire condominium sales to meet the continuing investmentcriterion in FAS No. 66 in order for profit to be recognized underthe percentage-of-completion method. EITF 06-8 will be effec-tive for annual reporting periods beginning after March 15,2007, which is our 2008 fiscal year. The cumulative effect ofapplying EITF 06-8, if any, is to be reported as an adjustment tothe opening balance of retained earnings in the year of adop-tion. We are evaluating the impact that EITF 06-8 will have onour financial statements.
Investment in Leveraged LeaseAt year-end 2006, we had a $23 million investment in an aircraftleveraged lease with Delta Air Lines, Inc. (“Delta”), which weacquired in 1994.The gross investment is comprised of rentalsreceivable and the residual value of the aircraft offset by unearnedincome. On September 14, 2005, Delta filed for bankruptcy protec-tion under Chapter 11 of the U.S. Bankruptcy Code and informedus that it wished to restructure the lease. As a result, we believeour investment was impaired, and have recorded pre-tax chargesof approximately $18 million through 2006.
Expected Land SaleIn 1988, the Company, as landlord, entered into a 59-year groundlease with a lessee for land that was improved with a hotel thatis owned by the lessee. The hotel was previously branded aMarriott property; however, currently it is not. The lease containscontractual rental increases over the term of the lease, andannual ground rent on the land currently totals approximately$5 million. The lease also contains a provision that permits thelessee, under certain circumstances, to purchase the land for afixed price. The Company and the lessee have had various dis-cussions concerning the land as well as the hotel. During the2006 second quarter, it became probable that none of the pro-posed transactions were acceptable to both parties, and the les-see indicated its intent to exercise its option to purchase theland. Accordingly, in the 2006 second quarter, we reclassified theland from the “Property and equipment” caption in ourConsolidated Balance Sheet to the “Assets held for sale” captionand recorded a $37 million non-cash charge to adjust the carry-ing amount to net realizable value. Additional amounts may bedue us depending on the lessee’s use of the land subsequent topurchase; however, such amounts will only be recorded if andwhen paid.
Effective Tax RateTax credits contributed by our synthetic fuel operations havesignificantly reduced our effective tax rate during the last sev-eral years. Because that program ends with 2007 synthetic fuel
30 | M A R R I O T T I N T E R N A T I O N A L , I N C . 2 0 0 6

production, our synthetic fuel production facilities will not beable to generate credits in future years. As a result, our futureeffective tax rate is likely to increase significantly, therebyreducing our after-tax profits.
DISCONTINUED OPERATIONS
Distribution ServicesIn 2005 and 2004, we had income, net of tax of $1 million and $2 million, respectively, associated with the distribution servicesbusiness that we exited in 2002.
LIQUIDITY AND CAPITAL RESOURCES
Cash Requirements and Our Credit FacilitiesWe are party to a $2.0 billion multicurrency revolving credit agree-ment that supports our commercial paper program and letters ofcredit. Effective June 6, 2006, we executed an amendment extend-ing the maturity date for $1.955 billion of commitments underthis agreement by one year to June 6, 2011.The remaining $45 mil-lion commitment still matures on June 6, 2010. Borrowings underthis facility bear interest at the London Interbank Offered Rateplus a spread based on our public debt rating. Additionally, wepay annual fees on the facility at a rate also based on our publicdebt rating.We do not anticipate that fluctuations in the availabil-ity of the commercial paper market will affect our liquiditybecause of the flexibility provided by our credit facility.We classifycommercial paper as long-term debt based on our ability andintent to refinance it on a long-term basis.
At year-end 2006 our available borrowing capacity amountedto $1.770 billion and reflected borrowing capacity at $2.0 billionunder the credit facility plus our cash balance of $193 millionless the letters of credit outstanding under the facility of $108 mil-lion and $315 million of outstanding commercial paper sup-ported by the facility. We consider these resources, together withcash we expect to generate from operations, adequate to meetour short-term and long-term liquidity requirements, finance ourlong-term growth plans, meet debt service and fulfill other cashrequirements. We periodically evaluate opportunities to selladditional debt or equity securities, obtain credit facilities fromlenders or repurchase, refinance, or otherwise restructure ourlong-term debt for strategic reasons or to further strengthen ourfinancial position.
We issue short-term commercial paper in Europe and in theUnited States. Our commercial paper issuances are subject tothe availability of the commercial paper in each of these mar-kets, as we have no commitments from buyers to purchase ourcommercial paper. We reserve unused capacity under our creditfacility to repay outstanding commercial paper borrowings inthe event that the commercial paper market is not available tous for any reason when outstanding borrowings mature.
We monitor the status of the capital markets and regularlyevaluate the effect that changes in capital market conditionsmay have on our ability to execute our announced growth plans.We expect that part of our financing and liquidity needs willcontinue to be met through commercial paper borrowings andaccess to long-term committed credit facilities. If conditions inthe lodging industry deteriorate, or if disruptions in the com-mercial paper market take place as they did in the immediateaftermath of September 11, 2001, we may be unable to placesome or all of our commercial paper on a temporary orextended basis, and may have to rely more on borrowings underthe credit facility, which may carry a higher cost than commer-cial paper.
Cash from OperationsCash from operations, depreciation expense and amortizationexpense for the last three fiscal years are as follows:
($ in millions) 2006 2005 2004
Cash from operations $970 $837 $891
Depreciation expense 155 156 133
Amortization expense 33 28 33
We have reclassified certain prior year amounts to conform toour 2006 presentation. The reclassifications were primarily asso-ciated with Timeshare segment inventory that is now a compo-nent of “Current assets” in our Consolidated Balance Sheet andwas previously a component of “Property and equipment.”
Our ratio of current assets to current liabilities was roughly 0.8 to one at year-end 2006 and 0.6 to one at year-end 2005.Weminimize working capital through cash management, strict credit-granting policies, aggressive collection efforts and high inventoryturnover.We also have significant borrowing capacity under ourrevolving credit facility should we need additional working capital.
Our ratios of earnings to fixed charges for the last five fiscalyears, the calculations of which are detailed in Exhibit 12 to ourAnnual Report on Form 10-K, are as follows:
Fiscal Years
2006 2005 2004 2003 2002
4.9x 4.3x 4.7x 3.6x 3.2x
While our Timeshare segment generates strong operating cashflow, year-to-year cash flow varies based on the timing of bothcash outlays for the acquisition and development of new resortsand cash received from purchaser financing.We include timesharereportable sales we finance in cash from operations when we col-lect cash payments or the notes are sold for cash.The followingtable shows the net operating activity from our Timeshare seg-ment (which does not include the portion of income from contin-uing operations from our Timeshare segment):
($ in millions) 2006 2005 2004
Timeshare segment development,less the cost of sales $ (83) $ 40 $ 93
New Timeshare segment mortgages,net of collections (537) (441) (459)
Loan repurchases (55) (23) (18)
Note sale gains (77) (69) (64)
Note sale proceeds 508 399 312
Financially reportable sales less than (in excess of ) closed sales 61 (57) 129
Collection on retained interests in notes sold and servicing fees 96 90 94
Other cash (outflows) inflows (17) 26 2
Net cash (outflows) inflows from Timeshare segment activity $(104) $ (35) $ 89
Our ability to sell Timeshare segment notes depends on thecontinued ability of the capital markets to provide financing tothe special purpose entities that buy the notes. We might haveincreased difficulty or be unable to consummate such sales ifthe underlying quality of the notes receivable we originate wereto deteriorate, although we do not expect such deterioration.Loans to Timeshare segment owners, including a current portion
M A R R I O T T I N T E R N A T I O N A L , I N C . 2 0 0 6 | 31

of $70 million, totaled $386 million at year-end 2006. Loans toTimeshare segment owners, including a current portion of $33 million, totaled $344 million at year-end 2005.
Investing Activities Cash FlowsCapital Expenditures and Other Investments. Capital expendituresof $529 million in 2006, $780 million in 2005 and $181 million in2004 included expenditures related to the development and con-struction of new hotels and acquisitions of hotel properties, as wellas improvements to existing properties and systems initiatives.Timeshare segment development expenditures, which areincluded in “Cash from Operations,”as noted in that section’s narra-tive, are not reflected in these numbers. Over time, we have soldlodging properties under development, subject to long-term man-agement agreements.The ability of third-party purchasers to raisethe necessary debt and equity capital depends in part on the per-ceived risks inherent in the lodging industry and other constraintsinherent in the capital markets as a whole. Although we expect tocontinue to consummate such real estate sales, if we were unableto do so, our liquidity could decrease and we could have increasedexposure to the operating risks of owning real estate.We monitorthe status of the capital markets and regularly evaluate the poten-tial impact on our business operations of changes in capital marketconditions.We also expect to continue to make other investmentsin connection with adding units to our lodging business.Theseinvestments include loans and minority equity investments.
Fluctuations in the values of hotel real estate generally havelittle impact on the overall results of our Lodging segmentsbecause: (1) we own less than 1 percent of the total number ofhotels that we operate or franchise; (2) management and fran-chise fees are generally based upon hotel revenues and profitsrather than current hotel property values; and (3) our manage-ment agreements generally do not terminate upon hotel sale.
Dispositions. Property and asset sales generated cash pro-ceeds of $798 million in 2006, $298 million in 2005 and $402 mil-lion in 2004. In 2006 we closed on the sales of 11 hotels andseven joint venture investments. Cash proceeds of $26 millionfor one of the hotels sold in 2006 are not reflected in the $798 mil-lion as the proceeds were initially recorded as a deposit becauseof a contingency and impacted the other investing activitiessection of our Consolidated Statement of Cash Flows rather thandispositions. The contingency was subsequently resolved andsale accounting was achieved in 2006.
The sold properties included eight properties purchased in2005 from CTF Holdings Ltd. (and certain of its affiliates (collec-tively “CTF”)). For additional information regarding the CTF trans-action, see Footnote No. 8,“Acquisitions and Dispositions,” laterin this report.
Loan Activity. We have made loans to owners of hotels thatwe operate or franchise, typically to facilitate the developmentof a new hotel. Based on historical experience, over time weexpect these owners to repay the loans in accordance with theloan agreements, or earlier as the hotels mature and capital mar-kets permit. Loan collections and sales, net of advances during2006, amounted to $62 million. Lodging senior loans outstand-ing totaled $9 million (which included a current portion of $1 mil-lion) at year-end 2006 and $59 million (which included a currentportion of $2 million) at year-end 2005. Lodging mezzanine andother loans totaled $268 million (which included a current por-tion of $32 million) at year-end 2006 and $274 million (whichincluded a current portion of $13 million) at year-end 2005. In2006 our notes receivable balance associated with Lodging sen-ior loans and Lodging mezzanine and other loans, declined by$56 million and primarily reflects the repayment of several loans.
Equity and Cost Method Investments. Cash outflows of $95 mil-lion in 2006 associated with equity and cost method invest-ments primarily reflects our investments in three joint ventures.Cash outflows of $216 million in 2005 associated with equityand cost method investments primarily reflects our establish-ment in 2005 of a 50/50 joint venture with Whitbread.
Cash from Financing ActivitiesDebt. Debt increased $96 million in 2006, from $1,737 million to$1,833 million at year-end 2006, due to the issuance of $349 mil-lion (book value) of Series H Senior Notes (described more fullybelow), partially offset by a net reduction in commercial paperoutstanding of $184 million, and other debt decreases of $69 mil-lion. Debt increased $412 million in 2005, from $1,325 million to$1,737 million at year-end 2005, due to the issuance of $348 mil-lion (book value) of Series F Notes, net commercial paperissuances of $499 million, and other debt increases of $69 million,partially offset by repayment upon maturity of $200 million forthe Series B Notes, repayment upon maturity of $275 million for the Series D Notes and the $29 million (book value) debtdecrease associated with the Series C and Series E Senior Noteexchanges for Series G Senior Notes as described in Footnote No. 12,“Long-term Debt,” in our 2005 Annual Report on Form 10-K.
In the 2006 second quarter, we sold $350 million aggregateprincipal amount of 6.200 percent Series H Notes due in 2016 (the“Notes”).We received net proceeds of approximately $347 millionfrom this offering, after deducting a discount, underwriting fees,and other expenses, and we used these proceeds to repay com-mercial paper borrowings and for general corporate purposes.
Interest on the Notes is paid on June 15 and December 15 of each year, with the first interest payment occurring onDecember 15, 2006. The Notes will mature on June 15, 2016, andare redeemable, in whole or in part, at any time and from time totime under the terms provided in the Form of Note. The Noteswere issued under an indenture with JPMorgan Chase Bank, N.A.(formerly known as the Chase Manhattan Bank), as trustee, datedNovember 16, 1998.
Our financial objectives include diversifying our financingsources, optimizing the mix and maturity of our long-termdebt and reducing our working capital. At year-end 2006, ourlong-term debt had an average interest rate of 5.9 percent andan average maturity of approximately 6.9 years. The ratio offixed-rate long-term debt to total long-term debt was 0.7 toone at year-end 2005. At the end of 2006, we had long-termpublic debt ratings of BBB+ from Standard and Poor’s and Baa2from Moody’s.
Share Repurchases. We purchased 41.5 million shares of ourClass A Common Stock in 2006 at an average price of $38.13 pershare, 51.4 million shares of our Class A Common Stock in 2005at an average price of $32.12 pershare, and 28.0 million shares ofour Class A Common Stock in 2004at an average price of $23.33 pershare. We purchase shares in theopen market and in privatelynegotiated transactions. As ofyear-end 2006, 34.2 million sharesremained available for repurchaseunder authorizations from ourBoard of Directors.
The adjacent graph shows ourdiluted weighted average sharescount for each of the last five fis-cal years.
32 | M A R R I O T T I N T E R N A T I O N A L , I N C . 2 0 0 6
20062005200420032002
DILUTED SHARES(in millions)
430.
2
462.
3
480.
9
509.
3
490.
8
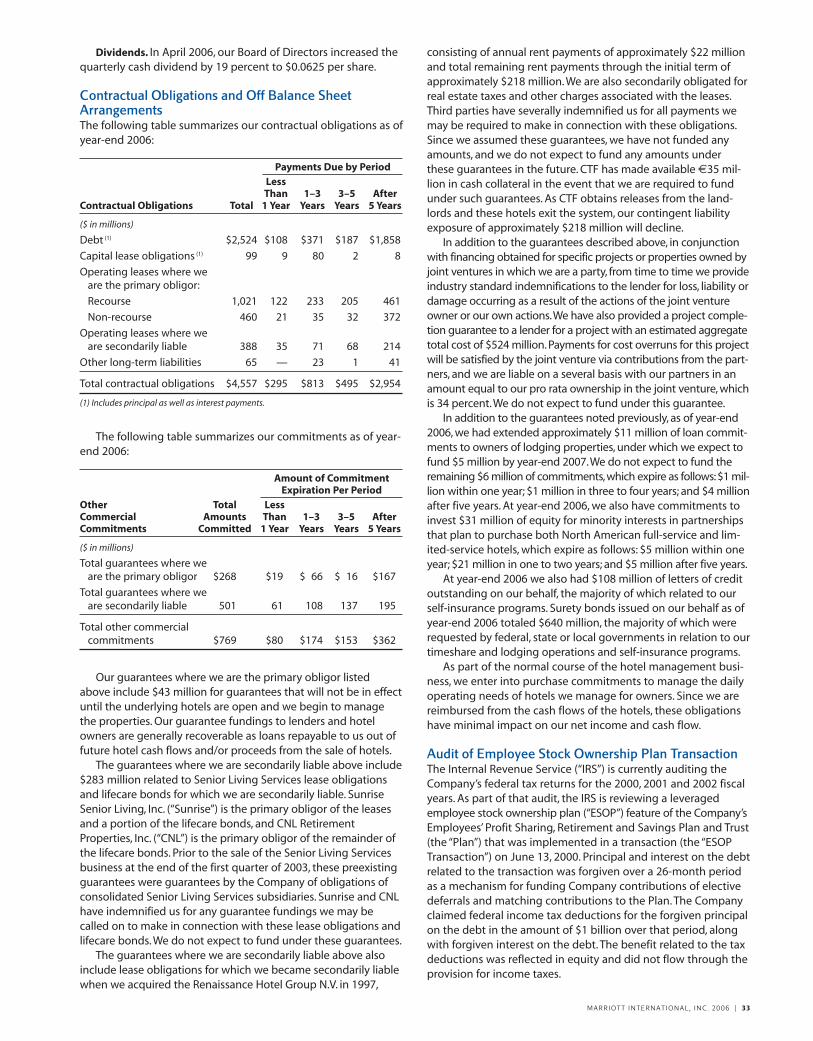
Dividends. In April 2006, our Board of Directors increased thequarterly cash dividend by 19 percent to $0.0625 per share.
Contractual Obligations and Off Balance SheetArrangementsThe following table summarizes our contractual obligations as ofyear-end 2006:
Payments Due by PeriodLessThan 1–3 3–5 After
Contractual Obligations Total 1 Year Years Years 5 Years
($ in millions)
Debt (1) $2,524 $108 $371 $187 $1,858
Capital lease obligations (1) 99 9 80 2 8
Operating leases where we are the primary obligor:
Recourse 1,021 122 233 205 461
Non-recourse 460 21 35 32 372
Operating leases where we are secondarily liable 388 35 71 68 214
Other long-term liabilities 65 — 23 1 41
Total contractual obligations $4,557 $295 $813 $495 $2,954
(1) Includes principal as well as interest payments.
The following table summarizes our commitments as of year-end 2006:
Amount of Commitment Expiration Per Period
Other Total LessCommercial Amounts Than 1–3 3–5 AfterCommitments Committed 1 Year Years Years 5 Years
($ in millions)
Total guarantees where we are the primary obligor $268 $19 $ 66 $ 16 $167
Total guarantees where we are secondarily liable 501 61 108 137 195
Total other commercial commitments $769 $80 $174 $153 $362
Our guarantees where we are the primary obligor listedabove include $43 million for guarantees that will not be in effectuntil the underlying hotels are open and we begin to managethe properties. Our guarantee fundings to lenders and hotelowners are generally recoverable as loans repayable to us out offuture hotel cash flows and/or proceeds from the sale of hotels.
The guarantees where we are secondarily liable above include$283 million related to Senior Living Services lease obligationsand lifecare bonds for which we are secondarily liable. SunriseSenior Living, Inc. (“Sunrise”) is the primary obligor of the leasesand a portion of the lifecare bonds, and CNL RetirementProperties, Inc. (“CNL”) is the primary obligor of the remainder ofthe lifecare bonds. Prior to the sale of the Senior Living Servicesbusiness at the end of the first quarter of 2003, these preexistingguarantees were guarantees by the Company of obligations ofconsolidated Senior Living Services subsidiaries. Sunrise and CNLhave indemnified us for any guarantee fundings we may becalled on to make in connection with these lease obligations andlifecare bonds. We do not expect to fund under these guarantees.
The guarantees where we are secondarily liable above alsoinclude lease obligations for which we became secondarily liablewhen we acquired the Renaissance Hotel Group N.V. in 1997,
consisting of annual rent payments of approximately $22 millionand total remaining rent payments through the initial term ofapproximately $218 million. We are also secondarily obligated forreal estate taxes and other charges associated with the leases.Third parties have severally indemnified us for all payments wemay be required to make in connection with these obligations.Since we assumed these guarantees, we have not funded anyamounts, and we do not expect to fund any amounts underthese guarantees in the future. CTF has made available €35 mil-lion in cash collateral in the event that we are required to fundunder such guarantees. As CTF obtains releases from the land-lords and these hotels exit the system, our contingent liabilityexposure of approximately $218 million will decline.
In addition to the guarantees described above, in conjunctionwith financing obtained for specific projects or properties owned byjoint ventures in which we are a party, from time to time we provideindustry standard indemnifications to the lender for loss, liability ordamage occurring as a result of the actions of the joint ventureowner or our own actions.We have also provided a project comple-tion guarantee to a lender for a project with an estimated aggregatetotal cost of $524 million. Payments for cost overruns for this projectwill be satisfied by the joint venture via contributions from the part-ners, and we are liable on a several basis with our partners in anamount equal to our pro rata ownership in the joint venture, whichis 34 percent.We do not expect to fund under this guarantee.
In addition to the guarantees noted previously, as of year-end2006, we had extended approximately $11 million of loan commit-ments to owners of lodging properties, under which we expect tofund $5 million by year-end 2007.We do not expect to fund theremaining $6 million of commitments,which expire as follows:$1 mil-lion within one year; $1 million in three to four years; and $4 millionafter five years. At year-end 2006, we also have commitments toinvest $31 million of equity for minority interests in partnershipsthat plan to purchase both North American full-service and lim-ited-service hotels, which expire as follows: $5 million within oneyear; $21 million in one to two years; and $5 million after five years.
At year-end 2006 we also had $108 million of letters of creditoutstanding on our behalf, the majority of which related to ourself-insurance programs. Surety bonds issued on our behalf as ofyear-end 2006 totaled $640 million, the majority of which wererequested by federal, state or local governments in relation to ourtimeshare and lodging operations and self-insurance programs.
As part of the normal course of the hotel management busi-ness, we enter into purchase commitments to manage the dailyoperating needs of hotels we manage for owners. Since we arereimbursed from the cash flows of the hotels, these obligationshave minimal impact on our net income and cash flow.
Audit of Employee Stock Ownership Plan TransactionThe Internal Revenue Service (“IRS”) is currently auditing theCompany’s federal tax returns for the 2000, 2001 and 2002 fiscalyears. As part of that audit, the IRS is reviewing a leveragedemployee stock ownership plan (“ESOP”) feature of the Company’sEmployees’ Profit Sharing, Retirement and Savings Plan and Trust(the “Plan”) that was implemented in a transaction (the “ESOPTransaction”) on June 13, 2000. Principal and interest on the debtrelated to the transaction was forgiven over a 26-month periodas a mechanism for funding Company contributions of electivedeferrals and matching contributions to the Plan. The Companyclaimed federal income tax deductions for the forgiven principalon the debt in the amount of $1 billion over that period, alongwith forgiven interest on the debt. The benefit related to the taxdeductions was reflected in equity and did not flow through theprovision for income taxes.
M A R R I O T T I N T E R N A T I O N A L , I N C . 2 0 0 6 | 33

Based on discussions with the IRS during the course of theaudit, the IRS may seek to disallow some or all of the deductionsrelated to the ESOP Transaction, and may seek to impose othertaxes, penalties, and interest, including excise taxes for prohib-ited transactions under Section 4975 of the Internal RevenueCode of 1986, as amended. In a January 19, 2007 letter to theCompany, the U.S. Department of Labor confirmed that it isreviewing the ESOP Transaction. The Company has retainedcounsel to assist with the audit process and to respond to anyclaims or assessments the IRS or Department of Labor issues.Although we are early in the process of closing this audit, we donot expect the result of the audit to have a material impact oneither equity for any lost deductions or earnings for interest orpenalties, if any, related to the ESOP Transaction.
RELATED PARTY TRANSACTIONS
Equity Method InvestmentsWe have equity method investments in entities that own prop-erties for which we provide management and/or franchise serv-ices and receive fees. In addition, in some cases we provideloans, preferred equity or guarantees to these entities.
The following tables present financial data resulting fromtransactions with these related parties:
Income Statement Data
($ in millions) 2006 2005 2004
Base management fees $ 62 $ 83 $ 72
Incentive management fees 22 14 8
Cost reimbursements 649 936 802
Owned, leased, corporate housing and other revenue 3 22 29
Total revenue $ 736 $1,055 $ 911
General, administrative and other $ (1) $ (19) $ (33)
Reimbursed costs (649) (936) (802)
Gains and other income 28 54 19
Interest income 4 31 74
Reversal of provision for loan losses 1 — 3
Equity in losses-Synthetic fuel — — (28)
Equity in earnings (losses)-Other 3 36 (14)
Balance Sheet Data
($ in millions) 2006 2005
Current assets-accounts and notes receivable $ 76 $ 47
Contract acquisition costs 34 26
Cost method investments 45 166
Equity method investments 332 349
Loans to equity method investees 27 36
Long-term deferred tax asset, net 4 19
Current liabilities:
Accounts payable — (2)
Other payables and accruals (2) (43)
Other long-term liabilities (13) (19)
JWM Family Enterprises, L.P.JWM Family Enterprises, L.P. (“Family Enterprises”) is a Delawarelimited partnership which is beneficially owned and controlledby members of the family of J.W. Marriott, Jr., the Company’s
Chairman and Chief Executive Officer, including John W. MarriottIII, the Company’s Vice-Chairman, who is Chief Executive Officerof Family Enterprises, and J.W. Marriott, Jr. himself. In July 2006,the Company sold the Dallas, Texas, Renaissance Hotels &Resorts brand hotel to Family Enterprises for a sale price ofapproximately $38 million and recognized a gain of $1 millionon the sale. The Company originally acquired the hotel from athird party in June 2005. The sale to Family Enterprises resultedfrom a competitive auction process involving other unrelatedbidders in which Family Enterprises submitted the most com-petitive bid.
CRITICAL ACCOUNTING ESTIMATES
The preparation of financial statements in accordance with U.S. generally accepted accounting principles (GAAP) requiresmanagement to make estimates and assumptions that affectreported amounts and related disclosures. Management consid-ers an accounting estimate to be critical if:
3 it requires assumptions to be made that were uncertain atthe time the estimate was made; and
3 changes in the estimate, or different estimates that couldhave been selected, could have a material effect on ourconsolidated results of operations or financial condition.
Management has discussed the development and selectionof its critical accounting estimates with the Audit Committee ofthe Board of Directors, and the Audit Committee has reviewedthe disclosure presented below relating to them.
Marriott RewardsMarriott Rewards is our frequent guest loyalty program. MarriottRewards members earn points based on their monetary spend-ing at our lodging operations, purchases of timeshare interval,fractional and whole ownership products and, to a lesser degree,through participation in affiliated partners’ programs, such asthose offered by car rental and credit card companies. Points,which we track on members’ behalf, can be redeemed for staysat most of our lodging operations, airline tickets, airline frequentflyer program miles, rental cars and a variety of other awards;however, points cannot be redeemed for cash. We provideMarriott Rewards as a marketing program to participating prop-erties. We charge the cost of operating the program, includingthe estimated cost of award redemption, to properties based onmembers’ qualifying expenditures.
We defer revenue received from managed, franchised andMarriott-owned/leased hotels and program partners equal tothe fair value of our future redemption obligation. We determinethe fair value of the future redemption obligation based on sta-tistical formulas that project timing of future point redemptionbased on historical levels, including an estimate of the “break-age” for points that will never be redeemed, and an estimate ofthe points that will eventually be redeemed. These judgmentalfactors determine the required liability for outstanding points.
Our management and franchise agreements require that webe reimbursed currently for the costs of operating the program,including marketing, promotion, communication with, andperforming member services for the Marriott Rewards members.Due to the requirement that properties reimburse us for pro-gram operating costs as incurred, we receive and recognize thebalance of the revenue from properties in connection with theMarriott Rewards program at the time such costs are incurredand expensed. We recognize the component of revenue fromprogram partners that corresponds to program maintenanceservices over the expected life of the points awarded. Upon theredemption of points, we recognize as revenue the amounts
34 | M A R R I O T T I N T E R N A T I O N A L , I N C . 2 0 0 6

previously deferred and recognize the corresponding expenserelating to the costs of the awards redeemed.
Valuation of GoodwillWe evaluate the fair value of goodwill to assess potential impair-ments on an annual basis, or during the year if an event or othercircumstance indicates that we may not be able to recover thecarrying amount of the asset. We evaluate the fair value of good-will at the reporting unit level and make that determinationbased upon future cash flow projections that assume certaingrowth projections which may or may not occur. We record animpairment loss for goodwill when the carrying value of theintangible asset is less than its estimated fair value.
Loan Loss ReservesLodging Senior Loans and Lodging Mezzanine and Other LoansWe measure loan impairment based on the present value ofexpected future cash flows discounted at the loan’s original effec-tive interest rate or the estimated fair value of the collateral. Forimpaired loans, we establish a specific impairment reserve for thedifference between the recorded investment in the loan and thepresent value of the expected future cash flows, that assumes cer-tain growth projections which may or may not occur, or the esti-mated fair value of the collateral.We apply our loan impairmentpolicy individually to all loans in the portfolio and do not aggre-gate loans for the purpose of applying such policy.Where wedetermine that a loan is impaired, we recognize interest incomeon a cash basis. At year-end 2006, our recorded investment inimpaired loans was $92 million.We had a $70 million allowancefor credit losses, leaving $22 million of our investment in impairedloans for which there was no related allowance for credit losses.At year-end 2005, our recorded investment in impaired loans was$184 million.We had a $103 million allowance for credit losses,leaving $81 million of our investment in impaired loans for whichthere was no related allowance for credit losses. During 2006 and2005, our average investment in impaired loans totaled $138 mil-lion and $182 million, respectively.
Loans to Timeshare OwnersIn conjunction with the adoption of SOP 04-2, we now record anestimate of expected uncollectibility on notes receivable that wereceive from timeshare purchasers as a reduction of revenue atthe time we recognize profit on a timeshare sale. We assessuncollectibility based on pools of receivables, because we holdlarge numbers of homogenous timeshare notes receivable. Weestimate uncollectibles based on historical uncollectibles forsimilar timeshare notes receivable over the past six years. We use a technique referred to as static pool analysis, which tracksuncollectibles for each year’s sales over the life of those notes.At year-end 2006, our allowance for credit losses associated with“Loans to timeshare owners” totaled $29 million.
Legal ContingenciesWe are subject to various legal proceedings and claims, the out-comes of which are subject to significant uncertainty. We recordan accrual for loss contingencies when a loss is probable and the amount of the loss can be reasonably estimated. We reviewthese accruals each reporting period and make revisions basedon changes in facts and circumstances.
Income TaxesWe record the current year amounts payable or refundable, as wellas the consequences of events that give rise to deferred tax assetsand liabilities based on differences in how those events are treatedfor tax purposes.We base our estimate of deferred tax assets and
liabilities on current tax laws and rates and, in certain cases,business plans and other expectations about future outcomes.
Changes in existing laws and rates, and their related interpre-tations, and future business results may affect the amount ofdeferred tax liabilities or the valuation of deferred tax assetsover time. Our accounting for deferred tax consequences repre-sents management’s best estimate of future events that can beappropriately reflected in the accounting estimates.
OTHER MATTERS
InflationInflation has been moderate in recent years and has not had asignificant impact on our businesses.
QUANTITATIVE AND QUALITATIVE DISCLOSURES
ABOUT MARKET RISK.
We are exposed to market risk from changes in interest rates,foreign exchange rates, and debt and equity prices, and for oursynthetic fuel business, oil prices. We manage our exposure tothese risks by monitoring available financing alternatives,through development and application of credit granting policiesand by entering into derivative arrangements. We do not foreseeany significant changes in either our exposure to fluctuations ininterest rates or foreign exchange rates or how such exposure ismanaged in the future.
We are exposed to interest rate risk on our floating-rate notesreceivable, our residual interests retained in connection with thesale of Timeshare segment notes receivable and the fair value ofour fixed-rate notes receivable.
Changes in interest rates also impact our floating-rate long-term debt and the fair value of our fixed-rate long-term debt.
We are also subject to risk from changes in debt and equityprices from our investments in debt securities and commonstock, which have a carrying value of $107 million at year-end2006 and are accounted for as available-for-sale securities underFAS No. 115,“Accounting for Certain Investments in Debt andEquity Securities.”
We use derivative instruments as part of our overall strategyto manage our exposure to market risks associated with fluctua-tions in interest rates and foreign currency exchange rates. As amatter of policy, we do not use derivatives for trading or specu-lative purposes.
At year-end 2006 we were party to the following derivativeinstruments:
3 An interest rate swap agreement under which we receivea floating rate of interest and pay a fixed rate of interest.The swap modifies our interest rate exposure by effec-tively converting a note receivable with a fixed rate to afloating rate. The aggregate notional amount of the swapwas $92 million and it matures in 2010.
3 Four outstanding interest rate swap agreements to man-age interest rate risk associated with the residual interestswe retain in conjunction with our timeshare note sales.Historically, we were required by purchasers and/or ratingagencies to utilize interest rate swaps to protect theexcess spread within our sold note pools. The aggregatenotional amount of the swaps was $209 million, and theyexpire through 2022.
3 Option contracts to hedge the potential volatility ofearnings and cash flows associated with variations inforeign exchange rates during 2007. The aggregate dollarequivalent of the notional amounts of the contracts wasapproximately $47 million, and they expire throughout 2007.
M A R R I O T T I N T E R N A T I O N A L , I N C . 2 0 0 6 | 35

The following table sets forth the scheduled maturities and the total fair value of our derivatives and other financial instruments asof year-end 2006:
Maturities by PeriodTotal Total
Carrying Fair($ in millions) 2007 2008 2009 2010 2011 Thereafter Amount Value
Assets—Maturities represent expected principal receipts,fair values represent assets.
Timeshare segment notes receivable $ 70 $ 40 $ 35 $ 30 $ 30 $ 181 $ 386 $ 386Average interest rate 12.35%
Fixed-rate notes receivable $ 13 $ 6 $ 2 $ 83 $ 3 $ 26 $ 133 $ 136Average interest rate 10.94%
Floating-rate notes receivable $ 20 $ 19 $ 3 $ 7 $ 36 $ 59 $ 144 $ 145Average interest rate 7.99%
Residual interests $ 84 $ 50 $ 33 $ 21 $ 13 $ 20 $ 221 $ 221Average interest rate 9.22%
Liabilities—Maturities represent expected principal payments, fair values represent liabilities.
Fixed-rate debt $ (11) $(103) $(89) $(13) $(14) $(1,243) $(1,473) $(1,504)Average interest rate 6.07%
Floating-rate debt $ (1) $ — $ — $ — $ — $ (315) $ (316) $ (316)Average interest rate 4.80%
NOTE: We classify commercial paper as long-term debt based on our ability and intent to refinance it on a long-term basis.
Derivatives—Maturities represent notional amounts,fair values represent assets (liabilities).
Interest Rate Swaps:
Fixed to variable $ — $ — $ — $ 93 $ — $ 161 $ 8 $ 8Average pay rate 3.90%Average receive rate 5.29%
Variable to fixed $ — $ — $ — $ — $ — $ 47 $ (2) $ (2)Average pay rate 5.88%Average receive rate 4.01%
Forward Foreign Exchange Contracts:
Fixed (EUR) to Fixed (USD) $162 $ — $ — $ — $ — $ — $ — $ —Average exchange rate 1.32
Fixed (GBP) to Fixed (USD) $ 75 $ — $ — $ — $ — $ — $ — $ —Average exchange rate 1.96
Fixed (HKD) to Fixed (USD) $ 49 $ — $ — $ — $ — $ — $ — $ —Average Exchange Rate 0.13
Fixed (MXN) to Fixed (USD) $ 7 $ — $ — $ — $ — $ — $ — $ —Average Exchange Rate 0.09
Fixed (AUD) to Fixed (USD) $ 3 $ — $ — $ — $ — $ — $ — $ —Average Exchange Rate 0.79
Fixed (CAD) to Fixed (USD) $ 11 $ — $ — $ — $ — $ — $ — $ —Average Exchange Rate 0.86
Oil Price Hedges:
Contract Amount $ 7 $ — $ — $ — $ — $ — $ 5 $ 5(Weighted Average Price per Gallon is $1.37)(Contract volume is 5 million barrels)
36 | M A R R I O T T I N T E R N A T I O N A L , I N C . 2 0 0 6
3 Forward foreign exchange contracts to manage the for-eign currency exposure related to certain monetaryassets. The aggregate dollar equivalent of the notionalamounts of the forward contracts was $217 million andthey expire throughout 2007.
3 Oil price hedges to manage the volatility associated withoil prices and the uncertainty surrounding the potential
phase-out of tax credits in 2007. The hedges cover 5 mil-lion barrels of oil and expire on December 31, 2007.
3 Forward foreign exchange contracts to manage currencyexchange rate volatility associated with certain invest-ments in foreign operations. The contracts had a dollarnotional equivalent of $43 million and they expirethroughout 2007.

Fiscal Years 2006, 2005 and 2004 2006 2005 2004
($ in millions, except per share amounts)
REVENUESBase management fees (1) $ 553 $ 497 $ 435Franchise fees 390 329 296Incentive management fees (1) 281 201 142Owned, leased, corporate housing and other revenue (1) 1,119 944 730Timeshare sales and services 1,577 1,487 1,247Cost reimbursements (1) 8,075 7,671 6,928Synthetic fuel 165 421 321
12,160 11,550 10,099
OPERATING COSTS AND EXPENSESOwned, leased and corporate housing-direct 936 778 629Timeshare-direct 1,220 1,228 1,039Reimbursed costs (1) 8,075 7,671 6,928General, administrative and other (1) 677 753 607Synthetic fuel 241 565 419
11,149 10,995 9,622
OPERATING INCOME 1,011 555 477Gains and other income (1) 59 181 164Interest expense (124) (106) (99)Interest income (1) 45 79 146Reversal of provision for (provision for) loan losses (1) 3 (28) 8Equity in (losses) earnings
—Synthetic fuel (1) — — (28)—Other (1) 3 36 (14)
INCOME FROM CONTINUING OPERATIONS BEFORE INCOME TAXES AND MINORITY INTEREST 997 717 654Provision for income taxes (286) (94) (100)Minority interest 6 45 40
INCOME FROM CONTINUING OPERATIONS 717 668 594Cumulative effect of change in accounting principle, net of tax (109) — —Discontinued operations, net of tax — 1 2
NET INCOME $ 608 $ 669 $ 596
EARNINGS PER SHARE-BasicEarnings from continuing operations $ 1.77 $ 1.55 $ 1.31Losses from cumulative effect of accounting change (0.27) — —Earnings from discontinued operations — — —
Earnings per share $ 1.50 $ 1.55 $ 1.31
EARNINGS PER SHARE-DilutedEarnings from continuing operations $ 1.66 $ 1.45 $ 1.24Losses from cumulative effect of accounting change (0.25) — —Earnings from discontinued operations — — —
Earnings per share $ 1.41 $ 1.45 $ 1.24
DIVIDENDS DECLARED PER SHARE $0.2400 $0.2000 $0.1650
(1) See Footnote No. 22,“Related Party Transactions,” of the Notes to Consolidated Financial Statements for disclosure of related party amounts.
See Notes to Consolidated Financial Statements
Consolidated Statement of Income
M A R R I O T T I N T E R N A T I O N A L , I N C . 2 0 0 6 | 37

Fiscal Year-End 2006 and 2005 2006 2005
($ in millions)
ASSETSCurrent assets
Cash and equivalents $ 193 $ 203Accounts and notes receivable (1) 1,117 1,001Inventory 1,208 1,164Current deferred taxes, net 200 220Assets held for sale 411 555Other 185 247
3,314 3,390
Property and equipment 1,238 1,134
Intangible assets
Goodwill 921 924Contract acquisition costs (1) 575 466
1,496 1,390
Cost method investments (1) 70 233
Equity method investments (1) 332 349
Notes receivableLoans to equity method investees (1) 27 36Loans to timeshare owners 316 311Other notes receivable 217 282
560 629
Other long-term receivables 178 175Deferred taxes, net (1) 665 545Other (1) 735 685
$ 8,588 $ 8,530
LIABILITIES AND SHAREHOLDERS’ EQUITYCurrent liabilities
Current portion of long-term debt $ 15 $ 56Accounts payable (1) 658 520Accrued payroll and benefits 615 559Liability for guest loyalty program 384 317Liabilities of assets held for sale 102 30Timeshare segment deferred revenue 178 141Other payables and accruals (1) 570 510
2,522 2,133Long-term debt 1,818 1,681Liability for guest loyalty program 847 768Self-insurance reserves 184 180Other long-term liabilities (1) 599 516
Shareholders’ equityClass A Common Stock 5 5Additional paid-in-capital 3,617 3,562Retained earnings 2,860 2,500Treasury stock, at cost (3,908) (2,667)Deferred compensation — (137)Accumulated other comprehensive income (loss) 44 (11)
2,618 3,252
$ 8,588 $ 8,530
(1) See Footnote No. 22,“Related Party Transactions,” of the Notes to Consolidated Financial Statements for disclosure of related party amounts.
See Notes to Consolidated Financial Statements
Consolidated Balance Sheet
38 | M A R R I O T T I N T E R N A T I O N A L , I N C . 2 0 0 6

Fiscal Years 2006, 2005 and 2004 2006 2005 2004
($ in millions)
OPERATING ACTIVITIES
Net income $ 608 $ 669 $ 596
Adjustments to reconcile to cash provided by operating activities:
Depreciation and amortization 188 184 166
Minority interest (7) (44) (40)
Income taxes (76) (86) (63)
Timeshare activity, net (104) (35) 89
Liability for guest loyalty program 113 125 136
Cumulative effect of change in accounting principle 109 — —
Other 106 151 (83)
Working capital changes:
Accounts receivable (10) (128) (6)
Other current assets (9) (22) (16)
Accounts payable and accruals 52 23 112
Net cash provided by operating activities 970 837 891
INVESTING ACTIVITIES
Capital expenditures (529) (780) (181)
Dispositions 798 298 402
Loan advances (59) (56) (129)
Loan collections and sales 121 706 276
Equity and cost method investments (95) (216) (45)
Purchase of available-for-sale securities (27) (15) (30)
Other (90) (67) (6)
Net cash provided by (used in) investing activities 119 (130) 287
FINANCING ACTIVITIES
Commercial paper, net (188) 499 —
Issuance of long-term debt 352 356 20
Repayment of long-term debt (17) (523) (99)
Redemption of convertible debt — — (62)
Debt exchange consideration, net — (29) —
Issuance of Class A Common Stock 378 125 206
Dividends paid (93) (84) (73)
Purchase of treasury stock (1,546) (1,644) (664)
Earn-outs received, net 15 26 35
Net cash used in financing activities (1,099) (1,274) (637)
(DECREASE) INCREASE IN CASH AND EQUIVALENTS (10) (567) 541
CASH AND EQUIVALENTS, beginning of year 203 770 229
CASH AND EQUIVALENTS, end of year $ 193 $ 203 $ 770
See Notes to Consolidated Financial Statements
Consolidated Statement of Cash Flows
M A R R I O T T I N T E R N A T I O N A L , I N C . 2 0 0 6 | 39
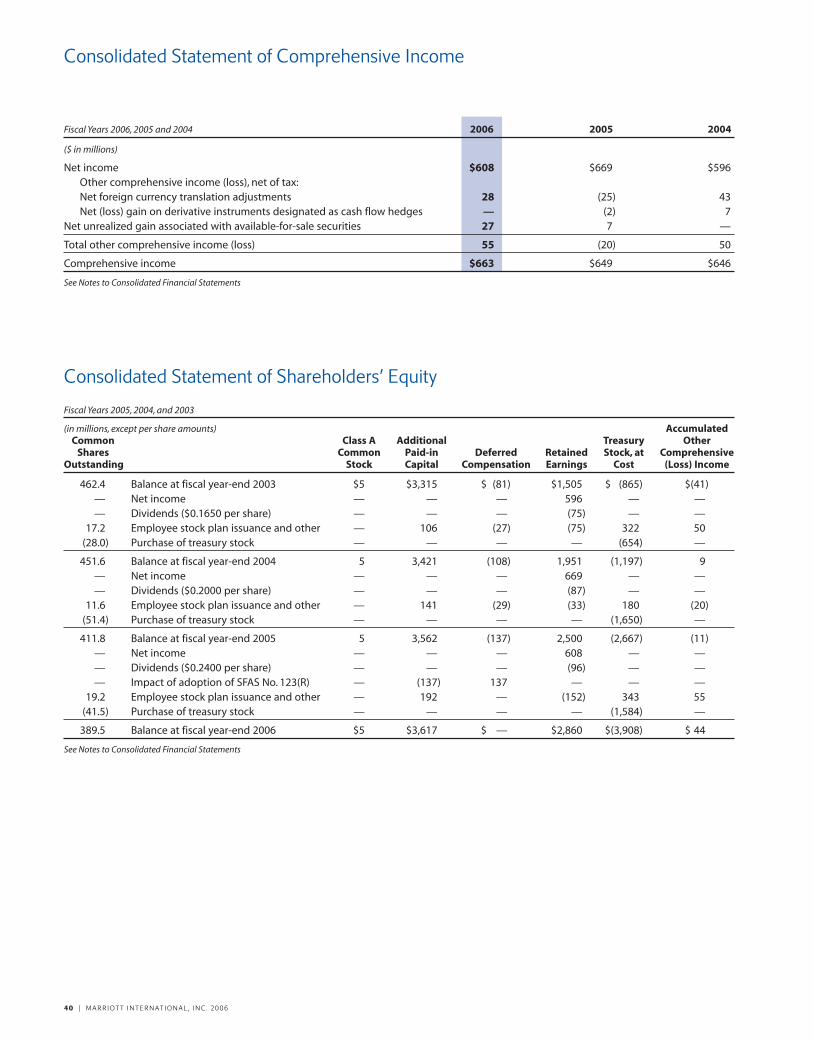
Fiscal Years 2006, 2005 and 2004 2006 2005 2004
($ in millions)
Net income $608 $669 $596Other comprehensive income (loss), net of tax:Net foreign currency translation adjustments 28 (25) 43Net (loss) gain on derivative instruments designated as cash flow hedges — (2) 7
Net unrealized gain associated with available-for-sale securities 27 7 —
Total other comprehensive income (loss) 55 (20) 50
Comprehensive income $663 $649 $646
See Notes to Consolidated Financial Statements
Consolidated Statement of Shareholders’ Equity
Fiscal Years 2005, 2004, and 2003
(in millions, except per share amounts) AccumulatedCommon Class A Additional Treasury Other
Shares Common Paid-in Deferred Retained Stock, at ComprehensiveOutstanding Stock Capital Compensation Earnings Cost (Loss) Income
462.4 Balance at fiscal year-end 2003 $5 $3,315 $ (81) $1,505 $ (865) $(41)— Net income — — — 596 — —— Dividends ($0.1650 per share) — — — (75) — —
17.2 Employee stock plan issuance and other — 106 (27) (75) 322 50(28.0) Purchase of treasury stock — — — — (654) —
451.6 Balance at fiscal year-end 2004 5 3,421 (108) 1,951 (1,197) 9— Net income — — — 669 — —— Dividends ($0.2000 per share) — — — (87) — —
11.6 Employee stock plan issuance and other — 141 (29) (33) 180 (20)(51.4) Purchase of treasury stock — — — — (1,650) —
411.8 Balance at fiscal year-end 2005 5 3,562 (137) 2,500 (2,667) (11)— Net income — — — 608 — —— Dividends ($0.2400 per share) — — — (96) — —— Impact of adoption of SFAS No. 123(R) — (137) 137 — — —
19.2 Employee stock plan issuance and other — 192 — (152) 343 55(41.5) Purchase of treasury stock — — — — (1,584) —
389.5 Balance at fiscal year-end 2006 $5 $3,617 $ — $2,860 $(3,908) $ 44
See Notes to Consolidated Financial Statements
Consolidated Statement of Comprehensive Income
40 | M A R R I O T T I N T E R N A T I O N A L , I N C . 2 0 0 6
1 | SUMMARY OF SIGNIFICANT ACCOUNTING POLICIES
Basis of PresentationThe consolidated financial statements present the results of oper-ations, financial position and cash flows of Marriott International,Inc. (together with its subsidiaries,“we,”“us” or the “Company”).
The preparation of financial statements in conformity withU.S. generally accepted accounting principles requires manage-ment to make estimates and assumptions that affect thereported amounts of assets and liabilities as of the date of thefinancial statements, the reported amounts of revenues andexpenses during the reporting periods and the disclosures ofcontingent liabilities. Accordingly, ultimate results could differfrom those estimates.
We have reclassified certain prior year amounts to conform toour 2006 presentation.The reclassifications were primarily associ-ated with Timeshare segment inventory which is now a compo-nent of “Current assets” in our Consolidated Balance Sheet and waspreviously a component of “Property and equipment.”As noted inthe “New Accounting Standards”caption later in this footnote, atthe beginning of our 2006 fiscal year, we adopted Statement ofPosition 04-2,“Accounting for Real Estate Time-SharingTransactions,” (“SOP 04-2”) as issued by the American Institute ofCertified Public Accountants.The American Resort DevelopmentAssociation, a timeshare trade association of which we are a mem-ber and the Staff of the Securities and Exchange Commission(“SEC”) had communications regarding SOP 04-2 and the incomestatement presentation of timeshare note securitization gains. As aresult of those communications, we reclassified in our 2006 thirdquarter, in our Consolidated Statement of Income,Timeshare seg-ment note securitization gains of $40 million recognized in the2006 second quarter from the “Gains and other income”caption tothe “Timeshare sales and services”revenue caption. As a result ofthe change,“Timeshare sales and services”revenue of $331 millionas reported in the 2006 second quarter, now totals $371 million,and “Gains and other income”of $48 million as reported in the2006 second quarter, now totals $8 million. Including $37 million ofTimeshare segment note securitization gains recognized in the2006 fourth quarter, full year for 2006 note securitization gainstotaling $77 million are reflected within our “Timeshare sales andservices”revenue caption. Gains from the sale of timeshare notesreceivable totaling $69 million and $64 million for 2005 and 2004,respectively, are classified within the “Gains and other income”cap-tion in our Consolidated Statement of Income.
On June 9, 2006, we completed a two-for-one stock split thatwas effected in the form of a stock dividend. As a result of thestock split, each shareholder of record at the close of businesson May 18, 2006, received one additional share of Class ACommon Stock on June 9, 2006, for each share held on May 18,2006. For periods prior to the stock split, all share and per sharedata in the Annual Report on Form 10-K have been retroactivelyadjusted to reflect the stock split.
In our opinion, the accompanying consolidated financialstatements reflect all normal and recurring adjustments neces-sary to present fairly our financial position at fiscal year-end2006 and fiscal year-end 2005 and the results of our operationsand cash flows for fiscal years 2006, 2005 and 2004. We haveeliminated all material intercompany transactions and balancesbetween entities consolidated in these financial statements.
Fiscal YearOur fiscal year ends on the Friday nearest to December 31.Unless otherwise specified, each reference to “2006” means ourfiscal year ended December 29, 2006, each reference to “2005”means our fiscal year ended December 30, 2005, each referenceto “2004” means our fiscal year ended December 31, 2004, andeach reference to “2003” means our fiscal year ended January 2,2004, and not, in each case, the corresponding calendar year. Allfiscal years presented include 52 weeks.
Revenue RecognitionOur revenues include: (1) base and incentive management fees;(2) franchise fees; (3) revenues from lodging properties andother businesses owned or leased by us; (4) timeshare interval,fractional and whole ownership sales and services, which alsoincludes resort rental revenue, interest income associated withour “Loans to timeshare owners,” and for 2006, Timeshare seg-ment note securitization gains, as noted in the “Basis of Pre-sentation” caption earlier; (5) cost reimbursements; and (6) salesmade by the synthetic fuel operation. Management fees com-prise a base fee, which is a percentage of the revenues of hotels,and an incentive fee, which is generally based on hotel prof-itability. Franchise fees comprise initial application fees and con-tinuing royalties generated from our franchise programs, whichpermit the hotel owners and operators to use certain of ourbrand names. Cost reimbursements include direct and indirectcosts that are reimbursed to us by lodging properties that wemanage or franchise.
Base and Incentive Management Fees: We recognize base feesas revenue when earned in accordance with the contract. Ininterim periods and at year-end, we recognize incentive fees thatwould be due as if the contract were to terminate at that date,exclusive of any termination fees payable or receivable by us.
Franchise Fee Revenue: We recognize franchise fees as revenuein each accounting period as fees are earned from the franchisee.
Owned and Leased Units: We recognize room sales and rev-enues from other guest services for our owned and leased unitswhen rooms are occupied and services have been rendered.
Timeshare and Fractional Intervals and Condominiums: Werecognize sales when: (1) we have received a minimum of 10 per-cent of the purchase price for the timeshare interval; (2) the pur-chaser’s period to cancel for a refund has expired; (3) we deemthe receivables to be collectible; and (4) we have attained cer-tain minimum sales and construction levels. We defer all revenueusing the deposit method for sales that do not meet all four ofthese criteria. For sales that do not qualify for full revenue recog-nition as the project has progressed beyond the preliminarystages but has not yet reached completion, all revenue andprofit are deferred and recognized in earnings using the per-centage of completion method.
Timeshare Whole Ownership (Stand-Alone Structures): We rec-ognize sales under the full accrual method of accounting whenwe receive our proceeds and transfer title at settlement.
Cost Reimbursements: We recognize cost reimbursementsfrom managed, franchised and timeshare properties when weincur the related reimbursable costs.
Synthetic Fuel: We recognize revenue from the synthetic fueloperation when the synthetic fuel is produced and sold. In 2004,
M A R R I O T T I N T E R N A T I O N A L , I N C . 2 0 0 6 | 41
Notes to Consolidated Financial Statements
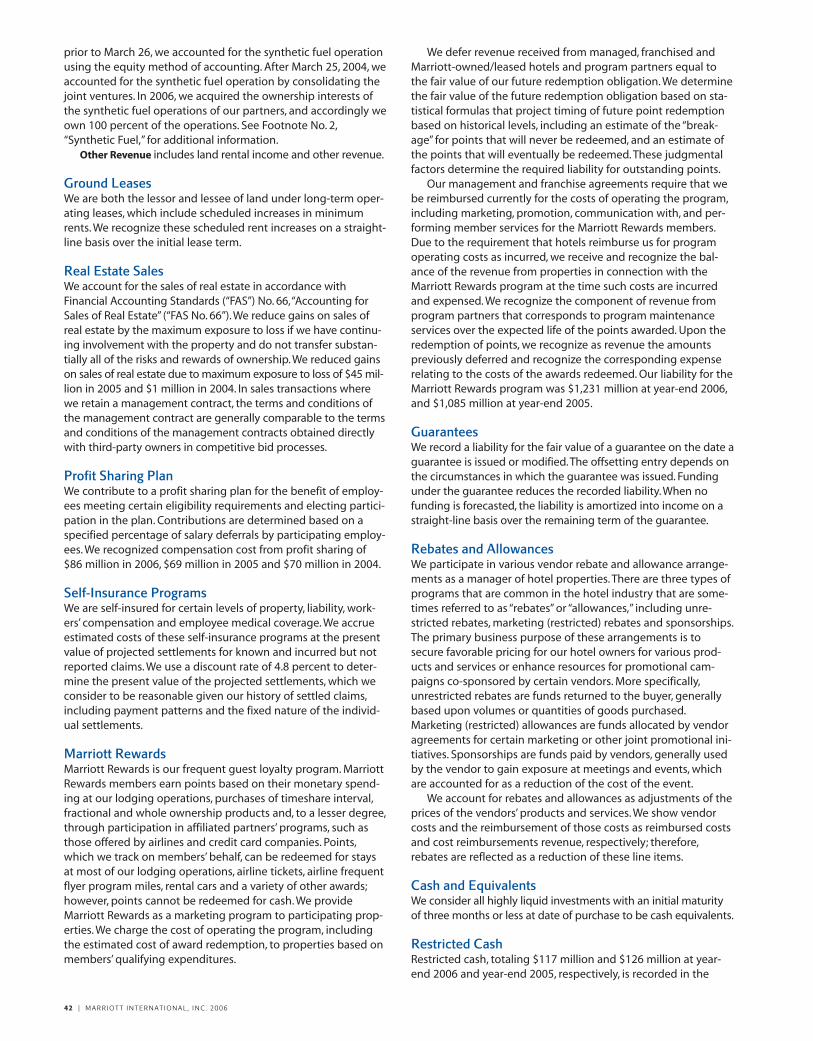
prior to March 26, we accounted for the synthetic fuel operationusing the equity method of accounting. After March 25, 2004, weaccounted for the synthetic fuel operation by consolidating thejoint ventures. In 2006, we acquired the ownership interests ofthe synthetic fuel operations of our partners, and accordingly weown 100 percent of the operations. See Footnote No. 2,“Synthetic Fuel,” for additional information.
Other Revenue includes land rental income and other revenue.
Ground LeasesWe are both the lessor and lessee of land under long-term oper-ating leases, which include scheduled increases in minimumrents. We recognize these scheduled rent increases on a straight-line basis over the initial lease term.
Real Estate SalesWe account for the sales of real estate in accordance withFinancial Accounting Standards (“FAS”) No. 66,“Accounting forSales of Real Estate” (“FAS No. 66”). We reduce gains on sales ofreal estate by the maximum exposure to loss if we have continu-ing involvement with the property and do not transfer substan-tially all of the risks and rewards of ownership. We reduced gainson sales of real estate due to maximum exposure to loss of $45 mil-lion in 2005 and $1 million in 2004. In sales transactions wherewe retain a management contract, the terms and conditions ofthe management contract are generally comparable to the termsand conditions of the management contracts obtained directlywith third-party owners in competitive bid processes.
Profit Sharing PlanWe contribute to a profit sharing plan for the benefit of employ-ees meeting certain eligibility requirements and electing partici-pation in the plan. Contributions are determined based on aspecified percentage of salary deferrals by participating employ-ees. We recognized compensation cost from profit sharing of$86 million in 2006, $69 million in 2005 and $70 million in 2004.
Self-Insurance ProgramsWe are self-insured for certain levels of property, liability, work-ers’ compensation and employee medical coverage. We accrueestimated costs of these self-insurance programs at the presentvalue of projected settlements for known and incurred but notreported claims. We use a discount rate of 4.8 percent to deter-mine the present value of the projected settlements, which weconsider to be reasonable given our history of settled claims,including payment patterns and the fixed nature of the individ-ual settlements.
Marriott RewardsMarriott Rewards is our frequent guest loyalty program. MarriottRewards members earn points based on their monetary spend-ing at our lodging operations, purchases of timeshare interval,fractional and whole ownership products and, to a lesser degree,through participation in affiliated partners’ programs, such asthose offered by airlines and credit card companies. Points,which we track on members’ behalf, can be redeemed for staysat most of our lodging operations, airline tickets, airline frequentflyer program miles, rental cars and a variety of other awards;however, points cannot be redeemed for cash. We provideMarriott Rewards as a marketing program to participating prop-erties. We charge the cost of operating the program, includingthe estimated cost of award redemption, to properties based onmembers’ qualifying expenditures.
We defer revenue received from managed, franchised andMarriott-owned/leased hotels and program partners equal tothe fair value of our future redemption obligation. We determinethe fair value of the future redemption obligation based on sta-tistical formulas that project timing of future point redemptionbased on historical levels, including an estimate of the “break-age” for points that will never be redeemed, and an estimate ofthe points that will eventually be redeemed. These judgmentalfactors determine the required liability for outstanding points.
Our management and franchise agreements require that webe reimbursed currently for the costs of operating the program,including marketing, promotion, communication with, and per-forming member services for the Marriott Rewards members.Due to the requirement that hotels reimburse us for programoperating costs as incurred, we receive and recognize the bal-ance of the revenue from properties in connection with theMarriott Rewards program at the time such costs are incurredand expensed. We recognize the component of revenue fromprogram partners that corresponds to program maintenanceservices over the expected life of the points awarded. Upon theredemption of points, we recognize as revenue the amountspreviously deferred and recognize the corresponding expenserelating to the costs of the awards redeemed. Our liability for theMarriott Rewards program was $1,231 million at year-end 2006,and $1,085 million at year-end 2005.
GuaranteesWe record a liability for the fair value of a guarantee on the date aguarantee is issued or modified. The offsetting entry depends onthe circumstances in which the guarantee was issued. Fundingunder the guarantee reduces the recorded liability. When nofunding is forecasted, the liability is amortized into income on astraight-line basis over the remaining term of the guarantee.
Rebates and AllowancesWe participate in various vendor rebate and allowance arrange-ments as a manager of hotel properties. There are three types ofprograms that are common in the hotel industry that are some-times referred to as “rebates” or “allowances,” including unre-stricted rebates, marketing (restricted) rebates and sponsorships.The primary business purpose of these arrangements is tosecure favorable pricing for our hotel owners for various prod-ucts and services or enhance resources for promotional cam-paigns co-sponsored by certain vendors. More specifically,unrestricted rebates are funds returned to the buyer, generallybased upon volumes or quantities of goods purchased.Marketing (restricted) allowances are funds allocated by vendoragreements for certain marketing or other joint promotional ini-tiatives. Sponsorships are funds paid by vendors, generally usedby the vendor to gain exposure at meetings and events, whichare accounted for as a reduction of the cost of the event.
We account for rebates and allowances as adjustments of theprices of the vendors’ products and services. We show vendorcosts and the reimbursement of those costs as reimbursed costsand cost reimbursements revenue, respectively; therefore,rebates are reflected as a reduction of these line items.
Cash and EquivalentsWe consider all highly liquid investments with an initial maturityof three months or less at date of purchase to be cash equivalents.
Restricted CashRestricted cash, totaling $117 million and $126 million at year-end 2006 and year-end 2005, respectively, is recorded in the
42 | M A R R I O T T I N T E R N A T I O N A L , I N C . 2 0 0 6

“Other long-term assets” line in the accompanying ConsolidatedBalance Sheet. Restricted cash primarily consists of depositsreceived on timeshare interval, fractional and whole ownershipsales that are held in escrow until the contract is closed.
Assets Held for SaleWe consider properties to be assets held for sale when all of thefollowing criteria are met:
3 management commits to a plan to sell a property;
3 it is unlikely that the disposal plan will be significantlymodified or discontinued;
3 the property is available for immediate sale in its presentcondition;
3 actions required to complete the sale of the propertyhave been initiated;
3 sale of the property is probable and we expect the com-pleted sale will occur within one year; and
3 the property is actively being marketed for sale at a pricethat is reasonable given its current market value.
Upon designation as an asset held for sale, we record the car-rying value of each property at the lower of its carrying value orits estimated fair value, less estimated costs to sell, and we stoprecording depreciation expense.
Assets held for sale totaled $411 million at year-end 2006 andconsisted of property and equipment of $391 million, accountsreceivable of $10 million, cash of $6 million and other assets of $4 million. Assets held for sale at year-end 2006 of $411 millionreflected the following segment composition: InternationalLodging-$295 million; Luxury Lodging-$73 million; and NorthAmerican Full-Service Lodging-$43 million. Assets held for saletotaled $555 million at year-end 2005 and consisted of propertyand equipment of $523 million, accounts receivable of $14 million,cash of $13 million and other assets of $5 million. Liabilities ofassets held for sale totaled $102 million at year-end 2006 and con-sisted of debt totaling $81 million, accounts payable of $11 million,accrued payroll and benefits of $8 million and other payables andaccruals totaling $2 million. Liabilities of assets held for sale totaled$30 million at year-end 2005 and consisted of accounts payable of$12 million, debt of $9 million, accrued payroll and benefits of $5 million and other payables and accruals totaling $4 million.
Loan Loss ReservesLodging Senior Loans and Lodging Mezzanine and Other LoansWe measure loan impairment based on the present value ofexpected future cash flows discounted at the loan’s originaleffective interest rate or the estimated fair value of the collateral.For impaired loans, we establish a specific impairment reservefor the difference between the recorded investment in the loanand the present value of the expected future cash flows, thatassumes certain growth projections which may or may notoccur, or the estimated fair value of the collateral. We apply ourloan impairment policy individually to all loans in the portfolioand do not aggregate loans for the purpose of applying suchpolicy. For loans that we have determined to be impaired, werecognize interest income on a cash basis.
Loans to Timeshare OwnersIn conjunction with the adoption of SOP 04-2, we now record anestimate of expected uncollectibility on notes receivable that wereceive from timeshare purchasers as a reduction of revenue atthe time we recognize profit on a timeshare sale. We assessuncollectibility based on pools of receivables, because we holdlarge numbers of homogenous timeshare notes receivable. We
estimate uncollectibles based on historical uncollectibles forsimilar timeshare notes receivable over the past six years. We usea technique referred to as static pool analysis, which tracksuncollectibles for each year’s sales over the life of those notes.
Valuation of GoodwillWe evaluate the fair value of goodwill to assess potential impair-ments on an annual basis, or during the year if an event or othercircumstance indicates that we may not be able to recover thecarrying amount of the asset. We evaluate the fair value of good-will at the reporting unit level and make that determinationbased upon future cash flow projections that assume certaingrowth projections which may or may not occur. We record animpairment loss for goodwill when the carrying value of theintangible asset is less than its estimated fair value.
InvestmentsExcept as otherwise required by FIN 46(R),“Consolidation ofVariable Interest Entities,” we consolidate entities that we con-trol. We account for investments in joint ventures using theequity method of accounting when we exercise significant influ-ence over the venture. If we do not exercise significant influence,we account for the investment using the cost method ofaccounting. We account for investments in limited partnershipsand limited liability companies using the equity method ofaccounting when we own more than a minimal investment. Ourownership interest in these equity method investments variesgenerally from 10 percent to 50 percent.
The fair value of our available-for-sale securities totaled $107 million and $53 million at year-end 2006 and year-end2005, respectively. Gains in accumulated other comprehensiveincome (loss) associated with our available-for-sale securitiestotaled $35 million at year-end 2006 and $8 million at year-end2005. At year-end 2006 and year-end 2005, there were no lossesin accumulated other comprehensive income (loss) associatedwith our available-for-sale securities.
Costs Incurred to Sell Real Estate ProjectsPrior to the adoption of SOP 04-2 at the beginning of the 2006first quarter, we capitalized direct costs incurred to sell realestate projects attributable to and recoverable from the sales oftimeshare interests until the sales were recognized. Costs eligiblefor capitalization followed the guidelines of FAS No. 67,“Accounting for Costs and Initial Rental Operations of Real EstateProjects.” Selling and marketing costs capitalized under thisapproach were approximately $92 million at year-end 2005 andare included in the accompanying Consolidated Balance Sheetin the “Other” caption within the “Current assets” section. UnderSOP 04-2, we charge the majority of sales and marketing costswe incur to sell timeshares to expense when incurred.Accordingly, selling and marketing costs capitalized under thisapproach were approximately $16 million at year-end 2006 andare included in the accompanying Consolidated Balance Sheetin the “Other” caption within the “Current assets” section. See theStatement of Position 04-2,“Accounting for Real Estate Time-Sharing Transactions” caption under the “New AccountingStandards” heading which follows for additional informationregarding the adoption of SOP 04-2. If a contract is canceled, wecharge unrecoverable direct selling and marketing costs toexpense and record deposits forfeited as income.
Residual InterestsWe periodically sell notes receivable originated by our Timesharesegment in connection with the sale of timeshare interval, fractional
M A R R I O T T I N T E R N A T I O N A L , I N C . 2 0 0 6 | 43

and whole ownership products. We retain servicing assets andother interests in the assets transferred to entities that areaccounted for as residual interests. We treat the residual inter-ests, excluding servicing assets, as “trading” securities under theprovisions of FAS No. 115,“Accounting for Certain Investments inDebt and Equity Securities,” (“FAS No. 115”). At the end of eachreporting period, we estimate the fair value of the residual inter-ests, excluding servicing assets, using a discounted cash flowmodel. We report changes in the fair values of these residualinterests, excluding servicing assets, through the accompanyingConsolidated Statement of Income. Servicing assets are classi-fied as held to maturity under the provisions of FAS No. 115 andare recorded at amortized cost.
Derivative InstrumentsWe use derivative instruments as part of our overall strategy tomanage our exposure to market risks associated with fluctua-tions in interest rates, foreign currency exchange rate and, forour synthetic fuel business, oil prices. As a matter of policy, wedo not use derivatives for trading or speculative purposes.
We record all derivatives at fair value either as assets or liabili-ties. We recognize, currently in earnings, changes in fair value ofderivatives not designated as hedging instruments and of deriva-tives designated as fair value hedging instruments. Changes inthe fair value of the hedged item in a fair value hedge arerecorded as an adjustment to the carrying amount of the hedgeditem and recognized in earnings in the same income statementline item as the change in the fair value of the derivative.
We record the effective portion of changes in fair value ofderivatives designated as cash flow hedging instruments as acomponent of other comprehensive income and report the inef-fective portion currently in earnings. We reclassify amountsincluded in other comprehensive income into earnings in thesame period during which the hedged item affects earnings.
Foreign OperationsThe U.S. dollar is the functional currency of our consolidated andunconsolidated entities operating in the United States. The func-tional currency for our consolidated and unconsolidated entitiesoperating outside of the United States is generally the currencyof the primary economic environment in which the entity prima-rily generates and expends cash. For consolidated entities whosefunctional currency is not the U.S. dollar, we translate their finan-cial statements into U.S. dollars, and we do the same, as needed,for unconsolidated entities whose functional currency is not theU.S. dollar. We translate assets and liabilities at the exchange ratein effect as of the financial statement date, and income state-ment accounts are translated using the weighted averageexchange rate for the period. We include translation adjustmentsfrom foreign exchange and the effect of exchange rate changeson intercompany transactions of a long-term investment natureas a separate component of shareholders’ equity. We reportgains and losses from foreign exchange rate changes related tointercompany receivables and payables that are not of a long-term investment nature, as well as gains and losses from foreigncurrency transactions, currently in operating costs and expenses,and those amounted to a $6 million gain in 2006 and losses of$5 million and $3 million in 2005 and 2004, respectively.
New Accounting StandardsStatement of Position 04-2, “Accounting for Real Estate Time-Sharing Transactions”In December 2004, the Financial Accounting Standards Board(“FASB”) issued FAS No. 152 “Accounting for Real Estate
Time-Sharing Transactions-an amendment to FASB StatementsNo. 66 and 67” and the American Institute of Certified PublicAccountants issued SOP 04-2. Additionally, the FASB amendedFAS No. 66,“Accounting for Sales of Real Estate” and FAS No. 67,“Accounting for Costs and Initial Rental Operations of Real EstateProjects” (“FAS No. 67”), to exclude accounting for real estatetime-sharing transactions from these statements. We adoptedSOP 04-2 at the beginning of the 2006 first quarter.
Under SOP 04-2, we charge the majority of sales and market-ing costs we incur to sell timeshares to expense when incurred.We also record an estimate of expected uncollectibility on notesreceivable that we receive from timeshare purchasers as a reduc-tion of revenue at the time that we recognize profit on a time-share sale. We also account for rental and other operationsduring holding periods as incidental operations, which requiresus to record any excess of revenues over costs as a reduction ofinventory costs.
The initial adoption of SOP 04-2 in our 2006 first quarter,which we reported as a cumulative effect of change in account-ing principle in our Consolidated Statement of Income, resultedin a non-cash after-tax charge of $105 million ($0.24 per dilutedshare). As a result of tax rate adjustments in the 2006 fourthquarter, we reduced the tax benefit associated with the initialadoption from $68 million to $64 million. Accordingly, the after-tax impact of the adoption was $109 million ($0.25 per dilutedshare). As a result of the change,“Net Income” of $65 million($0.15 per diluted share) as reported in the 2006 first quarter,now totals $61 million ($0.14 per diluted share). The pre-taxcharge totaled $173 million and comprised a $130 million inven-tory write-down, the establishment of a $25 million notes receiv-able reserve and an increase in current liabilities of $18 million.We estimate that the ongoing impact of adoption in subsequentperiods will be immaterial.
We estimate that, for the 20-year period from 2007 through2026, the cost of completing improvements and currentlyplanned amenities for our owned timeshare properties will beapproximately $1.9 billion.
FAS No. 123 (revised 2004), “Share-Based Payment”In December 2004, the FASB issued FAS No. 123 (revised 2004),“Share-Based Payment” (“FAS No. 123(R)”), which is a revision ofFAS No. 123,“Accounting for Stock-Based Compensation.” FAS No.123(R) supersedes Accounting Principles Boards (“APB”) Opinion25,“Accounting for Stock Issued to Employees,” (“APB Opinion No.25”) and amends FAS No. 95,“Statement of Cash Flows.”Weadopted FAS No. 123(R) using the modified prospective transitionmethod at the beginning of our 2006 first quarter. See FootnoteNo. 4,“Share-Based Compensation,” for additional information.
Future Adoption of Accounting StandardsIn July 2006, the FASB issued FASB Interpretation No. 48,“Accounting for Uncertainty in Income Taxes” (“FIN 48”). FIN 48 isan interpretation of FASB Statement No. 109,“Accounting forIncome Taxes,” and it seeks to reduce the diversity in practiceassociated with certain aspects of measurement and recognitionin accounting for income taxes. FIN 48 prescribes a recognitionthreshold and measurement attribute for the financial statementrecognition and measurement of a tax position taken orexpected to be taken in a tax return. Additionally, FIN 48 providesguidance on de-recognition, classification, interest and penalties,accounting in interim periods, disclosure and transition. FIN 48 iseffective for fiscal years beginning after December 15, 2006,which is our 2007 fiscal year, and its provisions are to be appliedto all tax positions upon initial adoption. Upon adoption of
44 | M A R R I O T T I N T E R N A T I O N A L , I N C . 2 0 0 6

FIN 48, only tax positions that meet a “more likely than not”threshold at the effective date may be recognized or continue tobe recognized. The cumulative effect of applying FIN 48, if any, isto be reported as an adjustment to the opening balance ofretained earnings in the year of adoption. We are evaluating theimpact that FIN 48 will have on our financial statements.
In March 2006, the FASB issued FAS No. 156,“Accounting forServicing of Financial Assets” (“FAS No. 156”). FAS No. 156requires that all separately recognized servicing assets and liabil-ities are to be initially measured at fair value. It also allows enti-ties to subsequently elect fair value measurement for itsservicing assets and liabilities. This standard is effective for thefirst fiscal year beginning after September 15, 2006, which is our2007 fiscal year. We have determined that FAS No. 156 will nothave a material impact on our financial statements.
In September 2006, the FASB issued FAS No. 157,“Fair ValueMeasurements” (“FAS No. 157”). This standard defines fair value,establishes a methodology for measuring fair value and expandsthe required disclosure for fair value measurements. FAS No. 157is effective for fiscal years beginning after November 15, 2007,which is our 2008 fiscal year. Provisions of FAS No. 157 arerequired to be applied prospectively as of the beginning of thefirst fiscal year in which FAS No. 157 is applied. We are evaluatingthe impact that FAS No. 157 will have on our financial statements.
In November 2006, the Emerging Issues Task Force of FASB(“EITF”) reached a consensus on EITF Issue No. 06-8,“Applicabilityof the Assessment of a Buyer’s Continuing Investment underFASB Statement No. 66, Accounting for Sales of Real Estate, forSales of Condominiums” (“EITF 06-8”). EITF 06-8 will require con-dominium sales to meet the continuing investment criterion inFAS No. 66 in order for profit to be recognized under the percent-age of completion method. EITF 06-8 will be effective for annualreporting periods beginning after March 15, 2007, which is our2008 fiscal year. The cumulative effect of applying EITF 06-8, ifany, is to be reported as an adjustment to the opening balance ofretained earnings in the year of adoption. We are evaluating theimpact that EITF 06-8 will have on our financial statements.
2 | SYNTHETIC FUEL
OperationsOur synthetic fuel operation currently consists of four coal-based synthetic fuel production facilities (the “Facilities”), two ofwhich are located at a coal mine in Saline County, Illinois, one ofwhich is located at a coal mine in Jefferson County, Alabama,and one of which is located at a coal mine near Evansville,Indiana. Three of the four plants are held in one entity, SyntheticAmerican Fuel Enterprises II, LLC (“SAFE II”), and one of theplants is held in a separate entity, Synthetic American FuelEnterprises I, LLC (“SAFE I”). Section 45K of the Internal RevenueCode (“Section 45K of the IRC”) (Section 29 for fiscal years priorto 2006) provides tax credits for the production and sale of syn-thetic fuels produced from coal through 2007 (credits are notavailable for fuel produced after 2007). Although the Facilitiesincur significant losses, these losses are more than offset by thetax credits generated under Section 45K of the IRC, whichreduce our income tax expense. During 2006, the Indiana facil-ity was relocated from Alabama. The relocation of the plant wascompleted in the 2006 third quarter. In late February 2006, anexplosion occurred at our Alabama feedstock supplier’s under-ground coal mine. Several months following the explosion, themine was reopened with a limited amount of production.However, at year-end 2006 the mine was again closed by ourfeedstock supplier. As a result of the mine closure, production at
the one plant remaining in Alabama was suspended at year-end 2006.
At each of our locations, the synthetic fuel operation has siteleases at sites that are adjacent to large mines, and in the case ofour Alabama operation, a barge load-out facility on a navigableriver. In addition, at each of the locations, the synthetic fuel oper-ation has coal purchase agreements with the owners of theadjacent coal mines and synthetic fuel sales contracts with anumber of major utilities, including the Tennessee ValleyAuthority and Tampa Electric Company. With respect to theIllinois location, the synthetic fuel operation has agreements topurchase coal and sell synthetic fuel through 2007 covering atleast 50 percent of the annual productive capacity of theFacilities at that location. From time to time, the Illinois syntheticfuel operation supplements these base contracts, as opportuni-ties arise, by entering into spot contracts to buy coal and sellsynthetic fuel to different end users. With respect to the Indianalocation, the synthetic fuel operation has entered into agree-ments to purchase coal and sell synthetic fuel to a number ofmajor utilities through the end of 2007. The agreements to pur-chase coal and sell synthetic fuel can generally be canceled byus in the event that we choose not to operate the Facilities, or ifthe synthetic fuel produced at the Facilities does not qualify fortax credits under Section 45K of the IRC or in the event of aphase-out of tax credits under Section 45K of the IRC.
Although we anticipate that the coal mines adjacent to thesynthetic fuel operation’s production sites in Illinois and Indianawill be able to fulfill those Facilities’ requirements for feedstockcoal, if our feedstock suppliers become unable to supply theIllinois and Indiana Facilities with enough coal to satisfy ourrequirements for any reason, we would have to curtail produc-tion, which would have a negative impact on our results of oper-ations, or negotiate new coal supply agreements with thirdparties, which might not be available on similar terms. In addi-tion, the synthetic fuel operation has synthetic fuel sale con-tracts with a number of customers who have contracted topurchase in excess of 10 percent of the productive capacity atour Alabama, Illinois and Indiana locations. Although we expectthat those customers could be replaced by other purchasers, wecannot assure that we would be able to enter into replacementcontracts on equivalent terms. As a result, the failure by one ormore of those customers to perform their purchase obligationsunder those sale contracts could have a material adverse effecton the synthetic fuel operation.
The synthetic fuel operation has an operations and mainte-nance agreement with an experienced manager of syntheticfuel facilities. This manager is responsible for staffing theFacilities, operating and maintaining the machinery and con-ducting routine maintenance on behalf of the synthetic fueloperation. Finally, the synthetic fuel operation has a license andbinder purchase agreement with Headwaters Incorporated,which permits the operation to utilize a carboxylated poly-styrene copolymer emulsion patented by Headwaters and man-ufactured by Dow Chemical that is mixed with coal to produce aqualified synthetic fuel.
As discussed in greater detail below in Footnote No. 18,“Contingencies,” under the heading “Synthetic Fuel,” the taxcredits available under Section 45K of the IRC for the productionand sale of synthetic fuel in any given year are phased out if oilprices in that year are above certain thresholds. As a result ofhigh oil prices in the first several weeks of 2006, we elected tosuspend production of synthetic fuel in mid-January 2006. OnFebruary 17, 2006, we restarted production and entered into
M A R R I O T T I N T E R N A T I O N A L , I N C . 2 0 0 6 | 45
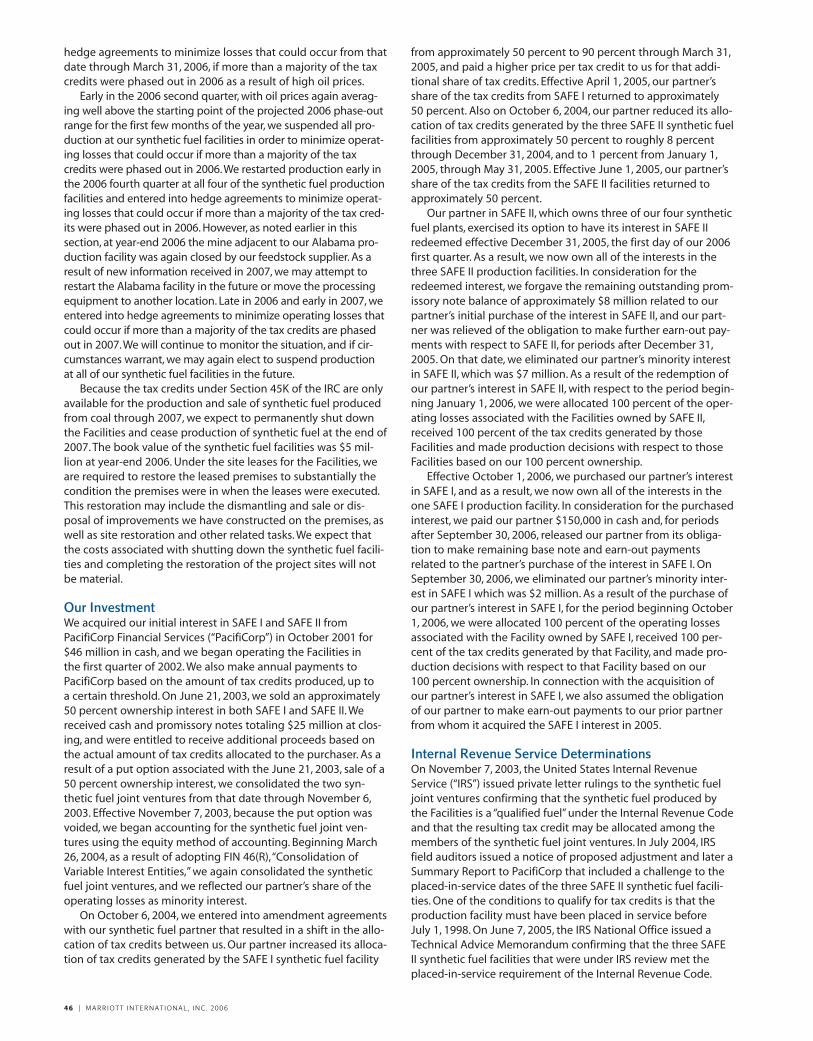
hedge agreements to minimize losses that could occur from thatdate through March 31, 2006, if more than a majority of the taxcredits were phased out in 2006 as a result of high oil prices.
Early in the 2006 second quarter, with oil prices again averag-ing well above the starting point of the projected 2006 phase-outrange for the first few months of the year, we suspended all pro-duction at our synthetic fuel facilities in order to minimize operat-ing losses that could occur if more than a majority of the taxcredits were phased out in 2006.We restarted production early inthe 2006 fourth quarter at all four of the synthetic fuel productionfacilities and entered into hedge agreements to minimize operat-ing losses that could occur if more than a majority of the tax cred-its were phased out in 2006. However, as noted earlier in thissection, at year-end 2006 the mine adjacent to our Alabama pro-duction facility was again closed by our feedstock supplier. As aresult of new information received in 2007, we may attempt torestart the Alabama facility in the future or move the processingequipment to another location. Late in 2006 and early in 2007, weentered into hedge agreements to minimize operating losses thatcould occur if more than a majority of the tax credits are phasedout in 2007.We will continue to monitor the situation, and if cir-cumstances warrant, we may again elect to suspend productionat all of our synthetic fuel facilities in the future.
Because the tax credits under Section 45K of the IRC are onlyavailable for the production and sale of synthetic fuel producedfrom coal through 2007, we expect to permanently shut downthe Facilities and cease production of synthetic fuel at the end of2007. The book value of the synthetic fuel facilities was $5 mil-lion at year-end 2006. Under the site leases for the Facilities, weare required to restore the leased premises to substantially thecondition the premises were in when the leases were executed.This restoration may include the dismantling and sale or dis-posal of improvements we have constructed on the premises, aswell as site restoration and other related tasks. We expect thatthe costs associated with shutting down the synthetic fuel facili-ties and completing the restoration of the project sites will notbe material.
Our InvestmentWe acquired our initial interest in SAFE I and SAFE II fromPacifiCorp Financial Services (“PacifiCorp”) in October 2001 for$46 million in cash, and we began operating the Facilities in the first quarter of 2002. We also make annual payments toPacifiCorp based on the amount of tax credits produced, up to a certain threshold. On June 21, 2003, we sold an approximately50 percent ownership interest in both SAFE I and SAFE II. Wereceived cash and promissory notes totaling $25 million at clos-ing, and were entitled to receive additional proceeds based onthe actual amount of tax credits allocated to the purchaser. As aresult of a put option associated with the June 21, 2003, sale of a50 percent ownership interest, we consolidated the two syn-thetic fuel joint ventures from that date through November 6,2003. Effective November 7, 2003, because the put option wasvoided, we began accounting for the synthetic fuel joint ven-tures using the equity method of accounting. Beginning March26, 2004, as a result of adopting FIN 46(R),“Consolidation ofVariable Interest Entities,” we again consolidated the syntheticfuel joint ventures, and we reflected our partner’s share of theoperating losses as minority interest.
On October 6, 2004, we entered into amendment agreementswith our synthetic fuel partner that resulted in a shift in the allo-cation of tax credits between us. Our partner increased its alloca-tion of tax credits generated by the SAFE I synthetic fuel facility
from approximately 50 percent to 90 percent through March 31,2005, and paid a higher price per tax credit to us for that addi-tional share of tax credits. Effective April 1, 2005, our partner’sshare of the tax credits from SAFE I returned to approximately50 percent. Also on October 6, 2004, our partner reduced its allo-cation of tax credits generated by the three SAFE II synthetic fuelfacilities from approximately 50 percent to roughly 8 percentthrough December 31, 2004, and to 1 percent from January 1,2005, through May 31, 2005. Effective June 1, 2005, our partner’sshare of the tax credits from the SAFE II facilities returned toapproximately 50 percent.
Our partner in SAFE II, which owns three of our four syntheticfuel plants, exercised its option to have its interest in SAFE IIredeemed effective December 31, 2005, the first day of our 2006first quarter. As a result, we now own all of the interests in thethree SAFE II production facilities. In consideration for theredeemed interest, we forgave the remaining outstanding prom-issory note balance of approximately $8 million related to ourpartner’s initial purchase of the interest in SAFE II, and our part-ner was relieved of the obligation to make further earn-out pay-ments with respect to SAFE II, for periods after December 31,2005. On that date, we eliminated our partner’s minority interestin SAFE II, which was $7 million. As a result of the redemption ofour partner’s interest in SAFE II, with respect to the period begin-ning January 1, 2006, we were allocated 100 percent of the oper-ating losses associated with the Facilities owned by SAFE II,received 100 percent of the tax credits generated by thoseFacilities and made production decisions with respect to thoseFacilities based on our 100 percent ownership.
Effective October 1, 2006, we purchased our partner’s interestin SAFE I, and as a result, we now own all of the interests in theone SAFE I production facility. In consideration for the purchasedinterest, we paid our partner $150,000 in cash and, for periodsafter September 30, 2006, released our partner from its obliga-tion to make remaining base note and earn-out paymentsrelated to the partner’s purchase of the interest in SAFE I. OnSeptember 30, 2006, we eliminated our partner’s minority inter-est in SAFE I which was $2 million. As a result of the purchase ofour partner’s interest in SAFE I, for the period beginning October1, 2006, we were allocated 100 percent of the operating lossesassociated with the Facility owned by SAFE I, received 100 per-cent of the tax credits generated by that Facility, and made pro-duction decisions with respect to that Facility based on our 100 percent ownership. In connection with the acquisition of our partner’s interest in SAFE I, we also assumed the obligationof our partner to make earn-out payments to our prior partnerfrom whom it acquired the SAFE I interest in 2005.
Internal Revenue Service DeterminationsOn November 7, 2003, the United States Internal RevenueService (“IRS”) issued private letter rulings to the synthetic fueljoint ventures confirming that the synthetic fuel produced bythe Facilities is a “qualified fuel” under the Internal Revenue Codeand that the resulting tax credit may be allocated among themembers of the synthetic fuel joint ventures. In July 2004, IRSfield auditors issued a notice of proposed adjustment and later aSummary Report to PacifiCorp that included a challenge to theplaced-in-service dates of the three SAFE II synthetic fuel facili-ties. One of the conditions to qualify for tax credits is that theproduction facility must have been placed in service before July 1, 1998. On June 7, 2005, the IRS National Office issued aTechnical Advice Memorandum confirming that the three SAFEII synthetic fuel facilities that were under IRS review met theplaced-in-service requirement of the Internal Revenue Code.
46 | M A R R I O T T I N T E R N A T I O N A L , I N C . 2 0 0 6

3 | INCOME TAXES
See the “Future Adoption of Accounting Standards” caption inFootnote No. 1,“Summary of Significant Accounting Policies,” forinformation regarding the future adoption of FIN 48.
Total deferred tax assets and liabilities as of year-end 2006,and year-end 2005, were as follows:
($ in millions) 2006 2005
Deferred tax assets $1,042 $ 932
Deferred tax liabilities (177) (167)
Net deferred taxes $ 865 $ 765
The tax effect of each type of temporary difference and carry-forward that gives rise to a significant portion of deferred taxassets and liabilities as of year-end 2006, and year-end 2005,were as follows:
($ in millions) 2006 2005
Self-insurance $ 36 $ 33
Employee benefits 250 232
Deferred income 34 42
Other reserves 52 64
Frequent guest program 75 94
Tax credits (primarily associated with synthetic fuel) 383 345
Net operating loss carry-forwards 126 99
Timeshare financing (37) (25)
Property, equipment and intangible assets (32) (50)
Other, net 12 (25)
Deferred taxes 899 809
Less: valuation allowance (34) (44)
Net deferred taxes $865 $765
At year-end 2006, we had approximately $98 million of taxcredits that expire through 2026, $285 million of tax credits thatdo not expire and $576 million of net operating losses, of which$320 million expire through 2025. The valuation allowancedecreased due to foreign net operating losses that we believewill be realized and the expiration of state net operating losses.
We have made no provision for U.S. income taxes or addi-tional foreign taxes on the cumulative unremitted earnings ofnon-U.S. subsidiaries ($572 million as of year-end 2006) becausewe consider these earnings to be permanently invested. Theseearnings could become subject to additional taxes if remitted asdividends, loaned to us or a U.S. affiliate or if we sold our inter-ests in the affiliates. We cannot practically estimate the amountof additional taxes that might be payable on the unremittedearnings. We conduct business in countries that grant a “holiday”from income taxes for 10- and 30-year periods. The holidaysexpire through 2034. The aggregate amount of taxes notincurred due to tax “holidays” and the related earnings per shareimpacts are $24 million ($0.06 per diluted share), $18 million($0.04 per diluted share), and $14 million ($0.03 per dilutedshare) for 2006, 2005 and 2004, respectively.
The (provision for) benefit from income taxes consists of:
($ in millions) 2006 2005 2004
Current – Federal $(229) $(207) $(153)
– State (57) (52) (34)
– Foreign (56) (35) (29)
(342) (294) (216)
Deferred – Federal 37 173 90
– State 1 19 5– Foreign 18 8 21
56 200 116
$(286) $ (94) $(100)
The current tax provision does not reflect the benefits attrib-utable to us relating to the exercise of employee stock options of$193 million in 2006, $87 million in 2005 and $79 million in 2004.Included in the above amounts are tax credits of $66 million in2006, $172 million in 2005 and $148 million in 2004. The taxesapplicable to other comprehensive income are not material.
A reconciliation of the U.S. statutory tax rate to our effectiveincome tax rate for continuing operations follows:
2006 2005 2004
U.S. statutory tax rate 35.0)% 35.0)% 35.0)%
State income taxes, net of U.S.tax benefit 2.9 3.0 2.9
Minority interest 0.2 2.3 2.4
Change in deferred taxes 1.1 — 2.2
Change in valuation allowance (2.1) 1.6 (3.3)
Foreign income (2.0) (4.6) (1.4)
Tax credits (primarily associated with synthetic fuel) (6.7) (24.1) (22.6)
Other, net 0.3 0.1 0.1
Effective rate 28.7)% 13.3)% 15.3)%
Cash paid for income taxes, net of refunds, was $169 millionin 2006, $182 million in 2005 and $164 million in 2004. Tax cred-its contributed by our synthetic fuel operations have signifi-cantly reduced our effective tax rate during the last severalyears. Because that program ends with 2007 synthetic fuel pro-duction, our synthetic fuel production facilities will not be ableto generate credits in future years. As a result, our future effec-tive tax rate is likely to increase significantly, thereby reducingour after-tax profits.
4 | SHARE-BASED COMPENSATION
Under our 2002 Comprehensive Stock and Cash Incentive Plan(“the Comprehensive Plan”), we currently award to participatingemployees (1) stock options to purchase our Class A CommonStock (“Stock Option Program”), (2) share appreciation rights forour Class A Common Stock, and (3) restricted stock units of ourClass A Common Stock.
As noted in Footnote No. 1,“Basis of Presentation” under the“New Accounting Pronouncements” heading, we adopted FASNo. 123(R) using the modified prospective transition method atthe beginning of our 2006 first quarter. In accordance with themodified prospective transition method, we did not restate ourConsolidated Financial Statements for prior periods to reflectthe impact of FAS No. 123(R). For all share-based awards granted
M A R R I O T T I N T E R N A T I O N A L , I N C . 2 0 0 6 | 47

after the date we adopted FAS No. 123(R) and for the unvestedportion of previously granted share-based awards that were out-standing on that date, FAS No. 123(R) requires that we measurecompensation costs related to our share-based payment trans-actions at fair value on the grant date and that we recognizethose costs in the financial statements over the vesting periodduring which the employee provides service in exchange for theaward. Previously, under FAS No. 123 and APB Opinion No. 25, weaccounted for our share-based employee compensation plansusing the intrinsic value method under the recognition andmeasurement principles of APB Opinion No. 25 and recognizedshare-based compensation expense for all awards except for ourStock Option Program awards. Share-based compensationexpense related to award grants totaled $62 million and $47 mil-lion for 2005 and 2004, respectively.
Under FAS No. 123(R), we recorded share-based compensa-tion expense of $108 million in 2006. Deferred compensationcosts related to unvested awards totaled $168 million atDecember 29, 2006, and the weighted average period overwhich the costs are expected to be recognized is two years.Deferred compensation costs related to unvested awardstotaled $137 million at December 30, 2005.
The following table illustrates the effect on net income andearnings per share as if we had applied the fair value recognitionprovisions of FAS No. 123 to share-based employee compensa-tion in 2005 and 2004. We have included the impact of measuredbut unrecognized compensation costs and excess tax benefitscredited to additional paid-in-capital in the calculation of dilutedpro forma shares. In addition, we have included the estimatedimpact of reimbursements from third parties. The reported andpro forma net income and earnings per share figures for 2006 inthe table are the same because share-based compensationexpense is calculated under the provisions of FAS No. 123(R). The2006 amounts are included in the table below to provide detailfor comparative purposes to the 2005 and 2004 amounts.
($ in millions, except per share amounts) 2006 2005 2004
Net income, as reported $ 608 $ 669 $ 596
Add: Share-based employee compensation expense included in reported net income, net of related tax effects of related tax effects 70 40 31
Deduct: Total share-based employee compensation expense determined under fair value-based method for all awards, net of related tax effects and estimated reimbursed costs (70) (61) (58)
Pro forma net income $ 608 $ 648 $ 569
Earnings per share:
Basic-as reported $1.50 $1.55 $1.31
Basic-pro forma $1.50 $1.50 $1.26
Diluted-as reported $1.41 $1.45 $1.24
Diluted-pro forma $1.41 $1.40 $1.18
FAS No. 123(R) requires that share-based compensationexpense be recognized over the period from the grant date tothe date on which the award is no longer contingent on theemployee providing additional service (the “substantive vestingperiod”). In periods prior to the adoption of FAS No. 123(R), weshowed share-based compensation expense in our pro formadisclosure only for option awards to retirement-eligible employees
over the awards’ stated vesting period. In periods prior to theadoption of FAS No. 123(R), we recorded share-based compensa-tion expense for our other awards to retirement-eligible employ-ees over the awards’ stated vesting period. With the adoption ofFAS No. 123(R), we continue to follow the stated vesting periodfor the unvested portion of awards granted prior to adoption ofFAS No. 123(R) and follow the substantive vesting period forawards granted after the adoption of FAS No. 123(R).
In connection with the adoption of FAS No. 123(R), wereviewed, among other things, our forfeiture and volatilityassumptions. Estimated volatilities for 2006 were based on thehistorical share-price volatility for a period equal to the stockoption’s or share appreciation right’s expected lives, ending onthe day of grant, and calculated based on weekly data. Theweighted average expected stock option or share appreciationright terms for 2006 were a product of the lattice-based bino-mial valuation model that uses suboptimal exercise factors tocalculate the expected terms. In August 2005, the Board ofDirectors amended the Comprehensive Plan to provide partici-pants the ability, during a limited time frame in 2005, to elect toaccelerate the schedule for distribution of certain vesteddeferred shares. The amendment did not alter the previouslyestablished vesting schedule. In 2005 we also changed fromusing the Black-Scholes option pricing method to estimate thefair value of each stock option or share appreciation right on thegrant date, to using the binomial valuation method to improvethe estimate of fair value.
In 2005, we changed the method in which we issue share-based awards to our key employees. In prior years, share-basedcompensation for key employees consisted primarily of stockoptions. Upon consideration of several factors, we began in 2005to award key employees a combination of stock options andrestricted stock units. Therefore, this change resulted in anincrease in restricted stock expense.
The adoption of FAS No. 123(R) in 2006 resulted in the recog-nition of incremental share-based compensation costs in 2006of $39 million, a reduction in net income of $25 million (net oftax benefits of $14 million) and a reduction of both basic anddiluted earnings per share of $0.06. In accordance with FAS No.123(R), we present the tax benefits resulting from the exercise ofshare-based awards as financing cash flows. Prior to the adop-tion of FAS No. 123(R), we reported the tax benefits resultingfrom the exercise of share-based awards as operating cash flows.The adoption of FAS No. 123(R) resulted in a decrease in 2006 of$193 million in cash flows from operating activities and anincrease of $193 million in cash flows from financing activitiesrelated to excess tax benefits from share-based awards. Theaggregate amount of cash we received from the exercise ofstock options granted under share-based payment arrange-ments was $184 million, $125 million, and $206 million for 2006,2005 and 2004, respectively.
We issue restricted stock units under the ComprehensivePlan to certain officers and key employees and those units vestgenerally over four years in annual installments commencingone year after the date of grant. We recognize compensationexpense for the restricted stock units over the service periodequal to the fair market value of the stock units on the date ofissuance. Upon vesting, restricted stock units convert to sharesand are distributed from treasury shares. At year-end 2006 andyear-end 2005, there was approximately $138 million and $123 million, respectively, in deferred compensation costs relatedto restricted stock units. Share-based compensation expenseassociated with restricted stock units was $77 million, $52 mil-lion, and $35 million for 2006, 2005 and 2004, respectively. The
48 | M A R R I O T T I N T E R N A T I O N A L , I N C . 2 0 0 6

weighted average remaining term was two years for restrictedstock unit grants outstanding at year-end 2006. The aggregateintrinsic value of restricted stock units converted and distributedduring 2006, 2005 and 2004, was $78 million, $52 million, and$21 million, respectively. The weighted average grant-date fairvalues of restricted stock units granted in 2006, 2005 and 2004were $35, $32 and $23, respectively.
Changes in our restricted stock unit grants in 2006 wereas follows:
Number of WeightedRestricted Average
Stock Units Grant-Date(in millions) Fair Value
Outstanding at year-end 2005 6.9 $25
Granted during 2006 3.2 35
Distributed during 2006 (2.2) 23
Forfeited during 2006 (0.3) 27
Outstanding at year-end 2006 7.6 30
Employee stock options may be granted to officers and keyemployees at exercise prices or strike prices equal to the marketprice of our Class A Common Stock on the date of grant. Non-qualified options generally expire 10 years after the date of
grant, except those issued from 1990 through 2000, whichexpire 15 years after the date of the grant. Most stock optionsunder the Stock Option Program are exercisable in cumulativeinstallments of one quarter at the end of each of the first fouryears following the date of grant.
We recognized compensation expense of $22 million in 2006associated with employee stock options. We did not recognizeany compensation expense associated with employee stockoptions in 2005 or 2004. At year-end 2006, there was approxi-mately $18 million in deferred compensation costs related toemployee stock options. Upon the exercise of stock options,shares are issued from treasury shares.
Changes in our Stock Option Program awards in 2006 wereas follows:
Number of WeightedOptions Average
(in millions) Exercise Price
Outstanding at year-end 2005 56.8 $16
Granted during 2006 — 34
Exercised during 2006 (12.8) 14
Forfeited during 2006 (0.1) 19
Outstanding at year-end 2006 43.9 17
M A R R I O T T I N T E R N A T I O N A L , I N C . 2 0 0 6 | 49
Stock options issued under the Stock Option Program awards outstanding at year-end 2006, were as follows:
Outstanding ExercisableNumber of Weighted Average Weighted Number of Weighted Weighted Average
Range of Stock Options Remaining Life Average Stock Options Average Remaining LifeExercise Prices (in millions) (in years) Exercise Price (in millions) Exercise Price (in years)
$ 3 to $ 5 0.9 1 $ 4 0.9 $ 4 1
$ 6 to $ 8 3.1 3 7 3.1 7 3
$ 9 to $12 2.1 5 11 2.1 11 5
$13 to $18 25.2 7 15 23.0 15 7
$19 to $25 11.2 8 22 9.4 22 8
$26 to $35 1.4 9 32 0.3 32 9
$ 3 to $35 43.9 7 17 38.8 16 6
The weighted average grant-date fair value of the 24,000options granted in 2006 was $13, and the options had a weightedaverage exercise price of $34. The weighted average grant-datefair value of the 1.4 million options granted in 2005 was $13. Theweighted average grant-date fair value of the 7.0 million optionsgranted in 2004 was $8. The total intrinsic value of options out-standing at year-end 2006 was $1,368 million, and the totalintrinsic value for stock options exercisable as of year-end 2006,was $1,233 million. The total intrinsic value of stock options exer-cised during 2006, 2005 and 2004 was approximately $309 mil-lion, $173 million and $182 million, respectively.
Employee share appreciation rights (“Employee SARs”) may begranted to officers and key employees at exercise prices or strikeprices equal to the market price of our Class A Common Stock onthe date of grant. Employee SARs expire 10 years after the date ofgrant and generally both vest and are exercisable in cumulativeinstallments of one quarter at the end of each of the first fouryears following the date of grant. Non-employee share apprecia-tion rights (“Non-employee SARs”) may be granted to directors atexercise prices or strike prices equal to the market price of ourClass A Common Stock on the date of grant. Non-employee SARs
expire 10 years after the date of grant and vest upon grant; how-ever they are generally not exercisable until one year after grant.We first began issuing share appreciation rights in 2006.Employees or Non-employee directors shall receive a number ofshares of Common Stock of the Company equal to the number ofshare appreciation rights that are being exercised multiplied bythe quotient of (a) the final value minus the base value, divided by(b) the final value.
We recognized compensation expense of $3 million for 2006associated with Employee SARs and Non-employee SARs. At theend of 2006, there was approximately $4 million in deferred com-pensation costs related to share appreciation rights. Upon theexercise of share appreciation rights, shares are issued from treas-ury shares. During 2006, we granted 0.5 million Employee SARswith a weighted average base value of $34 and a weighted aver-age grant-date fair value of $13, and we also granted 8,000 Non-employee SARs with a weighted average base value of $37 and aweighted average grant-date fair value of $18. No share apprecia-tion rights have expired or been forfeited.The total intrinsic valueof SARs outstanding at year-end 2006 was $7 million, and the totalintrinsic value of SARs exercisable as of year-end 2006 was zero.

In 2004, we estimated the fair value of each stock optiongranted on the date of grant using the Black-Scholes option-pricing method. Beginning in 2005 we began using a binomialmethod to estimate the fair value of each stock option or SARgranted. The assumptions for stock options for all years andemployee SARs for 2006 are noted in the following table:
2006 2005 2004
Annual dividends $0.22 $0.18 $0.16
Expected volatility 30% 30% 31%
Risk-free interest rate 4.5% 4.1% 3.7%
Expected life (in years) 7 8 7
For Non-employee SARs issued in 2006, the only differencesin the assumptions versus employee SARs are that a risk-freeinterest rate of 5.0 percent was used and an expected life of 10 years was used.
We also issue deferred stock units to Non-employee direc-tors. These Non-employee director deferred stock units vestwithin one year and are distributed upon election. At year-end2006 and year-end 2005, there was approximately $152,000 and$149,000, respectively, in deferred costs related to Non-employee director deferred stock units. We recognized share-based expense associated with Non-employee director deferredstock units of $325,000, $593,000, and $503,000 for 2006, 2005and 2004, respectively. During 2006 we granted 18,000 Non-employee director deferred stock units with a weighted averagegrant-date fair value of $37. For each of 2005 and 2004, wegranted 21,000 Non-employee director deferred stock units withweighted average grant-date fair values of $32 and $23, respec-tively. The aggregate intrinsic value of Non-employee directordeferred stock units distributed during 2006, 2005 and 2004, was$1.7 million, $0.2 million and $10,000, respectively. At year-end2006 and year-end 2005, there were 203,000 and 231,000,respectively, Non-employee deferred stock units outstanding,and the weighted average grant-date fair value of those out-standing deferred stock units was $21 and $19, respectively.
Although the Comprehensive Plan also provides for issuanceof deferred stock bonus awards, deferred stock awards, andrestricted stock awards, our Compensation Policy Committeeindefinitely suspended the issuance of deferred bonus stockcommencing with our 2001 fiscal year and the issuance of bothdeferred stock awards and restricted stock awards commencingwith the 2003 fiscal year. At year-end 2006 and year-end 2005,there was approximately $8 million and $14 million, respectively,in deferred compensation costs related to these suspendedaward programs, and the weighted average remaining term wastwo years for such award grants outstanding at year-end 2006.Share-based compensation expense associated with these sus-pended award programs was $6 million, $10 million and $12 mil-lion for 2006, 2005 and 2004, respectively.
At year-end 2006, 71 million shares were reserved under theComprehensive Plan including 44 million shares under the StockOption Program and Share Appreciation Right Program. Underthe provisions of FAS No. 123(R), the “Deferred compensation” lineon our Consolidated Balance Sheet, a contra-equity line repre-senting the amount of unrecognized share-based compensation
costs, is no longer presented. Accordingly, in 2006 we reversedthe amount that had been on the “Deferred compensation” lineat year-end 2005 through the “Additional paid-in-capital” line onour Consolidated Balance Sheet.
5 | EARNINGS PER SHARE
The following table illustrates the reconciliation of the earningsand number of shares used in the basic and diluted earnings pershare calculations.
(in millions, except per share amounts) 2006 2005 2004
Computation of Basic Earnings Per Share
Income from continuing operations for basic earnings per share $ 717 $ 668 $ 594
Weighted average shares outstanding 404.1 432.7 453.1
Basic earnings per share from continuing operations $1.77 $1.55 $1.31
Computation of Diluted Earnings Per Share
Income from continuing operations for diluted earnings per share $ 717 $ 668 $ 594
Weighted average shares outstanding 404.1 432.7 453.1
Effect of dilutive securities
Employee stock option and share appreciation rights plan 20.2 19.0 16.8
Deferred stock incentive plan 3.4 7.5 8.5
Restricted stock units 2.5 3.1 1.8
Convertible debt — — 0.7
Shares for diluted earnings per share 430.2 462.3 480.9
Diluted earnings per share from continuing operations $1.66 $1.45 $1.24
We compute the effect of dilutive securities using the treasurystock method and average market prices during the period.Wedetermine dilution based on earnings from continuing operations.
6 | INVENTORY
Inventory, totaling $1,208 million and $1,164 million as ofDecember 29, 2006 and December 30, 2005, respectively, con-sists primarily of Timeshare segment interval, fractional andwhole ownership products totaling $1,166 million and $1,116 million as of December 29, 2006, and December 30, 2005,respectively. Inventory totaling $42 million and $48 million as ofDecember 29, 2006, and December 30, 2005, respectively, relatesto hotel operating supplies for the limited number of hotels weown or lease and synthetic fuel. We value Timeshare segmentinterval, fractional and whole ownership products and SyntheticFuel segment inventory at the lower of cost or net realizablevalue and generally value operating supplies at the lower of cost(using the first-in, first-out method) or market. Timeshare seg-ment interval, fractional and whole ownership products inven-tory, which has an operating cycle that exceeds twelve months,is classified as a current asset consistent with recognized indus-try practice.
50 | M A R R I O T T I N T E R N A T I O N A L , I N C . 2 0 0 6

7 | PROPERTY AND EQUIPMENT
($ in millions) 2006 2005
Land $ 316 $ 301
Buildings and leasehold improvements 724 659
Furniture and equipment 888 827
Construction in progress 215 132
2,143 1,919
Accumulated depreciation (905) (785)
$1,238 $1,134
We record property and equipment at cost, including inter-est, rent and real estate taxes incurred during development andconstruction. Interest capitalized as a cost of property andequipment totaled $32 million in 2006, $30 million in 2005, and$16 million in 2004. We capitalize the cost of improvements thatextend the useful life of property and equipment when incurred.These capitalized costs may include structural costs, equipment,fixtures, floor and wall coverings. All repair and maintenancecosts are expensed as incurred. We compute depreciation usingthe straight-line method over the estimated useful lives of theassets (three to 40 years), and we amortize leasehold improve-ments over the shorter of the asset life or lease term.Depreciation expense totaled $155 million in 2006, $156 millionin 2005, and $133 million in 2004.
8 | ACQUISITIONS AND DISPOSITIONS
2006 AcquisitionsDuring 2006, we acquired one full-service property for $130 mil-lion including aggregate cash consideration of $46 million plusthe assumption of debt. In addition we acquired three other full-service properties for aggregate cash consideration of $134 mil-lion. We plan to sell all four properties to third-party owners, andwe classified the balances related to these properties as “Assetsheld for sale” and “Liabilities of assets held for sale” on ourConsolidated Balance Sheet.
2006 DispositionsIn 2006 we sold our interest in the 50/50 joint venture withWhitbread PLC (“Whitbread”), which held 46 hotels consisting ofmore than 8,000 rooms, and we received approximately $164 mil-lion in cash, net of transaction costs, which was approximatelyequal to the investment’s book value. We continue to managethe hotels under the Marriott Hotels & Resorts and RenaissanceHotels & Resorts brands. For additional information regardingthis joint venture, see Footnote No. 10,“Marriott and WhitbreadJoint Venture.”We also sold our minority interest in five otherjoint ventures during 2006 for cash proceeds of $64 million andrecognized gains of $43 million. Additionally, one cost methodinvestee redeemed the preferred stock we held for $81 million incash consideration, and we recognized income of $25 million onthe redemption.
During 2006 we also sold 10 full-service properties for cashproceeds of $487 million and recognized gains totaling $14 mil-lion. We accounted for each of the sales under the full accrualmethod in accordance with FAS No. 66,“Accounting for Sales ofReal Estate,” and will continue to operate eight of the properties
under long-term management agreements. The sold propertiesincluded eight properties purchased in 2005 from CTF HoldingsLtd. and certain of its affiliates (collectively “CTF”). For additionalinformation regarding the CTF transaction, see the “2005Acquisitions” caption later in this footnote. Prior to the sale ofone property, balances associated with that property werereclassified in conformity with other “held and used” properties,in the first half of 2006 as the property was not expected to besold, within one year of its classification as “held for sale.” In con-junction with that reclassification, we recorded depreciationexpense of $2 million in the first half of 2006 that would havebeen recognized had the asset been continuously classified as“held and used.” Cash proceeds of $26 million for one hotel soldin 2006 are not reflected in the disposition proceeds of $487 mil-lion as the proceeds were initially recorded as a deposit becauseof a contingency and impacted the “Other investing activities”section of our Consolidated Statement of Cash Flows rather thandispositions. The contingency was subsequently resolved andsale of accounting was achieved in 2006. Other asset sales gen-erated cash proceeds of $2 million.
Late in 2006, we sold a 75 percent interest in a joint ventureto a third party for its book value of $14 million. At the time ofthe sale, the joint venture’s only asset was a parcel of land. Inconjunction with the sale, we made a $25 million bridge loan tothe joint venture, which matures on February 28, 2007. Followingthe guidance found in EITF 98-8,“Accounting for Transfers ofInvestments That Are in Substance Real Estate,” and FAS No. 66,“Accounting for Sales of Real Estate,” due to our continuinginvolvement with the joint venture, we are consolidating thejoint venture for the period of time that the bridge loan remainsoutstanding. Subsequent to the bridge loan’s repayment, we willaccount for our remaining interest in the joint venture under theequity method as required by APB 18,“The Equity Method ofAccounting for Investments in Common Stock.”
In 1988, the Company as landlord, entered into a 59-yearground lease with a lessee for land that was improved with ahotel that is owned by the lessee.The hotel was previouslybranded a Marriott property; however, currently it is not.The leasecontains contractual rental increases over the term of the lease,and annual ground rent on the land currently totals approxi-mately $5 million.The lease also contains a provision that permitsthe lessee, under certain circumstances, to purchase the land for afixed price.The Company and the lessee have had various discus-sions concerning the land as well as the hotel. During the 2006second quarter, it became probable that none of the proposedtransactions were acceptable to both parties, and the lessee indi-cated its intent to exercise its option to purchase the land.Accordingly, in the 2006 second quarter, we reclassified the landfrom the “Property and equipment” caption in our ConsolidatedBalance Sheet to the “Assets held for sale” caption and recorded a$37 million non-cash charge to adjust the carrying amount to netrealizable value. Additional amounts may be due us depending onthe lessee’s use of the land subsequent to purchase; however, suchamounts will only be recorded if and when paid.
2005 AcquisitionsDuring the third quarter of 2005, we purchased from CTF HoldingsLtd. and certain of its affiliates (collectively “CTF”) 13 properties (ineach case through a purchase of real estate, a purchase of theentity that owned the hotel, or an assignment of CTF’s leasehold
M A R R I O T T I N T E R N A T I O N A L , I N C . 2 0 0 6 | 51

rights) and certain joint venture interests from CTF for an aggre-gate price of $381 million. Prior to the sale, all of the propertieswere operated by us or our subsidiaries.
At the purchase date, we planned to sell eight of the proper-ties to third-party owners, and the balances related to these full-service properties were classified within the “Assets held for sale”and “Liabilities of assets held for sale” captions in ourConsolidated Balance Sheet at year-end 2005. All eight propertieswere sold in 2006. One operating lease terminated in 2005. Weoperate the four remaining properties under leases, three ofwhich expire by 2012. Under the purchase and sale agreementwe signed with CTF in the second quarter of 2005, we were obli-gated to purchase two additional properties for $17 million, theacquisition of which was postponed pending receipt of certainthird-party consents. We did not purchase these additional twoproperties and the obligation has expired.
On the closing date we and CTF also modified managementagreements on 29 other CTF-leased hotels, 28 located in Europeand one located in the United States. We became secondarilyliable for annual rent payments for certain of these hotels whenwe acquired the Renaissance Hotel Group N.V. in 1997. We con-tinue to manage 16 of these hotels under new long-term man-agement agreements; however, due to certain provisions in themanagement agreements, we account for these contracts asoperating leases. CTF placed approximately $89 million in trustaccounts to cover possible shortfalls in cash flow necessary tomeet rent payments under these leases. In turn, we released CTFfrom its guarantees in connection with these leases.Approximately $69 million remained in these trust accounts atthe end of 2006. Our financial statements reflect us as lessee onthese hotels. Minimum lease payments relating to these leasesare as follows: $35 million in 2007; $35 million in 2008; $36 mil-lion in 2009; $36 million in 2010; $32 million in 2011; and $214 million thereafter, for a total of $388 million.
For the remaining 13 European leased hotels, CTF may termi-nate management agreements with us if and when CTF obtainsreleases from landlords of our back-up guarantees. Pending com-pletion of the CTF-landlord agreements, we continue to managethese hotels under modified management agreements andremain secondarily liable under certain of these leases. We arealso secondarily obligated for real estate taxes and other chargesassociated with the leases. Third parties have severally indemni-fied us for all payments we may be required to make in connec-tion with these obligations. Since we assumed these guarantees,we have not funded any amounts, and we do not expect to fundany amounts under these guarantees in the future. CTF has madeavailable €35 million in cash collateral in the event that we arerequired to fund under such guarantees. As CTF obtains releasesfrom the landlords and these hotels exit the system, our contin-gent liability exposure of approximately $218 million will decline.
We also continue to manage three hotels in the UnitedKingdom under amended management agreements with CTFand continue to manage 14 properties in Asia on behalf of NewWorld Development Company Limited and its affiliates. CTF’sprincipals are officers, directors and stockholders of New WorldDevelopment Company Limited. At the closing date, the ownersof the United Kingdom and Asian hotels agreed to invest $17 million to renovate those properties.
We and CTF also exchanged legal releases effective as of theclosing date, and litigation and arbitration that was outstandingbetween the two companies and their affiliates was dismissed.
Simultaneously with the closing on the foregoing transac-tions, CTF also sold five properties and one minority joint ven-ture interest to Sunstone Hotel Investors, Inc. (“Sunstone”) for$419 million, eight properties to Walton Street Capital, L.L.C.(“Walton Street”) for $578 million, and two properties toTarsadia Hotels (“Tarsadia”) for $29 million, in each case as sub-stitute purchasers under our purchase and sale agreement withCTF. Prior to consummation of the sales, we also operated all ofthese properties. At closing, Walton Street and Sunstoneentered into new long-term management agreements with usand agreed to invest a combined $68 million to further upgradethe 13 properties they acquired. The two properties purchasedby Tarsadia are being operated under short-term managementand franchise agreements.
When we signed the purchase and sale agreement for theforegoing transactions in the 2005 second quarter, we recordeda $94 million pre-tax charge primarily due to the non-cash write-off of deferred contract acquisition costs associated with the ter-mination of the existing management agreements for propertiesinvolved in these transactions. As described above, we enteredinto new long-term management agreements with CTF, WaltonStreet and Sunstone at the closing of the transactions, and weexpect to sell most of the properties we acquired subject tolong-term management agreements.
In 2005 we also purchased two full-service properties, one inParis, France, and the other in Munich, Germany, for aggregatecash consideration of $146 million. We planned to sell these twofull-service properties to third-party owners, and the balancesrelated to these properties were classified within the “Assetsheld for sale” and “Liabilities of assets held for sale” line items onour Consolidated Balance Sheet at year-end 2005. The propertyin Paris, France, was sold in 2006. The balances associated withthe Munich, Germany, property were reclassified, in conformitywith other “held and used” properties in the 2006 fourth quarteras the property was not sold, as expected, within one year of itsclassification as “held for sale.” In conjunction with that reclassifi-cation, we recorded depreciation expense of $5 million in the2006 fourth quarter that would have been recognized had theasset been continuously classified as “held and used.”
2005 DispositionsLate in 2005, we contributed land underlying an additional
nine Courtyard hotels, worth approximately $40 million, to CBMLand Joint Venture limited partnership (“CBM Land JV”), a jointventure the majority of which was owned, at the time of thetransaction, by Sarofim Realty Advisors (“Sarofim”) on behalf ofan institutional investor, thereby obtaining a 23 percent equitystake in CBM Land JV. At the same time we completed the saleof a portfolio of land underlying 75 Courtyard by Marriott hotelsfor approximately $246 million in cash to CBM Land JV. In con-junction with this transaction, we recognized a gain of $17 mil-lion in 2005, we deferred recognition of a $5 million of gain dueto our minority interest in the joint venture, and we alsodeferred recognition of a $40 million of gain due to contingen-cies in the transaction documents. As those contingencies expirein subsequent years, we will recognize additional gains.
We also sold a number of other land parcels in 2005 for $38 million in cash, net of transaction costs, and recognizedgains totaling $6 million, and we sold two minority interests in joint ventures for $14 million in cash and recognized gainstotaling $7 million.
52 | M A R R I O T T I N T E R N A T I O N A L , I N C . 2 0 0 6
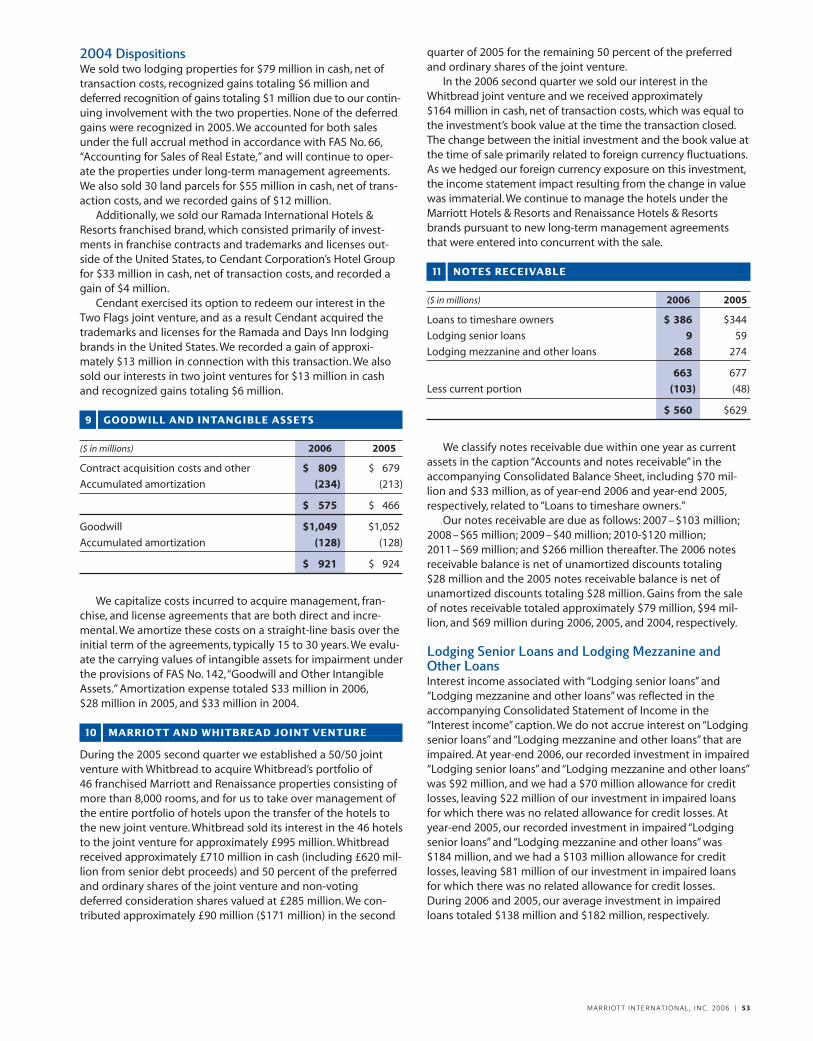
2004 DispositionsWe sold two lodging properties for $79 million in cash, net oftransaction costs, recognized gains totaling $6 million anddeferred recognition of gains totaling $1 million due to our contin-uing involvement with the two properties. None of the deferredgains were recognized in 2005. We accounted for both salesunder the full accrual method in accordance with FAS No. 66,“Accounting for Sales of Real Estate,” and will continue to oper-ate the properties under long-term management agreements.We also sold 30 land parcels for $55 million in cash, net of trans-action costs, and we recorded gains of $12 million.
Additionally, we sold our Ramada International Hotels &Resorts franchised brand, which consisted primarily of invest-ments in franchise contracts and trademarks and licenses out-side of the United States, to Cendant Corporation’s Hotel Groupfor $33 million in cash, net of transaction costs, and recorded again of $4 million.
Cendant exercised its option to redeem our interest in theTwo Flags joint venture, and as a result Cendant acquired thetrademarks and licenses for the Ramada and Days Inn lodgingbrands in the United States. We recorded a gain of approxi-mately $13 million in connection with this transaction. We alsosold our interests in two joint ventures for $13 million in cashand recognized gains totaling $6 million.
9 | GOODWILL AND INTANGIBLE ASSETS
($ in millions) 2006 2005
Contract acquisition costs and other $ 809 $ 679
Accumulated amortization (234) (213)
$ 575 $ 466
Goodwill $1,049 $1,052
Accumulated amortization (128) (128)
$ 921 $ 924
We capitalize costs incurred to acquire management, fran-chise, and license agreements that are both direct and incre-mental. We amortize these costs on a straight-line basis over theinitial term of the agreements, typically 15 to 30 years. We evalu-ate the carrying values of intangible assets for impairment underthe provisions of FAS No. 142,“Goodwill and Other IntangibleAssets.” Amortization expense totaled $33 million in 2006,$28 million in 2005, and $33 million in 2004.
10 | MARRIOTT AND WHITBREAD JOINT VENTURE
During the 2005 second quarter we established a 50/50 jointventure with Whitbread to acquire Whitbread’s portfolio of 46 franchised Marriott and Renaissance properties consisting ofmore than 8,000 rooms, and for us to take over management ofthe entire portfolio of hotels upon the transfer of the hotels tothe new joint venture. Whitbread sold its interest in the 46 hotelsto the joint venture for approximately £995 million. Whitbreadreceived approximately £710 million in cash (including £620 mil-lion from senior debt proceeds) and 50 percent of the preferredand ordinary shares of the joint venture and non-votingdeferred consideration shares valued at £285 million. We con-tributed approximately £90 million ($171 million) in the second
quarter of 2005 for the remaining 50 percent of the preferredand ordinary shares of the joint venture.
In the 2006 second quarter we sold our interest in theWhitbread joint venture and we received approximately $164 million in cash, net of transaction costs, which was equal tothe investment’s book value at the time the transaction closed.The change between the initial investment and the book value atthe time of sale primarily related to foreign currency fluctuations.As we hedged our foreign currency exposure on this investment,the income statement impact resulting from the change in valuewas immaterial. We continue to manage the hotels under theMarriott Hotels & Resorts and Renaissance Hotels & Resortsbrands pursuant to new long-term management agreementsthat were entered into concurrent with the sale.
11 | NOTES RECEIVABLE
($ in millions) 2006 2005
Loans to timeshare owners $ 386 $344
Lodging senior loans 9 59
Lodging mezzanine and other loans 268 274
663 677
Less current portion (103) (48)
$ 560 $629
We classify notes receivable due within one year as currentassets in the caption “Accounts and notes receivable” in theaccompanying Consolidated Balance Sheet, including $70 mil-lion and $33 million, as of year-end 2006 and year-end 2005,respectively, related to “Loans to timeshare owners.”
Our notes receivable are due as follows: 2007–$103 million;2008–$65 million; 2009–$40 million; 2010-$120 million;2011–$69 million; and $266 million thereafter. The 2006 notesreceivable balance is net of unamortized discounts totaling $28 million and the 2005 notes receivable balance is net ofunamortized discounts totaling $28 million. Gains from the saleof notes receivable totaled approximately $79 million, $94 mil-lion, and $69 million during 2006, 2005, and 2004, respectively.
Lodging Senior Loans and Lodging Mezzanine andOther LoansInterest income associated with “Lodging senior loans” and“Lodging mezzanine and other loans” was reflected in theaccompanying Consolidated Statement of Income in the“Interest income” caption. We do not accrue interest on “Lodgingsenior loans” and “Lodging mezzanine and other loans” that areimpaired. At year-end 2006, our recorded investment in impaired“Lodging senior loans” and “Lodging mezzanine and other loans”was $92 million, and we had a $70 million allowance for creditlosses, leaving $22 million of our investment in impaired loansfor which there was no related allowance for credit losses. Atyear-end 2005, our recorded investment in impaired “Lodgingsenior loans” and “Lodging mezzanine and other loans” was $184 million, and we had a $103 million allowance for creditlosses, leaving $81 million of our investment in impaired loansfor which there was no related allowance for credit losses.During 2006 and 2005, our average investment in impaired loans totaled $138 million and $182 million, respectively.
M A R R I O T T I N T E R N A T I O N A L , I N C . 2 0 0 6 | 53

54 | M A R R I O T T I N T E R N A T I O N A L , I N C . 2 0 0 6
The following table summarizes the activity related to our“Lodging senior loans” and “Lodging mezzanine and other loans”notes receivable reserve for 2004, 2005 and 2006:
($ in millions) Notes Receivable Reserve
Year-end 2003 balance $130
Additions 3
Reversals (11)
Write-offs (44)
Transfers and other 14
Year-end 2004 balance 92
Additions 11
Reversals —
Write-offs (9)
Transfers and other 9
Year-end 2005 balance 103
Additions —
Reversals (5)
Write-offs (38)
Transfers and other 10
Year-end 2006 balance $ 70
Loans to Timeshare OwnersThe weighted average interest rate for our “Loans to timeshareowners” is 12.4 percent, and the interest rates associated withthese loans ranges to 19.5 percent. Interest income associatedwith “Loans to timeshare owners” of $41 million, $38 million and$23 million for 2006, 2005 and 2004, respectively, was reflectedin the accompanying Consolidated Statement of Income in the“Timeshare sales and services” revenue caption. The recordedinvestment in “Loans to timeshare owners” on nonaccrual statusat year-end 2006 and year-end 2005 totaled $67 million and $49 million, respectively. As noted in the “New AccountingStandards” caption of Footnote No. 1 “Summary of SignificantAccounting Policies,” we established the reserve for “Loans totimeshare owners” notes receivable in 2006 in conjunction withthe adoption of SOP 04-2.
The following table summarizes the activity related to our“Loans to timeshare owners” notes receivable reserve for 2006.
($ in millions) Notes Receivable Reserve
Year-end 2005 balance $ —
Establishment of reserve 25
Additions for current year sales 20
Write-offs (16)
Year-end 2006 balance $ 29
12 | ASSET SECURITIZATIONS
We periodically sell, without recourse, through special purposeentities, notes receivable originated by our Timeshare segment inconnection with the sale of timeshare interval, fractional andwhole ownership products. We continue to service the notes andtransfer all proceeds collected to special purpose entities. Weretain servicing assets and other interests in the notes which areaccounted for as residual interests. The interests are limited to thepresent value of cash available after paying financing expensesand program fees, and absorbing credit losses. We have includedgains from the sales of timeshare notes receivable totaling
$77 million in 2006 within the “Timeshare sales and services” rev-enue caption in our Consolidated Statement of Income. Gainsfrom the sale of timeshare notes receivable of $69 million in 2005and $64 million in 2004 are in the “Gains and other income” cap-tion in the accompanying Consolidated Statement of Income.For additional information regarding the classification of gainsfrom the sale of timeshare notes receivable, see the “Basis ofPresentation” caption in Footnote No. 1,“Summary of SignificantAccounting Policies.”We had residual interests of $221 million and$196 million, respectively, at year-end 2006 and year-end 2005which are recorded in the accompanying Consolidated BalanceSheet as other long-term receivables of $137 million and $125 mil-lion, respectively, and other current assets of $84 million and $71 million, respectively. In addition, in September 2006, we repur-chased notes receivable with a principal balance of $31 millionand in November 2006, sold those notes, along with $249 millionof additional notes in a $280 million note securitization.The gainon the sale of these timeshare notes receivable is included in theamount disclosed above.
At the date of sale and at the end of each reporting period, weestimate the fair value of residual interests, excluding servicingassets, using a discounted cash flow model. These transactionsmay utilize interest rate swaps to protect the net interest marginassociated with the beneficial interest. We report in incomechanges in the fair value of residual interests, excluding servicingassets, as they are considered trading securities under the provi-sions of FAS No. 115,“Accounting for Certain Investments in Debtand Equity Securities.” During 2006, 2005 and 2004, we recordedtrading gains of $19 million, $2 million and $3 million, respec-tively. We used the following key assumptions to measure the fairvalue of the residual interests, excluding servicing assets, at thedate of sale during 2006, 2005, and 2004: average discount rate of9.22 percent, 8.56 percent and 7.80 percent, respectively; averageexpected annual prepayments, including defaults, of 25.22 percent,23.56 percent and 18.61 percent, respectively; expected weightedaverage life of prepayable notes receivable, excluding prepaymentsand defaults, of 70 months, 79 months and 83 months, respec-tively; and expected weighted average life of prepayable notesreceivable, including prepayments and defaults, of 32 months,38 months and 42 months, respectively. Our key assumptions are based on experience.
We used the following key assumptions in measuring the fairvalue of the residual interests, excluding servicing assets, in ournine outstanding note sales at year-end 2006: an average dis-count rate of 9.21 percent; an average expected annual prepay-ment rate, including defaults, of 19.78 percent; an expectedweighted average life of prepayable notes receivable, excludingprepayments and defaults, of 63 months; and an expectedweighted average life of prepayable notes receivable, includingprepayments and defaults of 35 months.
At the date of sale, we measure servicing assets at their allo-cated previous carrying amount based on relative fair value.Servicing assets are classified as held to maturity under the pro-visions of FAS No. 115 and are recorded at amortized cost.
Cash flows between us and third-party purchasers during 2006,2005, and 2004, were as follows: net proceeds to us from new time-share note sales of $508 million, $399 million and $312 million,respectively; repurchases by us of defaulted loans (over 150 daysoverdue) of $24 million, $23 million and $18 million, respectively;repurchases by us of other loans in 2006 of $31 million; servicingfees received by us of $5 million in 2006, $4 million and $4 million,respectively; and cash flows received from our retained interests of$91 million, $86 million and $90 million, respectively.

At year-end 2006, $1,123 million of principal remains out-standing in all sales in which we have a retained residual inter-est. Delinquencies of more than 90 days at year-end 2006amounted to $5 million. Existing reserves were adequate fordefaulted loans that were resolved during 2006. We have beenable to resell timeshare units underlying defaulted loans with-out incurring material losses.
We have completed a stress test on the fair value of the resid-ual interests with the objective of measuring the change invalue associated with independent changes in individual keyvariables. The methodology used applied unfavorable changesthat would be considered statistically significant for the key vari-ables of prepayment rate, discount rate and weighted averageremaining term. The fair value of the residual interests was $221 million at year-end 2006, before any stress test changeswere applied. An increase of 100 basis points in the prepaymentrate would decrease the year-end valuation by $4 million, or 1.7 percent, and an increase of 200 basis points in the prepay-ment rate would decrease the year-end valuation by $7 million,or 3.3 percent. An increase of 100 basis points in the discountrate would decrease the year-end valuation by $5 million, or 2.1 percent, and an increase of 200 basis points in the discountrate would decrease the year-end valuation by $9 million, or 4.1 percent. A decline of two months in the weighted-averageremaining term would decrease the year-end valuation by $2 mil-lion, or 1.0 percent, and a decline of four months in the weighted-average remaining term would decrease the year-end valuationby $4 million, or 2.0 percent.
13 | LONG-TERM DEBT
Our long-term debt at year-end 2005 and year-end 2004 con-sisted of the following:
($ in millions) 2006 2005
Senior Notes:
Series C, interest rate of 7.875%,maturing September 15, 2009 $ 76 $ 76
Series E, interest rate of 7.000%,maturing January 15, 2008 91 91
Series F, interest rate of 4.625%,maturing June 15, 2012 349 348
Series G, interest rate of 5.810%,maturing November 10, 2015 399 396
Series H, interest rate of 6.200%,maturing June 15, 2016 349 —
Commercial paper, average interest rate of 5.4% at year-end 2006 315 499
Mortgage debt, average interest rate of 7.9% at year-end 2006,maturing May 1, 2025 167 171
Other 87 156
1,833 1,737
Less current portion (15) (56)
$1,818 $1,681
As of year-end 2006, all debt, other than mortgage debt and$1 million of other debt, is unsecured.
We are party to a multicurrency revolving credit agreementthat provides for borrowings of up to $2.0 billion which sup-ports our commercial paper program and letters of credit.Borrowings under the facility bear interest at the LondonInterbank Offered Rate (LIBOR) plus a spread, based on our pub-lic debt rating. Additionally, we pay annual fees on the facility ata rate also based on our public debt rating. In the 2006 secondquarter, we executed an amendment that extended the maturitydate for $1.955 billion of commitments under this agreement byone year to June 6, 2011. The remaining $45 million commit-ment still matures on June 6, 2010.
In 2005 we began issuing short-term commercial paper inEurope in addition to our long-standing commercial paper pro-gram in the United States. Our U.S. and European commercialpaper issuances are subject to the availability of the commercialpaper market, as we have no commitment from buyers to pur-chase our commercial paper. We reserve unused capacity underour credit facility to repay outstanding commercial paper bor-rowings in the event that the commercial paper market is notavailable to us for any reason when outstanding borrowingsmature. We classify commercial paper as long-term debt basedon our ability and intent to refinance it on a long-term basis.
During the 2006 second quarter, we sold $350 millionaggregate principal amount of 6.200 percent Series H Notesdue 2016 (the “Notes”). We received net proceeds of approxi-mately $347 million from this offering, after deducting a dis-count, underwriting fees, and other expenses, and we usedthese proceeds to repay commercial paper borrowings and for general corporate purposes.
Interest on the Notes is paid on June 15 and December 15 of each year, with the first interest payment occurring onDecember 15, 2006. The Notes will mature on June 15, 2016, andare redeemable, in whole or in part, at any time and from time totime under the terms provided in the Form of Note. The Noteswere issued under an indenture with JPMorgan Chase Bank, N.A.(formerly known as The Chase Manhattan Bank), as trustee,dated November 16, 1998.
On December 8, 2005, we filed a “universal shelf” registrationstatement with the SEC covering an indeterminate amount offuture offerings of debt securities, common stock or preferredstock, either separately or represented by warrants, depositaryshares, rights or purchase contracts.
We are in compliance with covenants in our loan agree-ments, which require the maintenance of certain financial ratiosand minimum shareholders’ equity, and also include, amongother things, limitations on additional indebtedness and thepledging of assets.
Aggregate debt maturities are: 2007–$15 million;2008–$108 million; 2009–$94 million; 2010–$18 million;2011–$19 million and $1,579 million thereafter.
Cash paid for interest, net of amounts capitalized, was $73 million in 2006, $87 million in 2005 and $88 million in 2004.
M A R R I O T T I N T E R N A T I O N A L , I N C . 2 0 0 6 | 55

14 | SELF-INSURANCE RESERVE FOR LOSSES AND
14 | LOSS ADJUSTMENT EXPENSES
The activity in the reserve for losses and loss adjustmentexpenses is summarized as follows:
($ in millions) 2006 2005
Balance at beginning of year $264 $234
Less: reinsurance recoverable (24) (23)
Net balance at beginning of year 240 211
Incurred related to:
Current Year 122 139
Prior year (20) (26)
Total incurred 102 113
Paid related to:
Current Year (37) (24)
Prior year (50) (60)
Total paid (87) (84)
Net balance at end of year 255 240
Add: reinsurance recoverable 16 24
Balance at end of year $271 $264
The provision for unpaid loss and loss adjustment expensesdecreased by $20 million and $26 million in 2006 and 2005,respectively, as a result of changes in estimates from insuredevents of the prior years due to changes in underwriting experi-ence and frequency and severity trends. The year-end 2006 self-insurance reserve of $271 million is comprised of a currentportion of $87 million and a long-term portion of 184 million.The year-end 2005 self-insurance reserve of $264 million is com-prised of a current portion of $84 million and a long-term por-tion of $180 million.
15 | SHAREHOLDERS’ EQUITY
Eight hundred million shares of our Class A Common Stock, witha par value of $.01 per share, are authorized, and 10 millionshares of preferred stock, without par value, are authorized. As ofthe 2006 fiscal year-end, there were 389.5 million shares of ourClass A Common Stock outstanding and no shares of our pre-ferred stock were outstanding.
On March 27, 1998, our Board of Directors adopted a share-holder rights plan under which one preferred stock purchaseright was distributed for each share of our Class A CommonStock. Each right entitles the holder to buy 1/1000th of a shareof a newly issued series of junior participating preferred stock ofthe Company at an exercise price of $175. The rights may notpresently be exercised, but will be exercisable 10 days after aperson or group acquires beneficial ownership of 20 percent ormore of our Class A Common Stock or begins a tender orexchange for 30 percent or more of our Class A Common Stock.Shares owned by a person or group on March 27, 1998, and heldcontinuously thereafter, are exempt for purposes of determiningbeneficial ownership under the rights plan. The rights are non-voting and will expire on March 27, 2008, the tenth anniversaryof the adoption of the shareholder rights plan unless previouslyexercised or redeemed by us for $.01 each. If we are involved ina merger or certain other business combinations not approvedby the Board of Directors, each right entitles its holder, otherthan the acquiring person or group, to purchase common stock
of either the Company or the acquirer having a value of twicethe exercise price of the right.
Accumulated other comprehensive income of $44 million atyear-end 2006 primarily consisted of gains totaling $35 millionassociated with available-for-sale securities and gains totaling$12 million associated with foreign currency translation adjust-ments. Accumulated other comprehensive loss of $11 million atyear-end 2005 consisted primarily of losses totaling $16 millionassociated with foreign currency translation adjustments whichwere partially offset by gains totaling $8 million associated withavailable-for-sale securities.
16 | FAIR VALUE OF FINANCIAL INSTRUMENTS
We believe that the fair values of current assets and currentliabilities approximate their reported carrying amounts. The fairvalues of non-current financial assets, liabilities and derivativesare shown in the following table.
2006 2005Carrying Fair Carrying Fair
($ in millions) Amount Value Amount Value
Notes and other long-term assets $ 993 $ 996 $1,374 $1,412
Long-term debt and other long-term liabilities $1,816 $1,847 $1,636 $1,685
Derivative instruments $ 6 $ 6 $ 6 $ 6
We value notes and other receivables based on the expectedfuture cash flows discounted at risk-adjusted rates. We deter-mine valuations for long-term debt and other long-term liabili-ties based on quoted market prices or expected futurepayments discounted at risk-adjusted rates.
17 | DERIVATIVE INSTRUMENTS
During 2003, we entered into an interest rate swap agreementunder which we receive a floating rate of interest and pay a fixedrate of interest. The swap modifies our interest rate exposure byeffectively converting a note receivable with a fixed rate to afloating rate. The aggregate notional amount of the swap is $92 million and it matures in 2010. The swap is classified as a fair value hedge under FAS No. 133,“Accounting for DerivativeInstruments and Hedging Activities” (“FAS No. 133”), and thechange in the fair value of the swap, as well as the change in thefair value of the underlying note receivable, is recognized ininterest income. The fair value of the swap was a $1 million assetat year-end 2006 and 2005, and a $3 million liability at year-end2004. The hedge is highly effective and, therefore, no net gain orloss was reported during 2006, 2005, and 2004.
During 2006, we entered into an interest rate swap agree-ment to manage the volatility of the U.S. Treasury component ofthe interest rate risk associated with the forecasted issuance ofour Series H Notes. During 2005, we entered into two similarinstruments in conjunction with the forecasted issuance of ourSeries F Notes and the exchange of our Series C and E Notes fornew Series G Notes. All three swaps were designated as cashflow hedges under FAS No. 133 and were terminated upon pric-ing of the notes. All three swaps were highly effective in offset-ting fluctuations in the U.S. Treasury component. Thus, there wasno net gain or loss reported in earnings during 2006 or 2005.The net losses for these swaps of $2 million in 2006 associatedwith the Series H Notes and $2 million in 2005 associated with
56 | M A R R I O T T I N T E R N A T I O N A L , I N C . 2 0 0 6
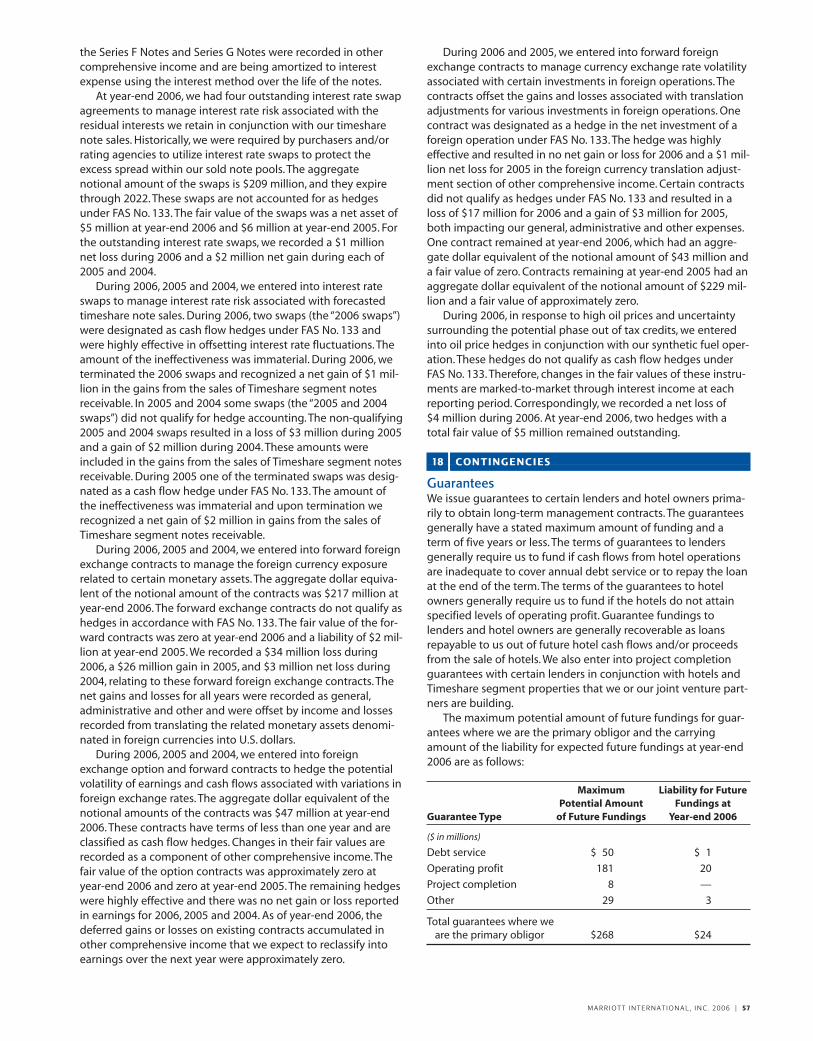
the Series F Notes and Series G Notes were recorded in othercomprehensive income and are being amortized to interestexpense using the interest method over the life of the notes.
At year-end 2006, we had four outstanding interest rate swapagreements to manage interest rate risk associated with theresidual interests we retain in conjunction with our timesharenote sales. Historically, we were required by purchasers and/orrating agencies to utilize interest rate swaps to protect theexcess spread within our sold note pools. The aggregatenotional amount of the swaps is $209 million, and they expirethrough 2022. These swaps are not accounted for as hedgesunder FAS No. 133. The fair value of the swaps was a net asset of$5 million at year-end 2006 and $6 million at year-end 2005. Forthe outstanding interest rate swaps, we recorded a $1 millionnet loss during 2006 and a $2 million net gain during each of2005 and 2004.
During 2006, 2005 and 2004, we entered into interest rateswaps to manage interest rate risk associated with forecastedtimeshare note sales. During 2006, two swaps (the “2006 swaps”)were designated as cash flow hedges under FAS No. 133 andwere highly effective in offsetting interest rate fluctuations. Theamount of the ineffectiveness was immaterial. During 2006, weterminated the 2006 swaps and recognized a net gain of $1 mil-lion in the gains from the sales of Timeshare segment notesreceivable. In 2005 and 2004 some swaps (the “2005 and 2004swaps”) did not qualify for hedge accounting. The non-qualifying2005 and 2004 swaps resulted in a loss of $3 million during 2005and a gain of $2 million during 2004. These amounts wereincluded in the gains from the sales of Timeshare segment notesreceivable. During 2005 one of the terminated swaps was desig-nated as a cash flow hedge under FAS No. 133. The amount ofthe ineffectiveness was immaterial and upon termination werecognized a net gain of $2 million in gains from the sales ofTimeshare segment notes receivable.
During 2006, 2005 and 2004, we entered into forward foreignexchange contracts to manage the foreign currency exposurerelated to certain monetary assets. The aggregate dollar equiva-lent of the notional amount of the contracts was $217 million atyear-end 2006. The forward exchange contracts do not qualify ashedges in accordance with FAS No. 133. The fair value of the for-ward contracts was zero at year-end 2006 and a liability of $2 mil-lion at year-end 2005. We recorded a $34 million loss during2006, a $26 million gain in 2005, and $3 million net loss during2004, relating to these forward foreign exchange contracts. Thenet gains and losses for all years were recorded as general,administrative and other and were offset by income and lossesrecorded from translating the related monetary assets denomi-nated in foreign currencies into U.S. dollars.
During 2006, 2005 and 2004, we entered into foreignexchange option and forward contracts to hedge the potentialvolatility of earnings and cash flows associated with variations inforeign exchange rates. The aggregate dollar equivalent of thenotional amounts of the contracts was $47 million at year-end2006. These contracts have terms of less than one year and areclassified as cash flow hedges. Changes in their fair values arerecorded as a component of other comprehensive income. Thefair value of the option contracts was approximately zero atyear-end 2006 and zero at year-end 2005. The remaining hedgeswere highly effective and there was no net gain or loss reportedin earnings for 2006, 2005 and 2004. As of year-end 2006, thedeferred gains or losses on existing contracts accumulated inother comprehensive income that we expect to reclassify intoearnings over the next year were approximately zero.
During 2006 and 2005, we entered into forward foreignexchange contracts to manage currency exchange rate volatilityassociated with certain investments in foreign operations. Thecontracts offset the gains and losses associated with translationadjustments for various investments in foreign operations. Onecontract was designated as a hedge in the net investment of aforeign operation under FAS No. 133. The hedge was highlyeffective and resulted in no net gain or loss for 2006 and a $1 mil-lion net loss for 2005 in the foreign currency translation adjust-ment section of other comprehensive income. Certain contractsdid not qualify as hedges under FAS No. 133 and resulted in aloss of $17 million for 2006 and a gain of $3 million for 2005,both impacting our general, administrative and other expenses.One contract remained at year-end 2006, which had an aggre-gate dollar equivalent of the notional amount of $43 million anda fair value of zero. Contracts remaining at year-end 2005 had anaggregate dollar equivalent of the notional amount of $229 mil-lion and a fair value of approximately zero.
During 2006, in response to high oil prices and uncertaintysurrounding the potential phase out of tax credits, we enteredinto oil price hedges in conjunction with our synthetic fuel oper-ation. These hedges do not qualify as cash flow hedges underFAS No. 133. Therefore, changes in the fair values of these instru-ments are marked-to-market through interest income at eachreporting period. Correspondingly, we recorded a net loss of $4 million during 2006. At year-end 2006, two hedges with atotal fair value of $5 million remained outstanding.
18 | CONTINGENCIES
GuaranteesWe issue guarantees to certain lenders and hotel owners prima-rily to obtain long-term management contracts. The guaranteesgenerally have a stated maximum amount of funding and aterm of five years or less. The terms of guarantees to lendersgenerally require us to fund if cash flows from hotel operationsare inadequate to cover annual debt service or to repay the loanat the end of the term. The terms of the guarantees to hotelowners generally require us to fund if the hotels do not attainspecified levels of operating profit. Guarantee fundings tolenders and hotel owners are generally recoverable as loansrepayable to us out of future hotel cash flows and/or proceedsfrom the sale of hotels. We also enter into project completionguarantees with certain lenders in conjunction with hotels andTimeshare segment properties that we or our joint venture part-ners are building.
The maximum potential amount of future fundings for guar-antees where we are the primary obligor and the carryingamount of the liability for expected future fundings at year-end2006 are as follows:
Maximum Liability for Future Potential Amount Fundings at
Guarantee Type of Future Fundings Year-end 2006
($ in millions)
Debt service $ 50 $ 1
Operating profit 181 20
Project completion 8 —
Other 29 3
Total guarantees where we are the primary obligor $268 $24
M A R R I O T T I N T E R N A T I O N A L , I N C . 2 0 0 6 | 57
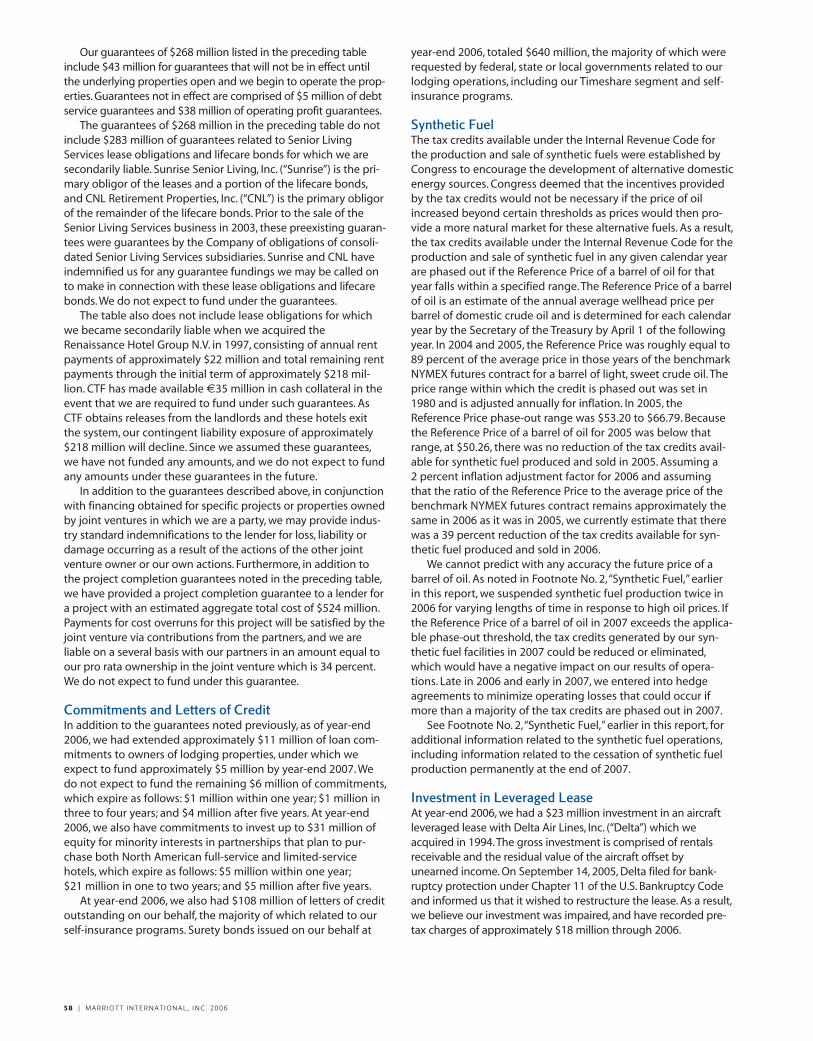
Our guarantees of $268 million listed in the preceding tableinclude $43 million for guarantees that will not be in effect untilthe underlying properties open and we begin to operate the prop-erties. Guarantees not in effect are comprised of $5 million of debtservice guarantees and $38 million of operating profit guarantees.
The guarantees of $268 million in the preceding table do notinclude $283 million of guarantees related to Senior LivingServices lease obligations and lifecare bonds for which we aresecondarily liable. Sunrise Senior Living, Inc. (“Sunrise”) is the pri-mary obligor of the leases and a portion of the lifecare bonds,and CNL Retirement Properties, Inc. (“CNL”) is the primary obligorof the remainder of the lifecare bonds. Prior to the sale of theSenior Living Services business in 2003, these preexisting guaran-tees were guarantees by the Company of obligations of consoli-dated Senior Living Services subsidiaries. Sunrise and CNL haveindemnified us for any guarantee fundings we may be called onto make in connection with these lease obligations and lifecarebonds. We do not expect to fund under the guarantees.
The table also does not include lease obligations for whichwe became secondarily liable when we acquired theRenaissance Hotel Group N.V. in 1997, consisting of annual rentpayments of approximately $22 million and total remaining rentpayments through the initial term of approximately $218 mil-lion. CTF has made available €35 million in cash collateral in theevent that we are required to fund under such guarantees. AsCTF obtains releases from the landlords and these hotels exit the system, our contingent liability exposure of approximately$218 million will decline. Since we assumed these guarantees,we have not funded any amounts, and we do not expect to fundany amounts under these guarantees in the future.
In addition to the guarantees described above, in conjunctionwith financing obtained for specific projects or properties ownedby joint ventures in which we are a party, we may provide indus-try standard indemnifications to the lender for loss, liability ordamage occurring as a result of the actions of the other jointventure owner or our own actions. Furthermore, in addition tothe project completion guarantees noted in the preceding table,we have provided a project completion guarantee to a lender fora project with an estimated aggregate total cost of $524 million.Payments for cost overruns for this project will be satisfied by thejoint venture via contributions from the partners, and we areliable on a several basis with our partners in an amount equal toour pro rata ownership in the joint venture which is 34 percent.We do not expect to fund under this guarantee.
Commitments and Letters of CreditIn addition to the guarantees noted previously, as of year-end2006, we had extended approximately $11 million of loan com-mitments to owners of lodging properties, under which weexpect to fund approximately $5 million by year-end 2007. Wedo not expect to fund the remaining $6 million of commitments,which expire as follows: $1 million within one year; $1 million inthree to four years; and $4 million after five years. At year-end2006, we also have commitments to invest up to $31 million ofequity for minority interests in partnerships that plan to pur-chase both North American full-service and limited-servicehotels, which expire as follows: $5 million within one year;$21 million in one to two years; and $5 million after five years.
At year-end 2006, we also had $108 million of letters of creditoutstanding on our behalf, the majority of which related to ourself-insurance programs. Surety bonds issued on our behalf at
58 | M A R R I O T T I N T E R N A T I O N A L , I N C . 2 0 0 6
year-end 2006, totaled $640 million, the majority of which wererequested by federal, state or local governments related to ourlodging operations, including our Timeshare segment and self-insurance programs.
Synthetic FuelThe tax credits available under the Internal Revenue Code forthe production and sale of synthetic fuels were established byCongress to encourage the development of alternative domesticenergy sources. Congress deemed that the incentives providedby the tax credits would not be necessary if the price of oilincreased beyond certain thresholds as prices would then pro-vide a more natural market for these alternative fuels. As a result,the tax credits available under the Internal Revenue Code for theproduction and sale of synthetic fuel in any given calendar yearare phased out if the Reference Price of a barrel of oil for thatyear falls within a specified range. The Reference Price of a barrelof oil is an estimate of the annual average wellhead price perbarrel of domestic crude oil and is determined for each calendaryear by the Secretary of the Treasury by April 1 of the followingyear. In 2004 and 2005, the Reference Price was roughly equal to89 percent of the average price in those years of the benchmarkNYMEX futures contract for a barrel of light, sweet crude oil. Theprice range within which the credit is phased out was set in1980 and is adjusted annually for inflation. In 2005, theReference Price phase-out range was $53.20 to $66.79. Becausethe Reference Price of a barrel of oil for 2005 was below thatrange, at $50.26, there was no reduction of the tax credits avail-able for synthetic fuel produced and sold in 2005. Assuming a 2 percent inflation adjustment factor for 2006 and assumingthat the ratio of the Reference Price to the average price of thebenchmark NYMEX futures contract remains approximately thesame in 2006 as it was in 2005, we currently estimate that therewas a 39 percent reduction of the tax credits available for syn-thetic fuel produced and sold in 2006.
We cannot predict with any accuracy the future price of abarrel of oil. As noted in Footnote No. 2,“Synthetic Fuel,” earlierin this report, we suspended synthetic fuel production twice in2006 for varying lengths of time in response to high oil prices. Ifthe Reference Price of a barrel of oil in 2007 exceeds the applica-ble phase-out threshold, the tax credits generated by our syn-thetic fuel facilities in 2007 could be reduced or eliminated,which would have a negative impact on our results of opera-tions. Late in 2006 and early in 2007, we entered into hedgeagreements to minimize operating losses that could occur ifmore than a majority of the tax credits are phased out in 2007.
See Footnote No. 2,“Synthetic Fuel,” earlier in this report, foradditional information related to the synthetic fuel operations,including information related to the cessation of synthetic fuelproduction permanently at the end of 2007.
Investment in Leveraged LeaseAt year-end 2006, we had a $23 million investment in an aircraftleveraged lease with Delta Air Lines, Inc. (“Delta”) which weacquired in 1994.The gross investment is comprised of rentalsreceivable and the residual value of the aircraft offset byunearned income. On September 14, 2005, Delta filed for bank-ruptcy protection under Chapter 11 of the U.S. Bankruptcy Codeand informed us that it wished to restructure the lease. As a result,we believe our investment was impaired, and have recorded pre-tax charges of approximately $18 million through 2006.
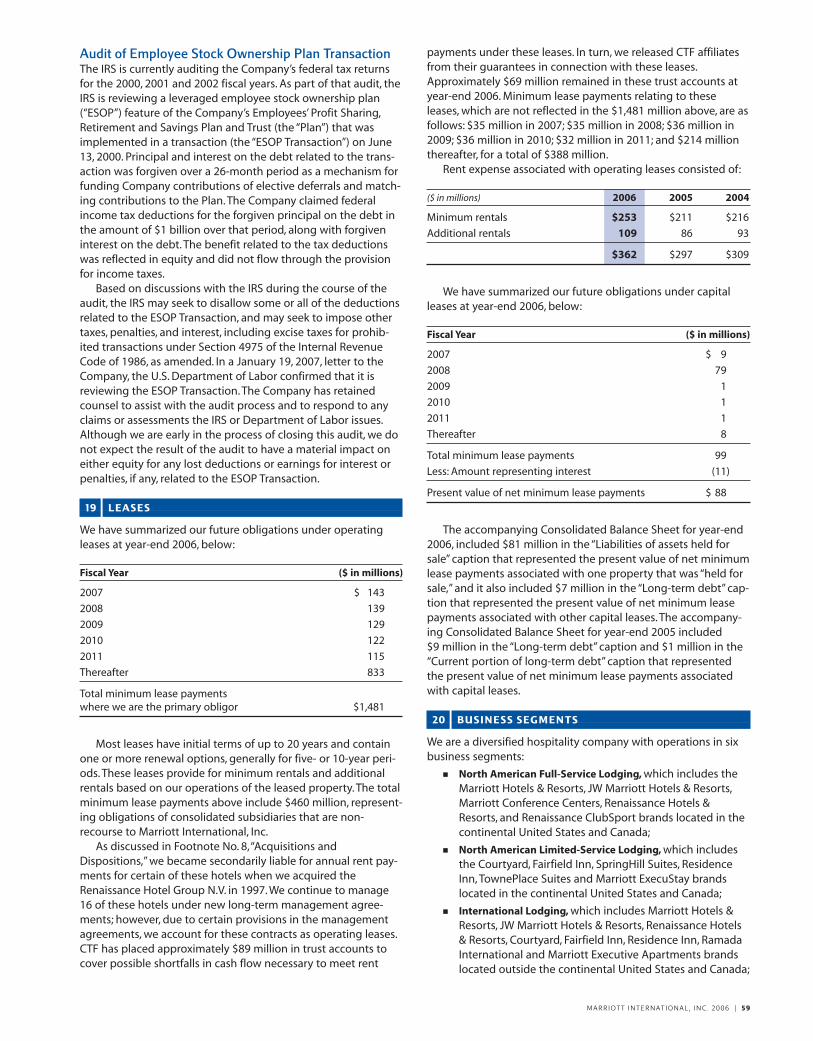
Audit of Employee Stock Ownership Plan TransactionThe IRS is currently auditing the Company’s federal tax returnsfor the 2000, 2001 and 2002 fiscal years. As part of that audit, theIRS is reviewing a leveraged employee stock ownership plan(“ESOP”) feature of the Company’s Employees’ Profit Sharing,Retirement and Savings Plan and Trust (the “Plan”) that wasimplemented in a transaction (the “ESOP Transaction”) on June13, 2000. Principal and interest on the debt related to the trans-action was forgiven over a 26-month period as a mechanism forfunding Company contributions of elective deferrals and match-ing contributions to the Plan. The Company claimed federalincome tax deductions for the forgiven principal on the debt inthe amount of $1 billion over that period, along with forgiveninterest on the debt. The benefit related to the tax deductionswas reflected in equity and did not flow through the provisionfor income taxes.
Based on discussions with the IRS during the course of theaudit, the IRS may seek to disallow some or all of the deductionsrelated to the ESOP Transaction, and may seek to impose othertaxes, penalties, and interest, including excise taxes for prohib-ited transactions under Section 4975 of the Internal RevenueCode of 1986, as amended. In a January 19, 2007, letter to theCompany, the U.S. Department of Labor confirmed that it isreviewing the ESOP Transaction. The Company has retainedcounsel to assist with the audit process and to respond to anyclaims or assessments the IRS or Department of Labor issues.Although we are early in the process of closing this audit, we donot expect the result of the audit to have a material impact oneither equity for any lost deductions or earnings for interest orpenalties, if any, related to the ESOP Transaction.
19 | LEASES
We have summarized our future obligations under operatingleases at year-end 2006, below:
Fiscal Year ($ in millions)
2007 $ 143
2008 139
2009 129
2010 122
2011 115
Thereafter 833
Total minimum lease payments where we are the primary obligor $1,481
Most leases have initial terms of up to 20 years and containone or more renewal options, generally for five- or 10-year peri-ods. These leases provide for minimum rentals and additionalrentals based on our operations of the leased property. The totalminimum lease payments above include $460 million, represent-ing obligations of consolidated subsidiaries that are non-recourse to Marriott International, Inc.
As discussed in Footnote No. 8,“Acquisitions andDispositions,” we became secondarily liable for annual rent pay-ments for certain of these hotels when we acquired theRenaissance Hotel Group N.V. in 1997. We continue to manage16 of these hotels under new long-term management agree-ments; however, due to certain provisions in the managementagreements, we account for these contracts as operating leases.CTF has placed approximately $89 million in trust accounts tocover possible shortfalls in cash flow necessary to meet rent
payments under these leases. In turn, we released CTF affiliatesfrom their guarantees in connection with these leases.Approximately $69 million remained in these trust accounts atyear-end 2006. Minimum lease payments relating to theseleases, which are not reflected in the $1,481 million above, are asfollows: $35 million in 2007; $35 million in 2008; $36 million in2009; $36 million in 2010; $32 million in 2011; and $214 millionthereafter, for a total of $388 million.
Rent expense associated with operating leases consisted of:
($ in millions) 2006 2005 2004
Minimum rentals $253 $211 $216
Additional rentals 109 86 93
$362 $297 $309
We have summarized our future obligations under capitalleases at year-end 2006, below:
Fiscal Year ($ in millions)
2007 $ 9
2008 79
2009 1
2010 1
2011 1
Thereafter 8
Total minimum lease payments 99
Less: Amount representing interest (11)
Present value of net minimum lease payments $ 88
The accompanying Consolidated Balance Sheet for year-end2006, included $81 million in the “Liabilities of assets held forsale” caption that represented the present value of net minimumlease payments associated with one property that was “held forsale,” and it also included $7 million in the “Long-term debt” cap-tion that represented the present value of net minimum leasepayments associated with other capital leases. The accompany-ing Consolidated Balance Sheet for year-end 2005 included $9 million in the “Long-term debt” caption and $1 million in the“Current portion of long-term debt” caption that representedthe present value of net minimum lease payments associatedwith capital leases.
20 | BUSINESS SEGMENTS
We are a diversified hospitality company with operations in sixbusiness segments:
3 North American Full-Service Lodging, which includes theMarriott Hotels & Resorts, JW Marriott Hotels & Resorts,Marriott Conference Centers, Renaissance Hotels &Resorts, and Renaissance ClubSport brands located in thecontinental United States and Canada;
3 North American Limited-Service Lodging, which includesthe Courtyard, Fairfield Inn, SpringHill Suites, ResidenceInn, TownePlace Suites and Marriott ExecuStay brandslocated in the continental United States and Canada;
3 International Lodging, which includes Marriott Hotels &Resorts, JW Marriott Hotels & Resorts, Renaissance Hotels& Resorts, Courtyard, Fairfield Inn, Residence Inn, RamadaInternational and Marriott Executive Apartments brandslocated outside the continental United States and Canada;
M A R R I O T T I N T E R N A T I O N A L , I N C . 2 0 0 6 | 59

3 Luxury Lodging, which includes The Ritz-Carlton andBulgari Hotels & Resorts brands worldwide;
3 Timeshare, which includes the development, marketing,operation and sale of timeshare, fractional and wholeownership properties under the Marriott Vacation Club,The Ritz-Carlton Club, Grand Residences by Marriott andHorizons by Marriott Vacation Club brands worldwide; and
3 Synthetic Fuel, which includes our interest in the opera-tion of coal-based synthetic fuel production facilities.
In addition to the segments above, in 2002 we announcedour intent to sell, and subsequently did sell, our Senior LivingServices business segment and exited our Distribution Servicesbusiness segment.
In 2006, the company analyzed its internal reporting processand implemented changes in the fourth quarter that weredesigned to improve efficiency. As part of this process, we evalu-ated the impact on segment reporting and made certainchanges that were in accordance with U.S. generally acceptedaccounting principles. These reporting changes are in conform-ity with the requirements of FAS No. 131,“Disclosures aboutSegments of an Enterprise and Related Information,” and willbetter enable investors to view the Company the way manage-ment views it. Accordingly, we now report six operating seg-ments as compared to five before the change and indirectadministrative expenses are no longer allocated to our seg-ments. Senior management now allocates resources andassesses performance based on the six operating segments. Therevised segment reporting is reflected throughout this report forall periods presented. Historical figures are presented in a man-ner that is consistent with the revised segment reporting.
We evaluate the performance of our segments based prima-rily on the results of the segment without allocating corporateexpenses, interest expense or indirect general, administrativeand other expenses. With the exception of the Synthetic Fuelsegment, we do not allocate income taxes or interest income toour segments. As note sales are an integral part of the Timesharesegment, we include note sale gains in our Timeshare segmentresults, and we allocate other gains and losses as well as equityearnings or losses from our joint ventures and divisional general,administrative and other expenses to each of our segments.“Other unallocated corporate” represents that portion of our rev-enues, general, administrative and other expenses, equity inearnings or losses, and other gains or losses that are not alloca-ble to our segments.
We have aggregated the brands presented within our North American Full-Service, North American Limited-Service,International and Luxury segments considering their similar eco-nomic characteristics, types of customers, distribution channels,the regulatory business environment of the brands and opera-tions within each segment and our organizational structure andmanagement reporting structure.
Revenues
($ in millions) 2006 2005 2004
North American Full-Service Segment $ 5,196 $ 5,116 $ 4,691
North American Limited-Service Segment 2,060 1,886 1,673
International Segment 1,411 1,017 604
Luxury Segment 1,423 1,333 1,263
Timeshare Segment 1,840 1,721 1,502
Total Lodging 11,930 11,073 9,733
Other unallocated corporate 65 56 45
Synthetic Fuel Segment 165 421 321
$12,160 $11,550 $10,099
Income from Continuing Operations
($ in millions) 2006 2005 2004
North American Full-Service Segment $ 455 $ 349 $ 337
North American Limited-Service Segment 380 303 233
International Segment 237 133 109
Luxury Segment 63 45 35
Timeshare Segment 280 271 203
Total Lodging financial results 1,415 1,101 917
Other unallocated corporate (251) (219) (220)
Synthetic Fuel Segment (after-tax) 5 125 107
Interest income, provision for loan losses and interest expense (excluding the Synthetic Fuel Segment) (72) (55) 55
Income taxes (excluding the Synthetic Fuel Segment) (380) (284) (265)
$ 717 $ 668 $ 594
Equity in Earnings (Losses) of Equity Method Investees
($ in millions) 2006 2005 2004
North American Full-Service Segment $ 2 $21 $ 8
North American Limited-Service Segment — (6) (17)
International Segment — 20 5
Luxury Segment (2) (1) (3)
Timeshare Segment (2) 1 (7)
Total Lodging (2) 35 (14)
Other unallocated corporate 5 1 —
Synthetic Fuel Segment — — (28)
$ 3 $36 $(42)
60 | M A R R I O T T I N T E R N A T I O N A L , I N C . 2 0 0 6

Depreciation and Amortization
($ in millions) 2006 2005 2004
North American Full-Service Segment $ 24 $ 19 $ 26
North American Limited-Service Segment 24 24 21
International Segment 23 18 13
Luxury Segment 7 10 10
Timeshare Segment 39 46 49
Total Lodging 117 117 119
Other unallocated corporate 61 57 39
Synthetic Fuel Segment 10 10 8
$188 $184 $166
Assets
($ in millions) 2006 2005 2004
North American Full-Service Segment $1,104 $1,309 $1,270
North American Limited-Service Segment 565 613 1,058
International Segment 1,225 1,333 897
Luxury Segment 755 656 687
Timeshare Segment 2,560 2,454 2,321
Total Lodging 6,209 6,365 6,233
Other unallocated corporate 2,288 2,062 2,319
Synthetic Fuel Segment 91 103 116
$8,588 $8,530 $8,668
Equity Method Investments
($ in millions) 2006 2005 2004
North American Full-Service Segment $ 18 $ 21 $ 32
North American Limited-Service Segment 35 50 77
International Segment 73 119 84
Luxury Segment 17 18 4
Timeshare Segment 168 115 31
Total Lodging 311 323 228
Other unallocated corporate 21 26 21
$332 $349 $249
Goodwill
($ in millions) 2006 2005 2004
North American Full-Service Segment $406 $407 $407
North American Limited-Service Segment 72 72 72
International Segment 273 273 272
Luxury Segment 170 172 172
Total Lodging $921 $924 $923
Capital Expenditures
($ in millions) 2006 2005 2004
North American Full-Service Segment $ 75 $197 $ 56
North American Limited-Service Segment 38 10 18
International Segment 215 376 3
Luxury Segment 104 84 5
Timeshare Segment 28 27 38
Total Lodging 460 694 120
Other unallocated corporate 69 86 61
$529 $780 $181
Our tax provision of $286 million for 2006 includes: a tax ben-efit and tax credits of $94 million associated with our SyntheticFuel segment; our tax provision of $94 million for 2005 includesa tax benefit and tax credits of $190 million associated with ourSynthetic Fuel segment; and our tax provision of $100 million for2004 includes a tax benefit and tax credits of $165 million asso-ciated with our Synthetic Fuel segment.
Segment expenses include selling expenses directly relatedto the operations of the businesses, aggregating $600 million in2006, $609 million in 2005 and $454 million in 2004. Approxi-mately 90 percent, 90 percent and 94 percent for 2006, 2005,and 2004, respectively, of the selling expenses are related to ourTimeshare segment.
The consolidated financial statements include the followingrelated to operations located outside the United States (whichare predominately related to our International lodging segment):Revenues of $1,869 million in 2006, $1,388 million in 2005, and$972 million in 2004; Lodging financial results of $298 million in2006 (28 percent from Asia, 30 percent from the Americas exclud-ing the United States, 13 percent from the United Kingdom, 19 per-cent from Europe, 8 percent from the Middle East and Africa, and2 percent from Australia), $178 million in 2005 and $163 millionin 2004; and fixed assets of $684 million in 2006 and $574 millionin 2005. Additionally, the “Assets held for sale” caption in ouraccompanying Consolidated Balance Sheet included fixed assetstotaling $348 million and $376 million for year-end 2006 andyear-end 2005, respectively, that were associated with propertieslocated outside the United States. No individual country, otherthan the United States, constitutes a material portion of our rev-enues, financial results or fixed assets.
M A R R I O T T I N T E R N A T I O N A L , I N C . 2 0 0 6 | 61

21 | VARIABLE INTEREST ENTITIES
FIN 46,“Consolidation of Variable Interest Entities” (“theInterpretation”), was effective for all enterprises with variableinterests in variable interest entities created after January 31,2003. FIN 46(R), which was revised in December 2003, was effec-tive for all entities to which the provisions of FIN 46 were notapplied as of December 24, 2003. We applied the provisions of FIN 46(R) to all entities subject to the Interpretation as ofMarch 26, 2004. Under FIN 46(R), if an entity is determined to bea variable interest entity, it must be consolidated by the enter-prise that absorbs the majority of the entity’s expected losses,receives a majority of the entity’s expected residual returns, orboth, the “primary beneficiary.”
We currently consolidate four entities that are variable inter-est entities under FIN 46(R). These entities were established withthe same partner to lease four Marriott-branded hotels. Thecombined capital in the four variable interest entities is less than$1 million, which is used primarily to fund hotel working capital.Our equity at risk is $2 million and we hold 55 percent of thecommon equity shares.
We have one other significant interest in an entity that is avariable interest entity under FIN 46(R). In February 2001, weentered into a shareholders’ agreement with an unrelated thirdparty to form a joint venture to own and lease luxury hotels tobe managed by us. In February 2002, the joint venture signedits first lease with a third-party landlord. We hold 35 percent ofthe equity and 65 percent of the debt. In addition, each equitypartner entered into various guarantees with the landlord toguarantee lease payments. Our maximum exposure to loss is$17 million. We do not consolidate the joint venture since wedo not bear the majority of the expected losses or expectedresidual returns.
In conjunction with the transaction with CTF described morefully in Footnote No. 8,“Acquisitions and Dispositions,” under thecaption “2005 Acquisitions” we manage 15 hotels on behalf offour tenant entities 100 percent owned by CTF, which lease the15 hotels from third-party owners. The entities have minimalequity and minimal assets comprised of hotel working capital.CTF has placed money in a trust account to cover cash flowshortfalls and to meet rent payments. At year-end 2006, the trustaccount held approximately $46 million. The entities are variableinterest entities under FIN 46(R). We do not consolidate the enti-ties, as we do not bear the majority of the expected losses. Weare secondarily liable for rent payments for nine of the 15 hotelsin the event that there are cash flow shortfalls and there is nomoney left in the trust. Future minimum lease paymentsthrough the end of the lease term for these nine hotels totalapproximately $141 million. In addition, we are also secondarilyliable for rent payments of up to $39 million for the six otherhotels in the event that there are cash flow shortfalls.
We also manage one hotel on behalf of a tenant entity 100 percent owned by CTF, which leases the hotel from a third-party owner. The entity has minimal equity and minimal assetscomprised of hotel working capital. CTF has placed money in atrust account to cover cash flow shortfalls and to meet rent pay-ments. At year-end 2006, there was approximately $23 million inthe trust. The entity is a variable interest entity under FIN 46(R).We consolidate the entity as we bear the majority of theexpected losses. We are secondarily liable for rent payments forthis hotel in the event that there is a cash flow shortfall andthere is not money left in the trust. Future minimum lease pay-ments through the end of the lease term total $208 million.
22 | RELATED PARTY TRANSACTIONS
Equity Method InvestmentsWe have equity method investments in entities that own prop-erties where we provide management and/or franchise servicesand receive a fee. In addition, in some cases we provide loans,preferred equity or guarantees to these entities. Our ownershipinterest in these equity method investments generally variesfrom 10 to 50 percent.
The following tables present financial data resulting fromtransactions with these related parties:
Income Statement Data
($ in millions) 2006 2005 2004
Base management fees $ 62 $ 83 $ 72
Incentive management fees 22 14 8
Cost reimbursements 649 936 802
Owned, leased, corporate housing and other revenue 3 22 29
Total revenue $ 736 $1,055 $ 911
General, administrative and other $ (1) $ (19) $ (33)
Reimbursed costs (649) (936) (802)
Gains and other income 28 54 19
Interest income 4 31 74
Reversal of provision for loan losses 1 — 3
Equity in losses—Synthetic fuel — — (28)
Equity in earnings (losses)—Other 3 36 (14)
Balance Sheet Data
($ in millions) 2006 2005
Current assets-accounts and notes receivable $ 76 $ 47
Contract acquisition costs 34 26
Cost method investments 45 166
Equity method investments 332 349
Loans to equity method investees 27 36
Long-term deferred tax assets, net 4 19
Current liabilities:
Accounts payable — (2)
Other payables and accruals (2) (43)
Other long-term liabilities (13) (19)
Summarized information relating to the entities in which wehave equity method investments is as follows:
Income Statement Summary
($ in millions) 2006 2005 2004
Sales $1,479 $1,975 $1,617
Net income (loss) $ 169 $ 259 $ (69)
Balance Sheet Summary
($ in millions) 2006 2005
Assets (primarily comprised of hotel real estate managed by us) $4,348 $5,589
Liabilities $2,837 $3,654
62 | M A R R I O T T I N T E R N A T I O N A L , I N C . 2 0 0 6

M A R R I O T T I N T E R N A T I O N A L , I N C . 2 0 0 6 | 63
JWM Family Enterprises, L.P.JWM Family Enterprises, L.P. (“Family Enterprises”) is a Delawarelimited partnership which is beneficially owned and controlledby members of the family of J.W. Marriott, Jr., the Company’sChairman and Chief Executive Officer, including John W. MarriottIII, the Company’s Vice Chairman, who is Chief Executive Officerof Family Enterprises, and J.W. Marriott, Jr. himself. In July 2006,the Company sold the Dallas, Texas, Renaissance Hotels &Resorts brand hotel to Family Enterprises for a sale price ofapproximately $38 million and recognized a gain of $1 millionon the sale. The Company originally acquired the hotel from athird party in June 2005. The sale to Family Enterprises resultedfrom a competitive auction process involving other unrelatedbidders in which Family Enterprises submitted the most compet-itive bid.
23 | RELATIONSHIP WITH MAJOR CUSTOMER
As of year-end 2006, Host Hotels & Resorts, Inc. (“Host”), knownas Host Marriott Corporation prior to April 18, 2006, owned orleased 153 lodging properties operated by us under long-termagreements. The revenues recognized from lodging propertiesowned or leased by Host (which are included in our NorthAmerican Full-Service, North American Limited-Service, andInternational segments) for the last three fiscal years are shownin the following table:
($ in millions) 2006 2005 2004
Revenues $2,475 $2,427 $2,423
Additionally, Host is a partner in several unconsolidated part-nerships that own lodging properties operated by us underlong-term agreements. As of year-end 2006, Host was affiliatedwith 121 such properties operated by us. The revenues associ-ated with those properties (which are included in our NorthAmerican Full-Service, North American Limited-Service andInternational segments) that were recognized by the Companyfor the last three fiscal years are shown in the following table:
($ in millions) 2006 2005 2004
Revenues $353 $352 $329
In December 2000, we acquired 120 Courtyard by Marriotthotels through the Courtyard Joint Venture, an unconsolidatedJoint Venture with an affiliate of Host, and we and Host ownedequal shares in the Joint Venture. Prior to the formation of theCourtyard Joint Venture, Host was a general partner in theunconsolidated partnerships that owned the 120 Courtyard byMarriott hotels. During the 2005 second quarter, Sarofim RealtyAdvisors, on behalf of an institutional investor, completed theacquisition of a 75 percent interest in the Courtyard Joint Venture,and we signed new long-term management agreements withthe joint venture. With the addition of the new equity, our inter-est in the joint venture has declined to approximately 21 per-cent and Host’s interest declined to less than 4 percent. As partof the completed transaction, our mezzanine loan to the jointventure (including accrued interest) totaling approximately $269 million was repaid. The transaction accelerated the pace of reinventions and upgrades at the joint venture’s 120 hotels,which were substantially complete at year-end 2006.
Shareholder Return Performance Graph — Unaudited
The following graph compares the performance of the Company’s Class A Common Stock from December 28, 2001 to the end of fiscal2006 with the performance of the Standard & Poor’s Corporation Composite 500 Index and the Standard & Poor’s Hotels, Resorts andCruise Lines Index. The graph assumes an initial investment of $100 on December 28, 2001, and reinvestment of dividends.
Comparison of Shareholder Returns among Marriott International, Inc.,the S&P 500 Index and the S&P 500 Hotels, Resorts and Cruise Lines Index
0
50
100
150
200
250
$300
S&P 500 Index
S&P 500 Hotels Index
Marriott International, Inc.
12/29/0612/30/0512/31/041/2/041/3/0312/28/01
Do
llars
Fiscal Year Ended
12/28/01 1/3/03 1/2/04 12/31/04 12/30/05 12/29/06
Marriott International, Inc. 100.0 84.0 113.9 156.4 167.4 240.0
S&P 500 Hotels Index 100.0 92.8 135.1 196.8 199.9 229.1
S&P 500 Index 100.0 79.6 98.8 109.9 115.3 133.5
NOTE: The S&P 500 Hotels, Resorts and Cruise Lines Index includes Carnival plc, Hilton Hotels Corporation, the Company, and Starwood Hotels & Resorts. In August of 2006, WyndhamHotels and Resorts was added to the index.

64 | M A R R I O T T I N T E R N A T I O N A L , I N C . 2 0 0 6
Fiscal Year 2006 (1), (2)
First Second Third Fourth Fiscal($ in millions, except per share data) Quarter (3) Quarter (3) Quarter Quarter Year
Revenues (4) $2,705 $2,891 $2,703 $3,861 $12,160
Operating income (4) $ 203 $ 274 $ 229 $ 305 $ 1,011
Income from continuing operations minority interest $ 170 $ 186 $ 141 $ 220 $ 717
Discontinued operations, net of tax — — — — —
Cumulative effect of change in accounting principle, net of tax (3) (109) — — — (109)
Net income $ 61 $ 186 $ 141 $ 220 $ 608
Diluted earnings per share from continuing operations $ 0.39 $ 0.43 $ 0.33 $ 0.52 $ 1.66
Diluted losses per share from cumulative effect of accounting change (0.25) — — — (0.25)
Diluted earnings per share from discontinued operations — — — — —
Diluted earnings per share $ 0.14 $ 0.43 $ 0.33 $ 0.52 $ 1.41
Fiscal Year 2005 (1), (2)
First Second Third Fourth Fiscal($ in millions, except per share data) Quarter Quarter Quarter Quarter Year
Revenues (4) $2,534 $2,661 $2,714 $3,641 $11,550
Operating income (4) $ 158 $ 41 $ 135 $ 221 $ 555
Income from continuing operations $ 145 $ 138 $ 148 $ 237 $ 668
Discontinued operations, after-tax — — 1 — 1
Net income $ 145 $ 138 $ 149 $ 237 $ 669
Diluted earnings per share from continuing operations $ 0.30 $ 0.29 $ 0.32 $ 0.54 $ 1.45
Diluted earnings per share from discontinued operations — — — — —
Diluted earnings per share $ 0.30 $ 0.29 $ 0.32 $ 0.54 $ 1.45
(1) The quarters consisted of 12 weeks, except for the fourth quarter, which consisted of 16 weeks.(2) All share and per share amounts have been adjusted to reflect the June 2006 stock split. The sum of the earnings per share for the four quarters differs from annual earnings per
share due to the required method of computing the weighted average shares in interim periods.(3) See the Statement of Position 04-2,“Accounting for Real Estate Time-Sharing Transactions,” (“SOP 04-2”) discussions in the “Basis of Presentation” and “New Accounting Standards”
captions in Footnote No. 1,“Summary of Significant Accounting Policies,” located in Part I, Item 8,“Financial Statements and Supplementary Data” of this Annual Report for addi-tional information as both the 2006 “First Quarter” column and the 2006 “Second Quarter” column reflect revisions to previously reported amounts.
(4) Balances reflect the Distribution Services business as discontinued operations.
Quarterly Financial Data — Unaudited

The following table presents a summary of selected historical financial data for the Company derived from our financial statements asof and for our last eight fiscal years.
Since the information in this table is only a summary and does not provide all of the information contained in our financial state-ments, including the related notes, you should read “Management’s Discussion and Analysis of Financial Condition and Results ofOperations” and our Consolidated Financial Statements.
Fiscal Year1
($ in millions, except per share data) 2006 2005 2004 2003 2002 2001 2000 1999
Income Statement Data:Revenues (2) $12,160 $11,550 $10,099 $ 9,014 $ 8,415 $ 7,768 $ 7,911 $ 7,026
Operating income (2) $ 1,011 $ 555 $ 477 $ 377 $ 321 $ 420 $ 762 $ 621
Income from continuing operations $ 717 $ 668 $ 594 $ 476 $ 439 $ 269 $ 490 $ 399Cumulative effect of change in accounting principle (3) (109) — — — — — — —Discontinued operations — 1 2 26 (162) (33) (11) 1
Net income $ 608 $ 669 $ 596 $ 502 $ 277 $ 236 $ 479 $ 400
Per Share Data(4):Diluted earnings per share from continuing operations $ 1.66 $ 1.45 $ 1.24 $ 0.97 $ 0.87 $ 0.52 $ 0.96 $ 0.75Diluted loss per share from cumulative effect
of change in accounting principle (0.25) — — — — — — —Diluted earnings (loss) per share from
discontinued operations — — — 0.05 (0.32) (0.06) (0.02) —
Diluted earnings per share $ 1.41 $ 1.45 $ 1.24 $ 1.02 $ 0.55 $ 0.46 $ 0.94 $ 0.75
Cash dividends declared per share $0.2400 $0.2000 $0.1650 $0.1475 $0.1375 $0.1275 $0.1175 $0.1075
Balance Sheet Data (at end of year):Total assets $ 8,588 $ 8,530 $ 8,668 $ 8,177 $ 8,296 $ 9,107 $ 8,237 $ 7,324Long-term debt (2) 1,818 1,681 836 1,391 1,553 2,708 1,908 1,570Shareholders’ equity 2,618 3,252 4,081 3,838 3,573 3,478 3,267 2,908
Other Data:Base management fees (2) $ 553 $ 497 $ 435 $ 388 $ 379 $ 372 $ 383 $ 352Franchise fees (2) 390 329 296 245 232 220 208 180Incentive management fees (2) 281 201 142 109 162 202 316 268
Total Fees $ 1,224 $ 1,027 $ 873 $ 742 $ 773 $ 794 $ 907 $ 800
Fee Revenue-Source:North America (5) $ 955 $ 809 $ 682 $ 592 $ 626 $ 664 $ 779 $ 690Outside North America 269 218 191 150 147 130 128 110
$ 1,224 $ 1,027 $ 873 $ 742 $ 773 $ 794 $ 907 $ 800
(1) All fiscal years included 52 weeks, except for 2002, which included 53 weeks.(2) Balances reflect our Senior Living Services and Distribution Services businesses as discontinued operations.(3) We adopted Statement of Position 04-2 “Accounting for Real Estate Time-Sharing Transactions,” in our 2006 first quarter which we reported in our Consolidated Statement of
Income as a cumulative effect of change in accounting principle.(4) All per share amounts in the table above have been adjusted to reflect the June 9, 2006, stock split effected in the form of a stock dividend.(5) Includes the Continental United States and Canada.
M A R R I O T T I N T E R N A T I O N A L , I N C . 2 0 0 6 | 65
Selected Historical Financial Data — Unaudited
2006200520042003200220012000
$907
$794
$773
$742
$553
$281
$390
$873
$1,027
TOTAL FEES($ in millions)
$1,224
Base Management Fees
Franchise Fees
Incentive Management Fees
$388
$435
$109
$497
$372
$379
$142
$201
$202
$162
$296
$383
$316
$208 $3
29
$220
$232
$245
2006200520042003200220012000
$1,9
08
$2,7
08
$1,5
53
$1,3
91
$836
$1,6
81
LONG-TERM DEBT ($ in millions)
$1,8
18
2006200520042003200220012000
$0.9
6
$0.5
2
$0.8
7
$0.9
7
$1.2
4 $1.4
5
DILUTED EARNINGS PER SHARE FROM CONTINUING OPERATIONS
$1.6
6

66 | M A R R I O T T I N T E R N A T I O N A L , I N C . 2 0 0 6
RETURN ON INVESTED CAPITAL
Return on Invested Capital (“ROIC”) excluding our synthetic fuel operation is calculated as earnings before income taxes and interestexpense, excluding the synthetic fuel operation, divided by average capital investment. ROIC excluding our synthetic fuel operation isa financial measure that is not presented in accordance with U.S. generally accepted accounting principles. We consider ROIC exclud-ing our synthetic fuel operation to be a meaningful indicator of our operating performance, and we evaluate this metric because itmeasures how effectively we use the money invested in our lodging operations. However, ROIC excluding our synthetic fuel operationshould not be considered an alternative to net income, income from continuing operations or any other operating measure pre-scribed by U.S. generally accepted accounting principles. Additionally, our method of calculating ROIC excluding our synthetic fueloperation may be different from the methods used by other companies and as a result comparability may be limited.
The reconciliation of income from continuing operations to earnings before income taxes and interest expense is as follows:
Fiscal Year 2006 Fiscal Year 2005 Fiscal Year 2004 Fiscal Year 2003
Synthetic Excluding Synthetic Excluding Synthetic Excluding Synthetic ExcludingAs Fuel Synthetic As Fuel Synthetic As Fuel Synthetic As Fuel Synthetic
($ in millions) Reported Impact1 Fuel** Reported Impact1 Fuel** Reported Impact1 Fuel** Reported Impact1 Fuel**
Income from continuing operations $ 717 $ 5 $ 712 $ 668 $ 125 $ 543 $ 594 $ 107 $ 487 $ 476 $ 96 $ 380Add:
Provision (benefit) for income taxes 286 (94) 380 94 (190) 284 100 (165) 265 (43) (245) 202Tax benefit included in
minority interest — — — — — — — — — 94 94 —Interest expense 124 — 124 106 — 106 99 — 99 110 — 110Goodwill amortization 2 — — — — — — — — — — — —Timeshare interest 3 21 — 21 24 — 24 21 — 21 21 — 21
Earnings (losses) before income taxes and interest expense $ 1,148 $(89) $ 1,237 $ 892 $ (65) $ 957 $ 814 $ (58) $ 872 $ 658 $ (55) $ 713
The reconciliation of assets to invested capital is as follows:
Year-End 2006 Year-End 2005 Year-End 2004 Year-End 2003
Synthetic Excluding Synthetic Excluding Synthetic Excluding Synthetic ExcludingFuel Synthetic Fuel Synthetic Fuel Synthetic As Fuel Synthetic
($ in millions) Total Impact1 Fuel** Total Impact1 Fuel** Total Impact1 Fuel** Reported Impact1 Fuel**
Assets $ 8,588 $ 91 $ 8,497 $ 8,530 $ 103 $ 8,427 $ 8,668 $ 116 $ 8,552 $ 8,177 $ 83 $ 8,094Add:
Cumulative goodwill amortization 128 — 128 128 — 128 128 — 128 128 — 128Current liabilities — discontinued
operations — — — — — — — — — — — —Less:
Current liabilities, net of current portion of long-term debt (2,507) (55) (2,452) (2,077) (54) (2,023) (2,005) (76) (1,929) (1,779) (16) (1,763)
Assets — discontinued operations — — — — — — — — — — — —Deferred tax assets, net (865) — (865) (765) — (765) (559) — (559) (466) — (466)Timeshare capitalized interest (19) — (19) (20) — (20) (21) — (21) (22) — (22)
Invested capital $ 5,325 $ 36 $ 5,289 $ 5,796 $ 49 $ 5,747 $ 6,211 $ 40 $ 6,171 $ 6,038 $ 67 $ 5,971
Average capital investment 4 $ 5,561 $ 43 $ 5,518 $ 6,004 $ 45 $ 5,959 $ 6,125 $ 54 $ 6,071 $ 5,755 $ 56 $ 5,699
Return on invested capital ** 22% 16% 14% 13%
** Denotes a non-GAAP financial measure.
1. We acquired the synthetic fuel operations in the 2001 fourth quarter and began operating the facilities in the 2002 first quarter.
2. Beginning with 2002, we stopped amortizing goodwill in conjunction with the adoption of FAS No. 142,“Goodwill and Other Intangible Assets.” For comparability, we add theamortized portion back for 2001, 2000 and 1999.
3. Timeshare interest represents previously capitalized interest that is a component of product cost.
4. Calculated as “Invested capital” for the current year and prior year, divided by two.
Non-GAAP Financial Measure Reconciliation — Unaudited
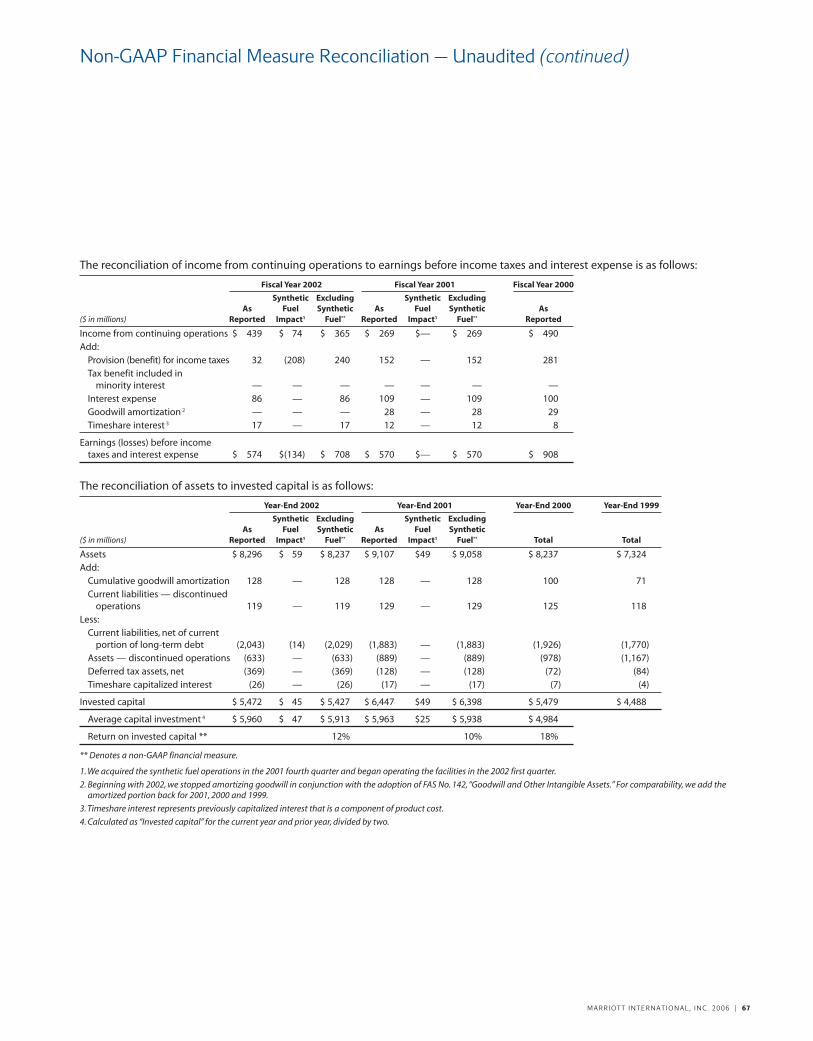
M A R R I O T T I N T E R N A T I O N A L , I N C . 2 0 0 6 | 67
The reconciliation of income from continuing operations to earnings before income taxes and interest expense is as follows:
Fiscal Year 2002 Fiscal Year 2001 Fiscal Year 2000
Synthetic Excluding Synthetic ExcludingAs Fuel Synthetic As Fuel Synthetic As
($ in millions) Reported Impact1 Fuel** Reported Impact1 Fuel** Reported
Income from continuing operations $ 439 $ 74 $ 365 $ 269 $— $ 269 $ 490Add:
Provision (benefit) for income taxes 32 (208) 240 152 — 152 281Tax benefit included in
minority interest — — — — — — —Interest expense 86 — 86 109 — 109 100Goodwill amortization 2 — — — 28 — 28 29Timeshare interest 3 17 — 17 12 — 12 8
Earnings (losses) before income taxes and interest expense $ 574 $(134) $ 708 $ 570 $— $ 570 $ 908
The reconciliation of assets to invested capital is as follows:
Year-End 2002 Year-End 2001 Year-End 2000 Year-End 1999
Synthetic Excluding Synthetic ExcludingAs Fuel Synthetic As Fuel Synthetic
($ in millions) Reported Impact1 Fuel** Reported Impact1 Fuel** Total Total
Assets $ 8,296 $ 59 $ 8,237 $ 9,107 $49 $ 9,058 $ 8,237 $ 7,324Add:
Cumulative goodwill amortization 128 — 128 128 — 128 100 71Current liabilities — discontinued
operations 119 — 119 129 — 129 125 118Less:
Current liabilities, net of current portion of long-term debt (2,043) (14) (2,029) (1,883) — (1,883) (1,926) (1,770)
Assets — discontinued operations (633) — (633) (889) — (889) (978) (1,167)Deferred tax assets, net (369) — (369) (128) — (128) (72) (84)Timeshare capitalized interest (26) — (26) (17) — (17) (7) (4)
Invested capital $ 5,472 $ 45 $ 5,427 $ 6,447 $49 $ 6,398 $ 5,479 $ 4,488
Average capital investment 4 $ 5,960 $ 47 $ 5,913 $ 5,963 $25 $ 5,938 $ 4,984
Return on invested capital ** 12% 10% 18%
** Denotes a non-GAAP financial measure.
1. We acquired the synthetic fuel operations in the 2001 fourth quarter and began operating the facilities in the 2002 first quarter.
2. Beginning with 2002, we stopped amortizing goodwill in conjunction with the adoption of FAS No. 142,“Goodwill and Other Intangible Assets.” For comparability, we add theamortized portion back for 2001, 2000 and 1999.
3. Timeshare interest represents previously capitalized interest that is a component of product cost.
4. Calculated as “Invested capital” for the current year and prior year, divided by two.
Non-GAAP Financial Measure Reconciliation — Unaudited (continued)

Management of Marriott International is responsible for the integrityand objectivity of the consolidated financial statements and otherfinancial information presented in this annual report. In meeting thisresponsibility, we maintain a highly developed system of internal con-trols, policies and procedures, including an internal auditing function.
The consolidated financial statements have been audited byErnst & Young LLP, independent registered public accounting firm.Their report expresses an informed judgment as to whether man-agement’s financial statements, considered in their entirety, fairlypresent our financial position, operating results and cash flows inconformity with U.S. generally accepted accounting principles.
68 | M A R R I O T T I N T E R N A T I O N A L , I N C . 2 0 0 6
Management’s Responsibility for Financial Statements
The Board of Directors pursues its responsibility for the financialstatements through its Audit Committee, composed of four direc-tors not otherwise employed by the company. The committeemeets a minimum of four times during the year with the independ-ent registered public accounting firm, representatives of manage-ment and the internal auditors to review the scope and results ofthe internal and external audits, the accounting principles appliedin financial reporting, and financial and operational controls. Theindependent registered public accounting firm and internal audi-tors have unrestricted access to the Audit Committee, with or with-out the presence of management.
Management of Marriott International, Inc. (the “Company”) isresponsible for establishing and maintaining adequate internal con-trol over financial reporting and for the assessment of the effective-ness of internal control over financial reporting. As defined by theSecurities and Exchange Commission, internal control over financialreporting is a process designed by, or under the supervision of, theCompany’s principal executive and principal financial officers andeffected by the Company’s Board of Directors, management andother personnel, to provide reasonable assurance regarding the reli-ability of financial reporting and the preparation of the consolidatedfinancial statements in accordance with U.S. generally acceptedaccounting principles.
The Company’s internal control over financial reporting is sup-ported by written policies and procedures that: (1) pertain to themaintenance of records that, in reasonable detail, accurately andfairly reflect the Company’s transactions and dispositions of theCompany’s assets; (2) provide reasonable assurance that transac-tions are recorded as necessary to permit preparation of the con-solidated financial statements in accordance with U.S. generallyaccepted accounting principles, and that receipts and expendituresof the Company are being made only in accordance with authoriza-tions of the Company’s management and directors; and (3) providereasonable assurance regarding prevention or timely detection ofunauthorized acquisition, use or disposition of the Company’sassets that could have a material effect on the consolidated finan-cial statements.
Management’s Report on Internal Control Over Financial Reporting
Because of its inherent limitations, internal control over financialreporting may not prevent or detect misstatements. Also, projec-tions of any evaluation of effectiveness to future periods are subjectto the risk that controls may become inadequate because ofchanges in conditions, or that the degree of compliance with thepolicies or procedures may deteriorate.
In connection with the preparation of the Company’s annual consol-idated financial statements, management has undertaken an assess-ment of the effectiveness of the Company’s internal control overfinancial reporting as of December 29, 2006, based on criteria estab-lished in Internal Control-Integrated Framework issued by theCommittee of Sponsoring Organizations of the Treadway Commission(the “COSO Framework”). Management’s assessment included an evalu-ation of the design of the Company’s internal control over financialreporting and testing of the operational effectiveness of those controls.
Based on this assessment, management has concluded that as ofDecember 29, 2006, the Company’s internal control over financialreporting was effective to provide reasonable assurance regardingthe reliability of financial reporting and the preparation of financialstatements for external purposes in accordance with U.S. generallyaccepted accounting principles.
Ernst & Young LLP, the independent registered public accountingfirm that audited the Company’s consolidated financial statementsincluded in this report, has issued an attestation report on manage-ment’s assessment of internal control over financial reporting, acopy of which appears on the next page of this annual report.

M A R R I O T T I N T E R N A T I O N A L , I N C . 2 0 0 6 | 69
To the Board of Directors and Shareholders of Marriott International, Inc.:
We have audited management’s assessment, included in the accom-panying Management’s Report on Internal Control Over FinancialReporting, that Marriott International, Inc. maintained effective inter-nal control over financial reporting as of December 29, 2006, basedon criteria established in Internal Control-Integrated Frameworkissued by the Committee of Sponsoring Organizations of theTreadway Commission (“the COSO criteria”). Marriott International,Inc.’s management is responsible for maintaining effective internalcontrol over financial reporting and for its assessment of the effec-tiveness of internal control over financial reporting. Our responsibil-ity is to express an opinion on management’s assessment and anopinion on the effectiveness of the company’s internal control overfinancial reporting based on our audit.
We conducted our audit in accordance with the standards of thePublic Company Accounting Oversight Board (United States). Thosestandards require that we plan and perform the audit to obtain rea-sonable assurance about whether effective internal control overfinancial reporting was maintained in all material respects. Our auditincluded obtaining an understanding of internal control over finan-cial reporting, evaluating management’s assessment, testing andevaluating the design and operating effectiveness of internal con-trol, and performing such other procedures as we considered neces-sary in the circumstances. We believe that our audit provides areasonable basis for our opinion.
A company’s internal control over financial reporting is a processdesigned to provide reasonable assurance regarding the reliability offinancial reporting and the preparation of financial statements for exter-nal purposes in accordance with generally accepted accounting princi-ples. A company’s internal control over financial reporting includesthose policies and procedures that (1) pertain to the maintenance ofrecords that, in reasonable detail, accurately and fairly reflect the trans-actions and dispositions of the assets of the company; (2) provide rea-sonable assurance that transactions are recorded as necessary to permit
Report of Independent Registered Public Accounting Firm on Internal Control Over Financial Reporting
preparation of financial statements in accordance with generallyaccepted accounting principles, and that receipts and expenditures ofthe company are being made only in accordance with authorizations ofmanagement and directors of the company; and (3) provide reasonableassurance regarding prevention or timely detection of unauthorizedacquisition, use, or disposition of the company’s assets that could have amaterial effect on the financial statements.
Because of its inherent limitations, internal control over financialreporting may not prevent or detect misstatements. Also, projec-tions of any evaluation of effectiveness to future periods are subjectto the risk that controls may become inadequate because ofchanges in conditions, or that the degree of compliance with thepolicies or procedures may deteriorate.
In our opinion, management’s assessment that MarriottInternational, Inc. maintained effective internal control over financialreporting as of December 29, 2006, is fairly stated, in all materialrespects, based on the COSO criteria. Also, in our opinion, MarriottInternational, Inc. maintained, in all material respects, effective inter-nal control over financial reporting as of December 29, 2006, basedon the COSO criteria.
We also have audited, in accordance with the standards of thePublic Company Accounting Oversight Board (United States), the con-solidated balance sheet of Marriott International, Inc. as of December29, 2006 and December 30, 2005, and the related consolidated state-ments of income, cash flows, comprehensive income and sharehold-ers’ equity for each of the three fiscal years in the period endedDecember 29, 2006, of Marriott International, Inc. and our report datedFebruary 20, 2007 expressed an unqualified opinion thereon.
McLean, VirginiaFebruary 20, 2007
To the Board of Directors and Shareholders of Marriott International, Inc.:
We have audited the accompanying consolidated balance sheets ofMarriott International, Inc. as of December 29, 2006 and December30, 2005, and the related consolidated statements of income, cashflows, comprehensive income and shareholders’ equity for each ofthe three fiscal years in the period ended December 29, 2006. Thesefinancial statements are the responsibility of the Company’s man-agement. Our responsibility is to express an opinion on these finan-cial statements based on our audits.
We conducted our audits in accordance with the standards of thePublic Company Accounting Oversight Board (United States). Thosestandards require that we plan and perform an audit to obtain rea-sonable assurance about whether the financial statements are free ofmaterial misstatement. An audit includes examining, on a test basis,evidence supporting the amounts and disclosures in the financialstatements. An audit also includes assessing the accounting princi-ples used and significant estimates made by management, as well asevaluating the overall financial statement presentation. We believethat our audits provide a reasonable basis for our opinion.
In our opinion, the financial statements referred to above presentfairly, in all material respects, the consolidated financial position ofMarriott International, Inc. as of December 29, 2006 and December 30,2005, and the consolidated results of its operations and its cash flows
Report of Independent Registered Public Accounting Firm
for each of the three fiscal years in the period ended December 29,2006, in conformity with U.S. generally accepted accounting principles.
As discussed in Note 1 to the financial statements, in 2006 the Company changed its accounting for real estate time-sharingtransactions in connection with the adoption of Statement ofPosition 04-2,“Accounting for Real Estate Time-sharing Trans-actions,” and changed its accounting for stock-based compensationin connection with the adoption of FASB Statement No. 123(R),“Share-Based Payment.”
We also have audited, in accordance with the standards of thePublic Company Accounting Oversight Board (United States), theeffectiveness of Marriott International, Inc.’s internal control overfinancial reporting as of December 29, 2006, based on criteriaestablished in Internal Control-Integrated Framework issued by the Committee of Sponsoring Organizations of the TreadwayCommission and our report dated February 20, 2007, expressed an unqualified opinion thereon.
McLean, VirginiaFebruary 20, 2007

7 0 | M A R R I O T T I N T E R N A T I O N A L , I N C . 2 0 0 6
DIRECTORSJ.W. MARRIOTT, JR.1
Chairman of the Board andChief Executive OfficerMarriott International, Inc.
JOHN W. MARRIOTT III
Vice Chairman of the Board,Marriott International, Inc., and Chief Executive Officer,JWM Family Enterprises, L.P.
RICHARD S. BRADDOCK3
Chairman, MidOcean Partners, andChairman, Fresh Direct
LAWRENCE W. KELLNER1,2,4
Chairman of the Board and Chief Executive OfficerContinental Airlines, Inc.
DEBRA L. LEE4,5
Chairman and Chief Executive OfficerBET Networks
FLORETTA DUKES McKENZIE3,4
Senior Advisor, American Institute for Research, andFormer Founder and Chairwoman,The McKenzie Group
GEORGE MUÑOZ2,4,5
PrincipalMuñoz Investment Banking Group, L.L.C.
HARRY J. PEARCE3,5
ChairmanNortel Networks
WILLIAM J. SHAW5
President and Chief Operating OfficerMarriott International, Inc.
LAWRENCE M. SMALL2,3
SecretaryThe Smithsonian Institution
DIRECTOR EMERITUSSTERLING D. COLTON
CHAIRMAN EMERITUSTHE RITZ-CARLTON HOTEL COMPANY, L.L.C.WILLIAM R. TIEFEL
SENIOR EXECUTIVE OFFICERSJ.W. MARRIOTT, JR.†
Chairman of the Board andChief Executive Officer
WILLIAM J. SHAW†
President and Chief Operating Officer
EDWARD A. RYAN†
Executive Vice President andGeneral Counsel
ARNE M. SORENSON†
Executive Vice President,Chief Financial Officer andPresident – Continental European Lodging
JAMES M. SULLIVAN†
Executive Vice PresidentLodging Development
CORPORATE OFFICERSLINDA A. BARTLETT
Executive Vice PresidentFinance, International Lodging
CARL T. BERQUIST†
Executive Vice PresidentFinancial Information and Enterprise Risk Management
A. BRADFORD BRYAN, JR.
Executive Vice PresidentArchitecture and Construction
SIMON F. COOPER†
President and Chief Operating OfficerThe Ritz-Carlton Hotel Company, L.L.C.
MICHAEL E. DEARING
Executive Vice PresidentProject Finance
VICTORIA L. DOLAN
Executive Vice President – Finance andChief Financial Officer – Marriott Vacation Club International
JOEL M. EISEMANN
Executive Vice PresidentOwner and Franchise Services
JAMES C. FISHER
Senior Vice PresidentOwner and Franchise Services
PAUL FOSKEY
Executive Vice PresidentLodging Development – Asia Pacific
EDWIN D. FULLER†
President and Managing DirectorMarriott Lodging – International
STEVEN M. GOLDMAN
Senior Vice President and Associate General Counsel
DAVID J. GRISSEN
Executive Vice President – Lodging Operations
CAROLYN B. HANDLON5
Executive Vice President – Financeand Global Treasurer
DEBORAH MARRIOTT HARRISON
Vice PresidentGovernment Affairs
RICHARD S. HOFFMAN
Executive Vice PresidentMergers, Acquisitions and Development Planning
MICHAEL E. JANNINI
Executive Vice President and General ManagerGlobal Brand Strategy and Innovation
NORMAN K. JENKINS5
Senior Vice PresidentLodging Development – North America
STEPHEN P. JOYCE
Executive Vice PresidentOwner and Franchise Services and North American Full Service Development
KEVIN P. KEARNEY
Executive Vice PresidentLodging Development – Europe
KARL KILBURG
Executive Vice President – International Operations
Directors and Officers*
KEVIN M. KIMBALL
Executive Vice President – Finance
THOMAS E. LADD
Senior Vice President – Government Affairs
NANCY C. LEE
Senior Vice President andDeputy General Counsel
KATHLEEN MATTHEWS5
Executive Vice PresidentGlobal Communications and Public Affairs
ROBERT J. MCCARTHY†
PresidentNorth American Lodging Operations and Global Brand Management
AMY C. MCPHERSON5
Executive Vice PresidentGlobal Sales and Marketing
SCOTT E. MELBY
Executive Vice PresidentDevelopment Planning and Feasibility
ROBERT A. MILLER
President – Marriott Leisure
PAMELA G. MURRAY
Executive Vice PresidentEnterprise Accounting Services
DARYL A. NICKEL
Executive Vice President – Lodging DevelopmentSelect-Service and Extended-Stay Brands
LAURA E. PAUGH
Senior Vice President – Investor Relations
M. LESTER PULSE, JR.
Executive Vice President – Taxes
DAVID A. RODRIGUEZ5,†
Executive Vice PresidentGlobal Human Resources
DAVID M. SAMPSON5
Senior Vice President – Diversity Initiatives
TERRI L. TURNER
Vice President, Corporate Secretary and Assistant General Counsel
ROBIN J. ULER
Senior Vice PresidentOperations Planning and Support
STEPHEN P. WEISZ†
PresidentMarriott Vacation Club International
CARL WILSON
Executive Vice President andChief Information Officer
LEGEND
* All information as of March 5, 2007.1 Executive Committee2 Audit Committee3 Compensation Policy Committee4 Nominating and Corporate Governance Committee5 Committee for Excellence† Executive officer as defined under the Securities
Exchange Act of 1934

CORPORATE HEADQUARTERSMarriott International, Inc.Marriott DriveWashington, DC 20058301/380-3000Internet: Marriott.com
COMMON STOCK LISTINGSThe company’s Class A common stock (tickersymbol: MAR) is listed on the New York StockExchange and other exchanges.
SHAREHOLDERS OF RECORDAt January 26, 2007, there were 387,952,048shares of Class A Common Stock outstandingheld by 49,505 shareholders of record.
INVESTOR RELATIONSFor information, call: 301/380-6500Internet: Marriott.com/investor
INDEPENDENT REGISTERED PUBLIC ACCOUNTING FIRMErnst & Young LLPMcLean, Virginia
ANNUAL MEETING OF SHAREHOLDERSApril 27, 2007 — 10:30 a.m.JW Marriott Hotel1331 Pennsylvania Avenue, NWWashington, DC 20004
REGISTRAR AND TRANSFER AGENTShareholder inquiries regarding stock transfers,dividend payments, address changes, enrollmentin the company’s direct investment plan, loststock certificates, or other stock account mattersshould be directed to:
Mellon Investor Services480 Washington Blvd., 29th FloorJersey City, NJ 07310800/311-4816 (U.S. and Canada)+1 201/680-6693 (International)Internet: www.melloninvestor.com
Board of Directors
Internet Users: We invite you to learn more about Marriott’s business andgrowth opportunities at Marriott.com/investor. Our investor site includesinvestor presentations, earnings conference calls, press releases, SEC filings, com-pany history, and information about the company’s governance and board ofdirectors. You may also enroll in our dividend reinvestment plan.
Shareholders may also elect to receive notices of shareholder meetings, proxymaterials and annual reports electronically through the Internet. If your shares areregistered in your own name, and not in “street name” through a broker or othernominee, simply log in to Investor ServiceDirect, the Internet site maintained byour transfer agent, Mellon Investor Services LLC, at www.melloninvestor.com/isdand the step-by-step instructions will prompt you through enrollment.
COMMON STOCK PRICES AND DIVIDENDS
DividendsStock Price Declared
High Low Per Share
2005– First quarter ........ $34.00 $30.36 $0.0425– Second quarter.. 35.01 30.20 0.0525– Third quarter....... 35.39 30.21 0.0525– Fourth quarter ... 34.16 29.01 0.0525
2006– First quarter ........ $35.35 $32.32 $0.0525– Second quarter.. 38.38 34.20 0.0625– Third quarter....... 38.44 34.30 0.0625– Fourth quarter ... 48.31 37.19 0.0625
TELEPHONE NUMBERSFor reservations or information, call:
Marriott Hotels & Resorts ................. 800/228-9290Marriott Conference Centers........... 800/453-0309Renaissance Hotels & Resorts ......... 800/468-3571The Ritz-Carlton Hotel
Company, L.L.C. ................................. 800/241-3333Bulgari Hotels & Resorts.................... 301/547-4900JW Marriott Hotels & Resorts .......... 800/228-9290Courtyard................................................ 800/321-2211SpringHill Suites................................... 888/287-9400Fairfield Inn ............................................ 800/228-2800Residence Inn........................................ 800/331-3131TownePlace Suites............................... 800/257-3000Marriott Executive Apartments ...... 800/800-5744Marriott ExecuStay .............................. 800/800-5744Marriott Vacation Club....................... 866/300-3032Horizons by Marriott
Vacation Club .................................... 866/300-3032Grand Residences by Marriott ........ 866/894-7263The Ritz-Carlton Club ......................... 800/941-4386
Corporate Information
[BACK ROW, LEFT TO RIGHT] LAWRENCE M. SMALL, RICHARD S. BRADDOCK, JOHN W. MARRIOTT III, HARRY J. PEARCE, LAWRENCE W. KELLNER[FRONT ROW, LEFT TO RIGHT] DEBRA L. LEE, WILLIAM J. SHAW, J.W. MARRIOTT, JR., FLORETTA DUKES MCKENZIE, GEORGE MUÑOZ
© M A R R I O T T I N T E R N A T I O N A L , I N C . 2 0 0 7 A L L R I G H T S R E S E R V E D . P R I N T E D O N R E C Y C L E D P A P E R . M A R R I O T T I N T E R N A T I O N A L , I N C . 2 0 0 6 | 71
LODGING DEVELOPMENT INQUIRIESNorth America Full-Service ................ 301/380-3200North America Select-Service and
Extended-Stay ..................................... 301/380-5237Caribbean and Latin America............ 301/380-2340Europe, the Middle East
and Africa .......................................... 41-44-723-5100Asia/Pacific ............................................. 852-2521-1848Internet: www.MarriottDevelopment.com
CEO AND CFO CERTIFICATIONSAs required by the New York Stock Exchange list-ing rules, our Chief Executive Officer certified tothe New York Stock Exchange on May 24, 2006, thathe was not aware of any violation by the companyof the New York Stock Exchange listing standardsas of that date. In addition, our Chief ExecutiveOfficer and our Chief Financial Officer have pro-vided certifications with respect to the company’spublic disclosures as required under Rule 13a-14(a)and Rule 13a-14(b) of the Securities Exchange Act,which certifications were either furnished or filedas Exhibits 31.1, 31.2 and 32 to the company’sAnnual Report on Form 10-K for fiscal year 2006filed with the Securities and Exchange Commission.
OTHER INFORMATIONAny shareholder who would like a copy of thecompany’s Annual Report on Form 10-K for fiscalyear 2006 may obtain one, without charge, byaddressing a request to the Secretary, MarriottInternational, Inc., Department 52/862, MarriottDrive, Washington, DC 20058. The company’scopying costs will be charged if copies of exhibitsto the Annual Report on Form 10-K are requested. You may also obtain a copy of theAnnual Report on Form 10-K for fiscal year 2006,including exhibits, from the company’s web siteat Marriott.com/investor, clicking on “CorporateInformation and SEC Filings.”

YEARS
S P I R I T
T O S E R V E
A Pledge to Social Responsibility
We are committed to environmental stewardship.Our North American hotels are now smoke-free forbetter health and indoor air quality. We initiated ourECHO — Environmentally Conscious HospitalityOperations — program 12 years ago, focusing onwater and energy conservation, and communitycleanups during our observance of EnvironmentalAwareness Month in April. Marriott will also worktogether with Clean Up the World, a global environ-mental group, to help drive eco-conscious efforts onthe road, at work, at home and in our communities.
As the first hospitality management company in theEnvironmental Protection Agency’s Climate Leadersprogram, we are on track to meet our greenhouse gas reduction commitment of 6 percent per availableroom by 2010, having reduced our emissions 2 per-cent this year. Marriott has the most ENERGY STARhotels in the industry and, in partnership with owners,we are developing more sustainable hotels that willbe eligible for certifications such as LEED—Leadershipin Energy and Environmental Design — which isawarded by the U.S. Green Building Council.
We are proud that we gave voice in 2006 to significant issues for the travel industry. Weaddressed such topics as the protection of childrenfrom sexual exploitation, human rights, business ethics,and visa and immigration reform at important forums,including the World Travel and Tourism Conference,the United Nations World Tourism Organization andthe Foreign Policy Association, which presented uswith its 2006 Corporate Social Responsibility Award.
As we celebrate our 80th year, Marriott renews itscommitment to the thousands of communities aroundthe world where we do business. Social responsibilityand community engagement are integral to our futureand a vibrant part of our history — it’s a tradition wecall “Spirit To Serve Our Communities.®”
Marriott is committed to food and shelter programs.Through our 15-year support of America’s SecondHarvest, we recognize hunger as a critical issue. Incollaboration with Habitat for Humanity International,our associates helped build homes in New Orleans;Phuket, Thailand; Mexico City; and Washington, DC.
We support education and workforce development
through youth-focused programs including theNational Academy Foundation, Distributive EducationClubs of America, the National Urban League andthe Hispanic College Fund in the United States.Globally, Marriott is the hotel industry champion of the International Business Leaders Forum’s Youth Career Initiative.
Marriott promotes the health, well-being and
protection of children through thousands of volun-teer hours, raising funds and donating goods and services. This year, we helped Safe Kids Worldwidelaunch a child-safety education program that reached220,000 students in China. In North America, we andour associates donated nearly $7 million in 2006 toChildren’s Miracle Network hospitals, which provideessential medical care for children in more than 170 communities.
You can learn more about Marriott’s community, environmental and human rights initiatives at
www.Marriott.com.
MARRIOTT DRIVE • WASHINGTON, D.C. • 20058 • MARRIOTT.COM