Maroondah 2040 Research ReportMaroondah is considered a middle-outer ring municipality within...
50
Maroondah 2040 Research Report FINAL 130531 Maroondah 2040 Research Report Maroondah City Council May 2013
Transcript of Maroondah 2040 Research ReportMaroondah is considered a middle-outer ring municipality within...

Maroondah 2040 Research Report FINAL 130531
Maroondah 2040 Research Report Maroondah City Council May 2013
This report has been prepared for Maroondah City Council. SGS Economics and Planning has taken all due care in the preparation of this report. However, SGS and its associated consultants are not liable to any person or entity for any damage or loss that has occurred, or may occur, in relation to that person or entity taking or not taking action in respect of any representation, statement, opinion or advice referred to herein. SGS Economics and Planning Pty Ltd ACN 007 437 729 www.sgsep.com.au Offices in Brisbane, Canberra, Hobart, Melbourne, Sydney

TABLE OF CONTENTS
1 INTRODUCTION 1 2 PLACE 2 Maroondah in the metropolitan context 3
Transport and accessibility 4
Sustainable transport 5
‘Living Locally: The 20 minute city’ 6
Implications for Maroondah in the future 7
3 PEOPLE 8 Population and housing 9
Household type 10
Type and mix of dwellings 11
Population age profile 12
Income 13
Education 14
Cultural diversity 15
Health and wellbeing 18
Adolescent health 20
Family violence 21
Gambling 21
Implications for Maroondah in the future 22
4 ECONOMY 23 Maroondah’s economy: jobs 24
Maroondah economy: productivity 25
Maroondah’s workforce 26
Maroondah’s working population 27
Implications for Maroondah in the future 28
5 ENVIRONMENT 29 Natural environment 30
Open space 31
Built form 32
Infrastructure 33
A changing climate 34
Risks to local government 35
Implications for Maroondah in the future 38
6 GOVERNANCE 39 Contemporary role of local government 39
Financial pressures 40
Other emerging issues for local government 41
Implications for Maroondah in the future 41
REFERENCE MATERIAL AND FURTHER READING 42

2
LIST OF FIGURES
FIG URE 1. ME LBO UR NE ’S LAB OUR SUB- MAR KET S 3 FIG URE 2. E FFECT IVE JOB DE NSIT Y BE FOR E THE CO MPLE T IO N
O F E AST L INK 4 FIG URE 3. E FFECT IVE JOB DE NSIT Y AFTER THE CO MPLE T ION
O F E AST L INK 4 FIG URE 4. PUBL IC TRANSPORT ACC ESS L EVEL S ( PTAL ) FOR
MAROO NDAH 5 FIG URE 5. R INGWOOD E AST CATCH ME NT S, MOR NING PEAK,
CAR 6 FIG URE 6. R INGWOOD E AST CATCH ME NT, MORNING PE A K,
PUBL IC TRANSPORT 6 FIG URE 7. AVERAG E ANNUAL PO PULAT ION GROWTH R ATE S,
2001 TO 2041 9 FIG URE 8. MAROO NDAH AG E PRO FIL E 2001 T0 2041 12 FIG URE 9. ME LBO UR NE AGE PRO FILE 2001 T 0 2041 12 FIG URE 10. QUAL IFICAT IO N T Y PE O F PO PUL AT IO N WITH PO ST
SECO NDARY QUALIFIC AT IO NS 14 FIG URE 11. PERCE NTAGE CH ANGE O F PO PUL AT IO N WITH A
PO ST SECONDARY QUALI FIC AT IO N, 2006- 2011 14 FIG URE 12. COUNTRY O F BIRTH OTH ER TH AN AUSTR AL IA, 2 011 16 FIG URE 13. CH ANGE IN CO UNTRY O F B IRTH OTHER TH AN
AUSTRAL IA, 2001- 2011 16 FIG URE 14. L ANG UAG E SPO KE N AT HO ME OTHER TH AN E NG L ISH ,
2011 17 FIG URE 15. CH ANGE IN L ANG UAGE SPO KE N AT H O ME , 2001 TO
2011 17 FIG URE 16. MAJOR CH ANGE S IN MAR OO NDAH ’S E MPLOY ME NT
2001- 2041 24
FIG URE 17. GRO SS VALUE ADDED BY INDUSTRY ( AND TOTAL FOR ALL INDUSTRIE S) FOR MAROO NDAH , 2001 TO 2041 25
FIG URE 18. OR IG IN O N MAROO NDAH ’ S WOR KFORCE, 2006 AND 2011 26
FIG URE 19. OR IG IN O F MAR OOND AH’ S WOR KFORCE, 2011 26 FIG URE 20. DE STINAT IO N O F MAROO NDAH ’S WOR KING
RE SIDE NT PO PUL AT IO N, 2006 AND 2011 27 FIG URE 21. DE STINAT IO N O F MAROO NDAH ’S WOR KING
RE SIDE NT PO PUL AT IO N, 2011 27 FIG URE 22. H AB ITAT CORRIDOR S IN MAR OOND AH 30 FIG URE 23. ACCE SS TO O PE N SPACE GREATER TH AN 5,000SQ M 31 FIG URE 24. 2008 AVERAGE SITE DE NSITY BY ME SH B LOC K,
MAROO NDAH (C) 32 FIG URE 25. AVERAG E ANNUAL INCREASE IN LGCI AND CPI 40

LIST OF TABLES
TABL E 1. ME LBO UR NE ’S LAB OUR MAR KET S 3 TABL E 2. PO PUL AT IO N AND DWE LL ING S, 2001 TO 2041 9 TABL E 3. HO USEHOLD STRUCT URE , 2006 TO 2011 10 TABL E 4. DWE LL ING S BY H OUSEHO LD STR UCTUR E, 2006- 2011 11 TABL E 5. INCO ME CATE GORY ( PER WE E K) , 2006- 2011
CH ANGE BY SUB URB 13 TABL E 6. PERCE NTAGE O F RE SIDE NT PO PUL AT IO N BORN
OVER SE AS 15 TABL E 7. SE LECT ED PHY SIC AL HE ALTH IND ICATOR S, PER 100
O F PO PUL AT IO N, 2007- 08 18 TABL E 8. PO PUL AT IO N O VERWE IGH T OR OBE SE 18 TABL E 9. SE LECT ED ME NTAL HE ALTH IND ICATOR S, PER 100
O F PO PUL AT IO N, 2007- 08 18 TABL E 10. SE LECT ED NUTR IT IO N, PHY SIC AL AND R ECREAT IO N
IND ICATOR S 19 TABL E 11. SE LECT ED AD OLE SCE NT HE ALTH IND ICATOR S 20 TABL E 12. FAMILY V IO LE NCE INCID ENT S RE PORTED TO PO L ICE
2009- 10, PER 1,000 O F PO PUL AT IO N 21 TABL E 13. E LECTRONIC G AMING MACH INE S MAROO NDAH,
2012 21


1
1 INTRODUCTION
This report contains background information on current trends and emerging issues that are likely to impact on the future of Maroondah from now until 2040 and beyond. The purpose of this report is to provide an overview of key issues, that will help Maroondah’s local community and other stakeholders participate in an informed way, in the development of a new community vision for Maroondah. As it is intended that this vision extends to the year 2040, this report considers both established and emerging trends that are likely to impact the municipality in the longer term. Some of the most significant longer term changes include demographic change, changes to the composition of the local economy, changes to travel behaviours and the need to adapt to climate change.
The report is organised under five themes: Place, People, Economy, Environment and Governance. These themes have been chosen to allow clear presentation of the data, literature and evidence available. After presentation of key data, each section concludes with a discussion of the implications for Maroondah. By presenting the report under these themes, it is not the intention to suggest that they could, or should, be treated as separate concerns; they are each intrinsically linked and the process of developing a future vision needs to be equally cognisant of all five themes and the interactions between them. This report is part of a range of initiatives that the City of Maroondah has undertaken to promote informed discussion and debate about the future of the Maroondah, as a place and as a community. Your contributions and feedback are welcomed. These can be provided by accessing the discussion forum for the project via www.maroondah.vic.gov.au

2
2 PLACE
As part of a larger metropolitan area, Maroondah is subject to the influence of broader trends. To understand Maroondah’s place in the broader metropolis it is important to examine its location within, and connections to, the Melbourne metropolitan area. Emerging trends and issues for Maroondah are closely linked to the trends for growth and change in metropolitan Melbourne. Maroondah’s location makes it a ‘gateway’ between metropolitan Melbourne and the Yarra Valley and Dandenong Ranges. Ringwood is an important higher order activity centre within Melbourne’s east. Although smaller, Croydon is also a significant centre within the municipality. Recent transportation projects, such as Eastlink, have resulted in increased integration between Maroondah, Melbourne’s eastern region and the broader metropolis. Maroondah’s location within, and connections to, the broader metropolitan structure have been, and will continue to be, a key influence on future growth and change. As a place, Maroondah features a diversity of residential areas, activity centres, open space and employment precincts. It has undulating topography, established trees and gardens and views to and from surrounding ridgelines that have been identified as important features by the local community.

3
Maroondah in the metropolitan context
Analysis of journey-to-work patterns evident in the 2011 ABS Census shows that Melbourne is made up of six relatively self- contained labour markets. This analysis demonstrates functional economies and geographies where Melbourne’s population lives and works. Ringwood specifically, and Maroondah generally, are located at the heart of an east labour sub-market. This underscores the importance of Maroondah’s physical location within Melbourne’s economic geography. Ringwood is the ‘capital’ for the Eastern Region – a role it shares with Box Hill, though, arguably, Box Hill is now more closely affiliated with the inner urban economy. The east labour sub-market is slightly smaller than the south east, with 208,000 jobs and 279,000 working residents (see text box below). As the Eastern Region has no significant growth fronts, growth pressures will exert themselves ‘internally’, within existing urbanised areas. TAB LE 1. ME LBO UR NE ’S LAB OUR MAR KET S
SE L F-CONTAINMENT, 2011
FIGUR E 1. ME LBO UR NE ’S LAB OUR SUB- MAR KET S
Source: SGS Economics and Planning, 2013
Total jobs Jobs filled by local residents
Total working residents
Working residents in local jobs
Inner 732,000 51% 479,000 78% West 186,000 65% 233,000 51%
North 176,000 68% 240,000 50%
East 208,000 72% 279,000 54% South East 305,000 62% 315,000 60%
Mornington Peninsula
81,000 81% 110,000 60%
Source: SGS Economics and Planning, based on ABS Census 2011

4
Transport and accessibility
Recent transport infrastructure investments have increased connectivity and accessibility between Maroondah and the broader metropolitan area. Analysis of change to effective job density – a measure of the connectively and accessibility between jobs and services – before and after the construction of EastLink is illustrated in Figure 2 and Figure 3. This analysis shows how Maroondah has become more strongly integrated with Melbourne’s pool of jobs and services since EastLink was completed in 2008. Research shows that this improved economic integration or ‘agglomeration’ directly boosts the productivity of firms and individual workers. It is likely that future infrastructure projects will continue to bring about similar changes that better integrate Maroondah with the broader metropolis. Potential future road and public transport projects that might have such an impact include the proposed East West Link, a potential future link between the Metropolitan Ring Road and Eastlink and future public transport enhancements.
FIGUR E 2. E FFECT IVE JOB DE NSIT Y BE FOR E THE CO MPLE T ION O F E ASTL I NK
Source: SGS Economics and Planning, 2013
FIGUR E 3. E FFECT IVE JOB DE NSIT Y AFTER THE CO MPLE T ION O F E ASTL I NK
Source: SGS Economics and Planning, 2013
E FFE CTIVE JOB D ENS IT Y BE FORE AND A FTER
THE COMPLE TION OF EASTL INK
Source: Source: SGS Economics and Planning, 2013.

5
Sustainable transport
Maroondah is considered a middle-outer ring municipality within metropolitan Melbourne. Such areas are typically not as well served by public transport as the inner and inner-middle ring areas. Maroondah does, however, have two heavy rail lines, with stations at Ringwood, East Ringwood, Croydon and Heathmont. Outside of these locations public transport services are supported by buses. Maroondah residents enjoy good access to adjoining areas of Melbourne by car. Fixed public transport access, however, is limited to locations to the east and west serviced by rail. Service frequencies, travel times and limited integration between rail and bus services also limit the effectiveness of public transport for Maroondah’s residents. Walking and cycling are also important modes of sustainable transport. Maroondah has an existing network of cycling routes, although there are presently ‘gaps’ in this network that impact on its usefulness. Walking is an option for those that live or work within walking distance of services and facilities, including public transport. However, large distances can make walking journeys impractical in many locations, particularly those lower density suburbs, far from activity centres.
FIGUR E 4. PUBL IC TRANSPORT ACC ESS L EVEL S ( PTAL ) FOR MAROO NDAH
Source: SGS Economics and Planning, 2013
PUBLIC TRANSPORT A CCESS LE VELS (PTAL)
PTAL is an index of public transport accessibility that draws on information about public transport routes, services frequency and capacity for rail, tram and smart bus services. Areas with high frequency and/or multiple services or modes of public transport rate more highly than those with less frequent and/or only one public transport mode. Source: SGS Economics and Planning, 2013.

6
‘Living Locally: The 20 minute city’
The State Government’s Metropolitan Strategy Discussion Paper Melbourne, Let’s Talk About the Future (October 2012) advocates
the idea of ‘living locally’ and suggests a range of services and facilities should ideally be accessible within a 20 minutes journey, using a range of transport modes including walking, cycling, public transport and private vehicles. The ‘living locally’ concept is indicative of a general trend in urban management that seeks to minimise the time spent in transit, encourage more sustainable transport behaviours, and place renewed emphasis on local communities with the broader metropolis. Maroondah already enjoys access to a relatively wide catchment for services and facilities by car. From Ringwood East – roughly the geographic centre of the local government area – a large proportion of Melbourne’s east and southeast can be accessed within 20 minutes. A 20 minute public transport journey from the same location, however, allows access to a much smaller area. As a result, Maroondah residents are likely to be more reliant on private vehicles to access services and facilities within 20 minutes; with sustainable transport modes only possible for residents within activity centres. However, this is not to say that concentrating new development and facilitates around existing centres and transport infrastructure should not be a consideration in planning for future growth and change.
FIGUR E 5. R INGWOOD E AST CATCH ME NT S, MOR NING PEAK, C AR
Source: SGS Economics and Planning, 2013
FIGUR E 6. R INGWOOD E AST CATCH ME NT, MORNING PE AK, P UBL IC TR ANSPORT
Source: SGS Economics and Planning, 2013
R INGW OOD EAST CATCHMENTS IN TH E MORN IN G PEAK PER IOD BY CA R AND PUBLIC TRANSPORT
This analysis is based on travel time matrices that model the distances that can be travelled within a 10, 20 or 30 minute time frame. The analysis of public transport catchments takes into consideration average walk time and waiting time and, hence, has a lower coverage than might otherwise be this case if these factors were ignored. Source: SGS Economics and Planning, 2013.
7
Implications for Maroondah in the future
Maroondah as a place, both its local characteristics and location within the Melbourne metropolitan area, have significant implications for the likely trajectory of future development and change. Although it is difficult to accurately predict how these trends might play out, the following implications should be taken into consideration when thinking about the future of Maroondah:
Maroondah, and Ringwood and Bayswater North in particular, are likely to play an increasingly important role as locations of employment and services in Melbourne’s Eastern Region.
Future improvements in connectivity between Maroondah and the metropolitan region are likely to bring about growth and change in Maroondah for both employment and housing.
There is good rail access to the major centres in the municipality, providing good sustainable transport options in selected locations on the Belgrave and Lilydale lines.
In the context of general metropolitan growth, vehicle trips to and from the city, at peak times at least, are likely to become longer as congestion increases.
With the exception of Ringwood, and to a lesser extent Croydon, the concept of the ‘20 minute city’ in Maroondah generally requires residents to drive to access services and facilities. Without investment in sustainable transport, such as rail upgrades, better bus service frequency and bicycle network improvements, it is likely that the majority of trips will continue to be made by car.
Shifts towards sustainable transport modes are most likely to be buses, walking and cycling. Aspirations to increase walking and cycling require a range of interventions including infrastructure, safety improvements, education and changing community attitudes... (see text box ‘walking and cycling’).
Urban densification can generate opportunities for centres to grow, improving prospects for more walkable communities and viable public transport.
WALK ING AND CYCL IN G
A number of national and state policy documents emphasise the importance of cycling and walking in an urban environment. For example, The Australian Bicycle Council’s National Cycling Strategy
was published in 2010 with a vision to “double the number of people cycling in Australia over the next five years”. The strategy suggests this can only occur with the commitment from all levels of government and non-government organisations and sets out six priorities and objectives: cycling promotion, infrastructure and facilities, integrated planning, safety, monitoring and evaluation, and guidance and best practice. The Victorian Government’s Pedestrian Access Strategy (2010) aims to encourage more Victorians
to walk, especially for short trips. It outlines five principles:
Encourage people to walk by changing attitudes and behaviour.
Collaborate to improve provision for walking.
Create pedestrian-friendly built environments, streets and public spaces.
Increase the safety of walking.
Continue integrating walking with public transport. The strategy notes that Melbourne’s inner suburbs have more ‘walk only’ trips than the outer suburbs. The main factor being differences in ‘community design’ - in lower density outer suburbs distances between destinations are greater making walking a less viable option. The Victorian Government’s cycling strategy Cycling into the Future 2013-23 identifies six directions to build an understanding of cycling and the types of trips made by bike as well as to help increase these trips in the future and encourage more people to cycle:
Build evidence
Enhance governance and streamline processes
Reduce safety risks Encourage cycling
Grow the cycling economy
Plan networks and prioritise investment
8
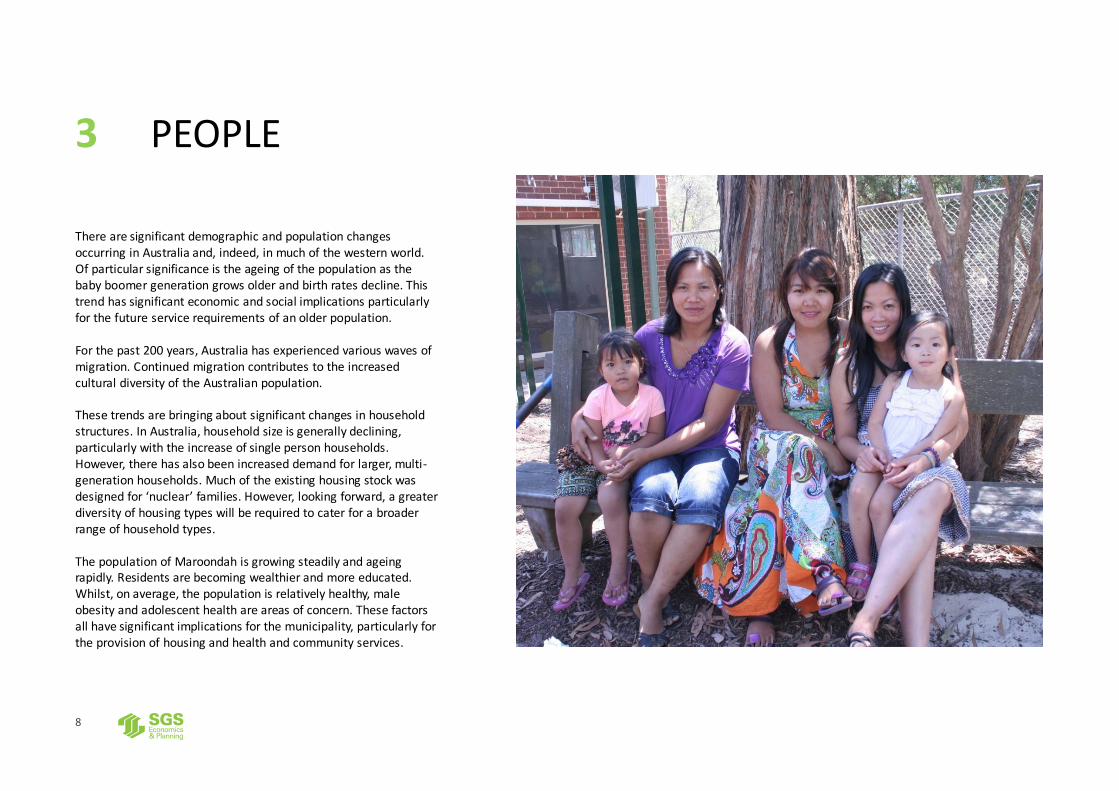
3 PEOPLE
There are significant demographic and population changes occurring in Australia and, indeed, in much of the western world. Of particular significance is the ageing of the population as the baby boomer generation grows older and birth rates decline. This trend has significant economic and social implications particularly for the future service requirements of an older population. For the past 200 years, Australia has experienced various waves of migration. Continued migration contributes to the increased cultural diversity of the Australian population. These trends are bringing about significant changes in household structures. In Australia, household size is generally declining, particularly with the increase of single person households. However, there has also been increased demand for larger, multi-generation households. Much of the existing housing stock was designed for ‘nuclear’ families. However, looking forward, a greater diversity of housing types will be required to cater for a broader range of household types. The population of Maroondah is growing steadily and ageing rapidly. Residents are becoming wealthier and more educated. Whilst, on average, the population is relatively healthy, male obesity and adolescent health are areas of concern. These factors all have significant implications for the municipality, particularly for the provision of housing and health and community services.
9
Population and housing
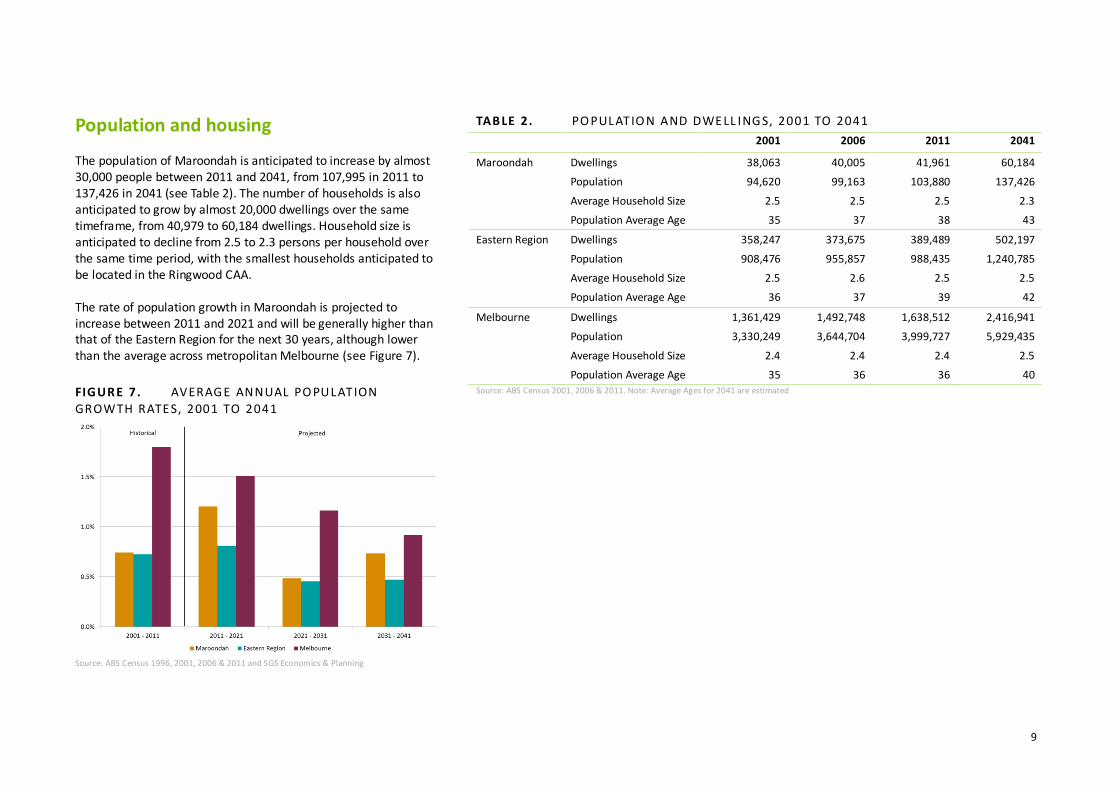
The population of Maroondah is anticipated to increase by almost 30,000 people between 2011 and 2041, from 107,995 in 2011 to 137,426 in 2041 (see Table 2). The number of households is also anticipated to grow by almost 20,000 dwellings over the same timeframe, from 40,979 to 60,184 dwellings. Household size is anticipated to decline from 2.5 to 2.3 persons per household over the same time period, with the smallest households anticipated to be located in the Ringwood CAA. The rate of population growth in Maroondah is projected to increase between 2011 and 2021 and will be generally higher than that of the Eastern Region for the next 30 years, although lower than the average across metropolitan Melbourne (see Figure 7).
FIGUR E 7. AVERAG E ANNUAL PO PULAT ION
GROWTH RATE S, 2001 TO 2041
Source: ABS Census 1996, 2001, 2006 & 2011 and SGS Economics & Planning
TAB LE 2. PO PUL AT IO N AND DWE LL ING S, 2001 TO 2041
2001 2006 2011 2041
Maroondah Dwellings 38,063 40,005 41,961 60,184
Population 94,620 99,163 103,880 137,426
Average Household Size 2.5 2.5 2.5 2.3
Population Average Age 35 37 38 43
Eastern Region Dwellings 358,247 373,675 389,489 502,197
Population 908,476 955,857 988,435 1,240,785
Average Household Size 2.5 2.6 2.5 2.5
Population Average Age 36 37 39 42
Melbourne Dwellings 1,361,429 1,492,748 1,638,512 2,416,941
Population 3,330,249 3,644,704 3,999,727 5,929,435
Average Household Size 2.4 2.4 2.4 2.5
Population Average Age 35 36 36 40 Source: ABS Census 2001, 2006 & 2011. Note: Average Ages for 2041 are estimated

10
Household type
In 2011, Maroondah had a higher proportion of one parent family and lone person households than the Eastern Region and metropolitan Melbourne (see Table 3). However, Maroondah also had a higher proportion of separate houses compared with the metropolitan average. Table 4 shows that between 2006 and 2011, development of Semi-Detached & Flat/Unit/Apartment was occurring at a faster rate than for Separate Houses. This increase may reflect changing demand due to demographic changes, particularly the ageing of the population, the relative proximity of parts of Maroondah to the CBD by public transport and changing housing preferences.
TAB LE 3. HO USEHOLD STRUCT URE , 2006 TO 2011
Co
up
le F
amily
w
ith
ou
t C
hild
ren
Co
up
le F
amily
wit
h
Ch
ildre
n
On
e Pa
ren
t Fa
mily
Oth
er F
amily
Lon
e Pe
rso
n
Ho
use
ho
ld
Gro
up
Ho
use
ho
ld
Oth
er H
ou
seh
old
Tota
l Ho
use
ho
lds
Maroondah 2011 9,508 13,319 4,547 435 9,492 1,083 852 39,236
2011 Share 24.2% 33.9% 11.6% 1.1% 24.2% 2.8% 2.2% 100.0%
2006-2011
Growth Rate 1.1% 1.0% 1.3% 2.0% 1.0% 0.4% -5.8% 0.9%
Eastern Region
2011 89,266 132,423 36,301 4,775 75,813 13,245 10,420 362,243
2011 Share 24.6% 36.6% 10.0% 1.3% 20.9% 3.7% 2.9% 100.0%
2006-2011 Growth Rate
1.0% 0.5% 1.0% 0.5% 0.8% 1.6% -2.1% 0.7%
Metro. Melbourne
2011 351,307 501,709 155,809 21,583 333,282 66,975 63,998 1,494,663
2011 Share 23.5% 33.6% 10.4% 1.4% 22.3% 4.5% 4.3% 100.0%
2006-2011 Growth Rate
2.3% 1.8% 1.8% 1.9% 1.6% 3.1% -1.5% 1.8%
Source: ABS Census 2006 & 2011
AUSTRALIAN B UREAU OF STATIST ICS (ABS)
DW ELL ING TYPE DE FIN I T IONS
The following definitions are used by the ABS to classify dwellings that are not detached houses: Semi-detached
These dwellings have their own private grounds and no other dwelling above or below them. They are either attached in some structural way to one or more dwellings or are separated from neighbouring dwellings by less than half a metre. Flat/Unit/Apartment
This definition includes all dwellings in blocks of flats, units or apartments. These dwellings do not have their own private grounds and usually share a common entrance foyer or stairwell. This category also includes flats attached to houses such as granny flats, and houses converted into two or more flats.

11
Type and mix of dwellings
Research by the Grattan Institute (2011) suggests that in locations like Maroondah there are significant shortfalls in the supply of semi-detached dwellings and apartments of four of more storeys. This research was based on an assessment of the ‘mismatch’ between the existing dwelling stock and people’s stated dwelling preferences. These preferences were derived from consideration of the need to make trade-offs between locations, dwelling type and dwelling price, rather than just ‘unconstrained’ dwelling preferences. These combinations of factors make it likely that demand for Semi-Detached & Flat/Unit/Apartment housing will continue to grow in Maroondah. Council has identified the Ringwood Central Activities Area as the preferred location for higher density development.
TAB LE 4. DWE LL ING S BY H OUSEHO LD STR UCTUR E, 2006- 2011
Separate House
Semi-Detached &
Flat/Unit/Apartment
Other Total
Maroondah 2006 30,933 8,921 86 39,940
2011 32,044 9,705 83 41,832
Growth Rate 0.7% 1.7% -0.7% 0.9%
Eastern Region 2006 245,421 63,703 1,303 310,427
2011 252,916 69,328 1,129 323,373
Growth Rate 0.6% 1.7% -2.8% 0.8%
Melbourne 2006 1,049,207 413,520 8,414 1,471,141
2011 1,142,584 462,072 8,232 1,612,888
Growth Rate 1.7% 2.2% -0.4% 1.9%
Source: ABS Census 2006 & 2011

12
Population age profile
The Maroondah resident population has become relatively older between 2001 and 2011 and is ageing at a faster rate than that of the Eastern Region and metropolitan Melbourne (see Figure 8 and Figure 9). Figure 8 shows that between 2001 and 2011 Maroondah’s population growth largely occurred in populations over 45 years. Population projections to 2041 anticipate that there will be some growth in all age groups but, again, most significantly for people aged over 45 years. In particular there will be strong growth in the 65-84 age category, especially relative to current population.
FIGUR E 8. MAROO NDAH AG E PRO FIL E 2001 T0 2041
Source: ABS Census 2001 & 2011 and SGS Economics & Planning
FIGUR E 9. ME LBO UR NE AGE PRO FILE 2001 T 0 2041
Source: ABS Census 2001 & 2011 and SGS Economics & Planning
POP ULATION AGE PROFILES The population profiles – often referred to as population pyramids – show the relative size of different age groups within a
population. The profiles for both Maroondah and Melbourne as a whole demonstrate how the relative size of older age groups within the population have increased between 2001 and 2011 (the darker areas), and will increase to 2041 (the enclosed white areas).
Source: ABS Census 2006 & 2011

13
Income
Maroondah is becoming wealthier; however, the distribution of wealth is not evenly spread. Table 5 shows that Croydon, Ringwood, Ringwood East, Kilsyth, Bayswater North and Ringwood have all seen significant declines in the percentage of the population earning $1-399 and increases in the percentage of the population earning over $1,300 a week. These changing patterns of wealth may indicate a trend toward gentrification of some areas. While this can have significant benefits, it also has the potential to exclude people on lower incomes from an area. Increased wealth and gentrification can also influence service expectations.
TAB LE 5. INCO ME CATE GORY ( PER WE E K) , 2006- 2011 CHANG E BY SUB UR B 1
$1-$399 $400-$799 $800-$1,299 $1,300-$1,999
$2,000 or more
Warranwood -1% -1% 1% 3% -2%
Croydon Hills -1% 1% -1% 2% -1%
Croydon North -5% -1% 4% 4% -3%
Croydon (Vic.) -12% -5% 1% 10% 5%
Ringwood East -11% -6% 0% 10% 7%
Kilsyth -13% -8% -3% 12% 12%
Bayswater North -14% -11% 0% 12% 13%
Croydon South -3% -7% -1% 7% 3%
Kilsyth South -2% -1% -4% 5% 2%
Heathmont -5% -4% -2% 8% 4%
Ringwood -11% -8% 1% 10% 7%
Ringwood North -5% 1% -1% 4% 1% Source: ABS Census 2006 & 2011
1 This analysis does not account for inflation and rising incomes over time.
14
Education
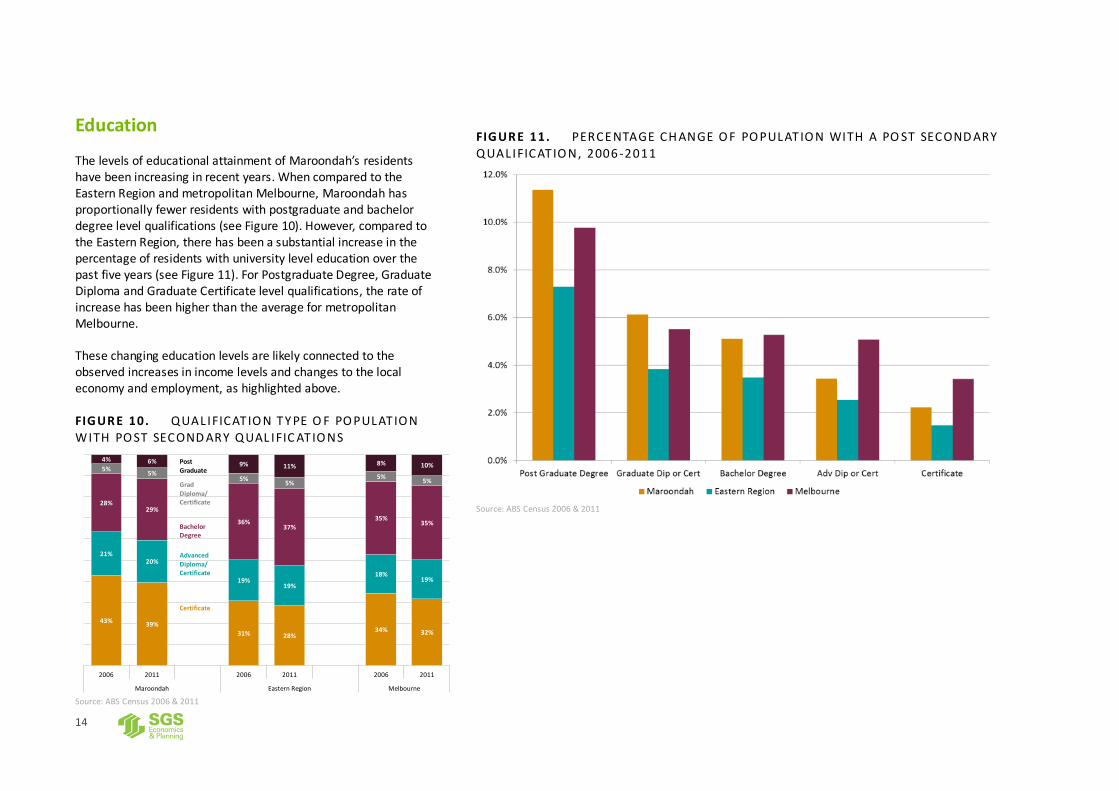
The levels of educational attainment of Maroondah’s residents have been increasing in recent years. When compared to the Eastern Region and metropolitan Melbourne, Maroondah has proportionally fewer residents with postgraduate and bachelor degree level qualifications (see Figure 10). However, compared to the Eastern Region, there has been a substantial increase in the percentage of residents with university level education over the past five years (see Figure 11). For Postgraduate Degree, Graduate Diploma and Graduate Certificate level qualifications, the rate of increase has been higher than the average for metropolitan Melbourne. These changing education levels are likely connected to the observed increases in income levels and changes to the local economy and employment, as highlighted above. FIGUR E 10. QUAL IFICAT IO N T Y PE O F PO PUL AT IO N
WITH PO ST SECOND ARY QUAL IFIC AT IO NS
Source: ABS Census 2006 & 2011
FIGUR E 11. PERCE NTAGE CH ANGE O F PO PUL AT IO N WITH A PO ST SECOND ARY
QUAL IFICAT IO N, 2006 -2011
Source: ABS Census 2006 & 2011
43%39%
31% 28%34% 32%
21%20%
19%19%
18%19%
28%29%
36%37%
35%35%
5%5%
5%5%
5%5%
4% 6% 9% 11% 8% 10%
2006 2011 2006 2011 2006 2011
Maroondah Eastern Region Melbourne
Post
Graduate
Grad
Diploma/Certificate
Bachelor Degree
Advanced
Diploma/Certificate
Certificate

15
Cultural diversity
Maroondah is a Refugee Welcome Zone and has therefore made a commitment to:
Welcome refugees into the community
Uphold the human rights of refugees
Demonstrate compassion, and
Enhance cultural and religious diversity in the community. Maroondah has seen a significant influx of refugees from Burma. Of the 333 Burmese who migrated to the Eastern Region in 2011-12, 249 have settled in Maroondah, 243 on humanitarian visas and six on family visas. Maroondah is now home to the largest Burmese community in Melbourne’s East. It is likely the Burmese population will continue to grow in Maroondah due to continued migration and, increasingly, through family sponsorship. However, compared with the rest of the Eastern Region and metropolitan Melbourne, Maroondah’s population is relatively less culturally diverse. From 2001 to 2011, the proportion of residents in Maroondah born overseas increased slightly from 18 per cent to 19 per cent (see Table 6). This is significantly lower than the averages for the Eastern Region and metropolitan Melbourne and the share appears to be growing at a slower rate. TAB LE 6. PERCE NTAGE O F RE SIDE NT PO PUL AT IO N
BOR N OVER SE AS
Percent born overseas
Maroondah Eastern Melbourne Melbourne
2001 18% 25% 27% 2006 17% 26% 27% 2011 19% 29% 29%
TOP 10 LANGUAGE OTH ER THAN EN GLIS H SPOKEN AT H OME BY
MAROON DAH RES ID ENTS
1. Chinese 2. Italian 3. Greek 4. German 5. Punjabi 6. Vietnamese 7. Spanish 8. Hindi 9. Arabic (inc. Lebanese) 10. Dutch
Source: ABS Census 2011
TOP 10 COUNTR IES OF B IR TH , OTHE R THAN AUSTRALIA , FOR
MAROON DAH RES ID ENTS
1. United Kingdom 2. China 3. India 4. New Zealand 5. South Africa 6. Germany 7. Netherlands 8. Malaysia 9. Italy 10. Sri Lanka
Source: ABS Census 2011

16
Almost 45 per cent of those born overseas and living in Maroondah were from North-West Europe. However the population of North-East Asian and South-East Asian residents is growing at a significantly faster rate in Maroondah than the metropolitan average (see Figure 13).
FIGUR E 12. COUNTRY O F BIRTH OTH ER TH AN AUSTR AL IA , 2011
Source: ABS Census 2001, 2006 & 2011
FIGUR E 13. CH ANGE IN CO UNTRY O F B IRTH OTH ER TH AN AUSTRAL IA,
2001- 2011
Source: ABS Census 2001, 2006 & 2011

17
From 2001 to 2011 an increasing percentage of households spoke a language other than English at home with the proportion of households that only spoke English falling from 91% to 87%. In 2011, the top three languages spoken at home were Chinese (15 per cent of households), Italian (five per cent) and Greek (three per cent). FIGUR E 14. L ANG UAGE SPO KE N AT H O ME OTHER TH AN E NG LI SH , 2011
Source: ABS Census 2011
Despite having significantly lower percentages of the population born overseas, Figure 14 shows Maroondah has a high percentage of its population who speak Eastern Asian and Northern European languages at home compared with the metropolitan average. Figure 15 shows that the percentage of people speaking Eastern Asian languages has also increased between 2001 and 2011 at a faster rate than the metropolitan average.
FIGUR E 15. CHANG E IN L ANG UAGE SPO KE N AT H O ME , 2001 TO 2011
Source: ABS Census 2001, 2006 & 2011

18
Health and wellbeing
The general health and wellbeing of Maroondah’s population appears to be relatively good. The percentage of people in Maroondah reporting their health status as ‘fair’ or ‘poor’ is 15.5 per cent, which is below the Victorian average of 18.3 per cent. On a range of physical health measures the Maroondah population has similar levels of incidence to the Victorian average (see Table 7). However, there are some indicators, particularly for Maroondah’s male and youth populations, that are worse than the state average and may have significant impacts on community and health service provision. The percentage of males in Maroondah who are overweight or obese is significantly above the Victorian average (see Table 8). A review of selected mental health indicators also shows Maroondah residents have similar levels of incidence as the Victorian average (see Table 9). However, a higher rate of residents sought professional help for a mental health problem in the last 12 months. This could be due to a range of factors including higher incidences of mental health problems and/or better access to mental health services.
TAB LE 7. SE LECT ED PHY SICAL HE ALTH IND ICATOR S, PER 100 O F PO PUL AT IO N,
2007- 08
Maroondah Victoria
High cholesterol 5.4 5.4 Circulatory system diseases 16.3 17.3 Hypertensive disease 11.2 10.3 Repertory system diseases 26.6 27.3 Asthma 9.5 9.1 Type 2 diabetes 5.0 4.8 Arthritis 14.4 14.6 Source: Public Health Information Development Unit
TAB LE 8. PO PUL AT IO N O VERWE IGH T OR OBE SE
Maroondah Ranking among LGAs
Victoria
Females 36.6% 65 40.3% Males 63.6% 20 57.2% All persons 48.0% 56 48.6% Source: Department of Health Measures of Healthy Activity and Outcome, 2010
TAB LE 9. SE LECT ED ME NTAL HE ALTH IND ICATOR S, P ER 100 O F PO PULATION , 2007- 08
Maroondah Victoria
Males with mental and behavioural problems 9.4 9.9 Females with mental and behavioural problems 11.5 11.6 Males with mood (affective) disorder 5.5 6.0 Females with mood (affective) disorder 7.8 8.3 Sought professional help for mental health problem in last 12 months
13.9 11.4
Source: Public Health Information Development Unit

19
There is a very different story for males and females when reviewing nutrition and physical activity indicators. Females in Maroondah are more likely to meet nutrition guidelines but less likely to meet physical activity guidelines than the state average. The reverse is true for males. A higher percentage of Maroondah residents visit green space at least once per week compared with the state average, possibly due to the range of open spaces and Council recreation facilities in the municipality.
TAB LE 10. SE LECT ED NUTR IT IO N, PHY SIC AL AND RECREAT IO N IND IC ATOR S
Maroondah Victoria Persons who do not meet fruit and vegetable dietary guidelines 45.3% 48.2% Females who do not meet fruit and vegetable dietary guidelines 36.7% 41.9% Males who do not meet fruit and vegetable dietary guidelines 55.7% 54.8% Sedentary behaviour (sitting ≥ 7 hours per day) 33.8% 32.6% Visit to green space (≥ once per week) 55.8% 50.7% Participation in organised sport 43.0% 42.7% Persons who do not meet physical activity guidelines 26.7% 27.4% Females who do not meet physical activity guidelines 31.1% 27.2% Males who do not meet physical activity guidelines 20.6% 27.5% Source: Public Health Information Development Unit; Department of Health Measures of Healthy Activity and Outcome, 2010; VicHealth
Indicators Survey, 2012; DPCD Measures of Community Strength and Connection, 2008

20
Adolescent health
A selection of adolescent health indicators show a significantly higher percentage of Maroondah adolescents drink, smoke and use marijuana and other illegal drugs than the state average. Interestingly, fewer adolescents reported they were unsatisfied with the quality of life than the state average.
TAB LE 11. SE LECT ED AD OLE SCE NT HE ALTH IND ICATOR S
Maroondah Victoria
15-17 year olds who drank alcohol in the past 30 days 58.3% 24.7% 15-17 year olds who smoked in the past 30 days 25.5% 12.9% 15-17 year olds who ever used marijuana 26.3% 10.9% 15-17 year olds who ever sniffed glue or chromed 4.9% 7.8% 15-17 year olds who ever used other illegal drugs 7.9% 3.0% Adolescents who are not satisfied with the quality of life, 2009 15.3% 22.9% Adolescents with highest level of psychological distress, 2009 13.1% 13.0% Adolescents with eating disorders, 2009 4.2% 2.5% Source: Department of Education and Early Childhood Development Adolescent Profiles, 2012

21
Family violence
Table 12 shows Maroondah has the second highest rate of family violence incidents of all municipalities in the Eastern Region, recording a rate significantly above those of the Eastern Region and metropolitan Melbourne. TAB LE 12. FAMILY V IO LE NCE INCID ENT S RE PORTED
TO POL ICE 2009- 10, PER 1,000 O F PO P UL AT IO N
LGA Rate
Maroondah 5.3 Boroondara 2.6 Knox 5.8 Manningham 3.3 Monash 3.6 Whitehorse 3.2 Yarra Ranges 4.5 Eastern Region average 4.2 Metropolitan Melbourne 4.0 Source: Maroondah Social Profile, 2011
Gambling
As of June 30 2012, there were 770 electronic gaming machines (EGMs) in the City of Maroondah, or 9.06 EGMs per 1,000 adults. This is significantly higher than the state average. Expenditure per adult in Maroondah is also significantly higher than the state average.
TAB LE 13. E LECTRONIC G AMING MACH INE S MAROO NDAH, 20 12
EGMs per 1,000
adults Expenditure per
EGM Expenditure per
adult
Maroondah 9.06 $86,731.04 $786 Victoria 6.00 $100,327.51 $602 Source: VCGLR, 2013

22
Implications for Maroondah in the future
Population growth in Maroondah is expected to occur at a faster rate than the rest of the Eastern Region. Ageing of the population in Maroondah is also more rapid than for the Eastern Region as a whole. This, combined with smaller average household sizes, will generate demand for a greater diversity of housing stock than currently exists in the municipality. The proportion of townhouses, flats and units will need to increase.
The lack of a ‘growth front’ means this housing will need to largely occur as infill redevelopment of existing urban land. Identifying appropriate locations to accommodate these dwelling types over the next 30 years is an important consideration.
Increasing wealth and educational attainment are generally consistent with the shift towards a more knowledge based economy and are likely to continue whist Maroondah enjoys good access to key employment nodes. In this context, pockets of relative disadvantage may emerge in locations that are not as accessible and/or there are higher proportions of residents on low-incomes and/or higher proportions of elderly residents.
Whilst the community of Maroondah is relatively healthy, there are particularly concerning indicators for the male and adolescent population. This, in conjunction with the significantly old and ageing population, may have significant impacts on the requirement for health services. Local government may have an increased role to play in health promotion.
Following the ‘peak’ in the ageing of the population, younger households are likely to be attracted to the area, generating demand for services and schools.

23
4 ECONOMY
Economic activity is a fundamental driver of growth and change in cities and local areas. Changes in the type and distribution of economic activities influence patterns of movement and land use as well as jobs and services that are available locally. This chapter examines the composition of Maroondah’s economy in order to better understand key economic shifts and their implications. The economy is intrinsically linked to social and environmental issues. For example, changes within the local population – its size, composition and income levels – will impact on local service provision and local employment. Policy measures designed to protect the environment, such as taxes and charges on energy, carbon production and pollution, will impact some industries and economic activities more than others. The Ringwood Central Activities Area is a significant economic asset for Maroondah. Designated as the highest order activity centre in previous metropolitan planning strategies, Ringwood is the most likely location to attract significant new employment to Maroondah, in the form of office-based, health and retail employment. Maroondah’s other activity centres, industrial areas and bulky goods retail precincts are also significant in terms of hosting employment and economic activity, providing both employment and services for Maroondah residents and the population of Melbourne’s Eastern Region.

24
Maroondah’s economy: jobs
The number of jobs in Maroondah is projected to grow from approximately 50,000 jobs in 2011 to around 64,000 in 2041.2 At the same time as this growth is occurring, the composition of the workforce is projected to change significantly. Figure 16 shows the projected changes for the largest industry sectors within Maroondah by numbers employed. Significant growth is projected in the heath sector, in retail and in ‘knowledge intensive’ jobs. Construction and education jobs will increase more modestly – more closely aligned with population growth. By contrast, manufacturing is projected to decline significantly from some 9,000 jobs in 2011 to closer to 3,000 in 2041. These trends in Maroondah’s employment profile are consistent with broader trends in Melbourne’s economy. Melbourne is experiencing growth in the knowledge based economy; in the education sector; and in employment driven by population growth, such as retailing and health.
2 Source:: SGS Economics and Planning, 2013
FIGUR E 16. MAJOR CH ANGE S IN MAROO NDAH ’S E MPLOY ME NT 2001 - 2041
Source: ABS Census 2001 & 2011 and SGS Economics & Planning
41,000 49,700 56,800 61,000 63,9000
15,000
30,000
45,000
60,000
75,000
90,000
0
2,500
5,000
7,500
10,000
12,500
15,000
2001 2011 2021 2031 2041In
du
stry
Em
plo
yme
nt
Historical Projected
Manufacturing
Retail, Accom. & Food Services
Health Care
KnowledgeServices
Construction
Education & Training
Total jobsIN DUS TRY CLASSIFICAT ION For clarity certain standard industry categories have been grouped together from the Australian and New Zealand Standard Industrial Classifications (ANZSIC). For example, ‘Knowledge Services’ includes jobs within the Information Media and Telecommunications, Financial and Insurance Services, and Professional, Scientific and Technical Services industry categories. ‘Retail Trade’ includes both Accommodation and Food Services and the Retail Trade categories. Source: SGS Economics and Planning, 2013.
25
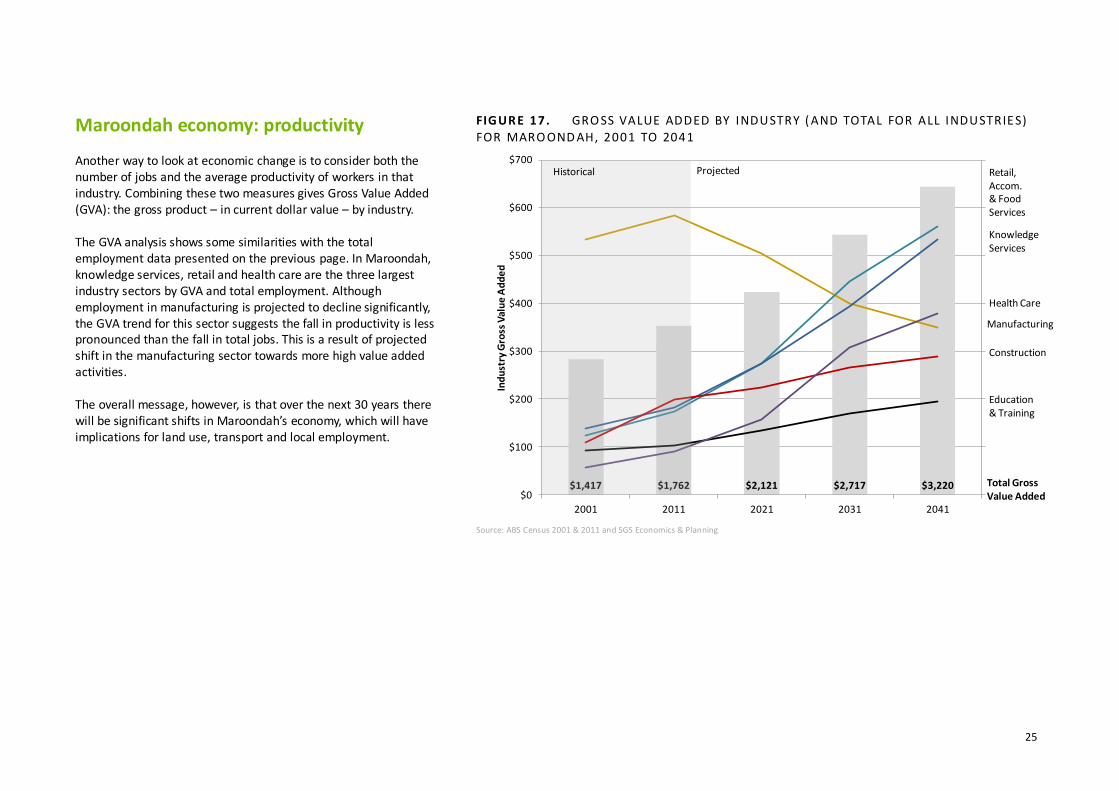
Maroondah economy: productivity
Another way to look at economic change is to consider both the number of jobs and the average productivity of workers in that industry. Combining these two measures gives Gross Value Added (GVA): the gross product – in current dollar value – by industry. The GVA analysis shows some similarities with the total employment data presented on the previous page. In Maroondah, knowledge services, retail and health care are the three largest industry sectors by GVA and total employment. Although employment in manufacturing is projected to decline significantly, the GVA trend for this sector suggests the fall in productivity is less pronounced than the fall in total jobs. This is a result of projected shift in the manufacturing sector towards more high value added activities. The overall message, however, is that over the next 30 years there will be significant shifts in Maroondah’s economy, which will have implications for land use, transport and local employment.
FIGUR E 17. GRO SS VALUE ADDED BY INDUSTRY ( AND TOTAL FOR ALL INDUSTRIE S)
FOR MARO OND AH, 2001 TO 2041
Source: ABS Census 2001 & 2011 and SGS Economics & Planning
$1,417 $1,762 $2,121 $2,717 $3,2200
500
1000
1500
2000
2500
3000
3500
$0
$100
$200
$300
$400
$500
$600
$700
2001 2011 2021 2031 2041In
du
stry
Gro
ss V
alu
e A
dd
ed
Historical Projected
Manufacturing
Retail, Accom. & Food Services
Health Care
KnowledgeServices
Construction
Total GrossValue Added
Education & Training

26
Maroondah’s workforce
Analysis of ABS ‘journey to work’ data provides insights into the movements of the working population of Maroondah and of workers that come to Maroondah from other locations. In 2011, Maroondah had a working resident population of 59,300 and a workforce of 49,700 workers. Over one third (13,000 or 36 per cent) of the people that worked in Maroondah also lived in Maroondah. A large proportion of workers travelled from the neighbouring LGA’s of Yarra Ranges (7,500 or 21 per cent) and Knox (12 per cent). However, between 2006 and 2011, the number of workers who resided in Maroondah and the adjoining LGAs fell slightly (see Figure 18). This is consistent with a changing employment landscape and transport improvements, both of which are likely to draw more workers to Maroondah from other parts of the city. FIGUR E 18. OR IG IN ON MAROO NDAH ’ S WOR KFORCE,
2006 AND 2011
Source: ABS Census 2006 & 2011
FIGUR E 19. OR IG IN O F MAR OOND AH’S WOR KFORC E, 2011
Source: ABS Census 2011
0
2,500
5,000
7,500
10,000
12,500
15,0002006 2011

27
Maroondah’s working population
Whilst a significant portion of Maroondah’s working resident population works within the LGA, a large proportion (71 per cent) travels to other LGAs. In 2011, almost 6,000 Maroondah workers (13 per cent) travelled to work in the City of Melbourne. Whitehorse and Knox are each destinations for a further 5,000 Maroondah workers, while around 3,500 travel to the Yarra Ranges. Since 2006, the number of workers commuting to the city centre has increased, as has the number travelling to Yarra Ranges, Monash and other LGAs to the west and north (Boroondara and Manningham) and the south (Greater Dandenong). Again, these trends suggest Maroondah’s resident workforce is commuting further. The growth in employment in the city centre and the increasing professionalisation of Maroondah’s residents are the most likely contributory factors. FIGUR E 20. DE STINAT IO N O F MAROO NDAH ’S
WOR KING RE SID ENT PO P UL AT IO N, 2006 AND 20 11
Source: ABS Census 2006 & 2011
FIGUR E 21. DE STINAT IO N O F MAROO NDAH ’S WOR KING RE SID E NT PO PUL AT IO N, 2011
Source: ABS Census 2011
0
2,500
5,000
7,500
10,000
12,500
15,0002006 2011

28
Implications for Maroondah in the future
Maroondah’s economy is likely to change in the future as a result of transport improvements, population growth, the ageing of the population, and – perhaps most significantly – the ongoing shift in Melbourne towards a more knowledge-based economy. Drawing on the preceding analysis, the following implications should be taken into consideration when thinking about the future of Maroondah:
The total number of jobs in Maroondah is expected to increase substantially over the next 30 years. Within this time, the composition of employment within Maroondah will change significantly.
This will result in changes in both land use and transport patterns as jobs shift away from manufacturing, towards the professional, heath and retail sectors.
The decline in manufacturing will likely result in pressures to change the land uses in some areas currently given over to industrial activities.
Maroondah experiences a relatively high degree of employment self-containment and the Maroondah workforce generally works within the LGA or in adjoining LGAs. However, there is an increasingly large share that travels to the city and this is likely to have implications for travel patterns and public transport demand.
Improved transport links have the capacity to grow local and inter-regional activity areas, boosting local economic development and jobs.
State Government changes to zoning frameworks have the potential to facilitate the diffusion of diverse business and commercial activities to locations that formerly supported manufacturing.

29
5 ENVIRONMENT
The natural environment of the municipality is a defining feature and strategic advantage of Maroondah, relative to other parts of Melbourne. The municipality has diverse topography, flora and fauna, lakes and wetlands, parks and facilities. The built environment is also diverse, reflecting successive eras of development. The built environment continues to change and diversify with changing housing preferences, a changing economy and demographic shifts. Climate change is generating social, economic and environmental impacts and poses significant challenges for local government and communities; but it may also present significant opportunities.

30
Natural environment
A study of Maroondah’s sites of biological significance identified 82 such locations. Several sites were identified as being of state significance or high regional significance, including Hochkins Ridge Flora Reserve, Freeway Reservation Bayswater North, Cloverlea and Tereddan Drive Kilsyth South, De Felice Development Site North Bayswater and Dexters Bush Heathmont. The Maroondah Habitat Corridors Strategy identifies 17 main
vegetation corridors or corridor types through public and private land. The goal of the strategy is to plan for a network of habitat links connecting with larger areas of remnant vegetation in order to protect and enhance biodiversity within and beyond Maroondah. The municipality is home to a diverse array of flora and fauna with approximately 460 indigenous flora species including nine plants that are listed as Rare or Threatened under the Flora and Fauna Guarantee Act 1988, 117 indigenous bird species and 18
indigenous and six introduced mammals. Maroondah also has two major creeks, the Mullum Mullum Creek and Dandenong Creek, and many wetlands. Parts of the Yarra catchment and the Dandenong Creek catchment are located in Maroondah. The Yarra catchment is home to over one third of Victoria’s native plant and animal species. The rivers and creeks also have significant Aboriginal cultural value. The forested upper catchment tends to have excellent river and creek health. However, the condition of rural and urban rivers and creeks downstream deteriorates as a result of erosion, poor water quality, weeds, land use change and changes to river flows.
Approximately 45 per cent of the Dandenong Creek catchment is urbanised and there have been modifications to rivers and creeks for flood protection. The health of the rivers and creeks in the catchment closely matches land use.
FIGUR E 22. H AB ITAT CORRIDOR S IN MAR OOND AH
Source: Maroondah City Council, 2005.

31
Open space
Per capita, Maroondah has slightly more open space than other Eastern Region municipalities, except Manningham. Open space areas have long been recognised as a basic requirement in human settlement planning. These areas are an important resource for social interaction, rest and recuperation and for pursuing sports and other healthy activities. Open spaces support community life by providing recreational and leisure opportunities for residents, students, workers and visitors. These opportunities vary by place and usage varies according to abilities, lifestyle, cultural interests and available time. Much of the municipality has good access to open space. Figure 23 shows the access to open space greater than 5,000 square metres. The map shows significant gaps to the west of the Ringwood CAA, through the centre of the municipality and in the south-east corner of the LGA.
FIGUR E 23. ACCE SS TO O PE N SPACE GREATER TH AN 5,000SQ M
Source: SGS Economics and Planning, 2013
32
Built form
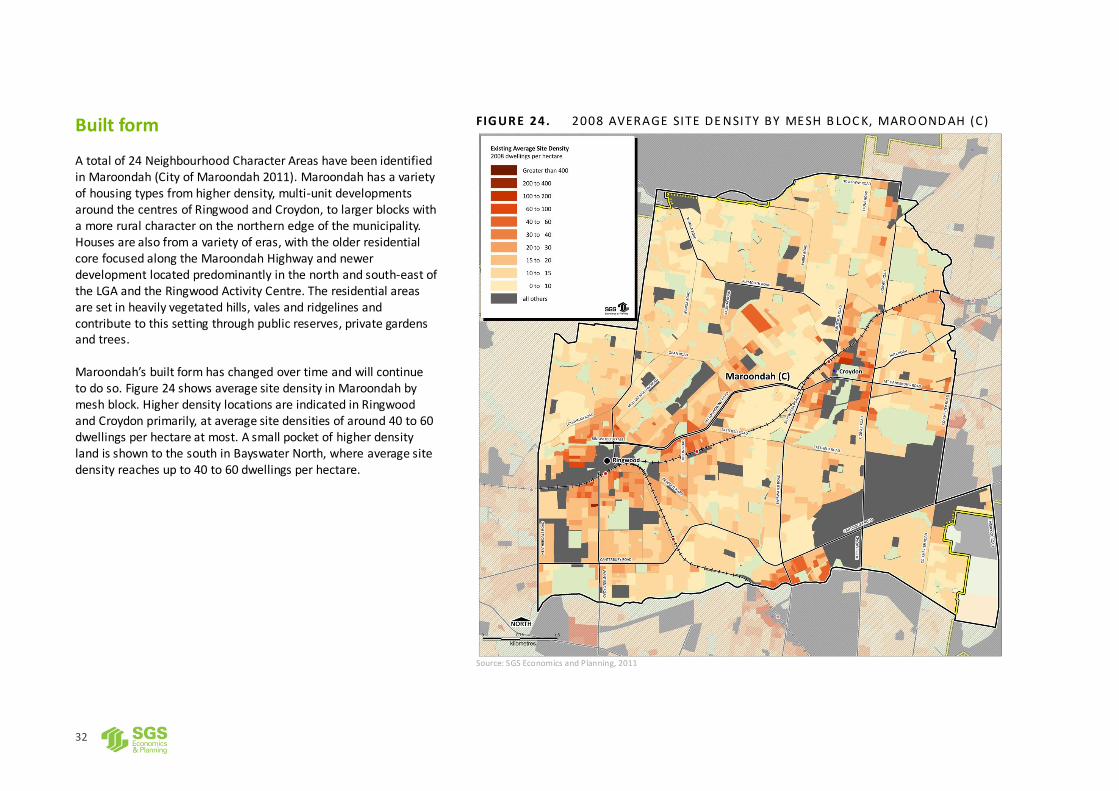
A total of 24 Neighbourhood Character Areas have been identified in Maroondah (City of Maroondah 2011). Maroondah has a variety of housing types from higher density, multi-unit developments around the centres of Ringwood and Croydon, to larger blocks with a more rural character on the northern edge of the municipality. Houses are also from a variety of eras, with the older residential core focused along the Maroondah Highway and newer development located predominantly in the north and south-east of the LGA and the Ringwood Activity Centre. The residential areas are set in heavily vegetated hills, vales and ridgelines and contribute to this setting through public reserves, private gardens and trees. Maroondah’s built form has changed over time and will continue to do so. Figure 24 shows average site density in Maroondah by mesh block. Higher density locations are indicated in Ringwood and Croydon primarily, at average site densities of around 40 to 60 dwellings per hectare at most. A small pocket of higher density land is shown to the south in Bayswater North, where average site density reaches up to 40 to 60 dwellings per hectare.
FIGUR E 24. 2008 AVERAGE SITE DE NSITY BY ME SH B LOC K, MARO OND AH (C)
Source: SGS Economics and Planning, 2011

33
Infrastructure
As described in the report Strong Foundations for Sustainable Local Infrastructure (Ernst & Young, 2012):
Local infrastructure is the backbone of our local communities. It provides access to welfare, education, transport, sport and recreation. It serves key environmental functions such as waste collection and disposal. Under-investment in this vital infrastructure has negative impacts on the economy, environment and social amenity.
In ensuring the continued provision of infrastructure, Australian governments are facing two key challenges:
how to meet increasing demand for new and upgraded infrastructure, and
how to pay for the needed infrastructure. It is argued that these challenges are most pronounced at the state and local level as these spheres of government have constant pressure to provide or facilitate the delivery of essential infrastructure services, yet have modest means to fund it (The Allen Consulting Group, 2004). Analysis by the Municipal Association of Victoria (2012) suggests that Victorian councils are responsible for ageing community infrastructure worth approximately $60 billion. Whilst councils have significantly increased capital works budgets, the annual shortfall in spending needed to maintain infrastructure was $280 million in 2007.

34
A changing climate
The Federal Government’s report Australia to 2050: Future Challenges (2010) argues the global challenge of climate change
represents the largest threat to Australia’s environment and one of the most significant challenges to Australia’s economic sustainability. A changing climate brings significant potential risks for Australian communities.
CL IMATE CHAN GE R ISKS TO GREATER M ETR OPOLITAN ME LB OURN E
1. Drought and reduced rainfall. The number of annual rainy days (>1mm) is predicted to decline by 6% by 2030 and 10-19% by 2070; the average long-term stream flow into Melbourne’s water supply catchments could be reduced by up to 11 per cent by 2020, and as much as 35 per cent by 2050. There will be up to 50% less runoff into Yarra, Maribyrnong, Werribee and Bunyip Rivers by 2070. Drought and rainfall has the potential to heavily impact where food is grown in Victoria, thereby affecting access to local produce. Lower rainfall is likely to lead to water shortages, exacerbated by higher temperatures and increased demand from a growing population.
2. Extreme temperature rise. A higher than average temperature is expected annually for
Melbourne, with an increase of 0.3-1.0°C by 2020 and 0.6-2.5 ° C by 2050. It is predicted that there will be an increase in annual number of days above 35°C from 9 days to 10-13 days by 2030, 15-26 days by 2070, and 16-33 days by 2100. Extreme temperature rise has the potential to have severe implications on the community’s health, particularly to vulnerable members including the elderly and those without access to cooling.
3. Intense rainfall. In contrast to the predicted reduced rainfall in some areas, other areas are
predicted to experience and increase in rainfall intensity of 0.9% by 2030 and 3.0-5.9% by 2070.
4. Sea level rise – A rise in sea level is predicted of up to 1.1 metres by the year 2100. For metropolitan Melbourne, this puts a population of nearly 950,000 at risk from coastal inundation by 2100. It is sea level rise risk that has the largest effect to infrastructure and homes located in coastal areas.
Source: N Wales, I Khanjanasthiti, S Savage, & G Earl, 2012

35
Risks to local government
Risk assessment for climate change vulnerability is still in its infancy at the local government level. Risk arises from physical impacts, urban design, settlement patterns and systemic reactions to change. O’Brien et al (2006) suggest there are three main categories of impact – on livelihoods, on settlements and on infrastructure. Livelihood risk will be discussed further in Community Risk.
Infrastructure risk encompasses the physical effects of climate change on local council assets and investments, as well as the increased costs of obtaining insurance cover for those assets. It includes the risks of sudden depreciation of assets due to withdrawal of insurance cover or other climate related market change. Infrastructure risks also include risks to the social, economic and ecological attributes of the local government area as well as residential and commercial buildings, natural assets and business continuity.
R ISK TO LOCAL GOVE RNMEN T FR OM CL IMATE CHAN GE
1. Water Infrastructure Risk – More extreme daily rainfall events would affect capacity and maintenance of storm water, drainage and sewer infrastructure. Increased ground movement and changes in groundwater could accelerate degradation of materials and structural integrity of water supply, sewer and stormwater pipelines. (CSIRO Marine & Atmospheric Research, 2008)
2. Energy Infrastructure Risk – Increased frequency and intensity of extreme storm events would damage transmission infrastructure. Increased wind and lightning could damage transmission lines. More storm activity would increase maintenance costs and disrupt services. Coastal and offshore infrastructure at risk from increases in storm surge, wind, flooding and wave events. Sea level rise would worsen the problem. Extreme heat waves are likely to increase peak demand for electricity. Decrease in annual rainfall may reduce power supply capacity of hydroelectric dams and water supply for cooling power stations. Increase in extreme wind events likely to extend shutdown periods for wind farms. (CSIRO Marine & Atmospheric Research, 2008)
3. Transport Infrastructure Risk – More extreme rainfall events would damage road, rail, bridge, airport, port and, especially, tunnel infrastructure. Rail, bridges, airports and ports are susceptible to extreme winds. Ports and coastal infrastructure at risk from storm surges; sea level rise will add to the problem. Increased ground movement and changes in groundwater would accelerate degradation of materials, structures and foundations. Increased temperature and solar radiation could reduce the life of asphalt on road surfaces and airport tarmacs. Higher temperatures stress steel in bridges and rail tracks. (CSIRO Marine & Atmospheric Research, 2008)
4. Planning and Policy Risk – Including compliance with an evolving regulatory environment such as changes to regional planning directions, planning codes, regulated industry standards and risk disclosure compliance.
5. Market and Competitiveness Risk – Including changing markets, loss of productivity with respect to competitors and the effects of the changing relative value of assets based on exposure to primary (direct) and secondary (market adaptation) climate change impacts. This market and competitive risk may result in businesses and/or developers locating to a neighbouring local government area, impacting on job provisions and the economic base.
6. Litigation Risk – Including the liabilities associated in inadequate disclosure to the community and developers of associated climate change risks or inadequate preparation of the traded commodity for climate change. The litigation risks for LGA’s include maladaptive actions that lead to negative health impacts, loss of business and private property insurance and values (McDonald & England 2007).
7. Environmental Risk – Including species loss, water availability and quality, scenic amenity, reduced pollination and clashes between rolling easements and urban development. Challenging decisions will have to be made with limited resources.
8. Political Risk – Including the risk that politicians face from their specific stance, action or inaction on climate related issues. As climate change becomes more prominent in the public arena there is growing evidence that the community are prepared to vote on a politician or political party's approach to climate change strategies.
9. Emergent Risk – New and future risks, including as yet unknown secondary risks associated with actions or inactions taken to address climate change. These include non linear events or step changes as well as the confluence of impacts, or cocktail effects.

36
Actions for local government
The Australian Government’s Department of Climate Change and Energy Efficiency first released Climate Change Adaptation Actions for Local Government in 2007. Updates were released in 2009 and
2010. The primary objective of the report is to identify adaptation actions that can be implemented by local governments in response to the predicted climate impact risks.
LOCAL GOVE RNMEN T A CT IONS TO M IT IGATE R IS K FR OM CL IMATE CHAN GE
Policy
Undertake a risk assessment for the local government area to identify the most significant areas of risk and to establish priorities.
Incorporate potential climate change adaptation actions into strategic planning where appropriate. New buildings and infrastructure
Where practicable, adopt climate sensitive building design that considers local cooling and heating requirements e.g. inclusion of natural ventilation cooling, consideration of building orientation and low energy consumption.
Design buildings to allow for consideration of future climate change impacts and incorporation of future adaptation (noting that the Building Code of Australia sets minimum standards, and it can be difficult for local governments to justify setting more stringent requirements).
Existing buildings and infrastructure Monitor any changes to the condition in structures so that any modifications/retrofitting occurs on time
and prior to failure.
Identify alternative options should the existing buildings and infrastructure be impacted upon in order to maintain services and connections, e.g. to minimise isolation of communities during an adverse storm event that puts the infrastructure at higher risk.
Design retrofitting to a higher standard than the minimum set where possible and practical.
Progressively incorporate higher design standards into asset management plans and rolling capital works programs.
Community health and recreation
Establish the level of risk to the community of climate change impacts to assist in prioritising potential adaptation actions.
Control planning and activities in areas of high risk.
Encourage building design and public spaces that provide improved levels of thermal comfort and security, e.g. protection during floods or extreme wind.
Natural environment
Analyse the risks from the initial risk assessment, such as flood liability, storm surge, species extinction security of water supply.
Reduce other external stresses e.g. pollution or development (Department of Climate Change and Energy Efficiency, 2009- 10).

37
Risk to the community
The physical effects of climate change and subsequent adaptation and mitigation strategies have the potential to place significant strain on communities, especially the elderly, those in poor health, socially isolated and indigenous Australians. Impacts include health impacts (from disease, heat waves and extreme weather events) and increased financial strain (from rising fuel, energy, water, property and health insurance and food costs). In particular, as the number of very hot days (above 35°C) increases, more people may suffer heat-related illnesses and death, with the elderly particularly vulnerable. Currently, 289 people aged 65 and over die annually in Melbourne from heat-related deaths. This could jump to between 566 and 604 a year by 2020, and up to 1,318 by 2050. The population of Victoria is more susceptible to cold-related deaths than heat-related deaths. As such, the total number of temperature-related deaths is projected to be up to 1,164 in 2100 with no mitigation, compared to 1,966 with no human-induced climate change (Department of Climate Change and Energy Efficiency, 2012). It is possible to see links between increased temperatures and the effects on individuals by looking at the increased service demand for ambulances across metropolitan Melbourne during baseline (non-hot) summer days and hot summer days. An increase in vulnerability and increased service demand for ambulances is already noted for the western and south-eastern regions in the summer months. A predicted increase in older persons living in the outer western suburbs, Mornington Peninsula, and the eastern fringe suburbs will add to the increased demand for ambulance services already noted in these areas (Monash University, 2013).
Actions for the community
Climate change is a global issue, however, individual behaviour is influencing the speed of the phenomena due to our consumption patterns and carbon dioxide emissions. The community can take action against the effects of climate change by reducing its ecological footprint. An ecological footprint is the area of land and ocean required to support an individual or area’s consumption of food, goods, services, housing, and energy, and assimilation of wastes. Ecological footprints are expressed in "global hectares" (gha) or "global acres" (ga), which are standardised units that take into account the differences in biological productivity of various ecosystems impacted by consumption activities. Footprints are often broken down into four consumption categories: carbon (home energy use and transportation), food, housing, and goods and services. Footprints can also be broken down into four ecosystem types or biomes: cropland, pastureland, forestland, and marine fisheries (Centre for Sustainable Economies, 2013). There are only 15.71 global hectares available per person on a renewable basis. At present, globally we are overshooting the earth's biological capacity by nearly 50 per cent. To sustain present levels of consumption, we would need 1.5 earths (Centre for Sustainable Economy, 2013). Although advances in technology have assisted in more efficient production of items, the benefits have been outweighed by ever-growing levels of consumption in both affluent Western countries and the emerging middle classes of developing economies, such as China and India (WWF, 2013). Victorians have the choice to engage in activities that protect or improve the natural environment, buy less, share more, buy smarter and reduce waste to decrease their ecological footprint. EPA Victoria offers a number of actions that households can do right now to reduce their ecological footprint.

38
Implications for Maroondah in the future
Maroondah’s natural environment is a defining feature of the municipality. As the population grows and there are increases in the number and types of dwellings, retaining the natural characteristics of the municipality will need to be carefully considered.
Access to open space will also remain critical. However, it is not only the amount of open space that is important; access and quality of open space are also crucial considerations.
As the built environment changes there may be impacts on the character of the municipality. Change will continue, however, the location and scale of development should be carefully considered.
Climate change is increasingly having economic, environmental and social impacts. It may lead to increased costs to Council and the community but also possible employment and business opportunities.
Climate change is also impacting the health and wellbeing of residents, particularly the elderly.
Climate change is having impacts on biodiversity and the natural environment that is changing the character of Maroondah.

39
6 GOVERNANCE
Local government plays an important governance role for local communities. Yet the powers of local government are conferred and limited by the state government, which has the ability to change the role and functions of councils and their geographic boundaries at any time. This uncertainty will continue even if there is formal recognition of local government in the Federal constitution. The scope of local government activities has expanded significantly in recent decades. Financial pressures are increasing as communities expect increased service levels, yet councils have limited powers to generate revenue. There is a trend toward the state taking greater responsibility for planning in local areas that are considered of state or metropolitan significance.
Contemporary role of local government
McKinlay (2009) believes local governments are important to communities for a number of reasons:
“The efficiency advantages which come from minimising free rider and transaction cost problems in delivering services where a significant majority but not all of the public want access.
Often, a belief that there are public or merit good issues which would be disregarded by private sector providers.
The sense that 'community' matters and that there will always be issues which need to be resolved at the community level, but will not be adequately handled if left solely to the private sector or for that matter a higher tier of government...”
Far from its historical remit of ‘roads, rates and rubbish’, the role of local government has expanded significantly. Dale (2008) argues that Victorian local government now plays the following key roles: democratic governance, service provision, community building, advocacy and community planning. However, as discussed in the sections below, there are significant challenges and ongoing uncertainty impacting on local governments’ ability to perform its role.

40
Financial pressures
Local governments have limited means to raise funds, with key revenue generators being government grants, rates, parking fines and rates. However, the role of councils is expanding and community expectations for service provision are increasing. Furthermore, council costs are increasing at a rate faster than the Consumer Price Index (CPI). Research by the Municipal Association of Victoria (MAV), as reported in the 2012 Victorian Auditor-General’s report Performance Reporting by Local Government,
indicates that local government expenses are different to household expenses. CPI measures price movements in a standard basket of common household goods and services. However, MAV reports that a ‘basket’ of common council services is primarily affected by the growth in construction, material and wage costs, not CPI. Specifically, the expenses of staff and contractors to deliver human-based services, including staff and materials needed to construct, maintain and upgrade assets and infrastructure, means that local government costs are more affected by the Average Weekly Earnings and Roads Construction and Maintenance indexes than CPI. In this context, MAV advises that council costs are substantially different to a basket of common household goods and services. Accordingly, MAV’s Local Government Cost Index (LGCI) uses a combination of established indices that reflect average wages, construction and materials costs that best represent councils’ spending profile. As Figure 25 illustrates the LGCI typically increases, on average, by around one per cent above CPI each year.
FIGUR E 25. AVERAG E ANNUAL INCREASE IN LGCI AND CPI
Source: Victorian Auditor-General’s Office based on information supplied by the Municipal Association of Victoria
LOCAL GOVE RNMEN T: R IS ING COSTS AND R IS IN G EXPE CTATIONS In essence, local government is currently facing strong financial pressures in which it is unable to meet the increasing needs of the community it serves... Thus the gap between what the community and other levels of government demand from councils, together with councils’ assets renewal requirements when compared to the funds local government has to met these demands, is growing at an alarming rate
Source: Johnson, 2003, p.38.
41
Other emerging issues for local government
Emerging challenges
In 2011, the NSW state government elected executive level representatives of all general purpose councils in NSW to consider, among other things, the challenges facing local communities. When asked to consider the most important challenges likely to affect Australian communities into the future, the responses which received more than 15 per cent of votes were:
Population change
Demographic shifts
Economic changes, and
Technology change. When asked to select from a potential list of the two most important challenges for councils to plan for, the top three responses were clearly:
Infrastructure and asset issues
Financial sustainability, and
Population and demographic changes.
A new metropolitan planning authority
The Victorian State Government is currently preparing a new metropolitan strategy for Melbourne. The implementation of this strategy, and the role of local government, is not yet clear. However, in March 2013, the state government announced the creation of a metropolitan planning authority. Whilst the scope and powers of the authority remain unclear, the Minister for Planning indicated that the authority likely take some of the planning functions that currently exist within government.
Implications for Maroondah in the future
Without changes to income sources for local government, rising cost and greater community expectations are likely to stretch already scarce resources.
Local government may need to find new sources of funding to meet these rising costs.
Local governments may need to prioritise between their various roles.
Local government’s planning role may be narrowed as the state government becomes more directly involved in metropolitan planning.

42
REFERENCE MATERIAL AND FURTHER READING
Australian Centre of Excellence for Local Government (2012) Local Action for a low carbon future
Australian Government (2011) Building the Education Revolution Australian Government (2011) Creating Places for People: An Urban Design
Protocol for Australian Cities
Australian Government (2011) National Disability Strategy 2010-2020 Australian Government (2011) Our Cities, Our Future
Australian Government (2012) Climate Change – potential impacts and costs – Victoria Fact Sheet
Australian Health Ministers’ Conference (2005) National Chronic Disease Strategy
Centre for Sustainable Economy (2013) Ecological Footprint: What is Measures,
viewed 27th February 2013, <http://myfootprint.org/en/about_the_quiz/what_it_measures/>
Commonwealth of Australia (2010) Australia to 2050: Future challenges – The Intergenerational Report
CSIRO Marine and Atmospheric Research (2008) Climate change and Victorian infrastructure – Planning ahead
Dale, C. (2008) ‘The Role of Local Government for a Contemporary Victorian Community’, Graduate School of Business, Victoria University.
Department of Climate Change and Energy Efficiency (2012) Climate Change- potential impacts and costs- Victoria Fact Sheet
Eastern Regional Housing Working Group (2006) Eastern Region Housing Statement
EPA Victoria (2012) Ecological Footprint: Measuring our impact on the environment, Victorian Government, viewed 27th February 2013,
<http://www.epa.vic.gov.au/ecologicalfootprint/calculators/personal/completed.asp>
Grattan Institute (2011) The Housing We’d Choose
Johnson, A., (2003) ‘Financing Local Government in Australia’, in: B. Dollery, N. Marshall and A. Worthington, (eds). Reshaping Australian Local Government: Finance, governance and reform, University of New South Wales Press Ltd,
Australia.
Local Government Focus (2013)‘Challenges for 2013, Vol.29, No.1, January 2013.
Loughnan, M.E., Tapper, N.J., Phan, T., Lynch, K., McInnes, J.A. (2013) A spatial vulnerability analysis of urban populations during extreme heat events in Australian capital cities, National Climate Change Adaptation Research Facility,
Gold Coast
Maroondah City Council (2013) Carbon Price Issues and Opportunities Paper
McKinlay, P. (2009) ‘New Directions in New Zealand Local Government’, Future of Local Government Summit 5: New Directions in New Zealand Local Government.
Metropolitan Strategy Ministerial Advisory Group (2012) Melbourne, let’s talk about the future
Metropolitan Strategy Ministerial Advisory Group (2012) Melbourne, let’s talk about the future
Monash University (2013) A spatial vulnerability analysis of urban populations during extreme heat events in Australian capital cities
NSW Government (2011), Destination 2036 Outcomes Report, September 2011.
Outer Suburban/Interface Services and Development Committee (2012) Inquiry into liveability options in outer Suburban Melbourne, Parliamentary Paper, No.
149, Session 2010-12 Regional Development Australia & Regional Development Victoria (2011) Making
a great region even better: A Regional Plan for Melbourne’s East
Tiley, I. & Dollery, B. (2010), Historical Evolution of Local Government Amalgamation in Victoria, Tasmania and South Australia, Working Paper Series, Centre for Local Government, University of New England.
Victorian Auditor-General (2012) Performance Reporting in Local Government
Wales, N., Khanjanasthiti, I., Savage, S. & Earl, G. (2012) Climate Change Resilience of Melbourne, The Climate Institute, Sydney.


www.sgsep.com.au
Contact us BRISBANE
PO Box 1177 Level 1, 76 McLachlan Street
Fortitude Valley QLD 4006
+61 7 3124 9026
CANBERRA
Level 1, 55 Woolley Street
Dickson ACT 2602
+61 2 6262 7603 [email protected]
HOBART
Unit 2, 5 King Street
Bellerive TAS 7018
+61 (0)439 941 934 [email protected]
MELBOURNE
Level 5, 171 La Trobe Street
Melbourne VIC 3000
+61 3 8616 0331
SYDNEY
Suite 12, 50 Reservoir Street
Surry Hills NSW 2010
+61 2 8307 0121