Markets remain in the red - Market Review
14
Kuwait Financial Centre “Markaz” R E S E A R C H Markets remain in the red Another month, another crisis July 2011 Returns (%) S&P 500 MSCI World MSCI EM S&P GCC -2.15 -1.60 -0.47 -2.82 World markets were down again in July; the broad index shed 1.6% while the YTD gain stands at 3.3%. Global markets were preoccupied with the US Debt deal saga which reached a fever pitch during the month. Gold was up on the uncertainty, gaining 8.5% for the month. Crude oil gained almost 4% for the month, with a YTD gain of almost 27%. Investors shifted to the US as the debt crisis boiled over with political stalemates causing S&P ratings to indicate a 50% chance that it would downgrade the US if a deal was not reached as the country rapidly approached the $14.3 trillion debt ceiling. An 11 th hour deal was finally struck which advocated a $2.1 trillion, 10-yr deficit-reduction plan, about half the aimed for $4 trillion. Following the announced, Moody‟s affirmed the US „AAA‟ rating but placed the country on “Negative” outlook due to low economic growth and fiscal weakness while S&P made a historic and unprecedented move of downgrading the US credit rating from AAA to AA+ with a “Negative” outlook. The downgrade caused a widespread sell-off across US and international equity markets. The ECB is expected to put a stop to its tightening policy as economic growth shows signs of weakening while trouble brews in Spain and Italy in addition to resuming purchases of distressed government debt. GCC markets saw losses again in July as investors watched the US/Europe debt issues continue to unfold while local/regional corporate and regulatory issues kept investors cautious. The S&P GCC lost 2.8% after shedding 2% in June, bringing YTD losses to almost 7%. Dubai was flat while Qatar eked out a gain of 0.50%. The largest decline was in Kuwait‟s Weighted Index, down 4.24%. Liquidity was down significantly in July; GCC value traded declined 22% to USD 20.8 bn while volume was down 31% to just 7 bn. Saudi and Kuwait saw value traded decline by 21% and 12%, respectively. GCC Value Traded in the YTD period is at USD 215 bn, 10% higher than the same period last year. Risk in the GCC (as measured by the Markaz Volatility Index – MVX) was up just 1% in July after increasing 21% in June. MVX Kuwait was up the most, jumping 56% for the month while MVX Qatar saw a fourth consecutive month of declines, down 37% for the month. Kuwait valuations have dipped into the 10x-15x range as markets have declines while earnings have held up. August 2011 Research Highlights: Review of global and regional stock markets for the month of July 2011 Markaz Research is available on Bloomberg Type “MRKZ” <Go> M.R. Raghu CFA, FRM Head of Research +965 2224 8280 [email protected] Layla Al-Ammar Assistant Manager +965 2224 8000 ext. 1205 [email protected] Kuwait Financial Centre S.A.K. “Markaz” P.O. Box 23444, Safat 13095, Kuwait Tel: +965 2224 8000 Fax: +965 2242 5828 markaz.com
-
Upload
marmore-mena-intelligence -
Category
Documents
-
view
215 -
download
2
description
Markets remain in the red - Market Review
Transcript of Markets remain in the red - Market Review
Kuwait Financial Centre “Markaz” R E S E A R C H
Markets remain in the red Another month, another crisis
July 2011 Returns (%)
S&P 500 MSCI World MSCI EM S&P GCC
-2.15 -1.60 -0.47 -2.82
World markets were down again in July; the broad index shed 1.6% while the YTD gain stands at 3.3%. Global markets were preoccupied with the US
Debt deal saga which reached a fever pitch during the month. Gold was up
on the uncertainty, gaining 8.5% for the month. Crude oil gained almost 4% for the month, with a YTD gain of almost 27%.
Investors shifted to the US as the debt crisis boiled over with political
stalemates causing S&P ratings to indicate a 50% chance that it would downgrade the US if a deal was not reached as the country rapidly
approached the $14.3 trillion debt ceiling. An 11th hour deal was finally
struck which advocated a $2.1 trillion, 10-yr deficit-reduction plan, about half the aimed for $4 trillion. Following the announced, Moody‟s affirmed
the US „AAA‟ rating but placed the country on “Negative” outlook due to low economic growth and fiscal weakness while S&P made a historic and
unprecedented move of downgrading the US credit rating from AAA to AA+
with a “Negative” outlook. The downgrade caused a widespread sell-off across US and international equity markets.
The ECB is expected to put a stop to its tightening policy as economic
growth shows signs of weakening while trouble brews in Spain and Italy in addition to resuming purchases of distressed government debt.
GCC markets saw losses again in July as investors watched the US/Europe debt issues continue to unfold while local/regional corporate and regulatory
issues kept investors cautious. The S&P GCC lost 2.8% after shedding 2% in June, bringing YTD losses to almost 7%. Dubai was flat while Qatar eked
out a gain of 0.50%. The largest decline was in Kuwait‟s Weighted Index,
down 4.24%.
Liquidity was down significantly in July; GCC value traded declined 22% to USD 20.8 bn while volume was down 31% to just 7 bn. Saudi and Kuwait
saw value traded decline by 21% and 12%, respectively. GCC Value Traded
in the YTD period is at USD 215 bn, 10% higher than the same period last year.
Risk in the GCC (as measured by the Markaz Volatility Index – MVX) was up
just 1% in July after increasing 21% in June. MVX Kuwait was up the most, jumping 56% for the month while MVX Qatar saw a fourth consecutive
month of declines, down 37% for the month.
Kuwait valuations have dipped into the 10x-15x range as markets have
declines while earnings have held up.
August 2011
Research Highlights: Review of global and regional
stock markets for the month of July 2011
Markaz Research is
available on Bloomberg Type “MRKZ” <Go>
M.R. Raghu CFA, FRM
Head of Research +965 2224 8280
Layla Al-Ammar
Assistant Manager +965 2224 8000 ext. 1205
Kuwait Financial Centre S.A.K. “Markaz”
P.O. Box 23444, Safat 13095,
Kuwait
Tel: +965 2224 8000 Fax: +965 2242 5828
markaz.com
R E S E A R C H August 2011
Kuwait Financial Centre “Markaz”
2
Global Markets Review – July 2011
World markets saw comparable losses to June; down as the US debt crisis
reached a zenith while the economy remains weak. Crude oil was up almost 4% for the month, closing at $117.53 per bbl (Brent), with a YTD gain of
almost 27%. Gold benefitted from the uncertainty over the US debt issue,
gaining 8.5% for the month, closing at $1626.59/oz.
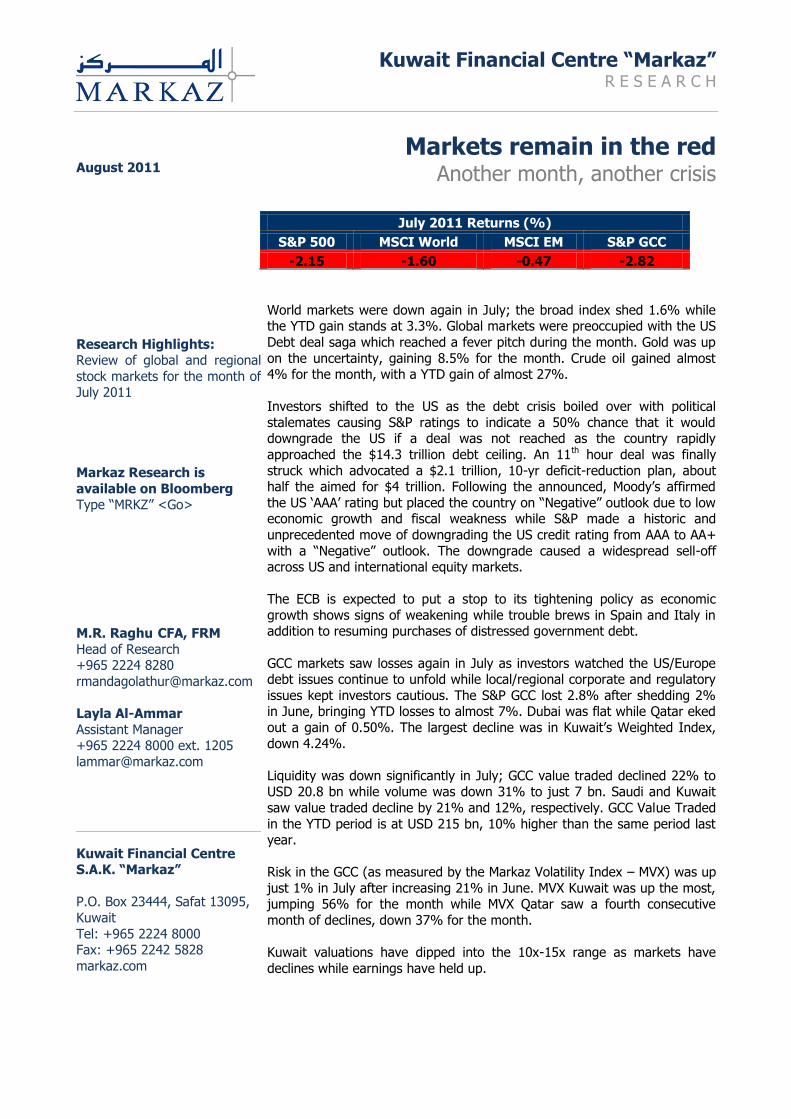
The broad index lost 1.6% in July after shedding 1.54% in June. The YTD return stands at 3.3% (Figure: 1). The largest contribution was the US with
a market cap weighted loss of 0.8%. Figure 1: MTD Market Cap Weighted returns of MSCI World
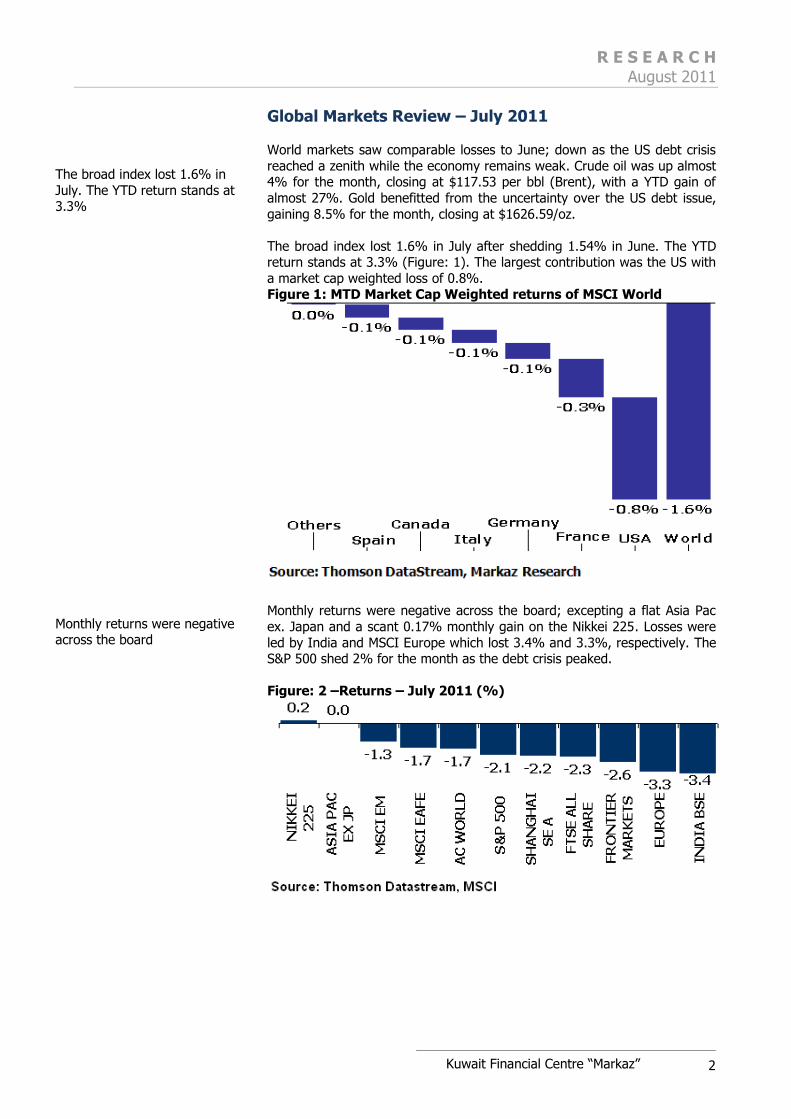
Monthly returns were negative across the board; excepting a flat Asia Pac
ex. Japan and a scant 0.17% monthly gain on the Nikkei 225. Losses were
led by India and MSCI Europe which lost 3.4% and 3.3%, respectively. The S&P 500 shed 2% for the month as the debt crisis peaked.
Figure: 2 –Returns – July 2011 (%)
The broad index lost 1.6% in
July. The YTD return stands at 3.3%
Monthly returns were negative across the board
R E S E A R C H August 2011
Kuwait Financial Centre “Markaz”
3
World
"Risky assets do not cause crises. It is those perceived as being safe that do." – Financial Times
Investor eyes turned to US as the debt issue rapidly escalated to a debt crisis during July as Democrats and Republicans fought for competing ideals
on ways to reduce the deficit and avoid a default as the country approached
the $14.3 trillion debt ceiling. The former lobbied for revenue raising and limited spending cuts while the latter rejected taxation and pushed for
dramatic spending cuts. An eleventh hour deal was finally struck which advocated a $2.1 trillion, 10-yr deficit-reduction plan, about half the aimed
for $4 trillion. The law creates a bipartisan committee to identify $1.2 trillion
in spending cuts by the end of the year1.
The three main rating agencies were closely monitoring the outcome of the deal. Moody‟s made an announcement following the outcome of the deal;
affirming the US „AAA‟ rating but placing the country on “Negative” outlook, i.e. the agency could lower the rating within the next 12-18 months, citing
lower economic growth, higher interest rates and weak fiscal discipline.
Meanwhile, Fitch is expected to conclude its review in August, which could include a downgrade2.
S&P ratings said during the month that there was a 50% chance that it
would lower the US rating within the next three months if a meaningful
deficit-reduction plan was not crafted and agreed upon. S&P previously said that a $4 trillion plan would be considered a “down payment” on future
credit worthiness. Following the announcement of the deal, S&P made the unprecedented move of downgrading US long-term credit from AAA to AA+
with a “Negative” outlook, implying the possibility of further downgrade over the next two years. The ratings agency cited the political wrangling
and ineffectiveness in dealing with the country‟s rising debt burden and
fiscal deficit as primary causes behind the action.
This is not the first time the US has faced a downgrade threat; a similar crisis loomed in 1995. It is worth noting that at the time, the debt was at
just $4.9 trillion3 (or 71% of GDP) versus over $14 trillion (or 91.5% of
GDP) currently. However, at that time, the US economy was on a steady growth trajectory, growing at about 4% a year versus current sluggish
growth.
Critics of the plan say it amounts to little more than “can kicking” as it does
not solve the major spending issues related to Social Security, Medicare and Medicaid and existing tax benefits to the wealthy and business segments.
Analysts have also been critical of the fact that the plan is largely dependent on spending cuts which could further derail the already tentative
economic recovery.
There is not expected to be a flight out of Treasuries given that the US
issues almost 60% of the world‟s sovereign debt while the second and third largest issuers (France and Germany) are embroiled in their own debt
issues within Europe. Consequently, while “a downgrade would give Treasury buyers another reason to diversify their holdings over time,
regulatory requirements, lack of alternatives and operational inertia seem
1 Reuters 2 Wall Street Journal, August 4th 2011 3 AP, August 3rd 2011
The US debt deal comprises a $2.1 trillion, 10-yr deficit
reduction
Moody‟s made an
announcement following the outcome of the deal; affirming
the US „AAA‟ rating but had placed the country on “Negative” outlook

R E S E A R C H August 2011
Kuwait Financial Centre “Markaz”
4
set to underpin demand for now. And investors would be forced to recognize that they operate in a world of omnipresent credit risk, an
unambiguously good thing for global economic stability.4”
Across the pond, the debt crisis seems to be spreading through the Euro-
zone rather than abating. The ECB is expected to put a stop to its tightening policy as economic growth shows signs of weakening while
trouble brews in Spain and Italy. CDS rates imply “a 27% chance that Italy
will default on its debt within the next five years and a 31% probability that Spain won‟t be able to meet its obligations5”. The ECB is expected to re-
enter the bond market to purchase distressed euro-area government bonds; the Central Bank ceased its purchases nearly five months ago and has
purchased $106 bn of assets since May 2010.
Risk was mostly down in July, except in the S&P 500, where MVX was up
3% for the month versus a 55% jump in June. MVX EM, MVX India and MVX China were down 9%, 12%, and 3%, respectively. The CBOE VIX
Index surged 53% in July, bringing it up 42% for the year and over the long-term average of 20.
Chart Pack – Global Markets
Figure: 3 – Capital Flows to Emerging Economies Figure: 4 - Feds Fund Target Rate
Figure: 5 - Trade Weighted Dollar Figure: 6 -Homebuilders housing market index
4 The Economist 5 Bloomberg

R E S E A R C H August 2011
Kuwait Financial Centre “Markaz”
5
Figure: 7 - US Unemployment rate (Seasonally Adj) Figure: 8 - Crude Brent Oil Prices
Figure: 9 - Ted Spread Figure: 10 - CBOE VIX
Figure: 11 - CRB Commodity Index Figure 12: JPM EMBI Global Spread
R E S E A R C H August 2011
Kuwait Financial Centre “Markaz”
6
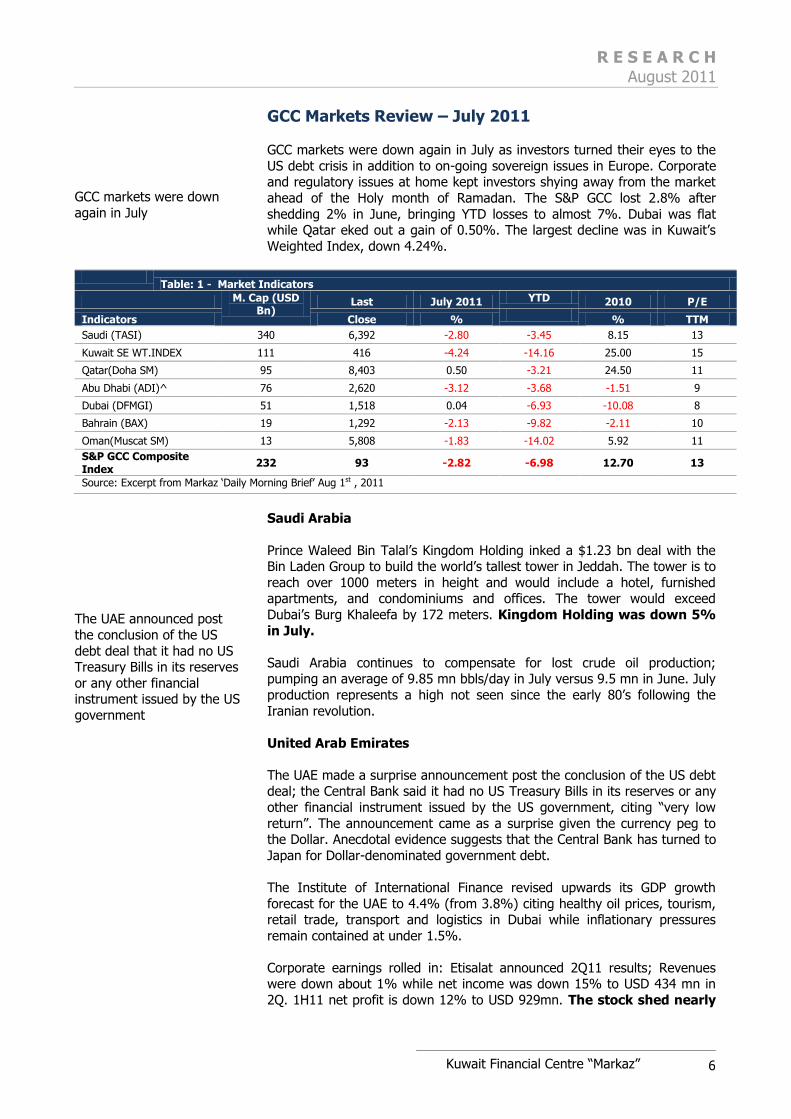
GCC Markets Review – July 2011 GCC markets were down again in July as investors turned their eyes to the
US debt crisis in addition to on-going sovereign issues in Europe. Corporate and regulatory issues at home kept investors shying away from the market
ahead of the Holy month of Ramadan. The S&P GCC lost 2.8% after
shedding 2% in June, bringing YTD losses to almost 7%. Dubai was flat while Qatar eked out a gain of 0.50%. The largest decline was in Kuwait‟s
Weighted Index, down 4.24%.
Table: 1 - Market Indicators
M. Cap (USD Bn)
Last July 2011 YTD 2010 P/E
Indicators Close % % TTM
Saudi (TASI) 340 6,392 -2.80 -3.45 8.15 13
Kuwait SE WT.INDEX 111 416 -4.24 -14.16 25.00 15
Qatar(Doha SM) 95 8,403 0.50 -3.21 24.50 11
Abu Dhabi (ADI)^ 76 2,620 -3.12 -3.68 -1.51 9
Dubai (DFMGI) 51 1,518 0.04 -6.93 -10.08 8
Bahrain (BAX) 19 1,292 -2.13 -9.82 -2.11 10
Oman(Muscat SM) 13 5,808 -1.83 -14.02 5.92 11
S&P GCC Composite Index
232 93 -2.82 -6.98 12.70 13
Source: Excerpt from Markaz „Daily Morning Brief‟ Aug 1st , 2011
Saudi Arabia
Prince Waleed Bin Talal‟s Kingdom Holding inked a $1.23 bn deal with the Bin Laden Group to build the world‟s tallest tower in Jeddah. The tower is to
reach over 1000 meters in height and would include a hotel, furnished apartments, and condominiums and offices. The tower would exceed
Dubai‟s Burg Khaleefa by 172 meters. Kingdom Holding was down 5%
in July.
Saudi Arabia continues to compensate for lost crude oil production; pumping an average of 9.85 mn bbls/day in July versus 9.5 mn in June. July
production represents a high not seen since the early 80‟s following the
Iranian revolution.
United Arab Emirates
The UAE made a surprise announcement post the conclusion of the US debt deal; the Central Bank said it had no US Treasury Bills in its reserves or any
other financial instrument issued by the US government, citing “very low
return”. The announcement came as a surprise given the currency peg to the Dollar. Anecdotal evidence suggests that the Central Bank has turned to
Japan for Dollar-denominated government debt.
The Institute of International Finance revised upwards its GDP growth
forecast for the UAE to 4.4% (from 3.8%) citing healthy oil prices, tourism, retail trade, transport and logistics in Dubai while inflationary pressures
remain contained at under 1.5%.
Corporate earnings rolled in: Etisalat announced 2Q11 results; Revenues were down about 1% while net income was down 15% to USD 434 mn in
2Q. 1H11 net profit is down 12% to USD 929mn. The stock shed nearly
GCC markets were down
again in July
The UAE announced post
the conclusion of the US
debt deal that it had no US Treasury Bills in its reserves
or any other financial instrument issued by the US
government
R E S E A R C H August 2011
Kuwait Financial Centre “Markaz”
7
7% for the month. Meanwhile, Du telecom 2Q net profit was up 51% to USD 56.4 mn. Du stock gained 1.92% in July.
Abu Dhabi Commercial Bank (ADCB), the UAE‟s second largest lender, showed a 2Q11 net profit of USD 365 mn versus a loss at the same time
last year. The positive results were due in large part to investment income from a stake sale in Malaysia‟s RHB Capital Berhad, which resulted in a gain
of USD 356 mn. Provisions remained high with USD 254 mn booked in 2Q,
thereby squeezing the bottom line. ADCB stock gained 3.04% for the month.
NBAD saw net profit of USD 280 mn in 2Q, up 2.5% YoY on revenue
strength. The bank expects NPLs to spike this year but lending should
remain strong. Provisions in the quarter were at USD 90mn, up 40% YoY. The stock gained 2.27% in July.
Kuwait
The Kuwait market hit a 7 year low in the middle of the month, dipping
below 6,000 points on a compendium on poor news. The Central Bank
governor announced that the economy suffered from precarious imbalances which needed to be addressed urgently. On the corporate side, KFH
announced a net profit decline of 43% in 2Q11 to USD 83.6 mn, marking the fourth consecutive quarter of declines, causing the stock to drop 5.2%
in one day. KFH closed the month with a loss of 12%. Poor news also
came from Agility, which was ruled against in a US court in its on-going legal dispute with the US government. Agility stock shed 10.6% in July
and is down 44% for the year.
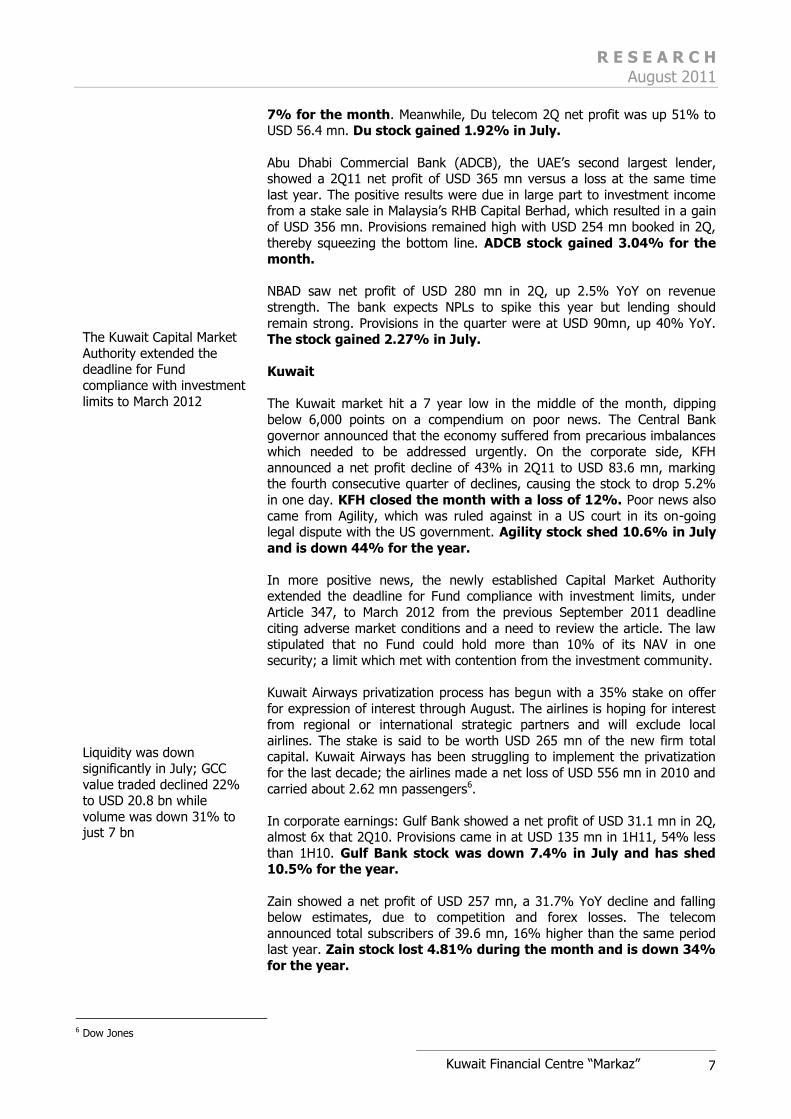
In more positive news, the newly established Capital Market Authority extended the deadline for Fund compliance with investment limits, under
Article 347, to March 2012 from the previous September 2011 deadline
citing adverse market conditions and a need to review the article. The law stipulated that no Fund could hold more than 10% of its NAV in one
security; a limit which met with contention from the investment community.
Kuwait Airways privatization process has begun with a 35% stake on offer
for expression of interest through August. The airlines is hoping for interest from regional or international strategic partners and will exclude local
airlines. The stake is said to be worth USD 265 mn of the new firm total capital. Kuwait Airways has been struggling to implement the privatization
for the last decade; the airlines made a net loss of USD 556 mn in 2010 and
carried about 2.62 mn passengers6.
In corporate earnings: Gulf Bank showed a net profit of USD 31.1 mn in 2Q, almost 6x that 2Q10. Provisions came in at USD 135 mn in 1H11, 54% less
than 1H10. Gulf Bank stock was down 7.4% in July and has shed 10.5% for the year.
Zain showed a net profit of USD 257 mn, a 31.7% YoY decline and falling below estimates, due to competition and forex losses. The telecom
announced total subscribers of 39.6 mn, 16% higher than the same period last year. Zain stock lost 4.81% during the month and is down 34%
for the year.
6 Dow Jones
The Kuwait Capital Market
Authority extended the deadline for Fund
compliance with investment
limits to March 2012
Liquidity was down significantly in July; GCC
value traded declined 22% to USD 20.8 bn while
volume was down 31% to just 7 bn

R E S E A R C H August 2011
Kuwait Financial Centre “Markaz”
8
Liquidity, Risk & Valuation
Liquidity was down significantly in July; GCC value traded declined 22% to
USD 20.8 bn while volume was down 31% to just 7 bn. Saudi and Kuwait saw value traded decline by 21% and 12%, respectively. GCC Value Traded
in the YTD period is at USD 215 bn, 10% higher than the same period last year.
Risk in the GCC (as measured by the Markaz Volatility Index – MVX) was up just 1% in July after increasing 21% in June (Figure 21). MVX Kuwait was
up the most, jumping 56% for the month while MVX Qatar saw a fourth consecutive month of declines, down 37% for the month.
Kuwait valuations have dipped into the 10x-15x range as markets have declines while earnings have held up (Figure 14).
Chart Pack – GCC Figure: 13 – S&P GCC – PE Band Figure: 14 - MSCI Kuwait – PE Band
Source: Thomson DataStream
Figure: 15 - MSCI UAE– PE Band Figure: 16 - MSCI Qatar – PE Band
Source: MSCI, Thomson DataStream Source: MSCI, Thomson DataStream Figure: 17 - MSCI Oman – PE Band Figure: 18 - MSCI Bahrain – PE Band
Source: MSCI, Thomson DataStream Source: MSCI, Thomson DataStream
MVX Kuwait was up the
most, jumping 56% for the month while MVX Qatar saw
a fourth consecutive month
of declines, down 37% for the month

R E S E A R C H August 2011
Kuwait Financial Centre “Markaz”
9
Figure: 19 – Average Daily Value Traded (USD mn) – July 2011
Figure: 20 - Risk & Return – GCC Vs Developed & EM
Figure: 21 – Comparative MVX Levels – July 2011
Source: MVX is a proprietary volatility index developed by Markaz Research Note: Base data for MVX GCC has been changed from MSCI GCC to S&P GCC Index.
R E S E A R C H August 2011
Kuwait Financial Centre “Markaz”
10
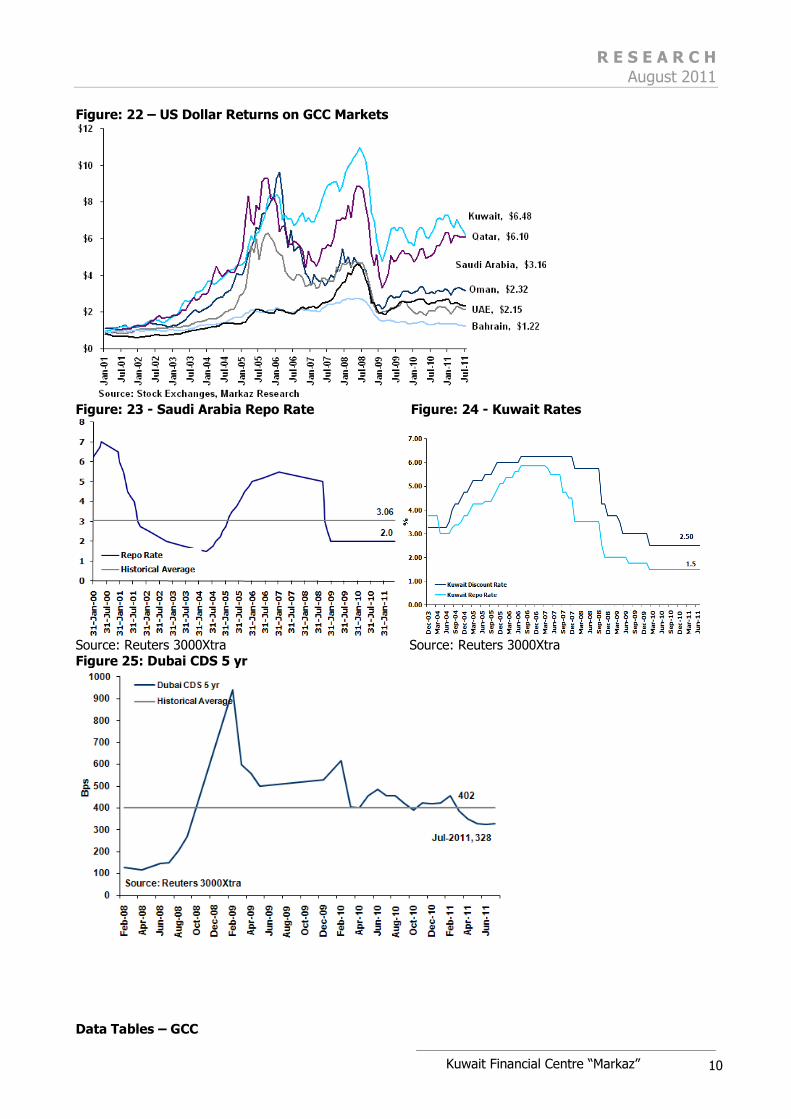
Figure: 22 – US Dollar Returns on GCC Markets
Figure: 23 - Saudi Arabia Repo Rate Figure: 24 - Kuwait Rates
Source: Reuters 3000Xtra Source: Reuters 3000Xtra Figure 25: Dubai CDS 5 yr
Data Tables – GCC
R E S E A R C H August 2011
Kuwait Financial Centre “Markaz”
11
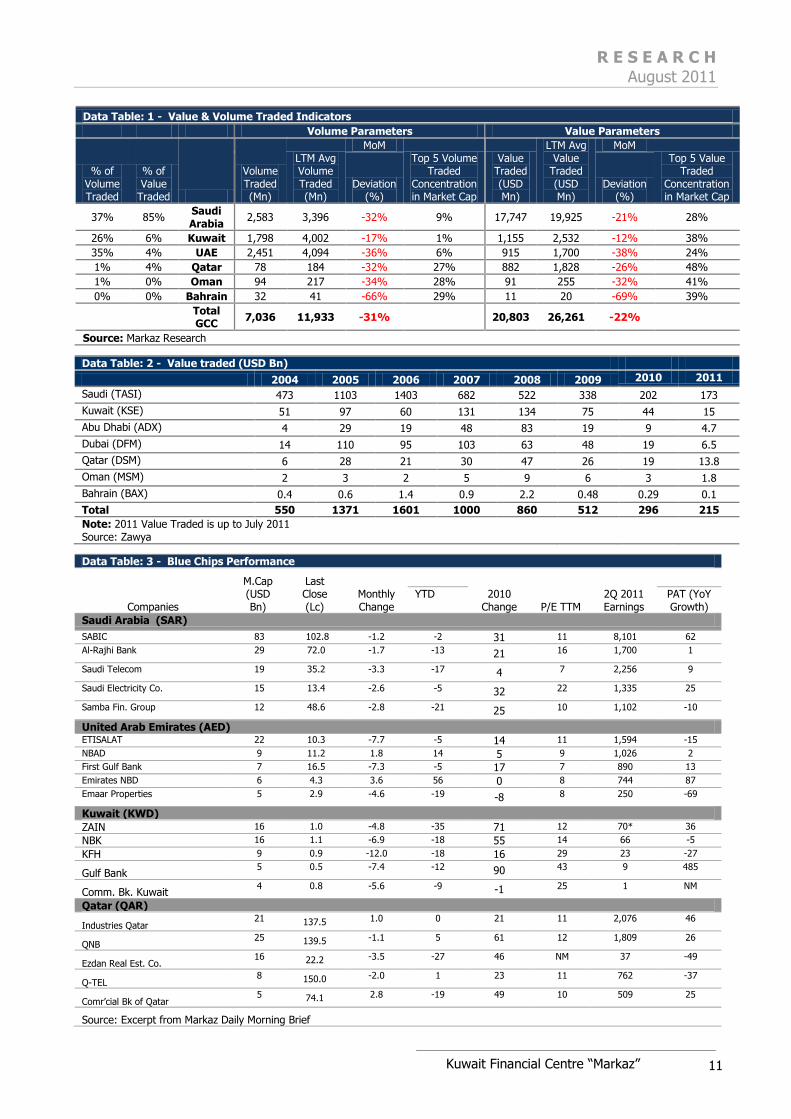
Data Table: 1 - Value & Volume Traded Indicators
Volume Parameters Value Parameters
% of Volume Traded
% of Value
Traded
Volume Traded (Mn)
LTM Avg Volume Traded (Mn)
MoM Top 5 Volume
Traded Concentration in Market Cap
Value Traded (USD Mn)
LTM Avg Value
Traded (USD Mn)
MoM Top 5 Value
Traded Concentration in Market Cap
Deviation (%)
Deviation (%)
37% 85% Saudi Arabia
2,583 3,396 -32% 9% 17,747 19,925 -21% 28%
26% 6% Kuwait 1,798 4,002 -17% 1% 1,155 2,532 -12% 38%
35% 4% UAE 2,451 4,094 -36% 6% 915 1,700 -38% 24%
1% 4% Qatar 78 184 -32% 27% 882 1,828 -26% 48%
1% 0% Oman 94 217 -34% 28% 91 255 -32% 41%
0% 0% Bahrain 32 41 -66% 29% 11 20 -69% 39%
Total GCC
7,036 11,933 -31% 20,803 26,261 -22%
Source: Markaz Research
Data Table: 2 - Value traded (USD Bn)
2004 2005 2006 2007 2008 2009 2010 2011
Saudi (TASI) 473 1103 1403 682 522 338 202 173
Kuwait (KSE) 51 97 60 131 134 75 44 15
Abu Dhabi (ADX) 4 29 19 48 83 19 9 4.7
Dubai (DFM) 14 110 95 103 63 48 19 6.5
Qatar (DSM) 6 28 21 30 47 26 19 13.8
Oman (MSM) 2 3 2 5 9 6 3 1.8
Bahrain (BAX) 0.4 0.6 1.4 0.9 2.2 0.48 0.29 0.1
Total 550 1371 1601 1000 860 512 296 215
Note: 2011 Value Traded is up to July 2011 Source: Zawya
Data Table: 3 - Blue Chips Performance
Companies
M.Cap (USD Bn)
Last Close (Lc)
Monthly Change
2010 Change P/E TTM
2Q 2011 Earnings
YTD PAT (YoY Growth)
Saudi Arabia (SAR)
SABIC 83 102.8 -1.2 -2 31 11 8,101 62
Al-Rajhi Bank 29 72.0 -1.7 -13 21 16 1,700 1
Saudi Telecom 19 35.2 -3.3 -17 4 7 2,256 9
Saudi Electricity Co. 15 13.4 -2.6 -5 32 22 1,335 25
Samba Fin. Group 12 48.6 -2.8 -21 25 10 1,102 -10
United Arab Emirates (AED) ETISALAT 22 10.3 -7.7 -5 14 11 1,594 -15
NBAD 9 11.2 1.8 14 5 9 1,026 2
First Gulf Bank 7 16.5 -7.3 -5 17 7 890 13
Emirates NBD 6 4.3 3.6 56 0 8 744 87
Emaar Properties 5 2.9 -4.6 -19 -8 8 250 -69
Kuwait (KWD)
ZAIN 16 1.0 -4.8 -35 71 12 70* 36
NBK 16 1.1 -6.9 -18 55 14 66 -5
KFH 9 0.9 -12.0 -18 16 29 23 -27
Gulf Bank 5 0.5 -7.4 -12 90 43 9 485
Comm. Bk. Kuwait 4 0.8 -5.6 -9 -1 25 1 NM
Qatar (QAR)
Industries Qatar 21 137.5 1.0 0 21 11 2,076 46
QNB 25 139.5 -1.1 5 61 12 1,809 26
Ezdan Real Est. Co. 16 22.2 -3.5 -27 46 NM 37 -49
Q-TEL 8 150.0 -2.0 1 23 11 762 -37
Comr‟cial Bk of Qatar 5 74.1 2.8 -19 49 10 509 25
Source: Excerpt from Markaz Daily Morning Brief

R E S E A R C H August 2011

R E S E A R C H August 2011

R E S E A R C H August 2011
Disclaimer
This report has been prepared and issued by Kuwait Financial Centre S.A.K (Markaz), which is regulated by
the Central Bank of Kuwait. The report is owned by Markaz and is privileged and proprietary and is subject
to copyrights. Sale of any copies of this report is strictly prohibited. This report cannot be quoted without the prior written consent of Markaz. Any user after obtaining Markaz permission to use this report must clearly
mention the source as “Markaz “.This Report is intended to be circulated for general information only and should not to be construed as an offer to buy or sell or a solicitation of an offer to buy or sell any financial
instruments or to participate in any particular trading strategy in any jurisdiction. The information and
statistical data herein have been obtained from sources we believe to be reliable but in no way are warranted by us as to its accuracy or completeness. Markaz has no obligation to update, modify or amend
this report.
This report does not have regard to the specific investment objectives, financial situation and the particular needs of any specific person who may receive this report. Investors are urged to seek financial advice
regarding the appropriateness of investing in any securities or investment strategies discussed or
recommended in this report and to understand that statements regarding future prospects may not be realized. Investors should note that income from such securities, if any, may fluctuate and that each
security‟s price or value may rise or fall. Investors should be able and willing to accept a total or partial loss of their investment. Accordingly, investors may receive back less than originally invested. Past performance
is historical and is not necessarily indicative of future performance.
Kuwait Financial Centre S.A.K (Markaz) does and seeks to do business, including investment banking deals,
with companies covered in its research reports. As a result, investors should be aware that the firm may have a conflict of interest that could affect the objectivity of this report. For further information, please contact „Markaz‟ at P.O. Box 23444, Safat 13095, Kuwait. Tel: 00965 1804800 Fax: 00965 22450647. Email: [email protected]


![Seeing Red Over International Gray Markets [Prince-Davies]](https://static.fdocuments.us/doc/165x107/577cdafd1a28ab9e78a712e8/seeing-red-over-international-gray-markets-prince-davies.jpg)