MARKETS AND PROSPECTS FOR AFRICAN EXPORTS OF FRUITS …
38
Economics and Sociology Occasional Paper No. 2202 MARKETS AND PROSPECTS FOR AFRICAN EXPORTS OF FRUITS AND VEGETABLES TO EUROPEAN COUNTRIES by William Nall February 1995 Rural Finance Program Department of Agricultural Economics and Rural Sociology The Ohio State University 2120 Fyffe Road Columbus, Ohio 43210-1099
Transcript of MARKETS AND PROSPECTS FOR AFRICAN EXPORTS OF FRUITS …

Economics and Sociology Occasional Paper No. 2202
MARKETS AND PROSPECTS FOR AFRICAN EXPORTS OF FRUITS AND VEGETABLES TO EUROPEAN COUNTRIES
by
William Nall
February 1995
Rural Finance Program Department of Agricultural Economics
and Rural Sociology The Ohio State University
2120 Fyffe Road Columbus, Ohio 43210-1099

ABSTRACT
Structural adJustment programs and an increasing debt burden have put pressure on African countries to increase their export earnings. This has led to increased interest in nontraditional and high-value exports, such as fresh and preserved fruits and vegetables. Markets for offseason fruits and vegetables, and for tropical fruits, seem to be expanding. Nevertheless, African producers are faced with increasing competition. This paper summarizes the major trends in the principal markets for African horticultural exports, and discusses the likely impact of increased competition and changes in trading structures.
Market liberalization within the EU, and the expansion of Union membership, threaten traditional trading relations between its members and African producers of fruits and vegetables. Increased investment in fruit and vegetable production in the European Union and elsewhere are likely to further increase the level of competition. For countries with existing export industries, the appropriate strategy would probably involve investments in improved efficiency, such as improvements in the infrastructure for bringing products to the point of embarkation and for storing them prior to shipment. Countries trying to develop new export products must try to identify niche markets which they can address, based on climate, seasonality or cost factors.

MARKETS AND PROSPECTS FOR AFRICAN EXPORTS OF FRUITS AND VEGETABLES TO EUROPEAN COUNTRIES
by Wilham N all
Throughout the developing world, and in Africa in particular, structural adjustment programs and an increasing debt burden have put pressure on countries to increase exports and export earnings. At the same time, markets for traditional export crops have stagnated, so that many tropical agncultural products are in surplus supply (Zolty). These factors have led to increased interest in non-traditional and high-value exports, such as fresh and preserved fruits and vegetables.
In Africa, an examination of trade statistics shows that Morocco, South Africa and Kenya, and to a lesser extent Ethiopia and Somalia, have long exported a wide variety of tropical and offseason fruits and vegetables to European markets. Other countries, such as Cote d'Ivoire and Cameroon, have traditionally focused on a smaller number of (primarily tropical) products. More recently, a number of other African countries such as Ghana, The Gambia, Uganda and Zimbabwe have attempted to develop or expand the range of their horticultural exports.
The market for tropical and off-season produce appears to be expanding, but African producer nations are faced with competition from other tropical and semi-tropical producers, and with technological changes which have extended the growing season in traditional markets. Around the Mediterranean, several countries have invested heavily in expanding their productive capacity, in order to increase exports of horticultural products. At the same time, market liberalization within the EU is threatening traditional trading relations, while the expansion ofUnion membership will eventually provide preferential access to Union markets for imports from new members Spain and Portugal. This paper summarizes the major trends in the principal markets for African horticultural exports, and discusses the likely impacts of increased competition and changes in trading structures.
The Market for Fruits and Vegetables
Consumption of fruits and vegetables in the OECD countries has been stable or declining over the last few years (Buckley). It has been suggested that the market for fresh fruit in the EU in particular has approached the saturation point (Zolty). While overall consumption of fruit and vegetables appears to have reached a plateau, the value of imports has increased steadily over the last few years, apparently driven by an increased demand for variety and the increased availability of off-season and tropical products.
The overall pattern of changes is consistent with a situation in which consumption increases with income only to a certain point, beyond which quality and variety are substituted for quantity. While total consumption appears to have peaked in the more developed of the OECD countries, it continues to rise in the lower income countries. It seems likely that medium to long term changes in the composition of consumption will work to the advantage of tropical producers relative to those in the temperate zones, as rising incomes lead to an increased demand for variety in consumption.
1

2
For historical and geographical reasons, Western Europe represents the principal export market for African producers of horticultural products. Although the United States is the world's largest single national food market, it is largely self sufficient even with regard to tropical fruit and off-season produce. Most of what it does import comes from within the Western Hemisphere. Imports of tropical fruit have generally come from Latin America and the Caribbean, while the U.S. market for imported produce is dominated by Mexico (F AO). As incomes rise in the countries of Eastern Europe, food consumption patterns may begin to resemble those in Western Europe, as appears to be happening in the former East Germany (Besch). In the absence of colonial links to subSaharan Africa, however, the Mediterranean and Near Eastern countries would seem to be a more likely source ofhorticultural imports.
The 12 members of the EU, taken as a group, represent the principal market for African exporters. The EFT A, which includes six other Western European countries, represent a somewhat smaller, but still important, market. While the member countries of EFT A are similar to the members of the EU in terms ofliving standards, differences between the two blocks affect the trading relations with African countries. The EU has a interventionist approach to trade in agricultural products, and maintains a special relationship with the former colonial possessions and overseas territories of several of its members. EFT A is organized in a much looser fashion, and its members were not colonial powers.
Figure 1. Total EC-10/EFTA Fruit and Vegetable Imports, 1980-1990- Value
$000
15000000
14000000
13000000
12000000
11000000
10000000
9000000
8000000
7000000
6000000
5000000
4000000
3000000
2000000
1000000 '
1980 1985 Year
Source: Adapted from OECD Import Microtables
legend
- EC-10
-- EFTA
I
1990
Figure 1 illustrates the nominal value of gross imports of fresh and processed fruits and vegetables (including quantities which may subsequently have been re-exported) into these two principal trading areas. The label EC-10 refers to the members ofthe EU prior to the admission of

3
Spain and Portugal1, while EFTA represents the current membership of the EFT A2• As can be seen from the graph, the value ofthis trade increased substantially during the 1980s, despite an initial dip due to the increase in the value of the dollar (which resulted in a decrease in the dollar-equivalent value of transactions carried out in other currencies).
Intra-Union trade accounts for much of this volume, although trade statistics overstate its importance because they fail to account for re-exports. The Netherlands in particular have traditionally dominated the European market for imported vegetables (Hinton), but are also the point of entry for exports to other countries, which may also be counted in their exports. The share of intra-Union trade is likely to increase further, as several Union members (e.g. Italy, and the new members Spain and Portugal) have embarked on investment programs aimed at increasing their production capacity. Nevertheless, tropical countries will continue to have an advantage in producing those products (such as tropical fruits) which are poorly adapted to other climates. Investments in productive capacity and technology are also unlikely to completely eliminate the seasonal production patterns which drive the trade in products which can be produced in temperate or tropical areas.
Figure 2. Aggregate EC-10/EFTA Fresh Fruit Imports, 1980-1990- Value
$000
15000000
14000000
13000000
12000000
11000000
10000000
9000000
8000000
7000000
6000000
5000000
4000000
3000000
2000000
1000000
/
/~ /
~/
0~------------------------~ 1980 1985 1990
Year
Source: Adapted from OECD Import Microtables
Fresh Fruits and Vegetables
Legend
- EC-10
-- EFiA
The trade in fresh commodities differs from that in processed commodities in several ways, including storage and shipping requirements. Substantial differences also exist between markets for
1The 10 include Belgium, Denmark, France, Germany, Greece, Ireland, Italy, Luxembourg, the Netherlands, and the Umted Kingdom.
2These include Austria, Finland, Iceland, Norway, Switzerland and Sweden.

4
fresh fruit and fresh vegetables. The export market from vegetables is primarily based on the offseason production of commodities which are also produced in the target markets. Fruit exports are more likely to involve commodities which cannot be produced by the importing countries.
Fresh Fruits Figure 2 illustrates the evolution offresh fruit imports by the EC~lO and EFTA countries, between 1980 and 1990. The pattern is similar to that for aggregate fruit and vegetable imports. The value of imports increased for both trading areas over this time period, despite a dip in the early 1980s. The increase in value is somewhat larger with respect to the countries of the EU. The nominal value of EC~ 10 imports increased by 534 percent between 1980 and 1990, while imports by the EFTA group increased by 432 percent over the same period. Import values for the EFT A did not fall as far in the early 1980s, and did not increase as much in the latter part of the decade.
Table 1. Fresh Fruit Imports by EC-10 Countries- Value ($000)
1970 1975 1980 1985 1990
Belgium/Lux. 83670 211705 435538 351579 728282
Denmark 31957 55946 116425 102031 204784
France 293223 875353 1364924 1209402 2374803
Germany 692898 1330057 2393849 1871219 4240692
Greece 1890 703 2016 3552 61603
Ireland 17009 33674 89375 73075 129050
Italy 68257 140730 357055 404770 834695
Netherlands 99401 288969 639790 552275 1179743
United Kingdom 352520 614323 1377086 1168759 2291993
Total EC-10 1640825 3551460 6776058 5736662 12045645
Source: Adapted from Eurostat NlMEXE Tables
Table 2. Fresh Fruit Imports by EFTA Countries- Value ($000)
1970 1975 1980 1985 1990
Austria 55139 127231 262340 208739 466068
Finland 31136 79703 163473 127406 241743
Iceland 1528 3853 9718 8928 13918
Norway 40197 79323 152300 126477 199106
sweden 90988 155637 285133 234690 471314
Switzerland 93435 194514 377798 300469 584037
Total EFTA 312423 640261 1250762 1006709 1976186
Source: Adapted from Eurostat NIMEXE Tables

5
Figure 3. EC-10 Fresh Fruit Imports, 1980-1990- Value by Region of Origin
$000
5000000
4500000
4000000
3500000
3000000
2500000
2000000
1500000
1000000
500000
0 1970 1975 1980
Year
Source: Adapted from OECD Import Microtables
1985 1990
Legend
D EC-10
• Spain/Portugal
D AFRICA
• L.A./CARIBBEAN
• OTHER
Figure 4. EFTA Fresh Fruit Imports, 1980-1990- Value by Region of Origin
$000
650000
600000
550000
500000
450000
400000
350000
300000
250000
200000
150000
100000
50000
0
j
fi E 1970
.. 1-
L ; ..
1975 1980
Year
Source: Adapted from OECD Import Microtables
~ ~~ !>!
~ •' ~
~;
~ ' ~
' ~. •f -~ ~
1985 1990
Legend
D EC-10
• Spain/Portugal
D AFRICA
L.A./CARIBBEAN
• OTHER

6
Tables 1 and 2 provide a country by country breakdown of fresh fruit imports by the EC-1 0 and EFTA countries, respectively. Among the EC-10 countries, Germany is by far the largest importer, in terms of the volume of imports, accounting for slightly more than 35 percent of the EC-10 total in 1990.1t is followed by France (19.7 percent), the United Kingdom (19 percent) and the Netherlands (9.8 percent). Among the EFTA countries, Switzerland, Sweden, and Austria are the largest importers, although they would rank towards the bottom of a combined list of EC-1 0 and EFTA countries. In 1990, the value ofEFTA imports was only about 16.3 percent ofthe value of EC-10 imports, and Germany, the United Kingdom and France each imported more than all ofthe EFTA countries combined.
Figures 3 and 4 show the region of origin for aggregate fresh fruit imports for the EC-1 0 and EFT A countries. The patterns are fairly similar within the two groupings, with respect to imports from the EC-1 0, Spain and Portugal, Africa, and Latin America and the Caribbean. The primary difference involves imports from "other" regions (primarily North America and Asia), which have declined in the EC-1 0 while growing continuously for the EFT A region. This is due at least in part to the lack of colonial ties on the part of the EFT A countries, and to special arrangements such as the Lome Convention, which promotes trade between the EU and African, Caribbean, and Pacific (ACP) nations3.
Figure 5. Aggregate EC-10/EFTA Fresh Vegetable Imports, 1980-1990- Value
$000
12000000
11000000
10000000
9000000
8000000
7000000
8000000
5000000
4000000
3000000
2.000000
1000000
oL-~----~~--~~~--~~
1980 1985 1990 Year
Source: Adapted from OECD Import Microtables
Legend
- EC-10
-- EFTA
Fresh Vegetables Figure 5 traces the nominal value of imports of fresh vegetables in the EC-1 0 and EFTA countries. Between 1980 and 1990, fresh vegetable imports increased by 596 percent,
30ther, more limited, preferential trading agreements exist with respect to the Maghreb (Morocco, Algeria and Tumsia) and Mashraq (Egypt, Syria and Jordan) countries.

7
in the EC-10 countries, and by 507 percent in t.l}e EFTA countries. Nevertheless, the import market for vegetables is much smaller, in value terms, than that for fresh fruit. For the EC-10 countries, in 1992, the value of trade was slightly over three-quarters of that for fresh fruit. For the EFTA countries the difference was more pronounced, with fresh vegetable imports amounting to just over one-half the value offruit imports.
Table 3. Fresh Vegetable Imports by EC-10 Countries- Value ($000)
1970 1975 1980 1985 1990
Belg1Um/Lux. 64585 180000 424742 303222 969561
Denmark 12998 31539 83909 64407 129518
France 182876 443358 714534 712334 1422283
Germany 490565 954473 1969060 1529066 3182833
Greece 4631 6766 12166 18718 65431
Ireland 6710 14942 68288 68932 132453
Italy 70672 130794 253753 325991 668490
Netherlands 82066 262782 712477 732730 1223931
Un1 ted Kmgdom 244262 432439 796755 719799 1439121
Total EC-10 1159365 2457093 5035684 4475199 9233621
Source: Adapted from Eurostat N!MEXE Tables
Table 4. Fresh Vegetable Imports by EFTA Countries- Value ($000)
1970 1975 1980 1985 1990
Austr1a 19139 56124 103461 89248 210906
Finland 6867 25031 42329 36649 103993
Iceland 724 1543 3244 2572 7172
Norway 8723 24689 45568 32974 71083
Sweden 53905 91739 161139 110392 263204
Switzerland 50829 113468 210480 170584 335554
Total EFTA 140187 312594 566221 442419 991912
Source: Adapted from Eurostat NIMEXE Tables

8
Figure 6. EC-10 Fresh Vegetable Imports, 1980-1990- Value by Region of Origin
$000
7000000
6500000
6000000
5500000
5000000
4500000
4000000
3500000
3000000
2500000
2000000
1500000
1000000
500000
0 1970 1975 1980
Year
Source: Adapted from OECD Import Microtables
1985 1990
Legend
EC-10
• Spain/Portugal
D AFRICA
• L.A./CARIBBEAN
• OTHER
Figure 7. EFTA Fresh Vegetable Imports- Value by Region of Origin
$000
700000
650000
600000
550000
500000
450000
400000
350000
300000
250000
200000
150000
100000
50000
0 1970 1975 1980
Year
Source: Adapted from OECD Import Microtables
1985 1990
Legend
EC-10
• Spain/Portugal
D AFRICA
• L.A./CARIBBEAN
• OTHER

9
Tables 3 and 4 break fresh vegetable imports down by country, for the EC-10 and EFTA groups. Within the EC-10, Germany (34.5 percent), the United Kingdom (15.6 percent), and France (15.4 percent) are the three largest importers, accounting for about two-thirds of imports by that group in 1990. In 1990, the value of EFTA imports was about 9.4 percent of that for the EC-1 0 countries. Switzerland and Sweden together accounted for just over 60 percent of the total value of EFT A imports.
Figures 6 and 7 divide aggregate imports by region of origin for the two trading areas. In both regions, the EC-1 0 is the largest source of fresh vegetable imports. Imports from Spain and Portugal have also exhibited steady growth. Imports from Africa are much smaller and have not grown as quickly. As with fresh fruit, EC-10 fresh vegetable imports from "other" countries have steadily fallen in volume since 1980, while EFTA imports have continue to rise.
Prepared/Preserved Fruits and Vegetables
Processed and preserved products make up a significant portion of the total trade in fruits and vegetables. In some cases (e.g., canned pineapple, french beans and peas), processing is little more than a storage technology. In other cases, preserved products represent a different products (e.g., orange juice and fresh oranges are not interchangeable). Where processing is used as a storage technology, one would expect preserved foods to be staple goods, while off-season imports of fresh fruits and vegetables would be luxury goods. At the same time, because storage reduces the importance of seasonality as a cause for trade, one would also expect the volume of trade to be lower for preserved products than for fresh products.
Although in the aggregate the value of the trade in processed fruits and vegetables is smaller than that for fresh products, the opposite is true for certain commodities. The value of the trade in canned pineapple and juice exceeds that for fresh pineapple, while the values for fresh oranges and juice are roughly equal. The value of the trade in canned and frozen french beans and peas far exceeds that for the fresh variety.

10
Figure 8 Aggregate EC-10/EFTA Preserved Fruit/Juice Imports, 1980-1990- Value
$000
6500000
6000000 "
5500000 I
5000000 -l
4500000 l 4000000 .J
3500000 l 3000000 1
1000000 =jl
500000 -------------0
1980 1985 Year
Source: Adapted from OECD Import M;crotables
/ I
--------
1990
Legend
- EC-10
- EFTA
The share of processed products in overall fruit and vegetable exports has also generally been lower for African countries than for other producing regions. In many cases processing facilities exist, but only serve local demand There are a number of potential explanations for this. African producers may have a comparative advantage only in off-season production, the level of production in individual countries may be too small to support an export industry, or the lack of brand recognition may represent a barrier to entry to foreign markets.
Preserved Fruit and Juice The import market for preserved fruit and juice is much smaller, in value terms, than that for fresh fruit. For the EC-1 0 countries, the value of preserved fruit imports was just 39.8 percent of that of fresh fruit imports in 1990. For the EFTA countries, the value of preserved imports was about 35 percent of that for fresh fruit. Figure 8 traces the movements in the value of imports of preserved fruit products by the EC-1 0 and EFT A countries. The increase in the value of imports of preserved fruit products by the EC-1 0 and EFT A countries was both larger and steadier than that for the fresh products. Between 1980 and 1990 the value of imports by the EC-1 0 countries increased from $524 million to $4.8 billion (an 711 percent increase), while for the EFTA countries the increase was from $80 million to $644 million (a 603 percent increase).

11
Table 5. Preserved Fruit Imports by EC-10 Countries- Value ($000)
1970 1975 1980 1985 1990
Belg1Um/LUX. 23534 68689 153837 146992 327934
Denmark 10715 27655 48201 54902 98802
France 60745 147596 340482 321952 853775
Germany 179265 430568 764299 736918 1741807
Greece 40 434 5166 6014 45642
Ireland 7171 13350 32533 29969 56974
Italy 13875 11176 50813 90977 243353
Netherlands 43182 92096 251509 277827 550148
Umted Kingdom 186954 277078 482651 509700 871492
Total EC-10 525481 1068642 2129491 2175251 4789927
Source: Adapted from Eurostat NIMEXE Tables
Table 6. Preserved Fruit Imports by EFT A Countries - Value ($000)
1970 1975 1980 1985 1990
Austr1a 12972 30122 70163 72210 154722
Finland 5387 16008 45452 33670 88567
Iceland 721 1980 3318 3255 6883
Norway 8973 17265 37607 41293 68223
Sweden 29342 62074 107658 85578 176537
Switzerland 22724 44439 85070 80904 149159
Total EFTA 80119 171888 349268 316910 644091
Source: Adapted from Eurostat NIMEXE Tables
12
Figure 9. EC-10 Processed Fruit Imports, 1980-1990- Value by Region of Origin
$000
1500000
1400000
1300000
1200000
1100000
1000000
900000
800000
700000
600000
500000
400000
300000
200000
100000
0 1970 1975 1980
Year
Source: Adapted from OECD Import Microtables
1985 1990
Legend
EC-10
• Spain/Portugal
D AFRICA
• L.A./CARIBBEAN
• OTHER
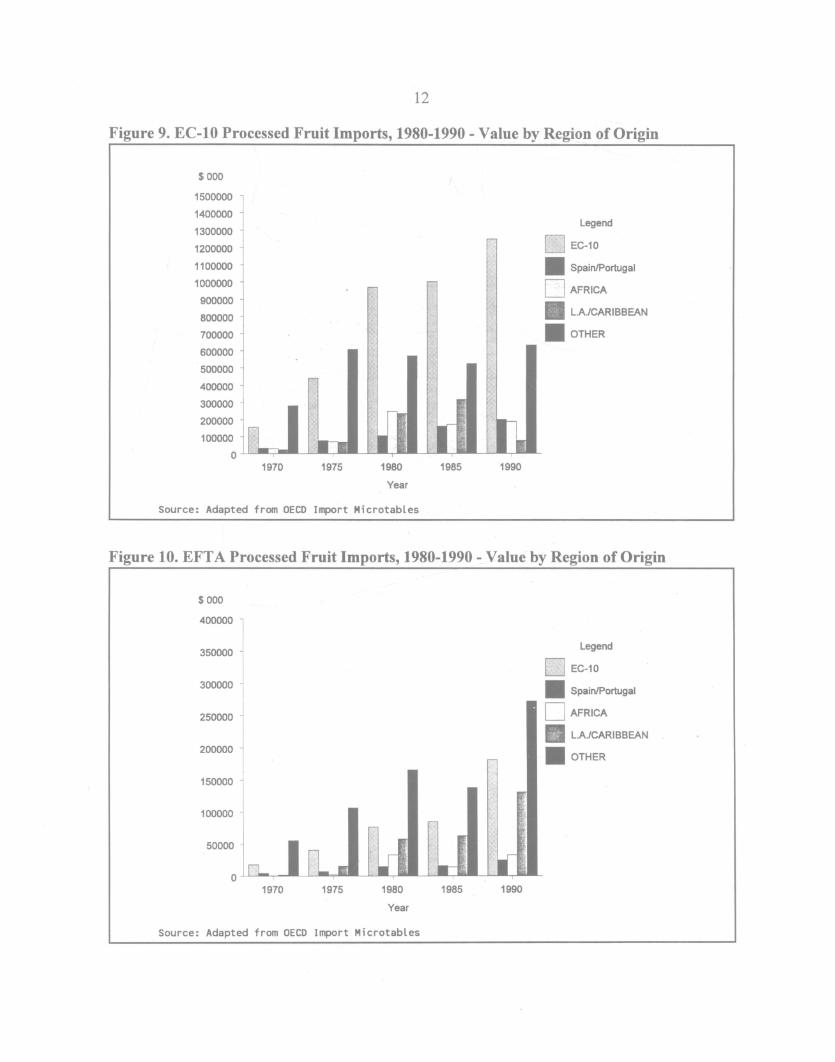
Figure 10. EFTA Processed Fruit Imports, 1980-1990- Value by Region of Origin
$000
400000
350000
300000
250000
200000
150000
100000
50000
0 1970 1975 1980
Year
Source: Adapted from OECD Import Microtables
1985 1990
Legend
~~ EC-10
• Spain/Portugal
D AFRICA
• L.A./CARIBBEAN
• OTHER

13
Tables 5 and 6 break down total EC-1 0 and EFTA imports of processed fruit and juice by country. Among the EC-10 countries, Germany (36.4 percent ofthe 1990 EC-10 total), the United Kingdom (18.2 percent), and France (17.8 percent) are the largest importers. As with fresh imports, S\vitzerland and Sweden were the largest importers \vithin the EFTA zone, although in this case they accounted for slightly less than half the value of EFT A imports.
Figures 9 and 10 divide total imports by region of origin, for both the EC-1 0 and EFT A groupings. The most noticeable difference in the trade patterns of the two groupings is the greater share of Latin American and Caribbean countries, and countries in the "other" classification, in the imports of the EFTA countries. This effect is much more pronounced here than for fresh fruit.
Figure 11. Aggregate EC-10/EFTA Preserved Vegetable Imports, 1980-1990- Value
$000
5500000 -
I 5000000 l 4500000 ~ 4000000 1 3500000 Jl
3000000 ~
2500000 ~ 2000000 i 1500000 1 1000000 ~
500000 j -----------------0
1980 1985 Year
Source: Adapted from OECD Import Microtables
Legend
- EC-10
-- EFTA
1990
Preserved Vegetables As was the case for fruit, the value of preserved vegetable imports is much lower than that of fresh vegetables. In 1990, the value of preserved imports was only 41.2 percent of that for fresh vegetables for the EC-10 countries, and 38.3 percent for the EFTA countries. Figure 11 traces the value of imports of preserved vegetable products by the EC-1 0 and EFTA countries, between 1970 and 1990. Between 1980 and 1990 the value of imports of preserved vegetable products by the EC-1 0 and EFT A countries increased at a greater rate than any of the other commodity groups considered here. The value of imports by the EC-1 0 countries increased from $366 million to $3.8 billion (an increase of 837.6 percent). The value of EFTA imports increased from $43.6 million to $379 million (an increase of669.8 percent).

14
Figure 12. EC-10 Processed Vegetable Imports, 1980-1990- Value by Origin
$000
260000
240000
220000
200000
180000
160000
140000
120000
100000
80000
60000
40000
20000
0 1970 1975 1980
Year
Source: Adapted from DECO Import Microtables
1985 1990
Legend
0 EC-10
• Spain/Portugal
D AFRICA
• LA/CARIBBEAN
• OTHER
Figure 13. EFTA Processed Vegetable Imports, 1980-1990- Value by Origin
$000
4500000
4000000
3500000
3000000
2500000
2000000
1500000
1000000
500000
0 1970 1975 1980
Year
Source: Adapted from DECO Import Microtables
1985 1990
Legend
D EC-10
• Spain/Portugal
D AFRICA
• L.A./CARIBBEAN
• OTHER

15
Tables 7 and 8 shows the value of imports for the individual countries within the EC-1 0 and EFTA, respectively. Once again, the largest importers among the EC-10 countries were Germany, the United Kingdom, and France. Germany accounted for 36.6 percent ofEC-10 imports in 1990, while the United Kingdom and France were responsible for 17.95 percent and 16.8 percent respectively. As with the other commodity groupings, Switzerland and Sweden were the largest importers among the EFTA countries in 1990, accounting for 36 percent and 31.6 percent of total EFTA imports, respectively.
Table 7. Preserved Vegetable Imports by EC-10 Countries- Value ($000)
1970 1975 1980 1985 1990
Belgium/Lux. 19891 71571 127023 104135 276947
Denmark 5035 11809 25326 26100 70865
France 32494 98637 194626 206104 638258
Germany 184976 484259 788084 550769 1394241
Greece 132 319 1404 4010 42400
Ireland 2542 4563 15410 19386 43086
Italy 21026 39277 90108 125799 369516
Netherlands 22512 62047 102064 105863 288824
Um ted K1 ngdom 78309 141798 222850 226889 683392
Total EC-10 366947 914280 1566895 1369055 3807529
Source: Adapted from Eurostat NIMEXE Tables
Table 8. Preserved Vegetable Imports by EFTA Countries - Value ($000)
1970 1975 1980 1985 1990
Austr1a 3775 11737 21966 22485 58298
Finland 1387 3908 6737 8276 25568
Iceland 349 1342 2344 1791 4302
Norway 3137 7537 16695 16528 34431
Sweden 13411 32120 59812 53083 120037
Sw1tzerland 21555 36015 59812 67048 136722
Total EFTA 43614 92659 167366 169211 379358
Source: Adapted from Eurostat NIMEXE Tables
Figures 12 and 13 illustrate the composition, in terms of region of origin, of preserved vegetable imports by the EC-1 0 and EFT A countries. The primary difference in the patterns for the two groups is that Spain and Portugal, and especially "other countries", are much more prominent

16
in the EFTA imports. Africa is a relatively minor source of processed vegetable imports for both trading groups.
The Market Position of African Producers
South Africa and Morocco were the only African countries among the top 15 exporters of fruits and vegetables in 1988 (Buckley). They are also the two African countries with the most diverse set of horticultural export crops, as the Mediterranean climate which they share allows the production of temperate zone and semi-tropical products4• Most other African countries produce a narrower range of horticultural products than these two countries. For reasons of clarity and consistency, the market position of African producers will be examined with regard to a few selected products, which are intended to represent larger categories. In the following discussion, only the EU market (including all current members) is considered.
Position in the Market for Fresh Fruit
The market for fresh fruit can usefully be divided into three sub-markets, as market conditions vary for different categories of fruit. In the market for temperate zone fruit, African countries compete with other off-season producers. In the market for tropical fruit, seasonality within the target market is less important than the production season of other exporters. In the market for citrus fruit, seasonality is less important, but African exporters face competition from within the EU.
Temperate Zone Fruit While a broad variety of temperate zone fruits can be grown in certain regions of Africa (e.g., the Cape region of South Africa), a somewhat smaller number are produced over a larger area. Table 9 shows the value ofEU imports of two commodities within this category, between 1990 and 1992. Melons and strawberries are singled out because they are produced in several different regions, across the continent. Imports of both melons and strawberries increased substantially, in value terms, over the three years covered in the table.
Table 9. EU Imports of Selected Temperate Fruits- Value ($000)
1990 1991 1992 Share of African Principal African Producers (1992) Suppliers
Melons 236266 278024 306140 3.74% South Africa, Morocco Senegal
Strawberries 488099 540704 581232 1.2% Morocco, Kenya
Source: Adapted from Eurostat NIMEXE Tables
Spain, France, Brazil and Israel are the principal suppliers of imported melons to the EU. In 1992, 22 African countries exported melons to Union markets. Nevertheless, although melons are
4Historically this has worked to their advantage, but it may eventually become a disadvantage, to the extent that they compete directly with the recent EU members, Spain, Portugal and Greece.

17
locally important as an export crop, African countries are not a major source for European imports. Competition between European and African producers is likely to be concentrated in late season production, between October and December. Brazil and South Africa (and to a lesser extent Senegal) compete later in the off-season, between January and April (Byskov).
In 1992, 8 African countries exported strawberries to Union markets, led by Morocco which accounted for over 85 percent of the total value of these exports. Imports of strawberries from African countries are concentrated between the beginning of August and the end of May; in 1992 they accounted for about 1.89 percent of the total during this period (as opposed to only 0.3 percent during the rest of that year). Spain, Italy, and the Netherlands are the primary competitors in the export market for strawberries. European producers are beginning to compete with tropical producers in both early and late season, and off-season, markets. Spain doubled its exports of strawberries to the EU between 1985 and 1987, at the same time advancing the timing of deliveries to the extent that they began to compete with off-season producers (Zolty). Imports during the true off-season, between November and February, have not expanded significantly (Byskov).
Table 10. EU Imports of Selected Citrus Fruits- Value ($000)
1990 1991 1992 Share of African Principal African Producers <1992) Suppliers
Oranges 1157324 1141537 1189638 22.1% Morocco, Egypt, South Africa, Zimbabwe
Tangerines 800286 951199 841023 8.19% Morocco, South Africa, Swaziland
Grapefruit 324400 347342 345774 11.9% South Africa, Swaziland, Mozambique
Lemons/Limes 245991 270242 278420 2.0% South Africa, Tunisia, Egypt
Source: Adapted from Eurostat NIMEXE Tables
Table 11. EU Imports of Selected Tropical Fruits- Value ($000)
1990 1991 1992 Share of African Principal African Producers (1992) Suj:lpt i ers
Bananas 2366232 2674326 2880041 7.21% Cote d' Ivoire, Cameroon, Cape Verde
Pineapple 221751 206062 220807 50.76% Cote d'lvoire, Ghana, South Africa
Avocado 199768 190090 198489 27.48% South Africa, Kenya
Mango/Guava 73863 86354 92135 23.69% South Africa, Cote d'Ivoire, Burkina Faso, Mali
Papaya 15223 16752 21418 3.24% Cote d' Ivoi re
Source: Adapted from Eurostat NIMEXE Tables

18
Citrus Fruit In Africa, citrus fruit is produced on a large scale on the Mediterranean coast and in South Africa, Zimbabwe, Mozambique and Swaziland. Small to medium scale producers include Zambia, Kenya, Cote d'Ivoire and Madagascar (Rice, Rice and Tindall). In 1992, 12 African countries exported oranges to EU markets, while 14 countries supplied lemons or limes, 13 furnished grapefruit, and only 5 exported tangerines. Table 10 presents recent EU imports of oranges, tangerines, grapefruit, and lemons and limes, which are the most commonly traded types of citrus fruit. Except for lemons and limes, the value of exports does not appear to follow a clear trend. Certainly the market does not seem to be growing dramatically.
The citrus sector is not an attractive target for an expansion of exports, for several reasons. The market for imports does not appear to be growing. Spain's entry into the EU, and investments in production in that country and in Italy, mean that the Union is likely to become increasingly selfsufficient in citrus products. Efforts by the U.S. to gain access to Union markets for U.S. citrus products (Barnes et al.) are likely to increase the competition within what is left of the import market.
Tropical Fruit Among the export commodities considered here, tropical fruits, along with citrus fruit, are the most "traditional" export crops. Bananas and pineapples in particular have long been important cash crops in several African countries. Table 11 summarizes, in value terms, EU imports of selected tropical fruits, including bananas, pineapples and avocados, and mangos and papayas. It would appear that the best growth possibilities are likely to lie in exotic products. While imports of the more familiar fruits (pineapples and avocados) remained relatively stable, those for the more exotic fruits (mangoes/guavas and papayas) increased substantially over the period covered in the table. Despite the rapid growth over the last few years, per capita consumption is still fairly low, suggesting that there is still room for growth (Kortbech-Olesen 1991).
Britain, France and Spain have traditionally protected banana imports from certain former colonies or overseas possessions from competition from Latin American producers. Other countries, including Germany and the Benelux countries, have allowed free access to all banana imports. The opening of the single European market would have opened all of the Union markets to cheaper bananas, but a pan-Union tariff scheme was devised to continue the protection offered to favored countries and territories (The Economist). African countries such as Cote d'Ivoire and Cameroon have benefitted from protected access, as have some of their principal competitors, including the Canaries (the largest single exporter to Union markets), Madeira, Crete, Martinique and Guadeloupe, and the former British possessions in the Caribbean. It has been argued, however, that the net effect has been to eliminate incentives to increase the efficiency of African producers and the quality of their produce (Naigeon). It seems unlikely that the value of African banana exports will increase substantially in the foreseeable future. In the short term, preferential access is shared with other, larger producers. In the longer term, it is probable that the more efficient Latin American producers will eventually gain greater access to Union markets.
African producers accounted for just over one half ofEU imports of fresh pineapples as of 1992. In that year, 22 African countries furnished fresh pineapples to Union markets, of which the largest exporters were Cote d'Ivoire and Ghana. Historically, Kenya, Nigeria and South Africa have also produced significant quantities of fresh pineapples for export (Rice, Rice and Tindall), but these

19
countries have increasingly concentrated on exporting canned pineapple. Between 1982 and 1986, imports of fresh pineapples into the principal European markets increased in volume by 98 percent, due largely to the increased used of refrigerated sea transport, which is much less expensive than air shipment (Byskov). Cote d'Ivoire, which accounted for nearly 90 percent of African exports in 1992, has begun cutting back on plantings and requiring export licenses in an attempt to control what it sees as an excessive supply of exports, after increasing production and exports during the early 1980s.
In 1992, 15 African countries exported avocados to the EU. In addition to South Africa and Kenya, Cote d'Ivoire, Cameroon, Kenya, Swaziland and Mozambique have traditionally exported significant quantities of avocados (Rice, Rice and Tindall). European imports of avocados follow a seasonal pattern, and are primarily concentrated between October and April (Byskov). Paradoxically, the share of African countries is highest between the beginning of June and the end ofNovember. During this period in 1992, they accounted for 38.9 percent ofEU imports, as against 17.2 percent during the rest of the year. The principal competition for the EU market comes from Israel, Spain, and Mexico. Imports from Israel and Spain are highest between December and the end of March. Mexico competes more directly with African producers, in the June-November period.
The market for mangoes increased rapidly during the 1980s, a trend which is expected to continue. In Africa, Kenya, Madagascar, Mali, Senegal, Congo, Burkina Faso and the countries of southern Africa have been significant exporters of mangoes (Rice, Rice and Tindall). In 1992, 26 African countries exported mangoes to the EU, led by South Africa, Cote d'Ivoire and Burkina Faso. While the absolute level of mango exports from the ACP countries to the EU increased during the 1980s, their share of that market fell from 44 percent to 30 percent between 1982 and 1986 (Zolty). Part of this is due to regional differences in seasonal patterns of production (and thus does not represent direct competition). Another factor is the use of sea transport by Latin American countries, which increases the price competitiveness of their product and avoids the capacity limitations of air transport (ibid).
Brazil is the primary supplier of papayas to EU markets, with an 80 percent share. The remainder is primarily supplied by African countries, typically including Cote d'Ivoire, Burkina Faso, Kenya and Mauritius (F AO). In 1992, only 9 African countries furnished papayas to Union markets, of which Cote d'Ivoire by far the largest producer with 87.2 percent of African exports in 1992. In Africa, papayas have traditionally been grown on an artisanallevel, except in Tanzania, which is a major producer of papain5 (Rice, Rice and Tindall). Exports are generally shipped via air freight, which is seen as a significant constraint to the expansion of the market for that fruit (Byskov). Fruit shipped by sea (as the Brazilian papayas are) would be between 20 and 25 percent less expensive (F AO).
Position in the Market for Fresh Vegetables
The development of exports of fresh vegetables is a relatively recent phenomenon in Africa, being largely dependent on the availability of air transport. Unlike many fruits, vegetables are picked
5 An extract of papayas, used in food processing and other industrial applications.

20
when fully ripe, and lose value if not they are not sold quickly. This rules out surface transport for producers who are not located close to markets for their products. Despite the relatively brief history of this trade, several African countries have well-established export industries. African exporters serve both the mass market for vegetables traditionally consumed in Europe, and ethnic markets serving immigrant communities (e.g., South Asian immigrants in the Urn ted Kingdom, and the North African community in France). Although markets for ethnic vegetables are relatively small, they are important for certain producers. Kenya in particular has been a major supplier of "Asian" vegetables (including okra, chillies, yams and other products) to ethnic commuruties in the United Kingdom (Jaffee). Ethrllc markets can also introduce new commodities to the population as a whole: eggplant, okra and chillies are examples of vegetables which also moved from ethrllc markets into the mainstream.
Table 12. EU Imports of Selected Vegetables - Value ($000)
1990 1991 1992 Share of African Principal African Producers (1992) Suppliers
Tomatoes 1349520 1507943 1474514 8.8% Morocco
Peppers 506766 600991 625528 0.5% Morocco, Egypt, Senegal
New Potatoes 397063 445817 358443 31.8% Egypt, Morocco, Sudan
French Beans 149181 146622 170568 15.5% Kenya, Burkina Faso, Morocco, Senegal
Eggplant 63599 68920 78844 1.6% Morocco, Gambia, Kenya
Peas 35944 49563 48024 27.0% Zimbabwe, Zambia, Morocco
Source: Adapted from Eurostat NIMEXE Tables
Table 12 traces the value of EU imports of selected fresh vegetables, including tomatoes, sweet peppers, new potatoes, french beans, and eggplant, for the years between 1990 and 1992. It is difficult to make any general statement about the overall market for fresh vegetables. The value of imports of eggplant, green peppers and peas increased consistently over the time covered in the table. For tomatoes, new potatoes, and french beans no clear trend is evident. For this reason, markets for each of these commodities are considered separately, and in greater detail, below.
Tomatoes In 1992, 14 African countries exported tomatoes to the EU. Ofthese, Morocco was by far the largest exporter, accounting for a commanding 99 percent of the total in value terms. Trade in fresh tomatoes is very seasonal. In 1992, the African (essentially Moroccan) share ofUruon imports was 14.4 percent for the period between the beginning ofN ovember and mid-May, and only 0.2 percent for the rest of the year.
Green Peppers The EU market for green peppers is quite large, but most of the import requirements (93.6 percent) are met from within the Uruon, primarily from the Netherlands and

21
Spain. The off-season, during which there is no significant European production, is limited to the period between January and April (Byskov). Although 11 African countries exported green peppers to Union markets in 1992, most ofthese exported very small quantities. Among African exporters, Morocco had by far the largest share at 88.3 percent of total African exports, with Egypt some ways behind at 8.8 percent. The sub-Saharan African countries taken as a group accounted for about 2.9 percent.
New Potatoes The import market for new potatoes is strongly seasonal. In 1992. African producers accounted for nearly 50 percent of European imports between the beginning of June and mid-May, and only 0.4 percent during the remainder of the year. Production is concentrated in the North African countries, with Morocco and Egypt accounting for most of the total. Of the seven African countries exporting new potatoes in 1992 only Ghana, which is by far the smallest exporter, is from outside of North Africa.
French Beans French beans are the vegetable commodity exported by the largest number of African countries, with 24 countries having exported them to EU markets in 1992. Among African producers, Kenya is by some distance the largest single exporter, accounting for 47.6 percent of African exports in 1992. African exporters concentrate on off-season production. In 1992, over 97 percent of exports to the EU came between the beginning of October and the end of June, during which time African countries held a 47.5 percent market share. In the past the EU has discouraged imports during the local production season, to the point of refusing entry to a shipment of beans and tomatoes from Kenya in 1977 (Naigeon). Increasing labor costs in Europe may eventually allow for the year-round importation of fine and extra-fine beans, which are particularly labor intensive (Byskov).
Eggplant The import market for eggplant within the EU countries is increasingly dominated by intra-Union trade, which increased from 89.5 percent of total imports in 1990 to 94.5 percent in 1992. Morocco, Kenya and The Gambia account for the bulk of African exports to the EU. In 1990 and 1991, exports by the three countries were about the same, but in 1992 exports from The Gambia increased sharply while those from the other two countries fell.
Green Peas The seasonal variation in the European import market for peas is less than for french beans. In 1992, about 60 percent of total Union imports occurred in the period between the beginning of September and the end of May. The share of African exporters was roughly equal in the two time periods. Thirteen African countries exported peas in 1992. Moroccan, Kenyan and Nigerian exports were concentrated between May and September. Producers in southern Africa, led by Zimbabwe and Zambia produce roughly equal amounts in both seasons.
Position in the Market for Preserved Fruit and Juice
Preserved fruit products are traded in several different forms, which can be grouped into three basic categories. These include consumer packages of fruit or juice, juice concentrates, and frozen or canned fruit and pieces. Consumer packages are, by definition, fully processed prior to export.

22
Concentrates and preserved fruit pieces are semi-processed products, which will typically be repackaged for sale to consumers (in the case of juice concentrates), or incorporated into yogurt, ice cream or other confections (for fruit pieces and puree). The type of processing and packaging is an important factor in the market price of these commodities, as are quality and the source of supply. Markets are very competitive, and prices change frequently (Kortbech-Olesen, 1990).
Canned fruits and juices prepared in Africa are generally intended for sale in local or regional markets, rather than for export (Zolty). The weight of packaging and the water content of juices make consumer packages more expensive to ship than the semi-processed products. Health regulations, packaging costs, and the importance of brand recognition and reputation also represent barriers to entry into this market (Kortbech-Olesen, 1990). The primary exceptions are the fruit canning industry in South Africa, which exports about 85 per cent of production, of which about half goes to the EC (Flowers), and the pineapple canning industry in Kenya and other countries.
Pineapple products, including canned fruit and juice, are the preserved fruit products most commonly exported in the form of consumer packages. Exports of fresh fruit represent a relatively small proportion of the overall market for pineapples. Figure 14 illustrates the division between fresh and preserved fruit, and juice, in EU imports from countries in Africa, Latin American and the Caribbean, and other countries. African and Latin America/Caribbean producers appear to compete primarily in the market for fresh pineapple.
Fruit juice is the most commonly traded semi-processed fruit commodity. Most of this trade involves bulk shipments, primarily in the form of juice concentrates. Orange juice is typically shipped in the form of frozen concentrate, either in drums or in specially equipped tankers. Tropical fruit pulp and puree are often shipped in smaller packages, such as cans or aseptic packages. As of 1989, orange juice accounted for about 56 percent of the total value of the world trade in fruit juices (Kortbech-Olesen, 1991 ). Other citrus juices accounted for about 7 percent of the value of trade, while the share of pineapple juice was about 5 percent. Other tropical fruit juices, including banana, passion fruit and mango, together had about a 4 percent share. Morocco is the largest African exporter of fruit juice, primarily orange juice. Kenya is among the five largest producers of pineapple juice, and is one the largest producers of passion fruit juice. Cote d'Ivoire and Mali are significant exporters of mango pulp (Kortbech-Olesen, 1990).
Fruit juice concentrate or pulp can be reconstituted into juice or juice products, or used as a flavoring for yogurt or other confections. Other fruit products, such as preserved fruit pieces, are almost exclusively used in the preparation of confections. Taken together, the use of these products in the preparation of yogurt and ice cream accounts for about 30 percent of the total market for processed fruit products (Kortbech~Olesen, 1990). Certain fruits, of which passion fruit is the best example, are primarily traded in the form of juice, pulp or preserved pieces. Others, such as mangos, are traded in both fresh and preserved form. The markets for individual tropical fruit other than citrus or pineapples are relatively small, and disaggregated trade statistics are not kept.

23
Figure 14. Exports of Pineapple Products- Composition by Region- 1990
$000
200000
180000
160000
140000
120000
100000
80000
60000
40000
20000
0 Africa LA/Carib.
Source: Adapted from OECD Import Microtables
ROW
Legend
D Fresh
I Preserved
D Juice
Figure 15 Exports of Orange Products - Composition by Region - 1990
$000
750000
700000
650000
600000
550000
500000
450000
400000
350000
300000
250000
200000
150000
100000
50000
0 EC-10
Source: Adapted from OECD Import Microtables
Legend
0 Fresh Oranges
I Orange Juice

24
F1gure 15 illustrates the composition, in value terms, of exports of fresh oranges and orange juice by the producers of different regions. African producers of citrus lag behind producers in the EC-1 0 and in Latin America in the value share of JUice in their exports. In Latin America, Brazil is a very large exporter of frozen orange juice concentrate. The EU has also promoted citrus processing, which has led to an increase in output from Italy, largely intended for export (FAO).
Position in the Market for Preserved Vegetables
Despite the relatively small size of the market for preserved vegetables, the organization charged with promoting trade in tropical fruits and vegetables between the EU and the ACP countries (under the Lome Convention) has identified several types of processed vegetable products for which the possibility for increased trade exists. These include canned and frozen french beans, canned asparagus, dried onions, pickled cucumbers, and canned sweet com (Naigeon).
African countries already export significant quantities of all of these products. In 1992, five African countries exported canned french beans worth more than $11.67 million to the EU, led by Morocco and Kenya which had exports worth about $5.5 million and $5.2 million, respectively. Six countries exported frozen french beans with a total value of about $13.6 million, led by Morocco with about $11.46 million of exports and Cameroon with about $1.28 million. Among the products which are less widely produced, South Africa and Lesotho exported canned asparagus worth about $2.36 million and $1.52 million, respectively, in 1992. Egypt (about 4000 MT annually) and Sudan (about 400 MT) regularly export significant amounts of dehydrated onions, while Morocco exports between 10,000 and 12,000 MT of pickles annually (Zolty).
A more revealing measure ofthe significance of processed exports is their share in the value of total exports of a given commodity. Comparison of the composition of exports from different sources is particularly interesting. Figures 16 and 17 illustrate the share of fresh, frozen and preserved beans and peas, respectively, in EU imports from member countries, and from Africa, Latin America and the Caribbean, and the rest of the world. These commodities were chosen because the total volume of exports are large, and because they are frequently traded in fresh, canned and frozen form.
The principal similarity between the patterns for the two commodities is that the share of preserved products in the value of EU exports far exceeds that of the fresh vegetables, while their share in the exports of other groupings is generally much smaller. This is as would be expected, given that preserved products are nor subject to the seasonality which drives the trade in fresh vegetables. The value share of African exporters is larger with respect to french beans, for all three types of product. In 1992, canned and frozen peas were each exported only by a single African country or territory. Zambia was the only exporter for frozen peas, while Reunion was the only exporter of canned peas.

25
Figure 16. Exports of French Beans- Composition by Region- 1990
($000)
100000
90000
80000
70000
60000
50000
40000
30000 17""
20000
10000
o"-European Umon
D Afnca LA!Canbbean
Source: Adapted from OECD Import Hicrotables
'---
ROW
Legend
0 Fresh
• Frozen
0 Preserved
Figure 17. Exports of Green Peas- Composition by Region- 1990
($000)
240000
220000 Legend
200000 0 Fresh
180000 • Frozen
160000 0 Preserved
140000
120000
100000
80000
European Umon Afrx:a LA!Canbbean ROW
Source: Adapted from OECD Import Hicrotables

26
Special Trading Arrangements
Most African countries, either individually or as part of a larger group, enjoy special trading arrangements with the EU, which provide for preferential access to Union markets for most categories of exports. The actual effect of these arrangements is limited where fruit and vegetable exports are concerned. Certain agricultural products which compete with Union production are subject to quantitative restrictions and duties. Because the same level of access is also extended to some of their major competitors, African producers of tropical products enjoy preferential access only with respect to those countries which are not included (e.g., Latin American and North American countries).
European Union/Sub-Saharan Africa
Since 1975 the sub-Saharan African countries (with the exception of South Africa) have had preferential access to EU markets under a comprehensive agreement between the EU and a group of African, Caribbean and Pacific countries (the ACP group), known as the Lome Convention6 •
Under the trade provisions of this agreement (which includes both trade and aid provisions), exports from the ACP countries to the EU are not to be subject to either duties or quantitative restrictions. The principal of duty and quota free access is not applied to products which are part of the Union's Common Agricultural Policy. This exclusion has at times had a negative impact on non-traditional exports, such as Senegalese tomatoes and Kenyan strawberries (Ravenhill). As part of Lome IV, duties are to be reduced and quantity controls relaxed on off-season exports of fruits and vegetables from the ACP countries (Russell). This will liberalize that portion ofthe trade in fruit and vegetables which does not compete directly with Union production.
The STABEX program, which is a part of the Lome Convention structure, was set up to compensate ACP countries for losses in revenues caused by declines in either the price or production of traditional agricultural exports. Several of the commodities considered here come under the ST ABEX system, including fresh and dried bananas, mangos, peas and beans, and cashew nuts and coconuts. The trade in bananas and beans in particular has resulted in substantial transfers from the Union to the ACP countries (STABEX).
European Union/North Africa
Until recently, the countries of the Maghreb and Mashraq areas have had preferential access to European markets under parallel agreements between each of the countries and the EU, which were concluded between 1976 and 1979. These agreements provided for free access for industrial products, and tariff concessions for agricultural exports (Camier). The Maghreb countries received
6This actually a series of agreements, having been renegotiated and renewed in 1979, 1984, and 1989. The most recent version, Lome IV, is to be in effect from 1990 through 2000.

27
concessions of between 20 and 100 per cent of duties on fresh and dried vegetables and fruit, while the Mashraq countries received concessions of between 40 and 80 per cent on the same type of products (Barnes et al.).
The entry of Spain and Portugal into the EU has forced changes in these arrangements. During a transitional period which extends through 1996, customs duties are to be phased out for most imports from both Spain and Portugal and the Maghreb countries, within quotas based on an average of exports over the period 1980-1984. The effect of these changes on the trade in fresh fruits and vegetables is not clear. The quota procedures effectively exclude products which have only recently been developed as export crops. In addition, several important commodities, including oranges, lemons, small citrus fruit, tomatoes and table grapes, are subject to special provisions (Camier).
Investment Patterns and Competition
African producers are not acting in isolation as they attempt to use exports of fruit and vegetables to increase and diversify their sources of foreign exchange earnings. They face competition from producers within the EU, as well as from other current and prospective exporters to that market, including other African countries. The enlargement of the EU, and changes in Union and international trade regimes, will further heighten the competition as the different parties attempt to position themselves to benefit from these changes.
Regional Patterns in Africa
Among the African exporters of fruit and vegetable products, three broad regional patterns can be identified. The nature of the export industry, and investment prospects, vary between the countries of North Africa, South Africa, and the rest of Sub-Saharan Africa.
North Africa Both fruit and vegetable production are the focus of large investment programs in the Maghreb and Mashraq countries (Barnes et al.), which have primarily been financed through multilateral financial institutions. In the Maghreb a considerable portion of the expansion in production is aimed at meeting local demand, but demand seems unlikely to rise enough to absorb the additional production at which the investment programs are aimed (Barnes, et al.). These countries have had preferential access to European markets, but the enlargement of the EU will tend to work against an expansion of exports to European markets. At the same time, markets in the Middle East oil producing countries have been hurt by the Gulf war, and by a generalized economic downturn.
South Africa South Africa is the second largest exporter of fruit in the Southern hemisphere, behind only Chile (Flowers). Exports of deciduous fruit and grapes from the Cape region account for about 40 per cent of the total earnings from agricultural exports. The EU never applied sanctions against South African agricultural products. Sanctions imposed by the U.S. resulted in a loss of market share to Chile, but South Africa was able to develop alternative markets in the Middle East

28
and Japan (Flowers). It remains to be seen to what extent South Africa will, with the end of economic sanctions, be able to expand its exports of fruits and vegetables. Since the process of political liberalization began, it has increased its exports of certain products, such as frozen french beans. Nevertheless, it seems unlikely that there will be substantial investment in the agricultural sector in the near future, due to concerns about the possibility of land reform.
Other Sub-Saharan Africa ¥/bile the countries of the Near East and North Africa have invested heavily in the diversification of their commercial horticultural production, the Sub-Saharan African countries have tended to compete with each other in exporting french beans (Zolty). Many countries produce other products, but the value of exports tends to vary widely from year to year. Investment programs aimed at expanding and diversifying agricultural exports have occurred in a number of Sub-Saharan African countries, most commonly in association with a package of economic reforms. A typical scenario involves an attempt to reduce the level of dependence on a single export crop, such as coffee. Fruit and vegetable exports are often targeted for expansion, through investments in infrastructure (e.g., cold storage facilities) or in improving the efficiency of production, or in special export promotion programs.
In most cases, relatively little attention is paid to diversification within the fruit and vegetable sub-sector. The primary exception to this pattern involves countries with established horticultural export industries. In these countries, recent investments in diversification have typically involved the development of processing facilities and new crops. The countries of southern Africa represent a special case, due in large part to the presence of South Africa (and, to a more limited extent, Zimbabwe). Lesotho and Swaziland have developed their agricultural export industries in part based on the investment funds and infrastructure available as a result of their proximity to South Africa. Concerns about possible land reform in South Africa and Zimbabwe, combined with economic reforms, have contributed to increased investments in the agricultural export sectors in Mozambique and Zambia (both of which have provided special incentives to attract South African and Zimbabwean farmers and investment).
Competition from Latin America and the Caribbean
Since 1970, the value of EU imports of fresh fruit from the Latin American and Caribbean countries has steadily increased, although their share of the market for processed fruit products fell sharply between 1985 and 1990. Their share in imports of both fresh and preserved vegetables is small, although it has increased substantially in recent years.
As mentioned above, the Caribbean nations enjoy the same sort of preferential access to EU markets, under the Lome Convention, as the sub-Saharan African countries. Tropical products of European possessions (e.g. Guadeloupe and Martinique) also benefit from special arrangements with respect to their home countries. Reference prices for commodities such as bananas are often set based on the cost structure of these overseas possessions, which typically have higher costs, particularly with regard to labor, than other producing regions. This allows other producers with preferential access to Union markets to earn rents based on this access. The problem with this is that it reduces the incentives to increase the efficiency of production (Naigeon).

29
For the countries of Central and South America access to Union markets is limited bv the fact that their exports do not enjoy any special status, beyond GSP tariff rates, and are in so~e cases subject to special restrictions. Comparing the origin of the imports of the EC-1 0 and EFT A countries, it appears that the primary result has been to reduce exports of preserved fruit products, particularly since 1985 (see figures 9 and 10). The expectation is that movement towards integration within the EU will make markets more competitive. Banana producers in particular are reported to be increasing the area under cultivation, and investing in transportation and packaging (Waniala).
Conditions in the European Union
Both fruit and vegetable production are the focus oflarge investment programs in the EU. This has primarily involved private investment, including significant cross-border flows between the north and the south of the Union (Barnes et al.). Although investments have been made in Italy and Greece, Spain is probably the largest threat to the fruit and vegetable exports of the Maghreb countries. During the transition to full Union membership, Spain and Portugal have not had the same level of concessions as non-member Mediterranean countries (Hinton). Despite this disadvantage, Spain was able to increase its share in total EU imports of fresh and preserved fruit, and fresh vegetables, between 1980 and 1990.
Any changes in the production support and surplus removal mechanisms of the EU could dramatically change the competitive position of the member countries, particularly in the production of fresh vegetables and temperate fruit (Buckley). This would work to the advantage of those countries, such as Morocco and South Africa, which could then increase their exports of early and late season vegetables, and temperate fruit.
Other Issues
Advances in shipping and storage technologies have expanded the possibility for trade in both seasonal and tropical fruits and vegetables. Many African countries enjoy growing conditions favorable for the production of one or more of these crops, and most enjoy preferential access to EU markets. Nevertheless, there are several factors which limit the ability of African producers to participate efficiently in these markets.
Geographical factors play an important role in shaping trade patterns, especially for the most perishable products. Access to port facilities or direct air links, the distance between producing regions and sea and air port facilities, and the availability and nature of internal transportation and storage facilities, are all important in determining what products can be exported by a given country.
The existence ofthe services (such as specialized transportation and storage facilities) required to channel commodities from producers to final markets is also an important factor. These specialized services can only be provided when the level of production achieves the critical mass necessary to sustain them. Where producers are very large, or where groups of smallholders are well organized, they may be able to carry out many of these functions themselves. This is not likely to be the case in a developing industry, which must rely on services already available from outside firms.

30
The size of production units, or the degree of coordination between smaller units, can affect the ability to produce marketable quantities of a homogenous product of consistent quality. Local conditions, such as land tenure arrangements and the available production technology, influence the size of production units. Growers' associations or outgrowing contracts can help to coordinate production activities and facilitate the use of more efficient technologies.
Transportation
Most fresh vegetables have a limited shelflife, so that air shipment is required. Some fruits, such as pineapples, bananas, and citrus fruit, can withstand relatively rough handling and longer shipping times, and thus have traditionally been shipped by sea. The same is true of preserved fruit and vegetable products. Other commodities, such as mangos, avocados and papayas, require more delicate handling, but are increasingly being shipped by ocean freight using refrigerated containers.
Maritime Shipping Maritime shipping is much less expensive than air freight, and the availability of (relatively cheaper) refrigerated sea transport is credited as being an important factor in the level of imports of pineapples and avocadoes by the countries of the EU (Byskov). As a result, exporters of products for which the use of sea freight is practicable will probably have increase their use of maritime shipping, in order to remain competitive (Zolty).
Currently, several commodities which Latin American producers ship by sea are shipped by air by African producers. This makes sense for exports of mangoes from Mali or Burkina Faso. It is more difficult to understand for Kenyan exports of avocados and papayas. Some African exporters have argued against the use of sea freight, on the grounds that the increase in volume of shipments which would likely follow from a decrease in shipping costs and the consolidation of shipments would tend to increase competition and reduce the selling price. Given the competition already presented by cheaper exports using ocean transport, this argument seems somewhat disingenuous.
Air freight Certain products, such as fresh french beans, have a limited shelf life and must be shipped via air freight. In some cases the loss of value from a twelve hour delay can be as high as 50 to 60 percent (Robertson). Land-locked producers are often forced to use air freight even for commodities which could be safely shipped by surface, due to a lack of appropriate and cost-effective surface transport.
Air transport itself is smooth and fast, but cargo handling and airport storage facilities can create problems. Standard containers used for air freight are not particularly well adapted to horticultural cargoes. Mixed consignments, as often occur with small shipments, can result in an inefficient use of the available space, and in delays in cargo handling on arrival. This tends to increase costs, and the risk of a decline in the value of the commodities being shipped (ITC). Although the bulk of the volume of air freight traffic between Europe and North America and Africa has tended to move from North to South, certain observers claim that the availability of transport space is a serious constraint. It is argued that the reduced levels of freight traffic have led to an increased reliance on passenger aircraft as opposed to dedicated freight planes, resulting in reduced capacity (Zolty).

31
lnfrastructural Needs
Internal Transport Transport from the area of production to the point of embarkation can be as important as the leg between there and final markets, in terms both of cost and maintaining the value of the commodities. The limited development of internal transportation networks in many African countries tends to limit the area from which fresh commodities can be brought together for export. Long distance road transportation of many products requires the use of temperaturecontrolled vehicles, which may not be available, or shipment at night to take advantage of cooler temperatures, which may not always be feasible. The vibration involved in road transport can also place special demands on packaging materials (ITC). Poor roads increase the cost of transport directly through higher freight charges, while bumpy roads and slow travel times reduce the value of the commodities.
Storage Facilities The availability of suitable storage facilities is important, because transportation is an inherently "lumpy" process at both the internal and international levels. At the farm level, commodities must be accumulated until the quantity is large enough to be economically transported to a collection point for international shipment. There, the commodities are held at until the next departure of a ship or cargo plane.
Most fruit and vegetable commodities must be stored under appropriate conditions, if they are not to suffer a decline in quality and value. For fresh or frozen commodities the availability of cold storage facilities at the point where commodities are accumulated for overseas shipments would be important regardless of the length of time the commodities must be held. Refrigerated holds are able to maintain goods at a given temperature, but are not suitable for cooling products which are not already at the desired temperature (ITC).
Communication and Services The availability of specialized services, including freight forwarders and the distribution chain, can be a limiting factor in developing horticultural exports (Robertson). Delays or improper handling at any point can greatly reduce the value of the commodities. Communications services, including online market information systems, are also important in some cases (Barnes et al.). For example, Kenya's Horticultural Crops Development Authority has, since the 1970s, run a telex service intended to keep growers informed about market conditions and to assure the most efficient use of scarce air cargo space (Goertz).
Product Quality and Homogeneity
Grading and quality control (including health regulations) have become an increasingly important element in competition in the export markets for fruits and vegetables, and can represent significant non-tariff barriers. There have been reports that particularly difficult specifications have been used by the EU to reject produce from the Maghreb countries and Egypt (Barnes et al.). Product homogeneity and conformity with consumer tastes and manufacturing requirements are also important issues. In many African countries, the lack of large scale fruit orchards has been a barrier to increased exports of fruit and fruit products (Zolty), because of difficulties in providing a product of predictable and uniform quality. Consumer preferences can vary across markets with regard to the

32
color and shape of various commodities, so that a variety which is appropriate in one market might not sell as well in another. Varieties which sell well in fresh form may not be appropriate for processmg.
Conclusions and Policy Implications
Increased investment, and institutional changes in the EU and the GATT, are likely to further increase the level of competition in the market for fruit and vegetable exports. Most African producers are not in a position to develop new markets for mass consumption commodities. Markets for these commodities are in general approaching saturation, so that increasing efficiency and cutting costs are likely to be more important than expanding production. As a result, incumbent producers will have to pursue increased efficiency if they are to retain their position in the market, while new entrants will succeed only if they are able to deliver their products at lower cost than the incumbents. Most new producers would do better to concentrate on niche markets, defined in terms of the products produced or the season in which they are brought to market.
Established Producers and Commodities
For countries with existing export industries, an appropriate approach would probably involve investments in improved efficiency, such as improvements in the infrastructure for bringing products to the point of embarkation and for storing them prior to shipment. In some cases elements of cost which are beyond the control of the exporting country, such as a lack of access to maritime shipping, could undermine the long -term viability of a given export industry. This could put existing producers in the position of having to develop new exports or markets. Vertical integration through investments in processing activities may or may not be appropriate. For certain products, such as canned and frozen vegetables, processing is less a source of value-added than a storage technology. In other cases (e.g., oranges grown for juice) processing is an integral step in producing the exportable commodity. In the former case, the costs of processing must be balanced against the increased revenue which can be earned during the local off-season. In the other case, the processing decision is essentially contemporaneous with the decision to produce the original crop.
Development of New Markets
Countries trying to develop new export products must try to identify niche markets which they can address, based on climate, seasonality or cost factors. At early stages investments should focus on infrastructure (e.g, internal transportation) which could promote the efficiency of a wide variety of activities. Outside investment (e.g., in the form of out-growing contracts) can be useful organizing production and providing access to markets for mass consumption commodities. Ethnic markets can provide an entry for new or unusual fruit and vegetable products, and are able to handle smaller lots of commodities. These markets typically serve immigrant populations, but also attract individuals interested in trying new products. Products which were initially imported to meet the demand of immigrant populations and which have begun to find a larger market include eggplant and okra, and tropical fruits such as mangoes and papaya.

References
"Banana Split." The Economzst, March 20th, 1993.
Barnes, Colin, Graham Edgeley and Peter Bruss. "Fruit and Vegetable Export Marketing: the Impending Crisis." Food Marketing 3 (1987):40-60.
Besch, M. "Agricultural Marketing in Germany.", Food and Agribusiness Marketing in Europe, ed. Matthew Meulenberg, pp. 5-35, New York: International Business Press, 1994.
Brown, Jim. "Chiquita Power-Line Net Monitors Bananas", Network World 10(1990):13-14.
Buckley, Katherine C. The World market in Fresh Fruit and Vegetables, Wine and Tropical Beverages - Government Intervention and Multilateral Policy Reform. Washington, DC:U.S. Department of Agriculture, Staff Report No. AGES 9057, September 1990.
Byskov, Bertil. "Exotic fruits and vegetables strengthen their position in European markets." International Trade Forum 1, (1988):4-7.
Camier, Alice. "The Countries of the Greater Arab Maghreb and the European Community." Europe Information, DE 68, January 1991.
Dayton, James R. "Description of U.N. D-Series Trade Data." Paper presented at NC-194 technical committee meeting, Washington, DC, 16-17 November 1990.
Food and Agricultural Organization, Commodities and Trade Division. The World Market for Tropical Horticultural Products. FAO Economic and Social Development Paper 76, Rome, 1988.
Flowers, K.K. "Eyeing the competition: South Africa's deciduous fruit exports." AgExporter 9(1992):24-26.
Goertz, Janice. "Hot Line to the Market." International Trade Forum 1(1980):8-11, 19-25.
Hinton, Lynn. "Enlargement of the European Economic Community in the Fruit and Vegetable Sectors." Food Marketing 2(1986):3-13.
Jaffee, Steven M. "Exporting High-Value Food Commodities: Success Stories from Developing Countries." Washington, D.C: The World Bank, Discussion Paper 198, 1993.
ITC. "Export Packages: What is Required for Fresh Fruits and Vegetables." International Trade Forum 3(1988):14-19, 32.
33

34
Kortbech-Olesen, Rudy. "Rising Demand for Tropical Fruit Juices and Pulp." International Trade Forum 4(1990):12-17.
________ . "Spectacular Growth in Major Markets for Fruit Juices." International Trade Forum 3(1991):4-9, 34.
"Les possibilites d'industrialisation des fruits tropicaux." Industries et Travaux d'Outremer, May 1975, pp. 400-412.
Naigeon, Christophe. "Fruits tropicaux, legumes de contre-saison." Afrique-Agriculture, September 1978.
Ravenhill, John. "Europe and Africa: An Essential Continuity." Europe, Africa and Lome III, eds. Robert Boardman, Timothy M. Shaw and Panayotis Soldatos, pp. 35-37 New York: University Press of America, 1985.
Rice, Robert P, Laura Williams Rice, and H. D. Tindall. Fruit and vegetable production in Africa, Basingstoke:Macmillan, 1986.
Robertson, Drew. "Shipping Special Commodities." Air Cargo World 4(1991):12-14.
Russell, Jeffrey. "Lome IV 1990-2000: Background, Innovations, Improvements." Europe Information, DE 64, March 1990.
"STABEX." Europe Information, DE 59, May 1988.
Zolty, Alain. "Fruits et legumes frais de contre-saison: la diversification des cultures, des produits et des marches." Marches Tropicaux et Mediterraneens,l3(1987):3027-30.

35
Appendix - Data Sources
Data from several different sources were used in the preparation of this paper. All of the tables and graphs were assembled based on import data, in value terms, as reported by the receiving countries. Import data from developed country markets would normally be expected to be more complete than export data from LDC trading partners. Value was used as the measure of trade because, while trade data is recorded in terms of both weight and value, the data set for value is often more complete. It is also a composite measure, incorporating both the physical volume of trade and price information7•
Some double counting occurs in all of the data sets. As an example, the Netherlands appears as one of the principal sources of imports of several tropical fruits, due to the re-export or transshipment of commodities originating in other locations. As a result, the share of member countries in the total trade of the EU is likely to be overstated. It also makes it more difficult to trace trade linkages between individual countries or groups of countries. It does not affect the export figures for producer countries outside of these groupings.
United Nations Series D Commodity Trade Statistics
United Nation D Series trade data cover the import and export transactions of all countries reporting to the U.N. Statistical Office. The value oftransactions are converted to U.S. dollars on a monthly basis, using the IMF parity rate for that month. Several countries, including Germany and Japan, report trade transactions in terms of dollars, so that no conversion is required. The use of an "official" exchange rate is unlikely to introduce distortions, as long as the same rate is used in accounting for all trade transactions.
The data set is available on magnetic tape and in a more aggregate paper form. Commodities are categorized using the SITC (Standard International Trade Classification) system, which has undergone several revisions over the years. The database used for this paper was adapted from the magnetic tapes by the NC-194 core group at Ohio State University, and is based on revision 1 of SITC to maintain consistency (Dayton). It was primarily used in examining the trade patterns of individual countries.
OECD Series C Trade Statistics and OECD Microtables
The OECD Series C Trade Statistics and OECD Microtables include the imports and exports of all the OECD member countries, using the SITC classification scheme. The value of the
'Most countries (the primary exceptions are the U.S., Canada and Australia) report import values on a Cost, Insurance and Freight (CIF) basis. Value is thus a better measure of the cost to importers than of the earnings of exporters

36
transactions are expressed in terms of dollars. As with the United Nations data, IMF parity rates are used to convert local currency values to dollars.
The Microtables (on microfiche) present statistics disaggregated to the 5 digit level (out of maximum of 10 digits in the SITC system). The printed form includes only more aggregate categories (at 3 digit level). The OECD statistics tend to group the smaller exporters from a given region together, designating them simply as "other". At times the value of the "other Africa" category is larger than the exports of any single African exporter.
Eurostat NIMEXE Import Tables
The Eurostat NIMEXE Import Tables (in microfiche form) cover only the trade transactions of the member countries of the EU. The NIMEXE classification scheme used in these tables is different from the SITC system used in the other data series8• It provides a more disaggregated listing of commodities, including a seasonal breakdown of imports for some products.
Value figures are reported in European Currency Units (ECU) rather than dollars. For the purposes of this paper, the dollar-equivalent value of the ECU was estimated by dividing the dollar value ofEU imports of oranges by the ECU value. Some distortion is inevitable in the two levels of currency conversion, from the national currency to ECU s, and then to dollars, but it is not clear that there is any bias.
8Eurostat also publishes a series of tables based on the SITC system. Comparison of the quantities reported trade within the same SITC group are consistent across the three data sets.