![Throne Room Throne Room [A, 64 bpm, 4/4] - jc … Room. A A... Throne Room... Throne Room. B... Throne Room... Throne Room..... ...](https://static.fdocuments.us/doc/165x107/5aa470f67f8b9a1d728bdf0c/throne-room-throne-room-a-64-bpm-44-jc-room-a-a-throne-room-throne.jpg)
Marketing War Room™ - cval. · PDF fileCustomer Value, Inc. 217 Lewis Wharf, Boston, MA...
6
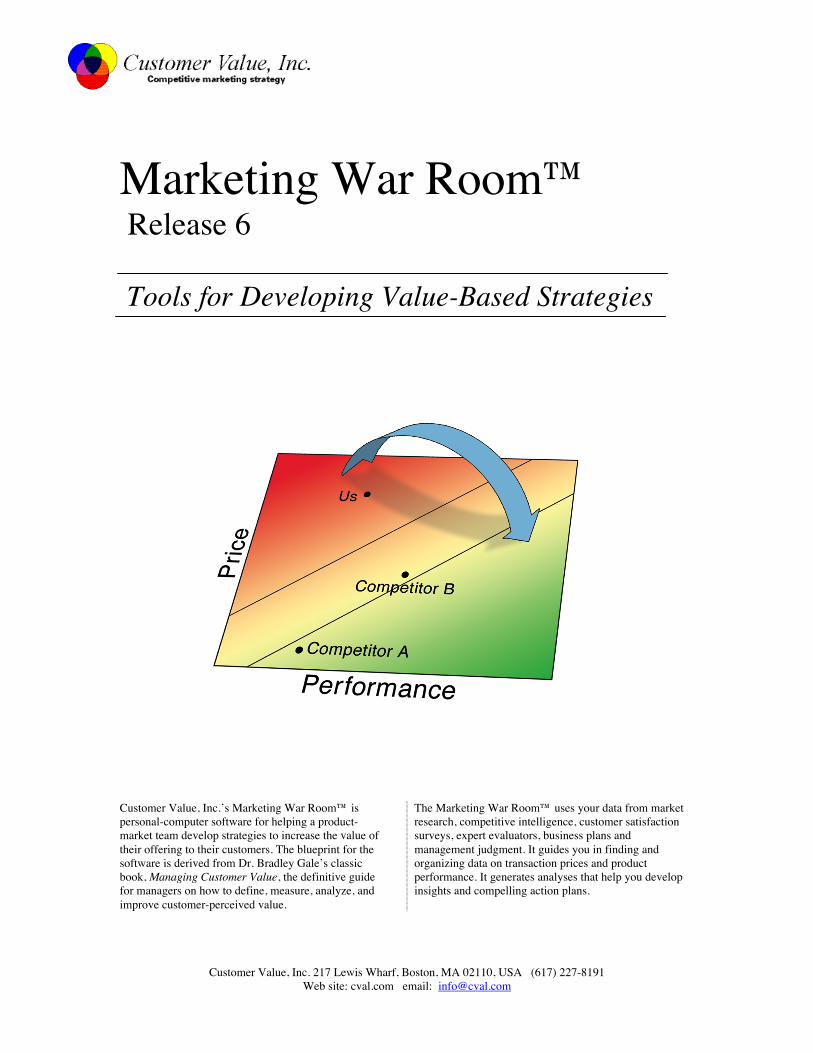
Customer Value, Inc. 217 Lewis Wharf, Boston, MA 02110, USA (617) 227-8191 Web site: cval.com email: [email protected] Marketing War Room™ Release 6 Tools for Developing Value-Based Strategies Customer Value, Inc.’s Marketing War Room™ is personal-computer software for helping a product- market team develop strategies to increase the value of their offering to their customers. The blueprint for the software is derived from Dr. Bradley Gale’s classic book, Managing Customer Value, the definitive guide for managers on how to define, measure, analyze, and improve customer-perceived value. The Marketing War Room™ uses your data from market research, competitive intelligence, customer satisfaction surveys, expert evaluators, business plans and management judgment. It guides you in finding and organizing data on transaction prices and product performance. It generates analyses that help you develop insights and compelling action plans.
Transcript of Marketing War Room™ - cval. · PDF fileCustomer Value, Inc. 217 Lewis Wharf, Boston, MA...
Customer Value, Inc. 217 Lewis Wharf, Boston, MA 02110, USA (617) 227-8191Web site: cval.com email: [email protected]
Marketing War Room™ Release 6
Tools for Developing Value-Based Strategies
Customer Value, Inc.’s Marketing War Room™ ispersonal-computer software for helping a product-market team develop strategies to increase the value oftheir offering to their customers. The blueprint for thesoftware is derived from Dr. Bradley Gale’s classicbook, Managing Customer Value, the definitive guidefor managers on how to define, measure, analyze, andimprove customer-perceived value.
The Marketing War Room™ uses your data from marketresearch, competitive intelligence, customer satisfactionsurveys, expert evaluators, business plans andmanagement judgment. It guides you in finding andorganizing data on transaction prices and productperformance. It generates analyses that help you developinsights and compelling action plans.
Customer Value, Inc. 217 Lewis Wharf, Boston, MA 02110, USA (617) 227-8191Web site: cval.com email: [email protected]
Compete More Effectively: Manage Customer Value
The value map
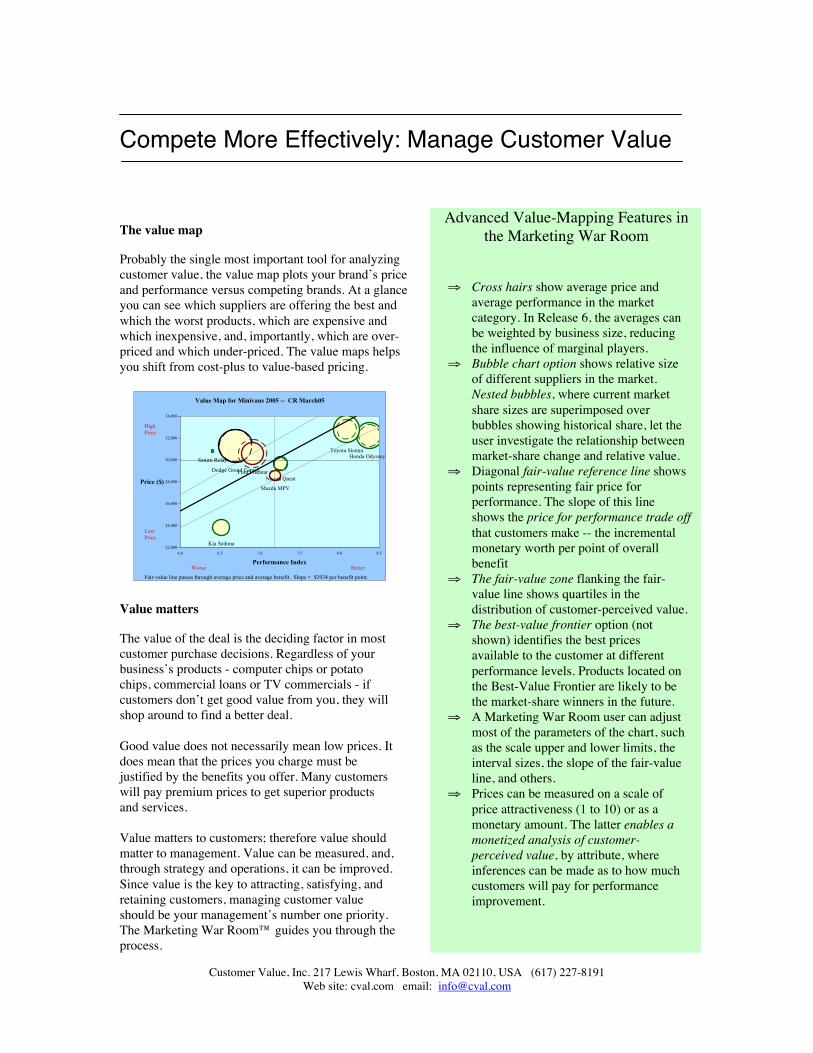
Probably the single most important tool for analyzingcustomer value, the value map plots your brand’s priceand performance versus competing brands. At a glanceyou can see which suppliers are offering the best andwhich the worst products, which are expensive andwhich inexpensive, and, importantly, which are over-priced and which under-priced. The value maps helpsyou shift from cost-plus to value-based pricing.
Value Map for Minivans 2005 -- CR March05
Kia Sedona
Saturn Relay
Ford FreestarDodge Grand Carava
Mazda MPV
Nissan Quest
Toyota SiennaHonda Odyssey
22,000
24,000
26,000
28,000
30,000
32,000
34,000
6.0 6.5 7.0 7.5 8.0 8.5
Performance Index
Price ($)
Fair-value line passes through average price and average benefit. Slope = $3924 per benefit point.
HighPrice
LowPrice
Worse Better
Value matters
The value of the deal is the deciding factor in mostcustomer purchase decisions. Regardless of yourbusiness’s products - computer chips or potatochips, commercial loans or TV commercials - ifcustomers don’t get good value from you, they willshop around to find a better deal.
Good value does not necessarily mean low prices. Itdoes mean that the prices you charge must bejustified by the benefits you offer. Many customerswill pay premium prices to get superior productsand services.
Value matters to customers; therefore value shouldmatter to management. Value can be measured, and,through strategy and operations, it can be improved.Since value is the key to attracting, satisfying, andretaining customers, managing customer valueshould be your management’s number one priority.The Marketing War Room™ guides you through theprocess.
Advanced Value-Mapping Features inthe Marketing War Room
⇒ Cross hairs show average price andaverage performance in the marketcategory. In Release 6, the averages canbe weighted by business size, reducingthe influence of marginal players.
⇒ Bubble chart option shows relative sizeof different suppliers in the market.Nested bubbles, where current marketshare sizes are superimposed overbubbles showing historical share, let theuser investigate the relationship betweenmarket-share change and relative value.
⇒ Diagonal fair-value reference line showspoints representing fair price forperformance. The slope of this lineshows the price for performance trade offthat customers make -- the incrementalmonetary worth per point of overallbenefit
⇒ The fair-value zone flanking the fair-value line shows quartiles in thedistribution of customer-perceived value.
⇒ The best-value frontier option (notshown) identifies the best pricesavailable to the customer at differentperformance levels. Products located onthe Best-Value Frontier are likely to bethe market-share winners in the future.
⇒ A Marketing War Room user can adjustmost of the parameters of the chart, suchas the scale upper and lower limits, theinterval sizes, the slope of the fair-valueline, and others.
⇒ Prices can be measured on a scale ofprice attractiveness (1 to 10) or as amonetary amount. The latter enables amonetized analysis of customer-perceived value, by attribute, whereinferences can be made as to how muchcustomers will pay for performanceimprovement.

Customer Value, Inc. 217 Lewis Wharf, Boston, MA 02110, USA (617) 227-8191Web site: cval.com email: [email protected]
Know What Your Product is Really Worth
Value-based pricing
Customers size up your product by comparing it towhat your competitors offer them. The MarketingWar Room lets you compare your products’ featuresand performance head to head against anycompetitor. It then calibrates what your advantagesare worth. You can use this knowledge to set pricesbased on the worth of your products.
Generally, your prices should be in line with thebenefits you deliver to customers. This is the safecourse between the shoals of overpricing (alienatingcustomers) and the rocks of underpricing (leavingmoney on the table). But value-based pricing can bedone only if you can calculate what your product,with its unique pattern of strengths and weaknessesrelative to competition, is really worth to thecustomer
Is our product superior?
A product’s worth is based on its performance.Performance, in turn, usually has many dimensions.In using the Marketing War Room, you first identifythe key buying factors, the attributes of the offer thatcustomers examine in deciding which of thecompeting products to buy. (For example, shoppersfor a new car may examine, among other things,comfort, safety, acceleration, and warrantyprotection.) Then, for each of these attributes, youassign scores for your performance and for eachcompetitor’s performance.
The Attributes Plot compares the scores of thedifferent competitors on the key buying factors
Appraising performance advantages
The Marketing War Room provides estimates ofthe worth of your product advantages anddisadvantages relative to a reference product. Bydefault, the software sets the reference to be theaverage of all suppliers; some users choose insteadto compare themselves against their toughestcompetitor. As a measure of overall performance,the software constructs a weighted average of thedifferent attribute scores. This composite score isconverted to monetary terms using a dollars-per-point conversion factor (the slope of the fair-priceline) derived from the value map.
Can you save your customer money?
In many markets, the purchase price is only a partof the customers’ costs. For example, the costs ofowning a car include not only the purchase price ofthe car but also the costs of gasoline. If you canconvincingly show your customers that the cost ofowning and using your product is $100 less thancompeting products, then you can justify up to a$100 selling-price premium. The Marketing WarRoom combines attribute-performance scores andcost-in-use analysis using the following equation:
Justified (Fair) Price = Price of reference product + Value of your performance advantages + Cost savings in using or owning your product
The calculations are shown graphically in theValue-Pricing Chart (above, new in Release 6).
Attribute Scores, Commercial Filtration -- 1/21/05 Survey
Relationship
Technical support
Reliable supply
Clogging
Taste
Lead Removal
Chloroform Removal
0.0 2.0 4.0 6.0 8.0 10.0 12.0
Performance Scores
Filto
Average
Value-Pricing Chart
Average Price
Price
Unit Cost
Better benefitsWorth
Margin
Surplus
Higher in-use cost
0
10
20
30
40
50
60
Estimating the worth of Filto using Average as a reference
$

Customer Value, Inc. 217 Lewis Wharf, Boston, MA 02110, USA (617) 227-8191Web site: cval.com email: [email protected]
Hone Your Value Proposition
Position your products to earn market share andpremium prices
Your value proposition is the set of promises youmake to your customers that set you apart from thecompetition. You may offer superior performanceon a carefully selected set of buying factors, or youmay offer the lowest prices. Often you may chooseto sacrifice in some areas (say, for example, thearray of features) in order to excel in other areas(say, price.) How you make these tradeoffs iscentral to your marketing strategy, and will driveyour success in the market.
The Marketing War Room helps you craft yourvalue proposition
Filto Improvement Opportunities
0 10 20 30 40
ChloroformRemoval
Lead Removal
Taste
Clogging
Reliable supply
Technicalsupport
Relationship
Value of Improvements ($)
Catch upBenchmarkBreakthrough
The Marketing War Room contains a number ofanalytic displays that help you understand whatactions you can take to offer a highly competitiveproduct or service.
The Opportunities-for-Improvement chartbenchmarks your performance scores against theaverage, best-in-class, and breakthrough scores inyour industry. It shows which performanceattributes you should work on to increase the worthof your product to customers.
Other analytics include the attribute-scorecomparison chart and the attribute positioning plotsof importance vs. performance. These help youunderstand the strengths and weaknesses of yourcurrent offering, and identify what you must workon.
Apply the right levers to improve yourpositioning
There are any number of ways that a business canimprove the value of its products to customers.Some of the management levers include:
• Product-improvement programs• Product introductions• Service improvements and process redesign• Factory and “back-office” programs• Advertising and sales initiatives• Segmentation and differentiation projects• Pricing
Improving customer-perceived value has twocomponents. The first is to be able to deliversuperior benefits at a fair price. The second is tocommunicate your strengths to customers and tocorrect misperceptions that hurt your product. Thelevers listed above touch on both components.
Use the Head-to-Head chart to quantify youradvantages and disadvantages
The input into the Marketing War Room is a tablethat compares your performance to each competitorbased on performance scores. Often these data comefrom market research, representing a sample of theopinions of customers. In other cases, the ratingscome from one-on-one interviews with customers.(Such interviews are often a part of the key-accountmanagement system.) The Marketing War Roomuses this data to identify your comparativeadvantages and guide your communicationsstrategy.
Filto Value Relative to Walter
-20 -10 0 10 20 30 40 50 60
Chloroform Removal
Lead Removal
Taste
Clogging
Reliable supply
Technical support
Relationship
Capital cost
Disposibles cost
Relative value impacts - Filto vs. Walter
StrengthsWeaknessesTotal= $100.7 ( $37.7 from benefits, $63.0 from price)

Customer Value, Inc. 217 Lewis Wharf, Boston, MA 02110, USA (617) 227-8191Web site: cval.com email: [email protected]
Align Your Management Team
Strategic programs for improving value
Customer Value is a great focus for a business plan;it (a) produces results and (b) provides a unifiedvision that involves all of the business’s functions.Generally, high-level objectives are achievedthrough a set of strategic programs that coordinatethe use of management levers toward achievingspecific performance objectives.
The Marketing War Room provides a number oftemplates that help you specify your strategy for
Program / ObjectivesStrategic Programs
Competitive Expand Field New CRM Filter holderAttribute Objective Engineering system redesign
Chloroform Removal LeaderLead Removal Leader
Taste StrongClogging Leader X
Reliable supply Moderate XTechnical spport Strong X X X
Relationship Strong XCapital cost Low cost
Disposibles cost Moderate
competing effectively. The Marketing War Roomtemplates help you document your objectives andidentify who does what by when to achieve them.
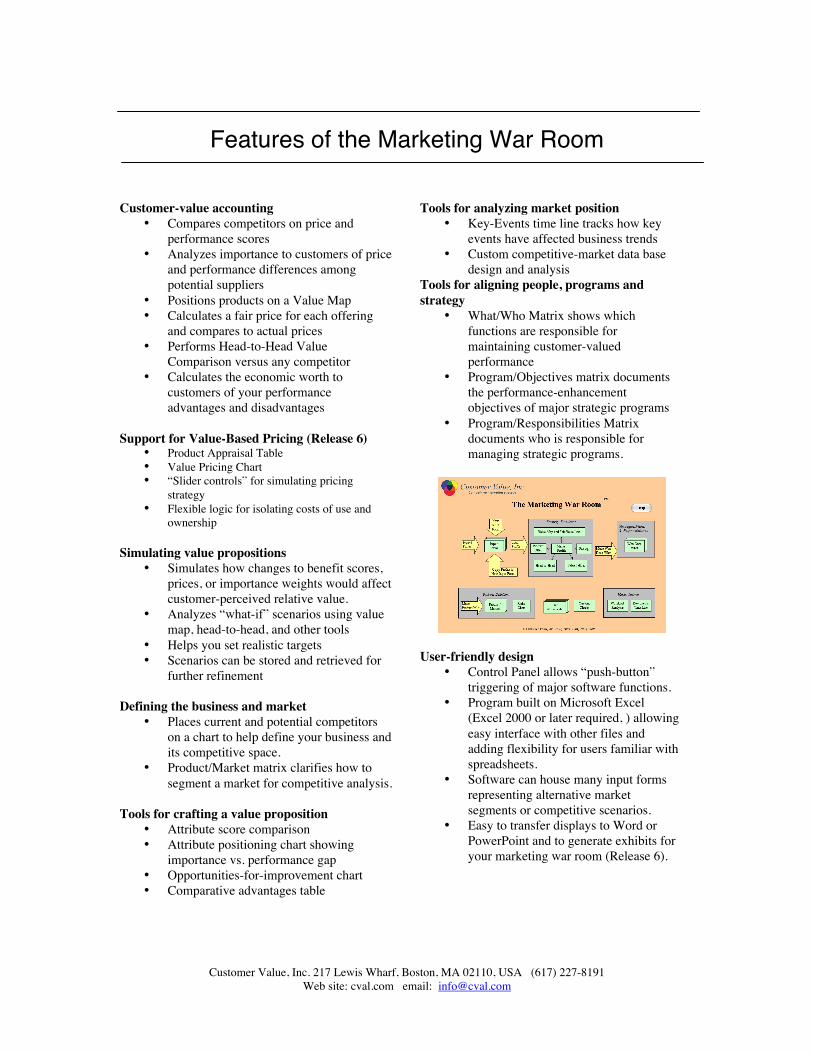
Design a high-energy war room
Do your strategy meetings produce opensharing of information, high qualitydiscussion, and clear action steps? If not,try ditching the traditional Powerpointpresentations and transform the conferenceroom into an action-oriented war room.
Use the Marketing War Room to generatethe key displays on pricing, valuepropositions, sales strategies, and actionitems. Post the displays on the wall andreview the key points interactively with theteam. Keep the Marketing War RoomSoftware running to simulate alternativestrategies. Keep your team energized,focused, and on target.
The War Room Wall
Value Selling helps you capture the worth of yourperformance advantages
Many companies leave money on the table becausethey feel they must match competitor prices.Companies who pride themselves on providingsuperior products and services can profit by pricingconsistently with their advantages. But doing thisrequires effective two-way dialog with the customersto help them verbalize their non-price needs. TheMarketing War Room produces charts that can beused by a key-account sales team to prepare for aproductive customer dialog.
Relative Importance of Benefit AttributesCommercial Filtration -- 1/21/05 Survey
Chloroform Removal
Lead Removal
Taste
Clogging
Reliable supply
Technical support
Relationship
The Attribute-Importance Pie Chart canprovide a focus for product “listeningsessions” for key accounts.
Customer Value, Inc. 217 Lewis Wharf, Boston, MA 02110, USA (617) 227-8191Web site: cval.com email: [email protected]
Features of the Marketing War Room
Customer-value accounting• Compares competitors on price and
performance scores• Analyzes importance to customers of price
and performance differences amongpotential suppliers
• Positions products on a Value Map• Calculates a fair price for each offering
and compares to actual prices• Performs Head-to-Head Value
Comparison versus any competitor• Calculates the economic worth to
customers of your performanceadvantages and disadvantages
Support for Value-Based Pricing (Release 6)• Product Appraisal Table• Value Pricing Chart• “Slider controls” for simulating pricing
strategy• Flexible logic for isolating costs of use and
ownership
Simulating value propositions• Simulates how changes to benefit scores,
prices, or importance weights would affectcustomer-perceived relative value.
• Analyzes “what-if” scenarios using valuemap, head-to-head, and other tools
• Helps you set realistic targets• Scenarios can be stored and retrieved for
further refinement
Defining the business and market• Places current and potential competitors
on a chart to help define your business andits competitive space.
• Product/Market matrix clarifies how tosegment a market for competitive analysis.
Tools for crafting a value proposition• Attribute score comparison• Attribute positioning chart showing
importance vs. performance gap• Opportunities-for-improvement chart• Comparative advantages table
Tools for analyzing market position• Key-Events time line tracks how key
events have affected business trends• Custom competitive-market data base
design and analysisTools for aligning people, programs andstrategy
• What/Who Matrix shows whichfunctions are responsible formaintaining customer-valuedperformance
• Program/Objectives matrix documentsthe performance-enhancementobjectives of major strategic programs
• Program/Responsibilities Matrixdocuments who is responsible formanaging strategic programs.
User-friendly design• Control Panel allows “push-button”
triggering of major software functions.• Program built on Microsoft Excel
(Excel 2000 or later required, ) allowingeasy interface with other files andadding flexibility for users familiar withspreadsheets.
• Software can house many input formsrepresenting alternative marketsegments or competitive scenarios.
• Easy to transfer displays to Word orPowerPoint and to generate exhibits foryour marketing war room (Release 6).