Marketing Metrics: The Manager's Guide to Measuring...
45
Transcript of Marketing Metrics: The Manager's Guide to Measuring...

MARKETING METRICSTHIRD EDITION

This page intentionally left blank

MARKETINGMETRICS
THIRD EDITION
THE MANAGER’S GUIDE TO MEASURING MARKETING
PERFORMANCE
Neil T. Bendle Paul W. Farris
Phillip E. PfeiferDavid J. Reibstein

Publisher: Paul BogerEditor-in-Chief: Amy NeidlingerExecutive Editor: Jeanne Glasser Levine Editorial Assistant: Kristen WattersonCover Designer: Chuti PrasertsithManaging Editor: Kristy HartProject Editor: Andy BeasterProofreader: Debbie WilliamsIndexer: Tim WrightCompositor: Nonie RatcliffManufacturing Buyer: Dan Uhrig
© 2016 by Pearson Education, Inc.Publishing as PearsonUpper Saddle River, New Jersey 07458
For information about buying this title in bulk quantities, or for special sales opportunities (which may include electronic versions; custom cover designs; and content particular to your business, training goals, marketing focus, or branding interests), please contact our corporate sales department at [email protected] or (800) 382-3419.
For government sales inquiries, please contact [email protected].
For questions about sales outside the U.S., please contact [email protected].
Company and product names mentioned herein are the trademarks or registered trademarks of their respective owners.
All rights reserved. No part of this book may be reproduced, in any form or by any means, without per-mission in writing from the publisher.
Printed in the United States of America
First Printing September 2015
ISBN-10: 0-13-408596-5ISBN-13: 978-0-13-408596-8
Pearson Education LTD.Pearson Education Australia PTY, LimitedPearson Education Singapore, Pte. Ltd.Pearson Education Asia, Ltd.Pearson Education Canada, Ltd.Pearson Educación de Mexico, S.A. de C.V. Pearson Education—JapanPearson Education Malaysia, Pte. Ltd.
Library of Congress Control Number: 2015943269

We dedicate this book to our students, colleagues,and consulting clients who convinced us that
a book like this would fill a real need.

This page intentionally left blank

CONTENTS
Acknowledgments ix
About the Authors xi
Foreword xiii
Foreword to Third Edition xv
1INTRODUCTION 1
2SHARE OF HEARTS, MINDS, AND MARKETS 17
3 MARGINS AND PROFITS 67
4PRODUCT AND PORTFOLIO MANAGEMENT 111
5CUSTOMER PROFITABILITY 157
6SALES FORCE AND CHANNEL MANAGEMENT 185
vii

7PRICING STRATEGY 225
8PROMOTION 271
9ADVERTISING METRICS 295
10ONLINE, EMAIL, AND MOBILE METRICS 325
11MARKETING AND FINANCE 363
12THE MARKETING METRICS X-RAY AND TESTING 383
13SYSTEM OF METRICS 401
Bibliography 417
Endnotes 421
Index 429
viii MARKETING METRICS

ACKNOWLEDGMENTSWe hope this book will be a step, however modest, toward clarifying the language, construction, and meaning of many of our important marketing metrics. If we have succeeded in making such a step, we owe thanks to a number of people.
Jerry Wind reviewed our initial concept and encouraged us to set our sights higher. Rob Northrop, Simon Bendle, and Vince Choe read early drafts and gave valuable feedback on the most important chapters. Eric Larson, Jordan Mitchell, Tom Disantis, and Francisco Simon helped develop material for important sections and provided their research skills. Gerry Allan and Alan Rimm-Kauffman allowed us to cite liberally from their materials on customers and Internet marketing. We thank Valerie Redd and Kelly Brandow for their help in designing, testing, and administering the survey of the metrics that senior marketing managers use to monitor and manage their businesses.
Marc Goldstein combined business savvy with deft editing touches that improved the readability of almost every chapter. Amy Neidlinger, Jeanne Levine, Andy Beaster, Debbie Williams, Nonie Ratcliff, and their colleagues also made significant improve-ments in moving from a raw manuscript to the book in your hands.
Erv Shames, Erjen van Nierop, Peter Hedlund, Fred Telegdy, Judy Jordan, Lee Pielemier, and Richard Johnson have collaborated on our “Allocator” management simulation and “Management by the Numbers” online tutorials. That work helped us set the stage for this volume. Finally, we thank Emily, Kate, Donna, and Sarah, who graciously toler-ated the time sacrificed from home and social lives for the writing of this book.
For the third edition we would also like to thank Raymond Pirouz and Liz Gray for sharing their opinions and expertise in respect to online marketing.
Thanks to Dr. Manuel Garcia-Garcia, Neuroscience Director, Nielsen and Adjunct Associate Professor, NYU Stern School of Business, and Neuroscience UVA student Pasha Davoudian for their invaluable guidance and assistance with the section on neuro-marketing.
ix

This page intentionally left blank

ABOUT THE AUTHORSNeil T. Bendle is an Assistant Professor of Marketing at the Ivey Business School, Western University, Canada. He holds a PhD from the Carlson School of Management, University of Minnesota, and an MBA from Darden. He has been published in jour-nals such as Marketing Science and the Journal of Consumer Research. He has nearly a decade’s experience in marketing management, consulting, business systems improve-ment, and financial management. He was responsible for measuring the success of marketing campaigns for the British Labour Party.
Paul W. Farris is Landmark Communications Professor and Professor of Marketing at The Darden Graduate Business School, University of Virginia, where he has taught since 1980. Previously he was on the faculty of the Harvard Business School and worked in marketing management for Unilever. Professor Farris’s research has produced award-winning articles on retail power, the measurement of advertising effects, and marketing budgeting. He has published many articles in journals such as the Harvard Business Review, Journal of Marketing, Journal of Advertising Research, and Marketing Science. He is currently developing improved techniques for integrating marketing and financial metrics and is coauthor of several books, including The Profit Impact of Marketing Strategy Project: Retrospect and Prospects. Farris’s consulting clients have ranged from Apple and IBM to Procter & Gamble and Unilever. He has also served on boards of manufacturers and retailers and as an academic trustee of the Marketing Science Institute.
Phillip E. Pfeifer, Richard S. Reynolds Professor of Business Administration at The Darden Graduate Business School, currently specializes in direct/interactive market-ing. He has published a popular MBA textbook and more than 35 refereed articles in journals such as the Journal of Interactive Marketing, Journal of Database Marketing, Decision Sciences, and the Journal of Forecasting. In addition to academic articles and a textbook, Mr. Pfeifer is a prolific case writer, having been recognized in 2004 as the Darden School’s faculty leader in terms of external case sales, and in 2008 with a Wachovia Award for Distinguished Case Writer. His teaching has won student awards and has been recognized in Business Week’s Guide to the Best Business Schools. Recent consulting clients include Circuit City, Procter & Gamble, and CarMax.
xi

Dr. David J. Reibstein is the William S. Woodside Professor and Professor of Marketing at the Wharton School, University of Pennsylvania. Dave has been on the Wharton Faculty for more than two decades. He was the Vice Dean of the Wharton School, and Director of the Wharton Graduate Division. In 1999-2001, Dave took a leave of absence from academia to serve as the Executive Director of the Marketing Science Institute. He previously taught at Harvard, and was a Visiting Professor at Stanford, INSEAD, and ISB (in India). Dave was the Chairman of the American Marketing Association. He has a radio show, Measured Thoughts with Dave Reibstein, on SiriusXM Radio.
xii MARKETING METRICS

FOREWORDDespite its importance, marketing is one of the least understood, least measurable func-tions at many companies. With sales force costs, it accounts for 10 percent or more of operating budgets at a wide range of public firms. Its effectiveness is fundamental to stock market valuations, which often rest upon aggressive assumptions for customer acquisition and organic growth. Nevertheless, many corporate boards lack the under-standing to evaluate marketing strategies and expenditures. Most directors—and a ris-ing percentage of Fortune 500 CEOs—lack deep experience in this field.Marketing executives, for their part, often fail to develop the quantitative, analytical skills needed to manage productivity. Right-brain thinkers may devise creative cam-paigns to drive sales but show little interest in the wider financial impact of their work. Frequently, they resist being held accountable even for top-line performance, asserting that factors beyond their control—including competition—make it difficult to monitor the results of their programs.In this context, marketing decisions are often made without the information, expertise, and measurable feedback needed. As Procter & Gamble’s Chief Marketing Officer has said, “Marketing is a $450 billion industry, and we are making decisions with less data and discipline than we apply to $100,000 decisions in other aspects of our business.” This is a troubling state of affairs. But it can change.In a recent article in The Wall Street Journal, I called on marketing managers to take concrete steps to correct it. I urged them to gather and analyze basic market data, measure the core factors that drive their business models, analyze the profitability of individual customer accounts, and optimize resource allocation among increasingly fragmented media. These are analytical, data-intensive, left-brain practices. Going forward, I believe they’ll be crucial to the success of marketing executives and their employers. As I concluded in the Journal:
“Today’s boards want chief marketing officers who can speak the language of productivity and return on investment and are willing to be held accountable. In recent years, manufacturing, procurement and logistics have all tightened their belts in the cause of improved productivity. As a result, marketing expenditures account for a larger percentage of many corporate cost structures than ever before. Today’s boards don’t need chief marketing officers who have creative flair but no financial discipline. They need ambidextrous marketers who offer both.”
xiii
In Marketing Metrics, Farris, Bendle, Pfeifer, and Reibstein have given us a valuable means toward this end. In a single volume, and with impressive clarity, they have outlined the sources, strengths, and weaknesses of a broad array of marketing metrics. They have explained how to harness those data for insight. Most importantly, they have explained how to act on this insight—how to apply it not only in planning cam-paigns, but also in measuring their impact, correcting their courses, and optimizing their results. In essence, Marketing Metrics is a key reference for managers who aim to become skilled in both right- and left-brain marketing. I highly recommend it for all ambidextrous marketers.
John A. Quelch, Lincoln Filene Professor of Business Administration and Senior Associate Dean for International Development, Harvard Business School
xiv MARKETING METRICS

xv
FOREWORD TO THE THIRD EDITION
At Google, we have a saying we use quite frequently: “Data beats opinion.” This mantra inspires us to constantly think about how we can increase the ratio of fact to specula-tion. What do we actually know vs. what do we only think we know? The best approach we’ve found is to determine our key performance indicators, and then measure how we are doing against them on a regular basis. This allows us to optimize and expand those programs that are working, while pulling back on those that are not.
In today’s hyper-competitive business landscape, most marketers are compelled to take a similar approach. No longer can marketers rely on conventional wisdom, rules of thumb, or intuition that may have been sufficient in the past.
The challenge, however, for all marketers is knowing what to measure and exactly how to measure it.
That’s where Marketing Metrics comes in. In its first two editions, I’ve found it to be the most comprehensive and authoritative guide to defining, constructing, and using the metrics every marketer needs today. It’s a book I keep handy on my shelf and refer to frequently.
As marketing continues to rapidly evolve, Marketing Metrics continues to stay at the cutting edge. This third edition updates and adds more detail on a number of the key metrics, including brand metrics and ROI. Given the increasing importance of online and social metrics, this new edition now dedicates a chapter to them separate from tra-ditional advertising metrics. Herein you will also find a section about the metrics for the emerging area of neuro-marketing.
In our experience at Google, marketers who move with speed, make their messages highly relevant, and use data (it beats opinion!) are best-positioned for success with today’s buyers and modern media vehicles. I therefore heartily recommend Marketing Metrics as the foundation of the data portion of this three-pronged recipe for marketing success!
Jim LecinskiVice President, Americas Customer Solutions, Google

This page intentionally left blank

1INTRODUCTION
In recent years, data-based marketing has swept through the business world. In its wake, measurable performance and accountability have become the keys to market-ing success. However, few managers appreciate the range of metrics by which they can evaluate marketing strategies and dynamics. Fewer still understand the pros, cons, and nuances of each.
More than a decade ago, we recognized that marketers, general managers, and business students needed a comprehensive, practical reference on the metrics used to judge mar-keting programs and quantify their results. This book was the result and seeks to pro-vide that reference. This is now the third edition of the book and we continue to wish our readers great success using this book to improve their understanding of marketing.
1.1 What Is a Metric?A metric is a measuring system that quantifies a trend, dynamic, or characteristic.1 In virtually all disciplines, practitioners use metrics to explain phenomena, diagnose causes, share findings, and project the results of future events. Throughout the worlds of science, business, and government, metrics encourage rigor and objectivity. They make it possible to compare observations across regions and time periods. They facili-tate understanding and collaboration.
1.2 Why Do You Need Metrics?“When you can measure what you are speaking about, and express it in numbers, you know something about it; but when you cannot measure it, when you cannot express it in numbers, your knowledge is of a meager and unsatisfactory kind: it may be the beginning of knowledge, but you have scarcely, in your thoughts, advanced to the stage of science.”—Lord Kelvin, Popular Lectures and Addresses (1891–94)2
1

Lord Kelvin, a British physicist and the manager in charge of laying the first successful transatlantic cable, was one of history’s great advocates for quantitative investigation. In his day, however, mathematical rigor had not yet spread widely beyond the worlds of science, engineering, and finance. Much has changed since then.
Today, numerical fluency is a crucial skill for every business leader. Managers must quantify market opportunities and competitive threats. They must justify the financial risks and benefits of their decisions. They must evaluate plans, explain variances, judge performance, and identify leverage points for improvement—all in numeric terms. These responsibilities require a strong command of measurements and of the systems and formulas that generate them. In short, they require metrics.
Managers must select, calculate, and explain key business metrics. They must under-stand how each is constructed and how to use it in decision-making. Witness the fol-lowing, more recent quotes from management experts:
“. . . every metric, whether it is used explicitly to influence behavior, to evaluate future strategies, or simply to take stock, will affect actions and decisions.”3
“If you can’t measure it, you can’t manage it.”4
1.3 Marketing Metrics: Opportunities, Performance, and Accountability
Marketers are by no means immune to the drive toward quantitative planning and evaluation. Marketing may once have been regarded as more an art than a science. Executives may once have cheerfully admitted that they knew they wasted half the money they spent on advertising, but they didn’t know which half. Those days, how-ever, are gone.
Today, marketers must understand their addressable markets quantitatively. They must measure new opportunities and the investment needed to realize them. Marketers must quantify the value of products, customers, and distribution channels—all under various pricing and promotional scenarios. Increasingly, marketers are held account-able for the financial ramifications of their decisions. Observers have noted this trend in graphic terms:
“For years, corporate marketers have walked into budget meetings like neighborhood junkies. They couldn’t always justify how well they spent past handouts or what dif-ference it all made. They just wanted more money—for flashy TV ads, for big-ticket events, for, you know, getting out the message and building up the brand. But those heady days of blind budget increases are fast being replaced with a new mantra: measurement and accountability.”5
2 MARKETING METRICS

1.4 Choosing the Right NumbersThe numeric imperative represents a challenge, however. In business and economics, many metrics are complex and difficult to master. Some are highly specialized and best suited to specific analyses. Many require data that may be approximate, incom-plete, or unavailable.
Under these circumstances, no single metric is likely to be perfect. For this reason, we recommend that marketers use a portfolio or “dashboard” of metrics. By doing so, they can view market dynamics from various perspectives and arrive at “triangulated” strategies and solutions. Additionally, with multiple metrics, marketers can use each as a check on the others. In this way, they can maximize the accuracy of their knowledge.6 They can also estimate or project one data point on the basis of others. Of course, to use multiple metrics effectively, marketers must appreciate the relations between them and the limitations inherent in each.
When this understanding is achieved, however, metrics can help a firm maintain a productive focus on customers and markets. They can help managers identify the strengths and weaknesses in both strategies and execution. Mathematically defined and widely disseminated, metrics can become part of a precise, operational language within a firm.
Data Availability and Globalization of MetricsA further challenge in metrics stems from wide variations in the availability of data between industries and geographies. Recognizing these variations, we have tried to suggest alternative sources and procedures for estimating some of the metrics in this book.
Fortunately, although both the range and type of marketing metrics may vary between countries,7 these differences are shrinking rapidly. Ambler,8 for example, reports that performance metrics have become a common language among marketers, and that they are now used to rally teams and benchmark efforts internationally.
1.5 What Are We Measuring?Measuring marketing is highly challenging. For example, marketers generally agree that a firm’s brand is a key marketing asset but different marketers all have subtly different views of what is meant by a brand. It is hard to measure something when you don’t know what exactly you are trying to measure. We, therefore, suggest that the first thing a marketer needs to establish is a clear definition of what they are trying to measure.
Chapter 1 Introduction 3

Watt and van den Berg distinguish theoretical and operations definitions in a way that we find useful.
“Concepts represent the “real world” phenomena being explained by the theory. The scientific method requires that the nature of these concepts be unambiguously com-municated to others. This requirement mandates the creation of theoretical defini-tions….. Concepts must also be objectively observed. This requires that we create operational definitions, which translate the verbal concepts into corresponding vari-ables which can be measured.” Watt and van den Berg (p. 11)
The same authors differentiate constructs from concepts, arguing that the former are even more abstract than concepts and cannot be directly observed. They use “source credibility” as an example of a construct that comprises concepts such as expertise, status, and objectivity. Of course constructs can also be operationalized in a number of ways.
To see what this means, note that marketing has a number of basic ideas that capture real world phenomena; let us call these concepts. These basic ideas are very important to marketers and can be explained, and even formally defined, verbally. These concepts are, however, not the same as metrics. For example, loyalty is a critical concept for many marketers but my idea of loyalty may differ from yours. Is loyalty demonstrated when I visit a grocery store every week? What if that grocery store is the only one I can easily get to? I might not feel loyal to the store but I still visit it every week. Someone else might feel highly loyal to the same store but live much further away and only be able to visit irregularly. Which, if any, of these consumers are loyal?
We must make concrete our abstract concept of loyalty by providing an operational definition, a precise specification in numerical terms of what exactly we mean. This allows us to create metrics to keep track of how a firm is performing against the opera-tional definitions specified. This book aims to improve measurement validity, how well you translate your ideas into numbers; we do not seek to provide new ways of looking at marketing, or argue which concepts are more important than any others.
Some common ways of translating concepts into metrics are shown below in Table 1.1.
Table 1.1 Common Metrics Used to Track Important Concepts
Concept Metric(s)
Loyalty Share of Requirements (SOR), Willingness to Pay (WTP)Distribution All Commodity Volume (ACV), Total ACVMarket Concentration Three-firm concentration ratio, Herfindahl Index
4 MARKETING METRICS

Note in Table 1.1 that willingness to pay (WTP) measures both a consumer’s loyalty in the sense of attachment and differentiation, the fact that the product is very different and so there isn’t a close competitor that a consumer can purchase from instead. It is important to consider what exactly you are measuring and what metric fits your precise definition best.
Keeping a clear distinction between concepts, operational definitions, and metrics is surprisingly hard. In any given marketing team or organization, one can expect to see a certain level of confusion. We hope our book helps reduce this confusion and promote a common language, but we are realists. Indeed we are happy to acknowledge that we also make mistakes and inadvertently refer to metrics by the name of the concept. We are trying to be clear but please let us know if you see areas where we can improve (just in case there is a fourth edition).
There will continue to be healthy (or at least vigorous) debates in marketing on what should be meant by various theoretical concepts and constructs. However, at the level of measurement and reporting we believe that the field should be striving for consis-tency, accuracy, and reliability that allows us to at least understand what other people mean, even if we disagree with what they are suggesting. No shared understanding can happen without clear operational definitions. Providing these definitions is the primary focus of the Common Language Project. This project to improve the measurement of marketing, specifically making measurement in the discipline more consistent, is being undertaken by MASB (the Marketing Accountability Standards Board, http://www.themasb.org/), along with MSI (the Marketing Science Institute, http://www.msi.org/), ANA (the Association of National Advertisers, https://www.ana.net/), and AMA (the American Marketing Association, https://www.ama.org). We encourage readers to learn more about, and support, the initiative.
1.6 Value of InformationThere exists almost an infinite number of metrics that could be calculated. Even the most quantitative marketer will recognize that more calculations don’t always help make better decisions. Thus one question a marketer may want to start with is: “when is a metric useful?”
A classic distinction is between data versus information versus knowledge. Data is what we have a profusion of in the world of big data. Data is in raw form and doesn’t tell us anything without being manipulated in some way. Information is data that has been converted into something that can be used by a human reader. Ideally, information gets converted into knowledge when a user understands and internalizes the informa-tion. Thus one way of thinking about the value of information is whether it creates knowledge or not. Data that is simply being stored is not currently valuable, but often has the potential to be valuable if approached in the right way. How can we extract the
Chapter 1 Introduction 5

information from the data we have? (Clearly the marketer should ensure they have the legal and ethical right to use the data in this manner. Consent is usually a key con-sideration, but discussing law and ethics is beyond the scope of our book. The Direct Marketing Association has resources to aid such thinking, http://thedma.org/.)
One way to increase the value of information is thus to make it easier for users to convert it to knowledge. To do this we recommend considering how the information you have extracted, such as the metrics you have calculated, can be presented in a user- friendly way. There are now many companies, e.g., Tableau software, www.tableau.com, that specialize in translating information into visual representations. Such visual depictions are an excellent aid to allowing the user to more easily extract the message from the information you provide them.
An alternative way of thinking about the value of information is whether the informa-tion helps us take an action. Information is valuable only if it allows us to make a bet-ter decision. To cast this in terms of metrics, a metric’s value arises from its ability to improve our decisions in some way. Note this is a very pragmatic approach as the value of the metric depends upon what the user can do with the result. A CMO might find estimates of the value of the brand she controls invaluable when arguing for increasing the marketing budget with her C-suite colleagues. A more junior marketer, however, may feel that he can’t impact brand value in any significant way so knowing this num-ber is of no value to him. The more junior marketer can, however, impact whether the product is on the retailers’ shelves and so may find distribution measures invaluable.
A related point is that people sometimes equate the value of information with the range of possible alternatives that the metric can take. Knowing the precise number for a metric that swings wildly can be very informative and thus valuable. If the metric never changes significantly, knowing its precise reading at any given point is unlikely to be very valuable. For example, information on the sales of a fashion item where consumer reaction is unpredictable can be exceptionally valuable for stock planning. Estimates for items with more predictable sales, e.g., safety matches, are less valuable because know-ing the precise sales number is less likely to change the inventory order you would make without the more refined sales estimate. For items with very stable sales, your estimate based upon last year is likely to be good regardless of whether you calculate the precise metric for this year.
Testing is a critical component of marketing plans, but where should you spend your testing budget? What gives you the most information for your money? Scott Armstrong notes that this depends upon what you are trying to achieve. Sometimes you will want to emulate much academic research and drill down into a very specific topic. This can lead to very consistent estimates, also known as being “reliable.” This means every time you measure you get a similar result because you measure exactly the same thing each time you measure. In everyday life the electronic scale that weighs you every morning is reliable, you generally get the same result if nothing changes. This approach
6 MARKETING METRICS

makes sense if it is critical for you to be very precise, if small changes in a metric would radically alter your plans.
More often, however, you aren’t sure you are measuring the right thing. You want to know how the firm is performing generally but you have a less than perfect understand-ing of what performance means exactly. You might be interested in your general health rather than your precise weight. Your weight is likely to be connected to your general health but is far from the complete picture. In such situations you are interested in whether the measures you are using are valid, whether the measures accurately capture what you want them to capture. To assess validity you are likely to want multiple mea-sures, in which case you’ll spread your testing budget across a wider range of tests and are more tolerant of conflicting results. To assess your health you might look at your weight, your blood pressure, your blood sugar, the ease of your breathing, etc. These will sometimes point in different directions but put together they give a more compre-hensive picture than fixating upon a single metric, however reliably the single metric can be measured.
To have valid estimates of hard-to-define concepts, such as performance, we often recommend a variety of tests and the use of multiple metrics. As we will discuss in Chapters 12 and 13 it is often possible to have one metric look very good while the true value of the company is destroyed. Testing multiple different areas and assessing differ-ent metrics may give you a less precise picture (it is less reliable) but is much less likely to miss a major problem (it is more valid).
1.7 Mastering MetricsBeing able to “crunch the numbers” is vital to success in marketing. Knowing which numbers to crunch, however, is a skill that develops over time. Toward that end, managers must practice the use of metrics and learn from their mistakes. By working through the examples in this book, we hope our readers will gain both confidence and a firm understanding of the fundamentals of data-based marketing. With time and experience, we trust that you will also develop an intuition about metrics, and learn to dig deeper when calculations appear suspect or puzzling.
Ultimately, with regard to metrics, we believe many of our readers will require not only familiarity but also fluency. That is, managers should be able to perform rel-evant calculations on the fly—under pressure, in board meetings, and during strate-gic deliberations and negotiations. Although not all readers will require that level of fluency, we believe it will be increasingly expected of candidates for senior manage-ment positions, especially those with significant financial responsibility. We antici-pate that a mastery of data-based marketing will become a means for many of our
Chapter 1 Introduction 7

8 MARKETING METRICS
readers to differentiate and position themselves for career advancement in an ever more challenging environment.
1.8 Where are the “Top Ten” Metrics?Working on this book we received many requests to provide a short list of the “key” or “top ten” marketing metrics. The intuition behind this request is that readers (managers and students) want to be able to focus their attention on the “most important” metrics.
Although some readers have read the earlier editions from cover to cover, it is safe to say none of the authors have had that pleasure. We view the book as a reference book—something to keep on the shelf and use when confronted with a new or less familiar metric. The list of metrics covered is therefore long so as to be useful for those occa-sions. It is not aimed to be a guide to the X number of metrics you must apply to moni-tor marketing. It is this view of the book as a reference guide that helps explain why we do not rate or rank the long list of metrics. We see you pulling the book from the shelf as needed, rather than us pushing our preferred metrics upon you.
Specifically, the reasons for us not providing the short list of “really important” metrics are as follows.
First, we believe that any ranking of marketing metrics from most to least useful should depend on the type of business under consideration. Thus what metrics you prefer depend upon what you need them for. For example, marketers of business-to-business products and services that go to market through a direct sales force don’t need metrics that measure retail availability or dealer productivity.
Also, even what might begin as a short list tends to expand rapidly as metrics come in matched sets. For example, if customer lifetime value is important to your business (let’s say, financial services), then you are also likely to use measures of retention and acquisition costs. The same notion applies to retail, media, sales force, and Web traffic metrics. If some of these are important to you, others in the same general categories are likely to be rated as useful, too.
Third, businesses don’t always have access (at a reasonable cost) to the metrics they would like to have. Inevitably, some of the rankings presented will reflect the cost of obtaining the data that underlie the particular metrics. Some metrics may be interesting to know but cost more to obtain than the value of the information they provide. The size of the organization will thus matter. Small organizations will use metrics that are cheaper to obtain; whereas larger organizations are more likely to be able to realize the full value from expensive, proprietary, or custom-created metrics. The same goes for stages in the product life cycle. Managers of newly launched products often have differ-ent concerns and metrics to monitor them than mature products.

Chapter 1 Introduction 9
Fourth, we believe that some metrics currently ranked lower by managers will ulti-mately prove to be very useful, after managers fully understand the pros and cons of a particular metric. For example, advocates believe that Economic Value Added (EVA) is the “gold standard” of profitability metrics, but when we discuss it with many manag-ers, it ranks far below other financial performance measures such as ROI. We believe one reason for the low ranking of EVA is that this metric is less applicable at the “oper-ating level” than for overall corporate performance. So even within the same business, depending on where a manager sits in the organization, some metrics are more relevant than others. Also, like EVA, many metrics that we have included are relatively new to marketing, and many managers don’t understand them well or know how they might be relevant to their particular business. Customer Lifetime Value is another metric that is gaining acceptance, but is still unfamiliar to many managers. If all these metrics were perfectly understood, there would be no need for a book of this type.
We included the results of our survey of marketing managers in the second edition so that readers could learn what metrics other managers thought were potentially useful. However, we are now less convinced that the survey results are useful, because metric use and understanding remains an awfully long way from where we want to be. In this third edition we have therefore concentrated on adding more metrics and explaining some metrics in greater detail. Deleting the managerial survey results from the second edition gave us the space to do this.
Here we simply note the key points from the survey. These were that managers value the profit related metrics, net profit, ROI, and margin most highly, even though these metrics had less to do with day-to-day marketing decisions. We presume this is because those are the metrics they are asked about by those who control budgets. Customer satisfaction was the most popular “non-financial” metric. Sales related metrics, such as Sales Total also proved popular.
1.9 What’s New in the Third Edition?We have used the space gained in removing the survey to go deeper into areas that have risen in importance in the years since the second edition. The biggest change is our new chapter on online metrics, which seeks to clarify an area where there is no shortage of data and a profusion of measures. Unfortunately it remains an area in which it can be extremely difficult for a manager to understand what is happening often due to lack of standardization of definitions. We have also added a new section on neuro-marketing to allow managers to gain some familiarity with exciting developments in this field. Other significant changes include adding more detail on brand valuation, advertising elasticity, and clarifying the concept of double jeopardy.
10 MARKETING METRICS
New metrics are particularly in need of a careful appraisal with respect to their reliabil-ity and validity as metrics to inform management decisions. This edition expands our discussion of these concepts as well.
A closely related concept is “the value of information”—e.g., is it worth doing more market research or testing?—which is a critical input to many managerial decisions. As such we have also added more detail on the value of information and how manag-ers can use estimates of its value to make better informed decisions. We have added a discussion of the Gross Model for budget allocation and outlined our own variant of the budgeting model which describes how a manager can decide when to stop creat-ing and testing further advertising copy and roll out the current best candidate. The space devoted to this model for advertising copy and media funds is not because this particular decision is more important than other decisions, but because it illustrates a general approach to thinking about how using marketing metrics can improve market-ing decisions.
We hope that you enjoy the new edition of Marketing Metrics.
Organization of the TextThis book is organized into chapters that correspond to the various roles played by marketing metrics in enterprise management. Individual chapters are dedicated to metrics used in promotional strategy, advertising, and distribution, for example. Each chapter is composed of sections devoted to specific concepts and calculations.
We must present these metrics in a sequence that will appear somewhat arbitrary. In organizing this text, we have sought to strike a balance between two goals: (1) to estab-lish core concepts first and build gradually toward increasing sophistication, and (2) to group related metrics in clusters, helping our readers recognize patterns of mutual reinforcement and interdependence. In Figure 1.1, we offer a graphical presentation of this structure, demonstrating the interlocking nature of all marketing metrics—indeed of all marketing programs—as well as the central role of the customer.
The central issues addressed by the metrics in this book are as follows:
■ Chapter 2—Share of Hearts, Minds, and Markets: Customer perceptions, mar-ket share, and competitive analysis.
■ Chapter 3—Margins and Profits: Revenues, cost structures, and profitability.
■ Chapter 4—Product and Portfolio Management: The metrics behind product strategy, including measures of trial, growth, cannibalization, and brand equity.
■ Chapter 5—Customer Profitability: The value of individual customers and relationships.

Chapter 1 Introduction 11
■ Chapter 6—Sales Force and Channel Management: Sales force organization, performance, and compensation. Distribution coverage and logistics.
■ Chapter 7—Pricing Strategy: Price sensitivity and optimization, with an eye toward setting prices to maximize profits.
■ Chapter 8—Promotion: Temporary price promotions, coupons, rebates, and trade allowances.
■ Chapter 9—Advertising Metrics: The central measures of advertising coverage and effectiveness, including reach, frequency, rating points, and impressions. Models for consumer response to advertising.
■ Chapter 10—Online, Email, and Mobile Metrics: Specialized metrics for Web-based, Mobile, and Email campaigns.
Product and Portfolio
Management
CustomerProfitability
Sales Forceand
ChannelManagement
PricingStrategy
Promotions
AdvertisingMetrics
Online, Email,and Mobile
Metrics
Marketingand
Finance
Margins andProfits
Share of Hearts, Minds,and Markets
AdvertisingAgency
Finance
Operations
Logistics
Sales Force
The Trade
Customers and Market Research
Figure 1.1 Marketing Metrics: Marketing at the Core of the Organization

12 MARKETING METRICS
■ Chapter 11—Marketing and Finance: Financial evaluation of marketing programs.
■ Chapter 12—The Marketing Metrics X-Ray: The use of metrics as leading indi-cators of opportunities, challenges, and financial performance.
■ Chapter 13—System of Metrics: Decomposing marketing metrics into compo-nent parts can improve measurement accuracy, add managerial insight into problems, and assist marketing model building.
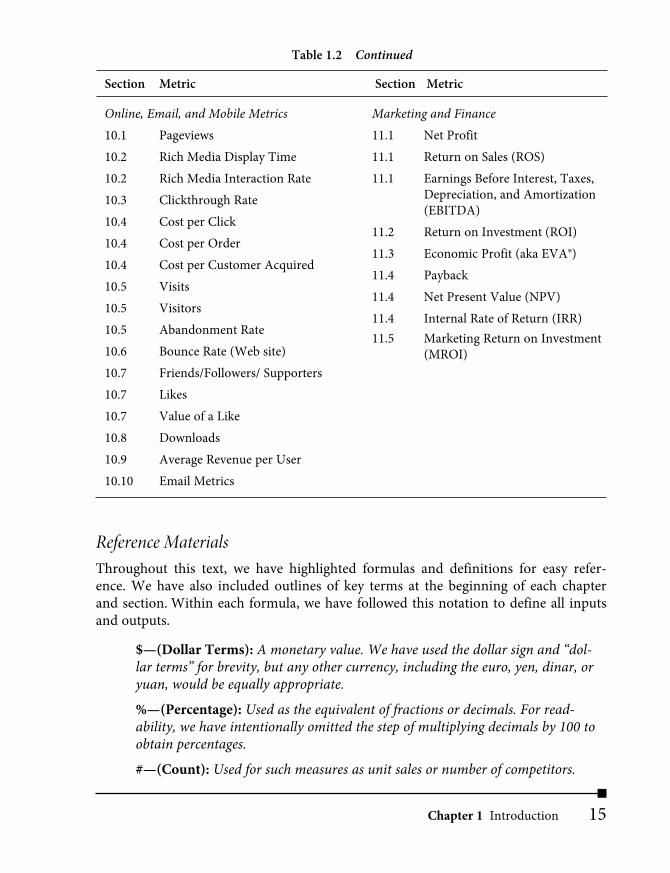
Components of Each ChapterAs shown in Table 1.2, the chapters are composed of multiple sections, each dedicated to specific marketing concepts or metrics. Within each section, we open with defini-tions, formulas, and a brief description of the metrics covered. Next, in a passage titled Construction, we explore the issues surrounding these metrics, including their formu-lation, application, interpretation, and strategic ramifications. We provide examples to illustrate calculations, reinforce concepts, and help readers verify their understand-ing of key formulas. That done, in a passage titled Data Sources, Complications, and Cautions, we probe the limitations of the metrics under consideration and potential pitfalls in their use. Toward that end, we also examine the assumptions underlying these metrics. Finally, we close each section with a brief survey of Related Metrics and Concepts.
In organizing the text in this way, our goal is straightforward: Most of the metrics in this book have broad implications and multiple layers of interpretation. Doctoral theses could be devoted to many of them, and have been written about some. In this book, however, we want to offer an accessible, practical reference. If the devil is in the details, we want to identify, locate, and warn readers against him, but not to elaborate his entire demonology. Consequently, we discuss each metric in stages, working progres-sively toward increasing levels of sophistication. We invite our readers to sample this information as they see fit, exploring each metric to the depth that they find most useful and rewarding.
With an eye toward accessibility, we have also avoided advanced mathematical nota-tion. Most of the calculations in this book can be performed by hand, on the back of the proverbial envelope. More complex or intensive computations may require a spread-sheet. Nothing further should be needed.

Chapter 1 Introduction 13
Section Metric Section Metric
Table 1.2 Major Metrics List
Share of Hearts, Minds, and Markets2.1 Revenue Market Share2.1 Unit Market Share2.2 Relative Market Share2.3 Brand Development Index2.3 Category Development
Index2.4–2.6 Decomposition of Market
Share2.4 Market Penetration2.4 Brand Penetration2.4 Penetration Share2.5 Share of Requirements2.6 Usage Index2.7 Hierarchy of Effects2.7 Awareness2.7 Top of Mind2.7 Ad Awareness2.7 Knowledge2.7 Consumer Beliefs2.7 Purchase Intentions2.7 Purchase Habits2.7 Loyalty2.7 Likeability2.8 Willingness to Recommend2.8 Customer Satisfaction2.9 Net Promoter2.10 Willingness to Search 2.11 Neuro-Marketing
Margins and Profits3.1 Unit Margin3.1 Margin (%)
3.2 Channel Margins3.3 Average Price per Unit3.3 Price Per Statistical Unit3.4 Variable and Fixed Costs3.5 Marketing Spending3.6 Contribution per Unit3.6 Contribution Margin (%)3.6 Break-Even Sales3.7 Target Volume3.7 Target Revenues
Product and Portfolio Management4.1 Trial4.1 Repeat Volume4.1 Penetration4.1 Volume Projections4.2 Year-on-Year Growth4.2 Compound Annual Growth
Rate (CAGR)4.3 Cannibalization Rate4.3 Fair Share Draw Rate4.4 Brand Equity Metrics 4.5 Conjoint Utilities4.6 Segment Utilities4.7 Conjoint Utilities and
Volume Projections
Customer Profitability 5.1 Customers5.1 Recency5.1 Retention Rate5.2 Customer Profit5.3 Customer Lifetime Value5.4 Prospect Lifetime Value
Continues

14 MARKETING METRICS
5.5 Average Acquisition Cost5.5 Average Retention Cost
Sales Force and Channel Management6.1 Workload6.1 Sales Potential Forecast6.2 Sales Goal6.3 Sales Force Effectiveness6.4 Compensation 6.4 Break-Even Number of
Employees6.5 Sales Funnel, Sales Pipeline6.6 Numeric Distribution6.6 All Commodity Volume
(ACV)6.6 Product Category Volume
(PCV)6.6 Total Distribution6.6 Category Performance Ratio6.7 Out of Stock6.7 Inventories6.8 Markdowns6.8 Direct Product Profitability
(DPP)6.8 Gross Margin Return on
Inventory Investment (GMROII)
Pricing Strategy7.1 Price Premium7.2 Reservation Price7.2 Percent Good Value7.3 Price Elasticity of Demand
7.4 Optimal Price7.5 Residual Elasticity
Promotion8.1 Baseline Sales8.1 Incremental Sales/
Promotion Lift8.2 Redemption Rates8.2 Costs for Coupons and
Rebates8.2 Percentage Sales with
Coupon8.3 Percent Sales on Deal8.3 Pass-Through8.4 Price Waterfall
Advertising Metrics9.1 Impressions9.1 Gross Rating Points (GRPs)9.2 Cost per Thousand
Impressions (CPM)9.3 Net Reach9.3 Average Frequency9.4 Frequency Response
Functions9.5 Effective Reach9.5 Effective Frequency9.6 Share of Voice9.7 Advertising Elasticity of
Demand
Section Metric Section Metric
Table 1.2 Continued
Chapter 1 Introduction 15
Online, Email, and Mobile Metrics10.1 Pageviews10.2 Rich Media Display Time10.2 Rich Media Interaction Rate10.3 Clickthrough Rate10.4 Cost per Click10.4 Cost per Order10.4 Cost per Customer Acquired10.5 Visits10.5 Visitors10.5 Abandonment Rate10.6 Bounce Rate (Web site)10.7 Friends/Followers/ Supporters10.7 Likes10.7 Value of a Like10.8 Downloads10.9 Average Revenue per User10.10 Email Metrics
Marketing and Finance11.1 Net Profit11.1 Return on Sales (ROS)11.1 Earnings Before Interest, Taxes,
Depreciation, and Amortization (EBITDA)
11.2 Return on Investment (ROI)11.3 Economic Profit (aka EVA®)11.4 Payback11.4 Net Present Value (NPV)11.4 Internal Rate of Return (IRR)11.5 Marketing Return on Investment
(MROI)
Section Metric Section Metric
Table 1.2 Continued
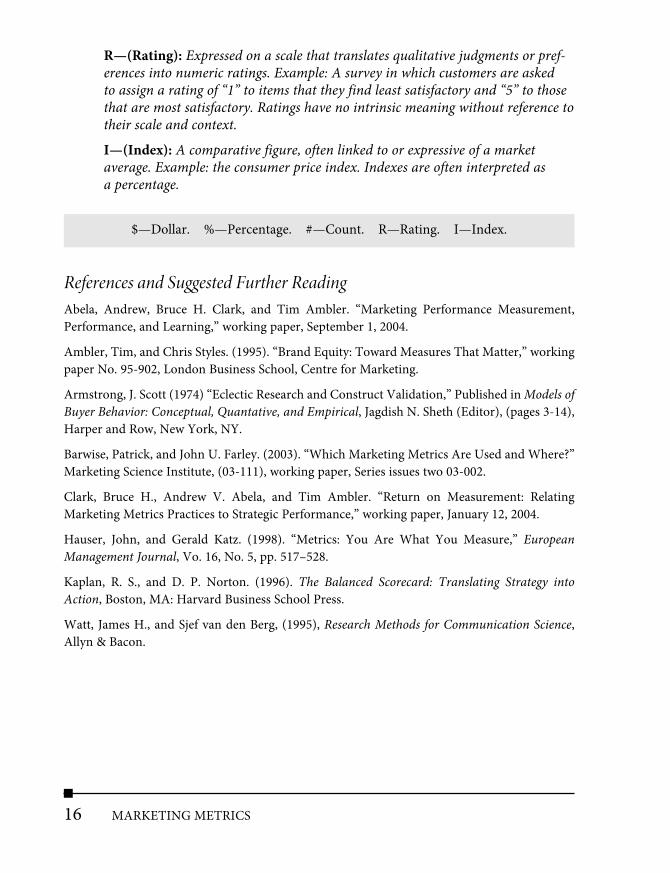
Reference MaterialsThroughout this text, we have highlighted formulas and definitions for easy refer-ence. We have also included outlines of key terms at the beginning of each chapter and section. Within each formula, we have followed this notation to define all inputs and outputs.
$—(Dollar Terms): A monetary value. We have used the dollar sign and “dol-lar terms” for brevity, but any other currency, including the euro, yen, dinar, or yuan, would be equally appropriate.
%—(Percentage): Used as the equivalent of fractions or decimals. For read-ability, we have intentionally omitted the step of multiplying decimals by 100 to obtain percentages.
#—(Count): Used for such measures as unit sales or number of competitors.
16 MARKETING METRICS
R—(Rating): Expressed on a scale that translates qualitative judgments or pref-erences into numeric ratings. Example: A survey in which customers are asked to assign a rating of “1” to items that they find least satisfactory and “5” to those that are most satisfactory. Ratings have no intrinsic meaning without reference to their scale and context.
I—(Index): A comparative figure, often linked to or expressive of a market average. Example: the consumer price index. Indexes are often interpreted asa percentage.
$—Dollar. %—Percentage. #—Count. R—Rating. I—Index.
References and Suggested Further ReadingAbela, Andrew, Bruce H. Clark, and Tim Ambler. “Marketing Performance Measurement, Performance, and Learning,” working paper, September 1, 2004.
Ambler, Tim, and Chris Styles. (1995). “Brand Equity: Toward Measures That Matter,” working paper No. 95-902, London Business School, Centre for Marketing.
Armstrong, J. Scott (1974) “Eclectic Research and Construct Validation,” Published in Models of Buyer Behavior: Conceptual, Quantative, and Empirical, Jagdish N. Sheth (Editor), (pages 3-14), Harper and Row, New York, NY.
Barwise, Patrick, and John U. Farley. (2003). “Which Marketing Metrics Are Used and Where?” Marketing Science Institute, (03-111), working paper, Series issues two 03-002.
Clark, Bruce H., Andrew V. Abela, and Tim Ambler. “Return on Measurement: Relating Marketing Metrics Practices to Strategic Performance,” working paper, January 12, 2004.
Hauser, John, and Gerald Katz. (1998). “Metrics: You Are What You Measure,” European Management Journal, Vo. 16, No. 5, pp. 517–528.
Kaplan, R. S., and D. P. Norton. (1996). The Balanced Scorecard: Translating Strategy into Action, Boston, MA: Harvard Business School Press.
Watt, James H., and Sjef van den Berg, (1995), Research Methods for Communication Science, Allyn & Bacon.

This page intentionally left blank

AAAU (awareness, attitudes, and usage), 43-47
limitations of, 47purpose of, 43
abandoning customers, 170abandonment rate, 347-351A/B testing, 396accepters, 35A.C. Nielsen, 212active users, 357ACV (all commodity volume), 208-214ad awareness, 45ad rank, 343advertising metrics, 295
AED, 319-323CPM, 304-305CPP (cost per point), 306Dorfman-Steiner Theorem, 322effective frequency, 316-317effective reach, 316-317exposures, 300-303frequency, 306-309frequency response functions, 311-314impressions, 300-303OTS, 300-303reach, 306-309share of voice, 318
AED (advertising elasticity of demand), 319-323
calculating, 320Dorfman-Steiner Theorem, 322
AMA (American Marketing Association), 5ANA (Association of National Advertisers), 5applications, downloads, 355-356applying neuroscience to marketing, 59ARPU (average revenue per use), 356ASN (Augmented Social Network), 354average acquisition cost, 180-181average frequency, 308average margin, 84-86average price per unit, 87-92
calculating, 89limitations of, 92price per statistical unit, 90-92purpose of, 88SKUs, 88
average retention cost, 180-181awareness, 45
Bbalancing workload, 192baseline sales, 272, 275-282BDI (brand development index), 30-31
calculating, 31purpose of, 30-31
bounce rate, 349-350Brand Asset Valuator tool, 141-142brand equity index, 140brand equity metrics, 137-146
Brand Asset Valuator tool, 141-142brand equity index, 140Brand Equity Ten, 139
429
INDEX

brand identity, 146brand valuation, 145-147conjoint analysis, 146purpose of, 137-138royalty rates, 143
Brand Equity Ten, 139brand penetration, calculating, 33brand valuation, 145-147BrandZ, 143breakage, 285break-even analysis, 103-107
break-even point, calculating, 104-107limitations of, 107payback period, 108purpose of, 104
break-even point, calculating, 104-107breaking down sales, 404buying power, 192
CCAGR (compound annual growth rate),
calculating, 127, 131calculating
abandonment rate, 347-351active users, 357ACV, 208-214AED, 320average acquisition cost, 181average price per unit, 89average retention cost, 181baseline sales, 276-281BDI, 31bounce rate, 350brand penetration, 33CAGR, 127, 131cannibalization rate, 132channel margins, 79-81clickthrough rate, 336CLV, 173conversion rate, 348
cost per click, 341cost per impression, 341cost per order, 341coupon redemption rate, 284CP, 166-168CPM, 305downloads, 355EBITDA, 367economic profit, 370-371effectiveness of sales force, 196-197effective reach, 316frequency response functions, 312-314future value, 130hits, 331impressions, 300margin on sales, 71-73market penetration, 33MROI, 377net profit, 366NPV, 376numeric distribution, 208optimal price, 246-253pageviews, 331pass-through, 287-288PCV, 210percentage margins, 72percent good value, 232-233PLV, 177price elasticity, 239-242price premium, 228-229price waterfall of a product, 290relative market share, 27repeat volume, 119reservation price, 232-233residual price elasticity, 260-262return on sales, 367revenue market share, 24rich media display time, 333-334rich media interaction time, 333-334ROI, 368
430 MARKETING METRICS

sales force compensation, 200sales goals, 194selling costs, 100-101session length, 357share of requirements, 36share of voice, 318sole usage percentage, 38target revenue, 109target volume, 109total cost, 93-96total distribution, 211total sales, 276-279unit margin, 72unit market share, 23usage index, 39-40visits, 347workload, 191-192year-on-year growth, 127
cannibalizationfair share draw, 135limitations of, 136-140weighted contribution margin, 134
cannibalization rate, 132-136carryover effect, 381category performance ratio, 211CDI (category development index), 31-32channel margins, 77-86
average margin, 84-86calculating, 79-81hybrid channel margins, 83limitations of, 83purpose of, 78
clickstreams, 346clickthrough rate, 336-338
cost per click, 339-343maximum cost per click, 343
cluster analysis, 153CLV (customer lifetime value), 9, 171-175
calculating, 173cohort and incubate approach, 172-176
infinite horizon assumption, 176present value, 172versus PLV, 177-179with initial margin, 175
cohort and incubate approach, 172-176cold leads, 204Common Language Project, 5comparing markup and margin, 75-77compensation, 199-201compensatory decision processes, 149compounding, 130concepts, 4conjoint analysis, 146-151
decision-making processes, 149-151limitations of, 151-153purpose of, 148segmentation
cluster analysis, 153limitations of, 154-156
volume projection, 155constant elasticity, 242-244constructs, 4consumer off-take, 219contribution analysis, 103-107conversion rate, 348cookies, 349copy tests, 397cost per click, 339-343cost per impression, 339-343cost per order, 339-343counting customers, 160-164coupon redemption rate, 283-284CP (customer profit)
calculating, 166-168limitations of, 169-171purpose of, 165
CPE (cost per engagement), 359CPM (cost per thousand impressions),
304-305CPP (cost per point), 306“cross” price elasticity, 258-260
Index 431

customersabandoning, 170average acquisition cost, 180-181average retention cost, 180-181CLV, 171-175
calculating, 173cohort and incubate approach, 172-176infinite horizon assumption, 176present value, 172with initial margin, 175
counting, 160-161, 163-164CP, 165-170defining, 163PLV
calculating, 177limitations of, 178-179
PLV (prospect lifetime value), 177-179recency, 162relationships, 164retention rate, 162-163segmentation, 152-154tiers, 166under-servicing, 191
customer satisfaction, 48-51limitations, 51purpose of, 49
Ddashboards, 391-393data, 5, 43decision-making processes, 149-151decomposition of market share, 34deductions, 218, 292defining customers, 163discounted trial, 126discounts, 291distribution metrics, 206-212
ACV, 208-214numeric distribution, 207-208PCV (product category volume), 210total distribution, 211
districts, 194diverted merchandise, 219Dorfman-Steiner Theorem, 322double jeopardy, 37, 40downloads, 355-356DPP (direct product profitability), 221-222Drucker, Peter, 67DuPont Model, 401-402durability, 140
EEBITDA (earnings before interest, taxes,
depreciation, and amortization), 367economic profit, 369-370EDA (electrodermal activity), 60EDLP (everyday low prices), 292EEG (electroencephalography), 57effective frequency, 316-317effective market share, 140effectiveness of sales force, 196-198effective reach, 316-317elasticity, 226, 319-323elimination-by-aspect decision making, 150email metrics, 358-360. See also mobile
metricsEMG (electromyography), 60engagement, 359-361estimating MROI, 380EVA (economic value added), 9, 369-370evaluating multi-period investments, 371-375
internal rate of return, 374NPV, 373payback, 372
ever-tried, 126evoked set, 127examples of neuro-marketing, 61expected lift, 400exposures, 300-303
frequency response functions, 311-314external overlap, 310eye tracking, 59-60
432 MARKETING METRICS
Ffacing, 212FACS (Facial Action Coding System), 58-59fair share draw, 135FIFO (first in, first out), 217financial metrics, 393fixed costs, 93-97, 102fMRI (functional magnetic resonance
imaging), 58forced trial, 126forecasting
sales, 194trial volume, 118
formulas, unit market share metric, 23frequency, 306-309
effective frequency, 316-317frequency response functions, 311-314friends, 352-353future value, calculating, 130
GGMROII (gross margin return on inventory
investment), 219goodwill, 138-139Google Analytics, 351gross margin, 77Gross model, 396-400growth, 127-130
CAGR, calculating, 131compounding, 130future value, calculating, 130percentage growth, 128same stores growth, 128-131
GRPs (gross rating points), 301GSR (Galvanic Skin Response), 60
HHerfindahl index, 29Hierarchy of Effects, 43-47HI-LO pricing, 292hits, 329-331hybrid channel margins, 83-86
IIAT (Implicit Association Test), 60identities, reasons for using, 413
diagnostic purposes, 405eliminating error, 406estimating metrics, 408
impressions, 296, 300-303, 329-331calculating, 300clickthrough rate, 336-338cost per impression, 339-343CPM, 304-305
increasing value of information, 6incremental sales, 272
calculating, 276infinite horizon assumption, 176information, 5, 393-394intentions, 46interactions, 335internal rate of return, 374inventory days, 216inventory turns, 215invoice price, 289
J-K-LKaplan, Robert, 167
learning curve response, 312-315LIFO (last in, first out), 217likeability, 48
Index 433

likes, 352-353limitations
of AAU, 47of average price per unit, 92of break-even analysis, 107of cannibalization metric, 136-140of channel margins, 83of conjoint analysis, 151-153of CP metric, 169-171of customer satisfaction metric, 51of margin of sales, 74-76of net promoter metric, 53of neuro-marketing, 62of penetration metric, 34of PLV, 178-179of price elasticity, 245of price premium, 231of revenue market share, 24of segmentation, 154-156of selling costs, 102of share of requirements metric, 37of supply chain metrics, 217-222of total cost, 97of unit market share, 24of willingness to recommend, 51of willingness to search metric, 56
linear demand, 234-237list price, 289logistics tracking, 213long-term effects of promotion, 282Lord Kelvin, 2loss aversion, 394
Mmail-in rebates, 285-289margin of sales, 413
calculating, 71-73gross margin, 77
limitations of, 74-76purpose of, 71versus markup, 75
markdown, 219market concentration, 26-29
purpose of, 26marketing metrics x-ray, 383-392marketing mix models, 408-412marketing spending, 99-102
calculating, 100-101purpose of, 99
market penetration, calculating, 33market share metrics, 18-21
BDI, 30-31market concentration, 26-29penetration, 32-34relative market share, 26-29revenue market share
calculating, 24purpose of, 23
share of requirements, 35-38calculating, 36limitations of, 37
unit market share, 23-24usage index, 39
market share rank, 30markup versus margin, 75-77“Marlboro Friday”, 391MASB (Marketing Accountability Standards
Board), 5mastering metrics, 7maximum cost per click, 343measurements, validating, 7MEROMI (media exposure return on
marketing investment), 381metrics
defined, 1mastering, 7“top ten”, 8
Microsoft Excel, NPV calculator, 376
434 MARKETING METRICS
misshipments, 218mobile metrics, 356-357modeling firm performance
DuPont Model, 401-402sales model, 403
MROI (marketing return on investment), 364, 376-380
MRP (maximum reservation price), 235MSI (Marketing Science Institute), 5multi-period investments, 371-375
internal rate of return, 374NPV, 373payback, 372
MWB (maximum willingness to buy), 236
Nnet out-of-stocks, 215net price, 289net profit, 366-367net promoter, 52-53net promoter metric, limitations of, 53net reach, 306-309neuro-marketing, 9
example of, 61limitations of, 62
neuroscience measures, 57applying to marketing problems, 59EEG, 57eye tracking, 59-60FACS (Facial Action Coding System), 58-59fMRI, 58purpose of, 60
non-compensatory decision processes, 149NOPAT (net operating profit after tax), 368NPV (net present value), 373numeric distribution, 207-208
Oobsolescence, 218online metrics, 9operational definitions, 4optimal price
calculating, 246-253linear demand functions, 249-252price discrimination, 254-256purpose of, 246relative to gross margin, 253
organization of this book, 10-15OTS (opportunities to see), 300-303outcomes per friend, 353out-of-stocks, 214“own” price elasticity, 258-260
PPageRank, 344pageviews, 329-331paid search marketing, 342pass-through, 286-287payback, 372payback period, 108PCV (product category volume), 210penetration, 32-34perceived quality/esteem, 46perceived value for money, 46percentage growth, 127-130percentage margins, calculating, 72percent good value, 232-237pipeline analysis, 202-205PLV (prospect lifetime value), 177-179
calculating, 177limitations of, 178-179
present value, 172price discrimination, 254-256, 292-294
Index 435

price elasticity, 238-244calculating, 239-242constant elasticity, 242-244limitations of, 245residual price elasticity, 258-267
price per statistical unit, 90-92price premium, 228-231
calculating, 228-229limitations of, 231purpose of, 228theoretical price premium, 232
price waterfall, 288-292calculating, 290purpose of, 289
pricing strategyoptimal price, 245-256
calculating, 246-253linear demand functions, 249-252price discrimination, 254-256purpose of, 246relative to gross margin, 253
percent good value, 232-237price elasticity, 238-244
calculating, 239-242constant elasticity, 242-244limitations of, 245
price premium, 230-231calculating, 228-229
purpose of, 228prisoner’s dilemma, 262-267reservation price, 232-237
calculating, 232-233linear demand, 234-237
residual price elasticity, 259calculating, 260purpose of, 258
theoretical price premium, 232primary line competitive injury, 257prisoner’s dilemma, 262-267
product strategieslifecycle, 131projected volume, repeat volume, 119
product strategy metrics, 112-113cannibalization
fair share draw, 135limitations of, 136-140weighted contribution margin, 134
cannibalization rate, 132-136trial volume, 116-118
profitability, 219-222CP, 165-170DPP, 221-222economic profit, 369-370EVA, 9GMROII, 219markdown, 219of promotions, 279-282shopping basket margin, 223, 223-224
projected volumerepeat volume, 119trial volume, 116-118
projection of sales, 116promotion, 272
baseline sales, 275-282coupon redemption rate, calculating, 284long-term effects of, 282mail-in rebates, 285-289pass-through, 286-287price waterfall, 288-292
calculating, 290purpose of, 289
profitability, 279-282redemption rate, 283-287total sales, calculating, 276-279
purchase intentions, 46purpose
of AAU, 43of average price per unit, 88of BDI, 30-31
436 MARKETING METRICS
of brand equity metrics, 137-138of break-even analysis, 104of channel margins, 78of conjoint analysis, 148of CP metric, 165of customer satisfaction metric, 49of margin on sales, 71of market concentration metric, 26of marketing spending, 99of net promoter metric, 52-53of neuro-marketing, 60of optimal price, 246of pipeline analysis, 202of price premium, 228of price waterfall, 289of relative market share metric, 26of residual price elasticity, 258of revenue market share, 23of segmentation, 153of selling costs, 99of target revenue, 108of target volume, 108of total cost, 93of unit market share, 23of willingness to recommend metric, 49of willingness to search metric, 55
push marketing, 185
Q-RQ Scores, 48quality scores, 398
rain checks, 218rate of return, 363reach, 306-309
effective reach, 316-317recency, 162redemption rate, 283-287
calculating, 284mail-in rebates, 285-289
relationships, 164relative market share, 26-29
calculating, 27purpose of, 26
relative perceived quality, 46relative price, 140, 228-231reliability, 6repeat rate, 38repeat volume, 119repurchase rate, 38resellers, 286-287reservation price, 232-237
calculating, 232-233linear demand, 234-237
residual income. See economic profitresidual price elasticity, 258-267
calculating, 260-262purpose of, 258
response latencies, 60retention rate, 162-163return on sales, 366-367revenue market share, 23-24
calculating, 24limitations of, 24purpose of, 23
rich media display time, 333-334rich media interaction time, 333-334risk aversion, 394ROA (return on assets), 368Robinson-Patman Act, 257ROI (return on investment), 368-369
MROI, 376-380ROIC (return on invested capital), 368ROIMI (return on incremental marketing
investment), 378RONA (return on net assets), 368royalty rates, 143
Index 437

438 MARKETING METRICS
social media metrics, 352-353sole usage percentage, 38supply chain metrics, 213-218
inventory days, 216inventory turns, 215limitations of, 217-222net out-of-stocks, 215out-of-stocks, 214service levels, 215
system of identities, reasons for usingdiagnostic purposes, 405eliminating error, 406estimating metrics, 408
Ttarget revenue, 108-109
calculating, 109purpose of, 108
target volume, 108-109calculating, 109purpose of, 108
Teixeira, Thales, 58-59territories, 190testing, 6, 395-399
A/B testing, 396copy tests, 397expected lift, 399-400Gross model, 396-400quality scores, 398
theoretical price premium, 232three firm concentration ratio, 28threshold response, 312-315tiers of customers, 166top of mind, 45“top ten” metrics, 8total cost, 93-97
calculating, 93-96limitations of, 97purpose of, 93
total distribution, 211total sales, calculating, 276-279
Ssales force metrics
compensation, 199-201effectiveness of personnel, 196-198pipeline analysis, 202-205sales goals, 193-194territories, 190
sales goals, 193-194calculating, 194
sales potential, 193same stores growth, 128-131SCR (Skin Conductance Response), 60S-curve, 409search engine optimization, 344search engines, 342secondary line competitive injury, 257segmentation, 152-154
cluster analysis, 153limitations of, 154-156purpose of, 153
selling costs, 99-102calculating, 100-101limitations of, 102purpose of, 99slotting allowances, 103
served markets, 25service levels, 215session length, 357setting sales goals, 193-194Shames, Erv, 390share of category, 30share of requirements, 35-38
calculating, 36limitations of, 37
share of shelf, 212share of voice, 318shopping basket margin, 223shopping carts, 347shrinkage, 218SKUs (stock keeping units), 88slotting allowances, 103

Index 439
willingness to search, 54limitations of, 56purpose of, 55
workload, 190calculating, 191-192
WTP (willingness to pay), 5
X-Y-Zyear-on-year growth, calculating, 127Young & Rubicam, 141
Zellner, Arnold, 409
tracking data, 43translating concepts into metrics, 4trial rate, 115trial volume, 116-118TRPs (target rating points), 301-304
Uunit margin, calculating, 72unit market share, 23-24
calculating, 23limitations, 24
usage, 46usage index, 41-42
and double jeopardy, 40calculating, 39-40
Vvalidating measurements, 7value of information, 5-7, 393-394variable costs, 93-97, 102verifying unit margin, 72version quality, assessing, 399video interactions, 335visitors, 345visits, 344-348
bounce rate, 349-350cookies, 348
volume projections, 115
Wwarm leads, 204wear-in, 315wear-out, 315weighted contribution margin, 134weight index, 39-42 “whale curves”, 167willingness to recommend, 48
limitations of, 51purpose of, 49-50